Embed Size (px)
Citation preview

BHP Billiton
Affival Nordic Cored Wire & Alloy Market Seminar
7 September 2006

Page 2
Manganese End Use MarketsManganese End Use Markets
Manganese Alloy IndustryManganese Alloy Industry
Manganese Ore IndustryManganese Ore Industry
Manganese Industry Overview
Crude SteelCrude Steel
BHP Billiton ManganeseBHP Billiton Manganese
Manganese Value System OverviewManganese Value System Overview

But First, a Little About BHP Billiton
Page 4
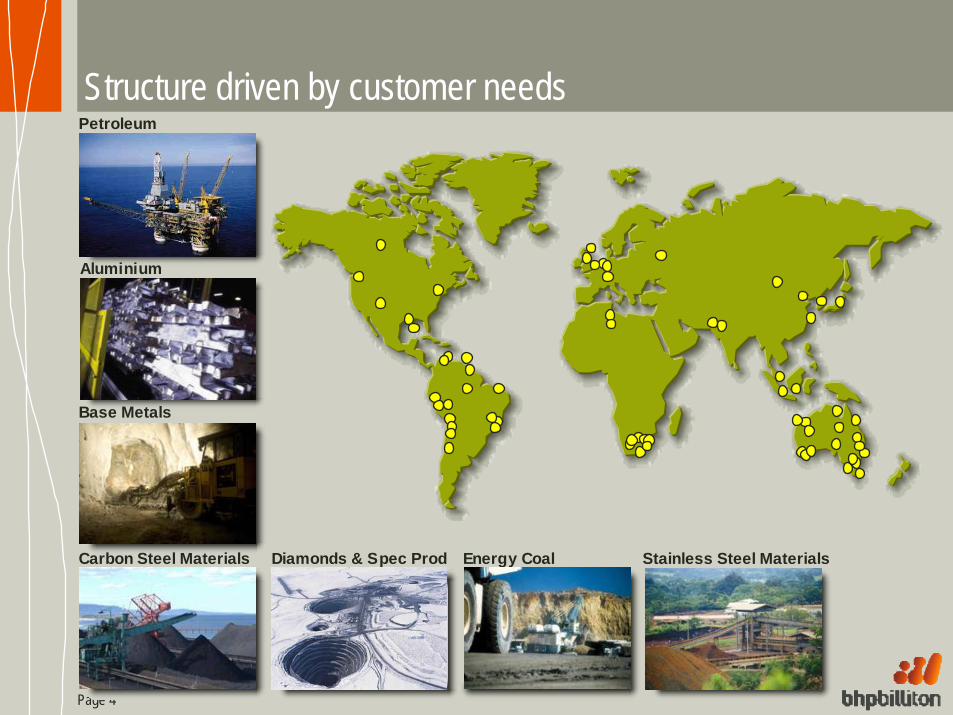
Structure driven by customer needsPetroleum
Aluminium
Base Metals
Carbon Steel Materials Diamonds & Spec Prod Energy Coal Stainless Steel Materials

Page 5
Strategic drivers
“Our core purpose is to create long-term value through the discovery, development and conversion of natural resources, and the provision of innovative customer and market-focused solutions.”
World Class Assets
The BHP Billiton Way(Value Added Processes)
People
‘Licence to Operate’
Financial Strength and Discipline
Project Pipeline
Growth Options

Page 6
As at 30 June 2006Size of bubble indicates proposed capital expenditure; bold outer border signifies sanctioned project..
$US 200M$US 200M
Deep inventory of growth projectsBROWNFIELD
GREENFIELD
Blackwater CPP
NeptuneNeptune
NWS T5NWS T5
StybarrowStybarrow
NWSAngelNWSAngel
Koala UGKoala UG
ZamzamaPhase 2
AtlantisNorth
Douglas –MiddelburgDouglas –
Middelburg
SpenceSpence
2009CY2007 2008 2010
AlumarAlumar
SamarcoSamarco
NickelPetroleumDiamonds
Energy CoalAlumina
Iron OreBase Metals
Met. CoalMn Ore
WA Iron OreRGP 4+
WA Iron OreRGP 4+
PyreneesPyrenees
BMA Phase 2
YabuluYabulu
WA Iron OreRGP 3
WA Iron OreRGP 3
RavensthorpeRavensthorpeAtlantis SouthAtlantis South
Worsley E&GWorsley E&G
MaruwaiMaruwai
GEMCO
ShenziShenzi

Manganese Industry Overview

Page 8
Manganese End Use MarketsManganese End Use Markets
Manganese Alloy IndustryManganese Alloy Industry
Manganese Ore IndustryManganese Ore Industry
Manganese Industry Overview
Crude SteelCrude Steel
BHP Billiton ManganeseBHP Billiton Manganese
Manganese Value System OverviewManganese Value System Overview

Page 9
The Manganese Value Chain• Mining
– Crushing and screening – (sizing, lumpy and fines)
– Dense Media Separation – (mineral from gangue)
– Sintering – (increase Mn unit value per ton)
– Reductive smelting (alloying) & casting – increase Mn unit value per ton further)
• Any one or more of these steps may be bypassed if the grade is high enough
• Logistics

Page 10
Manganese End Use MarketsManganese End Use Markets
Manganese Alloy IndustryManganese Alloy Industry
Manganese Ore IndustryManganese Ore Industry
Manganese Industry Overview
Crude SteelCrude Steel
BHP Billiton ManganeseBHP Billiton Manganese
Manganese Value System OverviewManganese Value System Overview

Page 11
Manganese End Use Markets
OreProducers
94%
6%
BulkAlloyingCapacity
SpecialtyProcessing
Crude Steel
Chemical and other uses of Mn metal
End Use Purpose
Source: Roskil l

Page 12
Effect of Mn on Steel Product Properties
Use of Manganese in steel results in increased:• Strength• Hardness• Toughness/impact resistance• Wear resistance (e.g. rail steels)• Machinability• Ability to be heat treated for superior strength and hardness

Page 13
Manganese End Use MarketsManganese End Use Markets
Manganese Alloy IndustryManganese Alloy Industry
Manganese Ore IndustryManganese Ore Industry
Manganese Industry Overview
Crude SteelCrude Steel
BHP Billiton ManganeseBHP Billiton Manganese
Manganese Value System OverviewManganese Value System Overview

Page 14
Global Steel Production Continues in New Golden AgeNew age of steel firmly established, parallels between post 1945 and post 1995
industrialization of China.
0
200
400
600
800
1000
1200
1920 1930 1940 1950 1960 1970 1980 1990 2000
The golden age
1945 – 1973 6.2%pa
Oil Shocks
Fall of Berlin Wall
The efficiency age
1974 – 1995 0.2%pa
The China age.
Followed by BRICS.
The emerging age
pre 1945 2.8%pa
New golden age
Source IISI, BHP Billiton
Millio
n Ton
nes

Page 15
Chinese Steel Import / Export
Data source: CMMA, BHP Billiton calculations
China Steel Imports and Exports
-1,000
0
1,000
2,000
3,000
4,000
5,000
1998 1999 2000 2001 2002 2003 2004 2005 2006
Kt
Net Flat Imports
Net Long ImportsNet Pipe Imports
Net Finished ImportsExports
Imports
Exports

Page 16
Steel and Raw Material Impact of Non-China Growth
New steel capacity plannedLarge importer (50Mtpa)Strong demand growthImported iron oreDomestic met coal
New steel capacity plannedLarge importer (50Mtpa)Strong demand growthImported iron oreDomestic met coal
SE Asia
Low cost steel producerMajor steel exporterDomestic steel demand increasingDomestic iron oreDomestic met coal
Low cost steel producerMajor steel exporterDomestic steel demand increasingDomestic iron oreDomestic met coal
Russia
Low steel per capita – 35kg50+ Mt capacity plannedConstruction/automotive/consumer growthDomestic iron oreImported met coal
Low steel per capita – 35kg50+ Mt capacity plannedConstruction/automotive/consumer growthDomestic iron oreImported met coal
India
In addition to China steel growth will be driven by other countries, with a majority favouring the BF route.
Low per capita steel consumptionLow cost steel production base, export semisDomestic iron oreImported met coal
Low per capita steel consumptionLow cost steel production base, export semisDomestic iron oreImported met coal
Brazil

Page 17
Steel Process Trends
BOF
EAFOH
0200400600800
100012001400
1998
1999
2000
2001 2002
2003
2004
2005
2006F
cst
(Mt)
• BOF maintaining share of total global steel production
• OH declining, being replaced by BOF, EAF
• EAF growing in industrialised countries.
• BOF primary growth in developing countries
OH8%
BOF58%
EAF34%
OH3%
BOF66%
EAF31%
2000 2006fSource CRU

Page 18
Manganese End Use MarketsManganese End Use Markets
Manganese Alloy IndustryManganese Alloy Industry
Manganese Ore IndustryManganese Ore Industry
Manganese Industry Overview
Crude SteelCrude Steel
BHP Billiton ManganeseBHP Billiton Manganese
Manganese Value System OverviewManganese Value System Overview

Page 19
Manganese Alloy Products
Produced from HCFeMn via OBC* route or SiMn via electrothermic route
80%-81%MCFeMn, LCFeMn
Refined
Can be produced from lower grade ore
60%-77%SiMnSilicomanganese
Requires high % of high grade ore
65%-79%HCFeMnFeMn
High Carbon Ferromanganese
CommentsProduced in BFProduced in EAF
%MnChemical Formula
* Oxygen Blown Converter

Page 20
SiMn57%
HCFeMn33%
MCFeMn10%
World Manganese Alloy Production 2005Product Split
Source: IMnI
~ 10.6 Million tons

Page 21 Source: IMnI , BHP Billiton
Europe
355 619203
0500
1000150020002500
Mt
World Manganese Alloy Production 2005~10.6 million tons
China
1420
279
2750
0500
1000150020002500
Mt
CIS
406
1250
400
5001000150020002500
Mt
Asia Other
541 284 1580
5001000150020002500
Mt
India
255 47720
0500
1000150020002500
Mt
Africa/MEast
370 177 1430
5001000150020002500
Mt
Americas
155 473 1810
5001000150020002500
Mt
HCFeMn
S iMn
Refined
0 500 1000 1500 2000

Page 22
Manganese Alloy Production
0
500
1000
1500
2000
2500
3000
3500
4000
4500
5000Ch
ina
Othe
r
Niko
pol
Eram
et
BHP
Billito
n
Priva
t
CVRD Ind
ia
Assm
ang
Kt
Source: IMnI & other industry sources

Page 23
Manganese Alloy Uses In Steel
Mainly used in Crude / Mild steel
Desulphurisation / strengthening
5-10kg Mn/mt steel
Consumed in the form of :
% % MnMnTons high grade ore / ton alloyTons high grade ore / ton alloyElectricity (kWh/Electricity (kWh/mtmt))
FeMnFeMn
78%78%2.12.1
2 6002 600
65%65%1.851.85
4 0004 000
80% 80% 2.52.5
3 1003 100
MCFeMnMCFeMn
Source: Roskil l, CRU
SiMnSiMn

Page 24
0%
20%
40%
60%
80%
100%
Integrated Minimill Flat Minimill Long Speciality
HCFeMn SiMn MCFeMn
Manganese Alloy Uses In Steel
12%
9%
56%
32%42%
49%
2%
81%
17%32%
30%
38%
Source: Monitor

Page 25
Manganese Alloy Supply/Demand
7,5198,188
9,115
10,671 10,777
7,388
8,210
9,179
10,735 10,554
0
2,000
4,000
6,000
8,000
10,000
12,000
2001 2002 2003 2004 2005
Demand Supply
Mn Alloy (Kt)
Source: IMnI
Strong growth in Mn alloy demand on the back of strong growth in crude steel production
Page 26
Impact of Crude Steel Industry Dynamics On Manganese UseThe steel industry is continually changing due to the impact of new technology, ongoing capacity rationalisation and shifts in customer demand.
Drivers that will impact on Manganese demand:Changes in steel making technologyType of steel making process being used ⇨ integrated steel plants Vs mini mills
New steel grade designs

Page 27
Manganese Alloy IndustryAlloy Production Cost Structure
Other Costs12%
Labour13%
Electricity20%
Ore 38%
Trade barriers
Tariffs
Anti-dumping duties
Social dimensions
Environmental costs
Socio-political factors
Other Raw Materials14%
Direct CostsDirect CostsDirect Costs Other CostsOther CostsOther Costs
While ore is the dominant cost component, processing costs which vary by location are also significant. The location of alloy plants relate directly to both electricity and labour costs.
Rail Costs3%
Average cost s tructureacross major alloyers
Source: CRU

Page 28
Comparative Electricity Prices
05
1015202530354045505560
Kaza
khst
an
Russ
ia
RSA
Norw
ay
Aust
ralia
USA
Ukra
ine
Polan
d
Mace
doni
a
Chin
a
Rom
ania
Japa
n
Mexic
o
SKor
ea
Indi
a
US mills/KWh
Source: CRU
1 mill = US$0.1/KWh

Page 29
$200
$400
$600
$800
$1,000
$1,200
$1,400
$1,600
$1,800
$2,000
Q1-9
5
Q4-9
5
Q3-9
6
Q2-9
7
Q1-9
8
Q4-9
8
Q3-9
9
Q2-0
0
Q1-0
1
Q4-0
1
Q3-0
2
Q2-0
3
Q1-0
4
Q4-0
4
Q3-0
5
Q2-0
6
HCFeMn SiMn
Manganese Alloy IndustryPricing Trends
Source: CRU
US Dealer Fob Warehouse $/t (Nominal)

Page 30
Manganese End Use MarketsManganese End Use Markets
Manganese Alloy IndustryManganese Alloy Industry
Manganese Ore IndustryManganese Ore Industry
Manganese Industry Overview
Crude SteelCrude Steel
BHP Billiton ManganeseBHP Billiton Manganese
Manganese Value System OverviewManganese Value System Overview

Page 31 Source: IMnI
India
Americas Africa/MEast
>30% and <44% Mn
< 30%Mn
> 44%Mn
- 1, 0001, 0003, 0005, 0007, 0009, 000
11, 00013, 000
2003 2004 200 5
Mt
World Manganese Ore Supply25.5 Mt ore In 2003 --> 29.8 Mt ore in 2004
- 1,0001,0003,0005,0007,0009,000
11,00013,000
2003 2 004 2 005
Mt
- 1,0001,0003,0005,0007,0009,000
11,00013,000
2003 2 004 2 005
Mt
China
CIS
- 1, 0001, 0003, 0005, 0007, 0009, 000
11, 00013, 000
2003 2004 200 5
Mt
Asia Other*
*Australia, Burma, Indonesia, Phillipppines, Taiwan, Vietnam, Korea
- 1, 0001, 0003, 0005, 0007, 0009, 000
11, 00013, 000
20 03 2004 200 5
Mt
02, 0004, 0006, 0008, 000
10, 00012, 000
2003 2004 200 5
Mt

Page 32
Manganese Ore Supply/Demand
7,389 7,687
8,637
10,784 10,749
7,881 8,1338,619
10,715
11,801
0
2,000
4,000
6,000
8,000
10,000
12,000
2001 2002 2003 2004 2005
Demand Supply
‘000 tons Mn contained
Source: IMnI

Page 33
$-
$0.50
$1.00
$1.50
$2.00
$2.50
$3.00
$3.50
$4.00
$4.50
72 76 80 84 88 92 96 '00 '04Japan FY
Manganese Ore Industry Price Trends
$/mtu (Fob, 48% Mn)
Source: Tex report

Page 34
Manganese End Use MarketsManganese End Use Markets
Manganese Alloy IndustryManganese Alloy Industry
Manganese Ore IndustryManganese Ore Industry
Manganese Industry Overview
Crude SteelCrude Steel
BHP Billiton ManganeseBHP Billiton Manganese
Manganese Value System OverviewManganese Value System Overview

Page 35
Management Structure
Samancor Ltd
BHP Billiton Anglo American
Samancor Manganese
Mines Alloys MMCVessels
Mamatwan
Gemco
Metalloys
Temco
Marketing

Page 36
HOTAZEL GEMCO 3.2Mtpa
TEMCOSiMn 120ktpaFeMn 130ktpaSinter 330ktpa
MetalloysFeMn 390ktpaSiMn 100ktpa
AdvalloyMC FeMn 75ktpa
Business OverviewSamancor Operations
Ore
Ferroalloy
Wessels 1MtpaMamatwan 2Mtpa

Page 37
Business OverviewSouth African Operations
HotazelJohannesburg
Saldanha BayPort Elizabeth
±. 900
km.
±. 1
0 50
k m.
AFRICA
RSA
Wessels Mine
Hotazel
Mamatwan Mine Kuruman
LEGENDTownsMinesPortsMn FieldRailway lines
Metalloys SmelterAdvalloy Smelter
Meyerton
HotazelDurban
.
.
+-700 km

Page 38
Business OverviewAustralian Operations
GROOTEEYLANDT
TEMCO

Page 39
Mn Resource base – June 2005
12.838.569.3Mamatwan(South Africa)
17.912.524.7Wessels(South Africa)
15.7103.5173.3GEMCO(Australia)
Reserve life (years)
JORC reserves (Mt)
JORC resources (Mt)
CSM Manganese deposits
LOM based on ROM tonnes: • GEMCO 6.6Mtpa, • Wessels (HG only) 0.7 Mtpa, • Mamatwan 3.0 Mtpa

Page 40
Metalloys / Advalloy Temco
82MVA SiMn (4F)2x75MVA FeMn1x81MVA FeMnMC Converter
Capacity390,000tpa FeMn100,000tpa SiMn75,000tpa MCFeMn
7 Furnaces
33MVA FeMn/SiMn36MVA FeMn/SiMn54MVA SiMn3x15MVA SiMn1000tpd Sinter Plant
Capacity130,000tpa FeMn120,000tpa SiMn330,000tpa Sinter
4 Furnaces
Metalloys / Advalloy
Temco

Page 41
In conclusion….
BHP Billiton via Samancor is:
A producer of High Grade Manganese Ore
An Integrated Alloyer ⇨ supplying the global market with high quality Manganese alloy products, such as MCFeMn, HCFeMn & SiMn over the long term
Backed by long life reserves providing a sustainable future