Embed Size (px)
Citation preview
8/3/2019 0602_paper_code_602
http://slidepdf.com/reader/full/0602papercode602 1/10
2nd
Mercosur Congress on Chemical Engineering
4th
Mercosur Congress on Process Systems Engineering
1
STEADY STATE ANALYSIS OF A FALLING FILM REACTOR
Daniela K. Cesari, Susana Schbib, Daniel O. Borio1
Department of Chemical Engineering – PLAPIQUI (UNS-CONICET)
Abstract. The steady-state simulation of an ammonium carbamate decomposer (stripper) is presented. This
falling-film reactor is usually located in the high-pressure section of industrial urea plants in order to
concentrate the urea solution leaving the synthesis reactor.
The stripper consists in a bundle of small diameter tubes installed in a heating shell. The aqueous urea
solution (also containing ammonium carbamate, NH3, CO2 and inerts) is fed to the top of the stripper and
flows by gravity effects as a thin film on the internal wall of the tubes. The ammonium carbamate is
decomposed through the endothermic reaction:2342 CO NH 2 NH COO NH +⇔+ +− , at around 200 ºC and
150 atm. The energy for the reaction and the evaporation of the volatile components is supplied by means of
saturated steam (shell side). The stripped gas (containing NH3, CO2, H2O and N2) is collected in the central
section of the tubes and flows upwards countercurrently with the urea solution. The gas leaves the stripper by
the top to be recycled to the urea synthesis section. The concentrated urea solution is sent to the medium pressure section of the plant for further purification.
The countercurrent gas-liquid flow is represented as a series of stages with perfect mixing for both phases.
The ø-ø method is used as thermodynamic model to describe the phase equilibrium. The mass transfer
limitations (assumed to be concentrated in the gas film) are represented by the Maxwell-Stefan equations.
The mass and energy balances for both phases, the equilibrium equations and the flows through the gas-liquid
interface for the multicomponent system are considered for all the stages.
The influence of the main operating variables on the stripper performance is studied. The model predicts
stripped gas flowrates, outlet compositions and temperatures values in agreement with those found in a large
scale stripper.
Keywords: urea plants, ammonium carbamate, falling-film reactors, modeling.
1. Introduction
Urea (NH2CONH2) is produced industrially by synthesis from liquid ammonia and gaseous carbon dioxide at
about 160 atm and 200 ºC, being the NH3/CO2 molar ratio of at the reactor inlet about 3.3 to 3.6. There are two
different types of processes to produce urea in industry. These processes are called as partial recycle and total
recycle of the nonconverted reactants. The most common technologies are from Snamprogetti and Stamicarbon
(Dente et al., 1988). In the present work a plant with total recycle and Snamprogetti Technology is considered.
The global process includes three sections: high, medium and low-pressure.
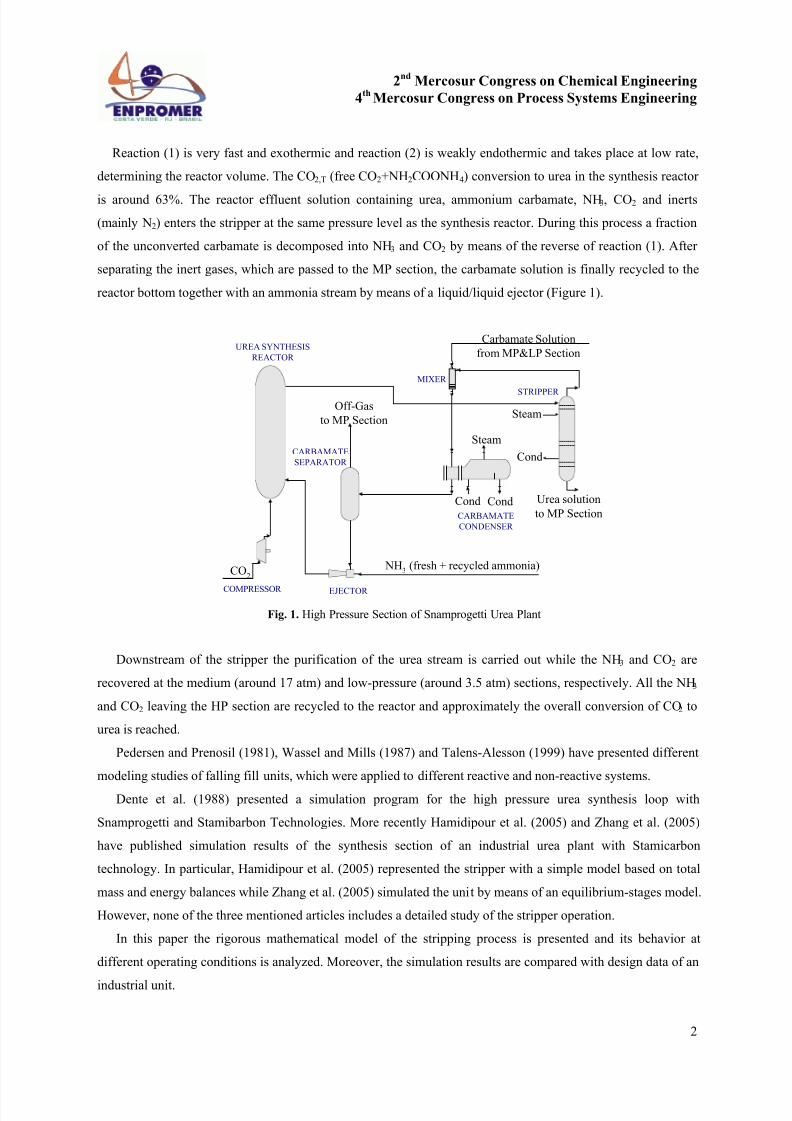
The high-pressure section (see Figure 1) involves four main units: the gas synthesis reactor, the stripper, the
carbamate condenser and the carbamate separator (UNIDO and IFDC, 1979).
Two reactions occur in the liquid phase of the urea synthesis reactor:
+− +⇔+ 4223 NH COO NH CO NH 2 ∆H = -84 kJ/kmol (1)
O H CONH NH NH COO NH 22242 +⇔+ +− ∆H = 23 kJ/kmol (2)
1 To whom all correspondence should be addressed.
Address: PLAPIQUI (UNS-CONICET), Camino La Carrindanga, km 7, 8000 Bahía Blanca, ArgentinaE-mail: [email protected]
8/3/2019 0602_paper_code_602
http://slidepdf.com/reader/full/0602papercode602 2/10
2nd
Mercosur Congress on Chemical Engineering
4th
Mercosur Congress on Process Systems Engineering
2
Reaction (1) is very fast and exothermic and reaction (2) is weakly endothermic and takes place at low rate,
determining the reactor volume. The CO2,T (free CO2+NH2COONH4) conversion to urea in the synthesis reactor
is around 63%. The reactor effluent solution containing urea, ammonium carbamate, NH3, CO2 and inerts
(mainly N2) enters the stripper at the same pressure level as the synthesis reactor. During this process a fraction
of the unconverted carbamate is decomposed into NH3 and CO2 by means of the reverse of reaction (1). After
separating the inert gases, which are passed to the MP section, the carbamate solution is finally recycled to the
reactor bottom together with an ammonia stream by means of a liquid/liquid ejector (Figure 1).
CARBAMATE
SEPARATOR
NH3
(fresh + recycled ammonia)CO2
UREA SYNTHESIS
REACTOR
CARBAMATE
CONDENSER
Urea solution
to MP Section
STRIPPER
MIXER
Off-Gas
to MP Section
Carbamate Solution
from MP&LP Section
Steam
Cond Cond
Steam
Cond
EJECTOR COMPRESSOR
Fig. 1. High Pressure Section of Snamprogetti Urea Plant
Downstream of the stripper the purification of the urea stream is carried out while the NH3 and CO2 are
recovered at the medium (around 17 atm) and low-pressure (around 3.5 atm) sections, respectively. All the NH3
and CO2 leaving the HP section are recycled to the reactor and approximately the overall conversion of CO2 to
urea is reached.
Pedersen and Prenosil (1981), Wassel and Mills (1987) and Talens-Alesson (1999) have presented different
modeling studies of falling fill units, which were applied to different reactive and non-reactive systems.
Dente et al. (1988) presented a simulation program for the high pressure urea synthesis loop with
Snamprogetti and Stamibarbon Technologies. More recently Hamidipour et al. (2005) and Zhang et al. (2005)
have published simulation results of the synthesis section of an industrial urea plant with Stamicarbon
technology. In particular, Hamidipour et al. (2005) represented the stripper with a simple model based on total
mass and energy balances while Zhang et al. (2005) simulated the unit by means of an equilibrium-stages model.
However, none of the three mentioned articles includes a detailed study of the stripper operation.
In this paper the rigorous mathematical model of the stripping process is presented and its behavior at
different operating conditions is analyzed. Moreover, the simulation results are compared with design data of an
industrial unit.

8/3/2019 0602_paper_code_602
http://slidepdf.com/reader/full/0602papercode602 3/10
2nd
Mercosur Congress on Chemical Engineering
4th
Mercosur Congress on Process Systems Engineering
3
2. Stripper description
The stripper consists in a bundle of small diameter tubes (d t =0.8”) installed in a heating shell. A scheme of
this process is shown in Figure 2a. The aqueous urea solution is fed to the top of the stripper. The liquid is
distributed on the heating surface as a film and flows to the bottom by gravity. In practice it is a vertical shell
and tube heat exchanger, with the heating medium on the shell side (Figure 2b). As the liquids film flows, it is
heated and decomposition of carbamate and surface evaporation occur. The vapors formed (essentially ammonia
and carbon dioxide) are removed by flowing to the top of the tube. The carbamate decomposition heat is
supplied by means of condensing steam (saturated).
Fig. 2. a) Amonium Carbamate Decomposer, b) view of cross section tube
3. Mathematical Model
3.1 Hypothesis
The mathematical model of the ammonium carbamate decomposer is based on the following assumptions:
- Steady state conditions.
- Isobaric operation.
- The tube side of the stripper is represented as stages in series. At each stage complete mixing for both phases is assumed.
- At all the axial positions, the difference between the gas and liquid temperature is neglected.
- The gas and liquid phases coexist in the ammonium carbamate decomposer. The reaction takes place only in
the liquid phase. Chemical equilibrium is assumed.
- Urea and ammonium carbamate are considered non- volatile components.
- The mass transfer resistance is concentrated in the gas phase (Pedersen and Prenosil, 1981, Dente et al.,
1988).
Condensed
Urea solution
from the reactor
NH3, CO2, H2O, N2
Steam
Urea solution to MP Section
2a)
Liquid
Gas
Liquid
Heat
Gas
2b)
8/3/2019 0602_paper_code_602
http://slidepdf.com/reader/full/0602papercode602 4/10
2nd
Mercosur Congress on Chemical Engineering
4th
Mercosur Congress on Process Systems Engineering
4
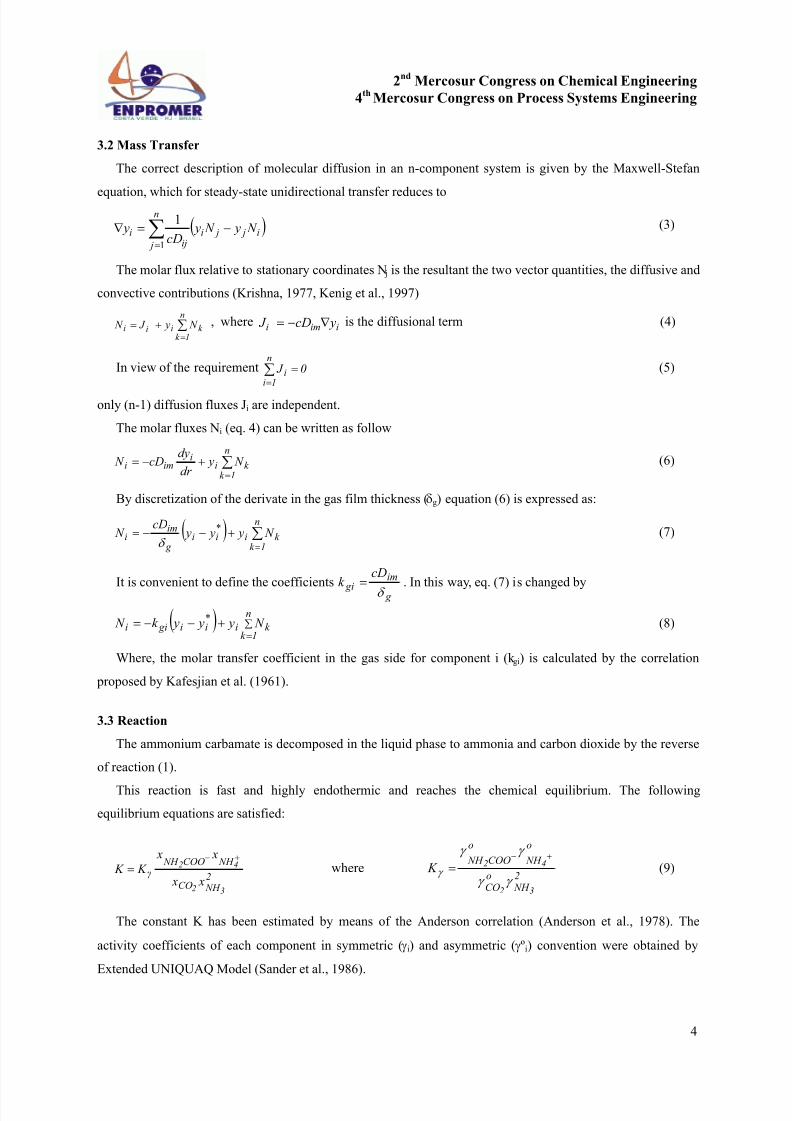
3.2 Mass Transfer
The correct description of molecular diffusion in an n-component system is given by the Maxwell-Stefan
equation, which for steady-state unidirectional transfer reduces to
( )i j ji
n
j iji N y N y
cD y −=∇ ∑
=1
1 (3)
The molar flux relative to stationary coordinates N j is the resultant the two vector quantities, the diffusive and
convective contributions (Krishna, 1977, Kenig et al., 1997)
∑=
+=n
1k k iii N y J N , where iimi ycD J ∇−= is the diffusional term (4)
In view of the requirement 0 J n
1ii =∑
=
(5)
only (n-1) diffusion fluxes Ji are independent.
The molar fluxes Ni (eq. 4) can be written as follow
∑=
+−=n
1k k i
iimi N y
dr
dycD N (6)
By discretization of the derivate in the gas film thickness (δg) equation (6) is expressed as:
( ) ∑=
+−−=n
1k k i
*ii
g
imi N y y y
cD N
δ (7)
It is convenient to define the coefficients g
im
gi
cDk
δ = . In this way, eq. (7) is changed by
( ) ∑=
+−−=n
1k k i
*ii gii N y y yk N (8)
Where, the molar transfer coefficient in the gas side for component i (k gi) is calculated by the correlation
proposed by Kafesjian et al. (1961).
3.3 Reaction
The ammonium carbamate is decomposed in the liquid phase to ammonia and carbon dioxide by the reverse
of reaction (1).
This reaction is fast and highly endothermic and reaches the chemical equilibrium. The following
equilibrium equations are satisfied:
2 NH CO
NH COO NH γ
32
42
x x
x x
K K +−
= where2
NH oCO
o
NH
o
COO NH
32
42 K γ γ
γ γ
γ
+−
= (9)
The constant K has been estimated by means of the Anderson correlation (Anderson et al., 1978). The
activity coefficients of each component in symmetric ( γi) and asymmetric ( γºi) convention were obtained by
Extended UNIQUAQ Model (Sander et al., 1986).

8/3/2019 0602_paper_code_602
http://slidepdf.com/reader/full/0602papercode602 5/10
2nd
Mercosur Congress on Chemical Engineering
4th
Mercosur Congress on Process Systems Engineering
5
3.4 Thermodynamic Model
The use of the same equation of state to describe both phases, referred as ø-ø method, has been proposed by
Sandler (1997) as convenient to describe the equilibrium of a solution near the critical region.In the present work the ø-ø method is adopted and the Peng- Robinson equation of state (PR EOS) is used to
represent both phases. The binary interaction parameters (kij) in PR EOS were adjusted using vapor- liquid
equilibrium data at high-pressure conditions (Wichterle et al., 1973; Knapp et al., 1982).
The isofugacity conditions for the components are the following:
l ii
vi
*i x y φ φ = , for 2232 N ,O H , NH ,COi = (10)
3.5 Simulation of the stripper
The stripper is represented by Ns equilibrium stages with countercurrent flow (Figure 3). The number of
stages is adopted by solving the model successively with higher Ns values until the solution does no change
significantly. A total number of ten stages is adopted (Ns=10).
Fig. 3. Scheme of a stage for the stripper
For each stage, the conservation equations are the following:
Molar Balances
Liquid phase
A N xl F xl F iiei
ei −+= α λ (11)
2223 N and carbamateammonium ,urea ,O H ,CO , NH i =
Gas phase
A N y Fg y Fg iei
ei += (12)
2232 ,,, N O H NH COi =
Total Mass Balance
0Mg Fg Ml l F Mg Fg Ml l F eeee =−−+ (13)
Energy Balance
( ) 0 )T Ts( AU H Hv A N )T T ( cp Fl )T T ( cp Fg r
n
iii
en
il
en
i
e g
e =−+−+∑−−∑−∑ − ∆α ∆ (14)
The subscripts g and l represent the gas and liquid phase respectively.
Ni
Fle, xle, T
e
Stage (k+1)
Fl, xi, T
Fg, yi, Te
Fge, yie, T
Stage k
Stage (k-1)
8/3/2019 0602_paper_code_602
http://slidepdf.com/reader/full/0602papercode602 6/10
2nd
Mercosur Congress on Chemical Engineering
4th
Mercosur Congress on Process Systems Engineering
6
0.0 0.2 0.4 0.6 0.8 1.03.00
3.15
3.30
3.45
3.60
3.75
3.90
BottomTop z*
F l ( k m o l / s )
0.0
0.2
0.4
0.6
0.8
1.0
1.2
F g ( k m ol / s
)
Boundary Conditions
Top: 0* z = : 0T T = , 0 Fl Fl = , 0ii x x = , for 2232 N ,O H ,urea ,Carb , NH ,COi = (15)
Bottom: 1* = : 0 Fg = , 0 yi = , for 2232 N ,O H , NH ,COi = (16)
Equations 8 to 16 are applied to 6 components and 10 stages resulting in a set of 150 simultaneous non-linear
algebraic equations, which are solved by a Quasi Newton method.
4. Results and Discussion
4.1 Base case
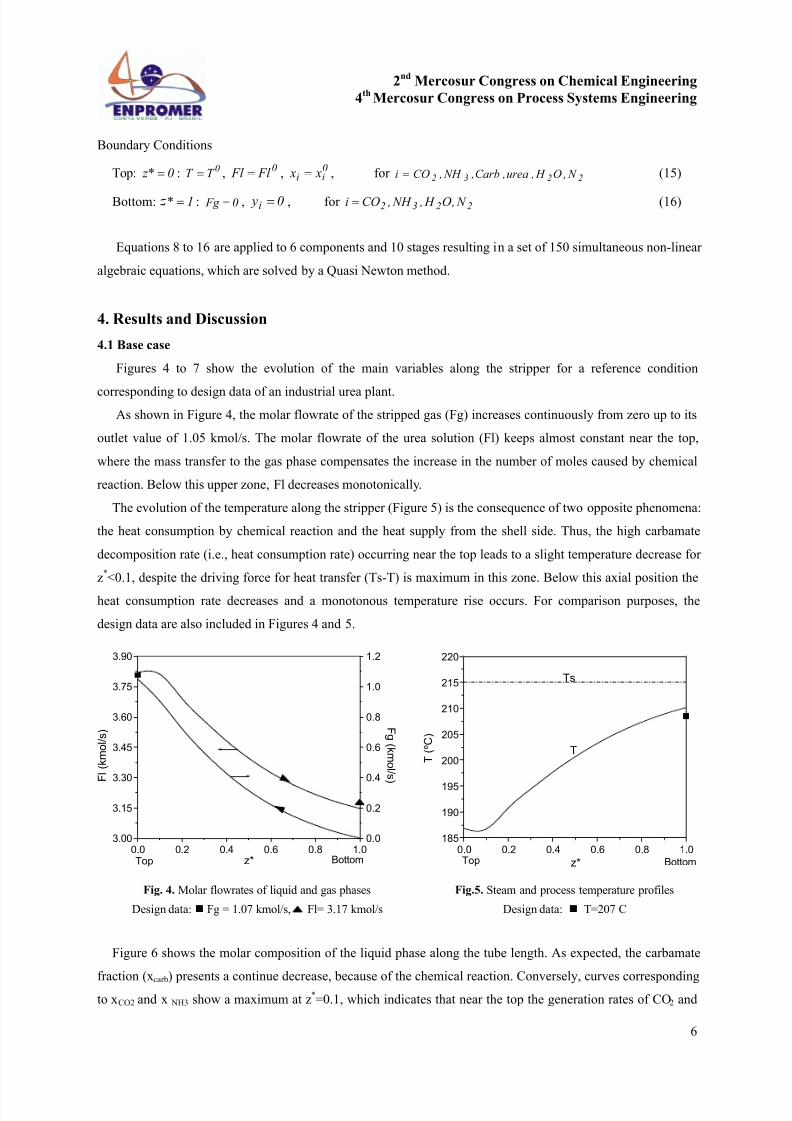
Figures 4 to 7 show the evolution of the main variables along the stripper for a reference condition
corresponding to design data of an industrial urea plant.
As shown in Figure 4, the molar flowrate of the stripped gas (Fg) increases continuously from zero up to its
outlet value of 1.05 kmol/s. The molar flowrate of the urea solution (Fl) keeps almost constant near the top,
where the mass transfer to the gas phase compensates the increase in the number of moles caused by chemical
reaction. Below this upper zone, Fl decreases monotonically.
The evolution of the temperature along the stripper (Figure 5) is the consequence of two opposite phenomena:
the heat consumption by chemical reaction and the heat supply from the shell side. Thus, the high carbamate
decomposition rate (i.e., heat consumption rate) occurring near the top leads to a slight temperature decrease for
z*<0.1, despite the driving force for heat transfer (Ts-T) is maximum in this zone. Below this axial position the
heat consumption rate decreases and a monotonous temperature rise occurs. For comparison purposes, the
design data are also included in Figures 4 and 5.
Fig. 4. Molar flowrates of liquid and gas phases
Design data: Fg = 1.07 kmol/s, Fl= 3.17 kmol/s
Fig.5. Steam and process temperature profiles
Design data: T=207 C
Figure 6 shows the molar composition of the liquid phase along the tube length. As expected, the carbamate
fraction (xcarb) presents a continue decrease, because of the chemical reaction. Conversely, curves correspondingto xCO2 and x NH3 show a maximum at z*=0.1, which indicates that near the top the generation rates of CO2 and
0.0 0.2 0.4 0.6 0.8 1.0185
190
195
200
205
210
215
220
T
Ts
BottomTop
T ( º C )
z*
8/3/2019 0602_paper_code_602
http://slidepdf.com/reader/full/0602papercode602 7/10
2nd
Mercosur Congress on Chemical Engineering
4th
Mercosur Congress on Process Systems Engineering
7
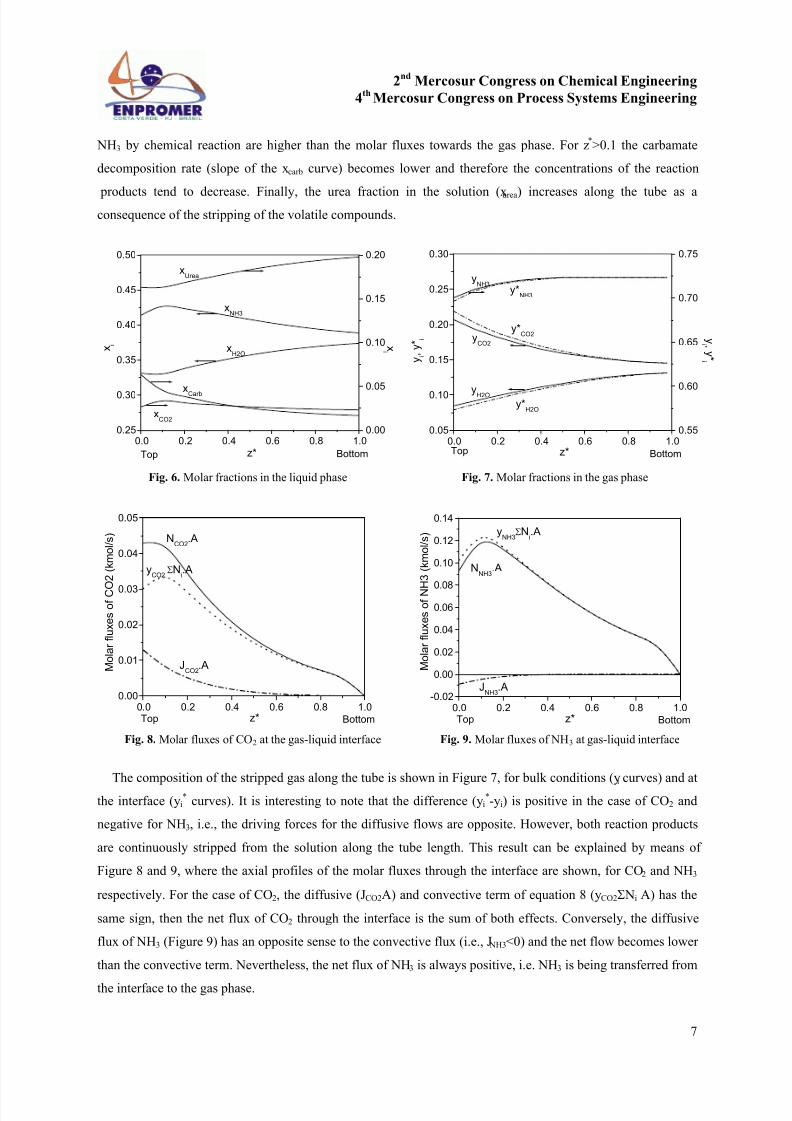
NH3 by chemical reaction are higher than the molar fluxes towards the gas phase. For z*>0.1 the carbamate
decomposition rate (slope of the xcarb curve) becomes lower and therefore the concentrations of the reaction
products tend to decrease. Finally, the urea fraction in the solution (xurea) increases along the tube as aconsequence of the stripping of the volatile compounds.
Fig. 6. Molar fractions in the liquid phase Fig. 7. Molar fractions in the gas phase
Fig. 8. Molar fluxes of CO2 at the gas-liquid interface Fig. 9. Molar fluxes of NH3 at gas-liquid interface
The composition of the stripped gas along the tube is shown in Figure 7, for bulk conditions (yi curves) and at
the interface (yi* curves). It is interesting to note that the difference (y i
*-yi) is positive in the case of CO2 and
negative for NH3, i.e., the driving forces for the diffusive flows are opposite. However, both reaction products
are continuously stripped from the solution along the tube length. This result can be explained by means of
Figure 8 and 9, where the axial profiles of the molar fluxes through the interface are shown, for CO 2 and NH3
respectively. For the case of CO2, the diffusive (JCO2A) and convective term of equation 8 (yCO2Σ Ni A) has the
same sign, then the net flux of CO2 through the interface is the sum of both effects. Conversely, the diffusive
flux of NH3 (Figure 9) has an opposite sense to the convective flux (i.e., J NH3<0) and the net flow becomes lower
than the convective term. Nevertheless, the net flux of NH3 is always positive, i.e. NH3 is being transferred from
the interface to the gas phase.
0.0 0.2 0.4 0.6 0.8 1.00.00
0.01
0.02
0.03
0.04
0.05
yCO2.
ΣNi.A
JCO2
.A
NCO2
.A
BottomTop
M o l a r f l u x e s o f C O
2 ( k m o l / s )
z*
0.0 0.2 0.4 0.6 0.8 1.00.25
0.30
0.35
0.40
0.45
0.50
z*
x i
0.00
0.05
0.10
0.15
0.20
xCarb
xUrea
xH2O
xCO2
xNH3
BottomTop
x i
0.0 0.2 0.4 0.6 0.8 1.0-0.02
0.00
0.02
0.04
0.06
0.08
0.10
0.12
0.14
yNH3
ΣNi.A
JNH3
.A
NNH3
.A
BottomTop
M o l a r f l u x e s o f N H 3 ( k m o l / s )
z*
0.0 0.2 0.4 0.6 0.8 1.00.05
0.10
0.15
0.20
0.25
0.30
yH2O
yCO2
yNH3
y*NH3
y*CO2
y*H2O
BottomTop z*
y i , y *
i
0.55
0.60
0.65
0.70
0.75
y i , y *
i
8/3/2019 0602_paper_code_602
http://slidepdf.com/reader/full/0602papercode602 8/10
2nd
Mercosur Congress on Chemical Engineering
4th
Mercosur Congress on Process Systems Engineering
8
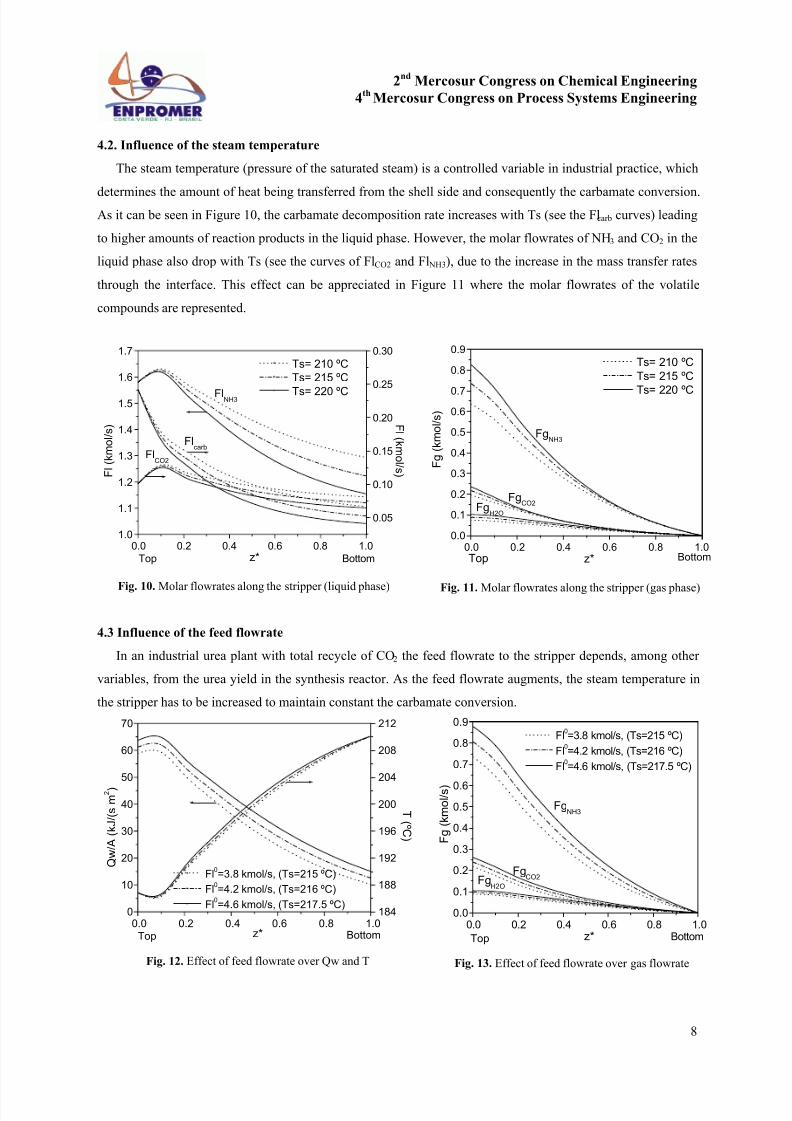
4.2. Influence of the steam temperature
The steam temperature (pressure of the saturated steam) is a controlled variable in industrial practice, which
determines the amount of heat being transferred from the shell side and consequently the carbamate conversion.As it can be seen in Figure 10, the carbamate decomposition rate increases with Ts (see the Flcarb curves) leading
to higher amounts of reaction products in the liquid phase. However, the molar flowrates of NH 3 and CO2 in the
liquid phase also drop with Ts (see the curves of FlCO2 and Fl NH3), due to the increase in the mass transfer rates
through the interface. This effect can be appreciated in Figure 11 where the molar flowrates of the volatile
compounds are represented.
0.0 0.2 0.4 0.6 0.8 1.01.0
1.1
1.2
1.3
1.4
1.5
1.6
1.7
BottomTop z*
F l ( k m o l / s )
0.05
0.10
0.15
0.20
0.25
0.30
Flcarb
FlCO2
FlNH3
Ts= 210 ºC
Ts= 215 ºC
Ts= 220 ºC
F l ( k m ol / s )
Fig. 10. Molar flowrates along the stripper (liquid phase)
0.0 0.2 0.4 0.6 0.8 1.00.0
0.1
0.2
0.3
0.4
0.5
0.6
0.7
0.8
0.9
FgH2O
FgCO2
FgNH3
Ts= 210 ºC
Ts= 215 ºC
Ts= 220 ºC
BottomTop
F g ( k m o l / s )
z*
Fig. 11. Molar flowrates along the stripper (gas phase)
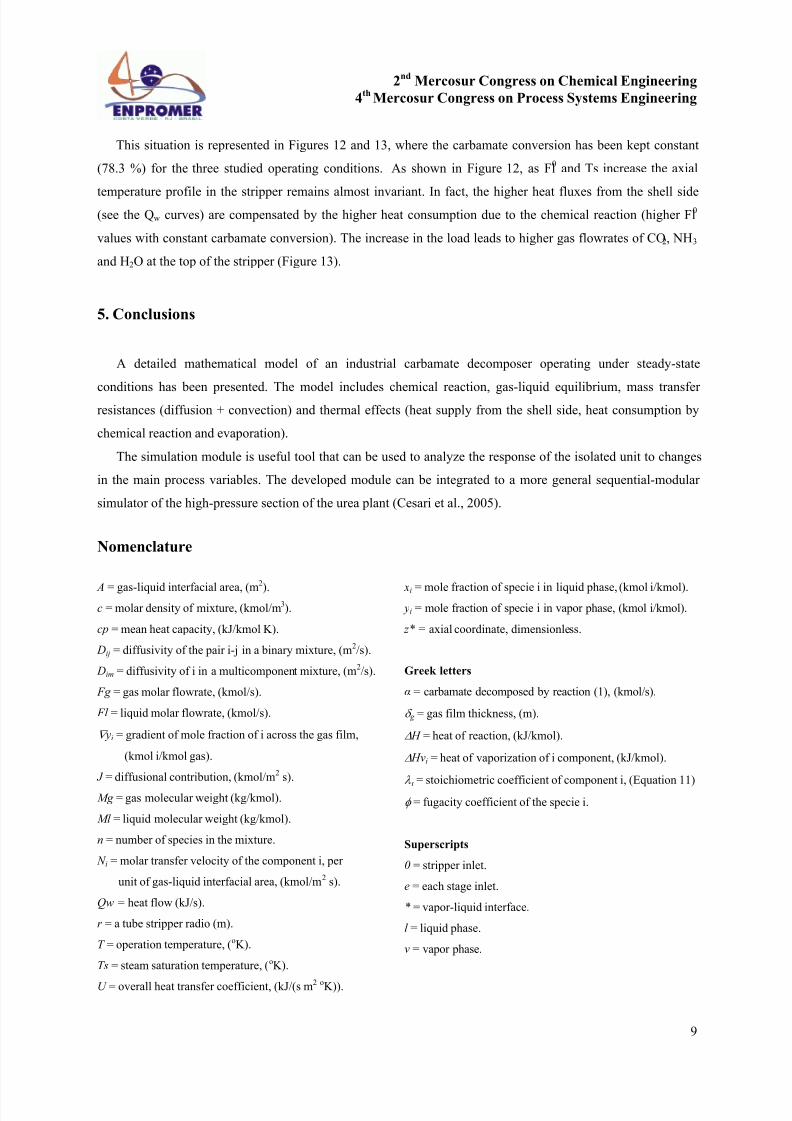
4.3 Influence of the feed flowrate
In an industrial urea plant with total recycle of CO2 the feed flowrate to the stripper depends, among other
variables, from the urea yield in the synthesis reactor. As the feed flowrate augments, the steam temperature in
the stripper has to be increased to maintain constant the carbamate conversion.
0.0 0.2 0.4 0.6 0.8 1.00
10
20
30
40
50
60
70
z*
Q w / A ( k J / ( s m
2 )
184
188
192
196
200
204
208
212
Fl0=3.8 kmol/s, (Ts=215 ºC)
Fl0=4.2 kmol/s, (Ts=216 ºC)
Fl0=4.6 kmol/s, (Ts=217.5 ºC)
BottomTop
T ( º C )
Fig. 12. Effect of feed flowrate over Qw and T
0.0 0.2 0.4 0.6 0.8 1.00.0
0.1
0.2
0.3
0.4
0.5
0.6
0.7
0.8
0.9
FgH2O
FgCO2
FgNH3
Fl0=3.8 kmol/s, (Ts=215 ºC)
Fl0=4.2 kmol/s, (Ts=216 ºC)
Fl0=4.6 kmol/s, (Ts=217.5 ºC)
BottomTop
F g ( k m o l / s )
z*
Fig. 13. Effect of feed flowrate over gas flowrate
8/3/2019 0602_paper_code_602
http://slidepdf.com/reader/full/0602papercode602 9/10
2nd
Mercosur Congress on Chemical Engineering
4th
Mercosur Congress on Process Systems Engineering
9
This situation is represented in Figures 12 and 13, where the carbamate conversion has been kept constant
(78.3 %) for the three studied operating conditions. As shown in Figure 12, as Fl0
and Ts increase the axial
temperature profile in the stripper remains almost invariant. In fact, the higher heat fluxes from the shell side(see the Qw curves) are compensated by the higher heat consumption due to the chemical reaction (higher Fl0
values with constant carbamate conversion). The increase in the load leads to higher gas flowrates of CO2, NH3
and H2O at the top of the stripper (Figure 13).
5. Conclusions
A detailed mathematical model of an industrial carbamate decomposer operating under steady-state
conditions has been presented. The model includes chemical reaction, gas-liquid equilibrium, mass transfer resistances (diffusion + convection) and thermal effects (heat supply from the shell side, heat consumption by
chemical reaction and evaporation).
The simulation module is useful tool that can be used to analyze the response of the isolated unit to changes
in the main process variables. The developed module can be integrated to a more general sequential-modular
simulator of the high-pressure section of the urea plant (Cesari et al., 2005).
Nomenclature
A = gas-liquid interfacial area, (m2
).
c = molar density of mixture, (kmol/m3).
cp = mean heat capacity, (kJ/kmol K).
Dij = diffusivity of the pair i-j in a binary mixture, (m2/s).
Dim = diffusivity of i in a multicomponent mixture, (m2/s).
Fg = gas molar flowrate, (kmol/s).
Fl = liquid molar flowrate, (kmol/s).
∇ yi = gradient of mole fraction of i across the gas film,
(kmol i/kmol gas).
J = diffusional contribution, (kmol/m2 s).
Mg = gas molecular weight (kg/kmol).
Ml = liquid molecular weight (kg/kmol).
n = number of species in the mixture.
N i = molar transfer velocity of the component i, per
unit of gas-liquid interfacial area, (kmol/m2 s).
Qw = heat flow (kJ/s).
r = a tube stripper radio (m).
T = operation temperature, (oK).
Ts = steam saturation temperature, (oK).
U = overall heat transfer coefficient, (kJ/(s m2 oK)).
xi = mole fraction of specie i in liquid phase, (kmol i/kmol).
yi = mole fraction of specie i in vapor phase, (kmol i/kmol).
z* = axial coordinate, dimensionless.
Greek letters
α = carbamate decomposed by reaction (1), (kmol/s).
δ g = gas film thickness, (m).
∆ H = heat of reaction, (kJ/kmol).
∆ Hvi = heat of vaporization of i component, (kJ/kmol).
λ ι = stoichiometric coefficient of component i, (Equation 11)φ = fugacity coefficient of the specie i.
Superscripts
0 = stripper inlet.
e = each stage inlet.
* = vapor-liquid interface.
l = liquid phase.
v = vapor phase.

8/3/2019 0602_paper_code_602
http://slidepdf.com/reader/full/0602papercode602 10/10
2nd
Mercosur Congress on Chemical Engineering
4th
Mercosur Congress on Process Systems Engineering
10
References
Anderson, T.F., Abrams. D.S., Grens, E.A. (1978). Evaluation of Parameters for Nonlinear Thermodynamic Models. AIChE
J ., 24 (1), 20.
Cesari, D.K., Schbib, S.N., Borio, D.O. (2005). Steady state analysis of the high-pressure section of an industrial urea plant.
Accepted to X Chemical Reactor Engineering, August 28, Zacatecas, México.
Dente, M., Pierucci, S., Sogaro, A., Carloni, G., Rigolli, E. (1988). Simulation Program for Urea Plants. Comp.& Chem.
Eng., 12, 389.
Hamidipour, M, Mostoufi, N., Sotudeh-Gharebagh, R. (2005). Modeling the synthesis section of an industrial urea plant.
Chemical Engineering Journal , 106, 249.
Kafesjian, R., Plank, C.A., Gerhard, E.R. (1961). Liquid flow and gas phase mass transfer in wetted-wall towers. AIChE. J ,
Vol. 7, No. 3, 463.
Kenig, E. Y., Wiesner, U., Górak, A. (1997). Modeling of Reactive Absorption Using the Maxwell-Stefan Equations. Ind.
Eng. Chem. Res., 36, 4325.
Knapp, H., Döring, R., Oellrich, L., Plöcker, U., Prausnitz, J.M. (1982). Vapor-Liquid Equlibria for Mixture of Low boiling
substances. Chem. Data Series, 6.
Krishna, R. (1977). A Generalized Film Model for Mass Transfer in Non-Ideal Fluid Mixtures. Chem. Eng. Sci., 32, 659.
Pedersen, H., Prenosil, J.E. (1981). Gas Absorption in laminar falling films with first order homogeneous reaction and gas
phase mass transfer resistances. Int. J. Heat Mass Transfer, 24, 299.
Sander, B., Federslund, A., Rasmussen, P. (1986). Calculation of Vapor Liquid Equilibria in Mixed Solvent/Salt Systems
Using an Extended UNIQUAQ Equation. Chem. Eng. Sci., 41(5), 1171.
Sandler, S.I., (1997). Chemical and Engineering Termodynamics 3ra Edición, 478.
Talens-Alesson F.I. (1999). The modeling of falling film chemical reactors. Chemical Engineering Science, 54, 1871.
UNIDO &IFDC, (1979). Fertilizer Manual. Kluwer Academic Publishers, Holanda.
Wassel, A.T., Mills, A.F. (1987). Design Methodology for a Counter-current Falling Film Evaporative Condenser.
Transactions of the ASME , 109, 784.
Wichterle, I., Linek, J., Hála, E. (1973) Vapor –Liquid Equilibria Data Bibliography. Elsevier.
Zhang, X., Zhang, S., Yao, P., Yuan, Y. (2005). Modeling and simulation of high-pressure urea synthesis loop. Computers &
Chemical Engineering , 29, 983.
Acknowledgment
The authors are grateful to the Consejo Nacional de Investigaciones Científicas y Técnicas (CONICET) of
Argentina for the financial support during the work.


