Embed Size (px)
Citation preview

'05348
7 983 on SERIE RESEHRtHmEmORBnOB
VRIJE UNIVERSITEIT EKOIMOMISCHE FAKULTEIT
AMSTERDAM


SPATIAL IMPACT ANALYSIS FOR DEVELOPING
COUNTRIES
A FRAMEWORK AND A CASE STUDY
Peter Nijkamp
Michiel van Pelt
Researchmemorandum 1983-14
oktober 1983.
Paper to be published in International Regional Science Review.


1
1. Introduction
Developing countries all over the world are coping with a wide variety
of severe problems regarding demographic, socio-economic, spatial and
political developments. In many of these countries, the lack of
coordinated effective policy strategies, the lack of analytical insight
into complex development problems and the absence of appropriate information
systems have hindered the design of coherent development plans, not only at
the national level, but also at the regional and urban level.
In recent years, urban and regional planning problems in developing
countries have drawn much interest from the side of planners and regional
scientists (cf. Chatterji, 1982, and Richardson, 1980). This increased
attention for spatial dimensions of development planning was particularly
induced by the strong sector orientation of prevailing policies (for
instance, housing, industrial or infrastructure policy), which led to a
neglect of important impacts on other components of society.
In this paper, a method is described that serves to provide a logical
and coherent framework for assessing all relevant (and sometimes unintended
or harmful) spatial consequences of public policies. This method named
here spatial impact analysis, may be regarded as a specific application
of more general effectiveness analyses. In general, effectiveness or
impact analyses aim at assessing all relevant foreseeable and expected
consequences of external changes in a system within a certain time period
(cf. Nijkamp, 1983 a). Spatial impacts refer to the spatial dimensions
of impacts of external changes (particularly government policies). By means
of spatial impact analysis, the consequences of intended (or hypothetical)
government actions for cities and regions can be assessed, so that planners
can gain more coherent insight into the spatial aspects of designed plans.
In view of the specific problems of developing countries in the field of
data and information availability, we propose a systems approach to
spatial impact analysis, which can be applied in situations of limited
information. Hence, a method is described for an effectiveness analysis
in developing programming, in which cities and regions will receive a
more prominent place in government policies, and which is based on a
relatively simple methodology that does not presume only "hard" information
regarding impacts.

After a discussion of a systems approach to spatial impact analysis,
a case study will be described in the subsequent sections. The method
has been applied in Bhubaneswar, India, in the framework of a research
project in this city. Finally, given the experiences in methodological
and empirical respect, some final conclusions will be drawn at the end
of the paper.

3
2. Spatial Impact Analysis
Spatial units (cities, rural areas, regions) are influenced by a number
of extemal forces, of which - in addition to exogenous factors (for
instance,international developments like a rise in oil prices) -
government policies have great significance. In this paper, particular
attention will be paid to the impacts of policy measures.
Government actions that affect spatial units can broadly be divided into
two categories: first, actions that directly aim at influencing the spatial
units concerned, and secondly, actions that are not primarily directed
towards these units, but may have unintended impacts on these units.
The second group, which may consist inter alia of industrial,
agricultural etc. measures, influences geographical patterns of cities
and regions sometimes in a decisive way, sometimes even without the
planner's prior knowledge. Thus, both types of policies may imply impacts
on spatial units.
Spatial impact analysis may be defined as a systematic and coherent
organization and application of established analytical techniques to
assess the expected or foreseeable impacts (both intended and unintended,
both direct and indirect) of various policy measures or programs at
various administrative levels upon relevant welfare indicators of
cities or regions (Nijkamp, 1983b). Examples of such impact analyses
are: the impacts of a national energy programme for a specific region,
or the impacts ofanew infrastructural policy on a specific city.
Spatial impact analysis aims at providing an integrated (rather than a
partial) picture of the consequences of a public policy plan (or of a
set of such plans) for regions, rural areas or cities. Clearly, the
spatial dimension of government actions gets more attention by applying
this method. In this paper, we confine ourselves to two types of spatial
impact analysis: regional and urban impact analysis. The first one aims
at providing an assessment of the impacts of policies for a specific region,
the second one for a specific city or system of cities in its regional
context.

4
In recent years, especially urban impact analysis has drawn a lot of
attention. In the United States, Glickman (1980) collected a number of
applications of urban impact analysis, following the implementation of
a new law, by which responsible public agencies are required to assess
the expected urban impacts of federal policies. In these studies, the
impacts for systems of cities were highlighted. Another approach has
been put forward by Nijkamp (1981), who assessed the impacts of various
government plans for one specific Dutch city. At a conference in Paris
(OECD, 1981), a number of case studies were collected, where urban impacts
of government policies in a number of countries (inter alia, Sweden,
Canada, France) were the subject of study. These studies paid attention
to a wide variety of impacts on cities or groups of cities caus.ed by (mainly
non-urban) public policy programmes.
Various studies in the field of regional impact analysis can be found in
Pleeter (1980). A general framework for spatial impact analysis will now
be presented in order to highlight the three major components of the
method used in th-is paper.
policy measures policy measures
Fig. 1 Tnree main components of aspatial impact analysis
As mentioned before, spatial impact analysis aims at assessing the impacts
of policy measures on relevant welfare indicators of a spatial unit. The
three related components will successively be discussed.
The first component is related to government policies. In principle, it
can be safely assumed, that measures of all policies will have impacts on
cities or regions. These policies may relate to urban and non-urban fields,
and may be pursued at various institutional levels (international, national,
regional and urban). Hence, policies related to various fields and various
institutional levels may have a relevance for spatial units.
intended and unintended impacts

5
international policies: pricing of raw materials
national policies : industrial planning energy
regional policies : environmental management infras tructure
urban policies : housing facilities
Fig. 2 Sectors and levels of spatial impact analysis
On the basis of Fig. 2, a multi-level, multidimensional vector of
policies (a so-called policy profile) can be constructed (see Nijkamp,
1979).
This multidimensional profile approach is also a meaningful analytical
method for dealing with various spatial units. Attention should be paid
to the variety, coherenceand institutional framework of the spatial
unit at hand. This implies that normally economie, spatial, social and
environmental aspects of the spatial unit should be included (Nijkamp,
1981). The multidimensional approach can be used to consider the wide
variety of relevant aspects in a city or a region, as in such a case
a certain phenomenon is characterized by a vector profile, with a set of
different (multidimensional) components or attributes. For instance, urban
quality of life is a multidimensional phenomenon which can only be
represented in a useful way by means of a vector with such elements as
the quality, size and rent of dwellings, the availability of recreation
areas, congestion etc.
1 I
1

6
Finally, the impacts of all policy measures on the spatial unit at
hand have to be assessed. Assuming alternative measures (P, PT)
it may be useful to employ an impact structure matrix which reflects
the impacts of alternative policies on the elements (C. C ) of
the multidimensional profile of the spatial unit (cf. Nijkamp & Van Pelt,
1982).
C1 I m p a c 4-1 s
CT
p l
P J
p r o f i 1 e s
- Fig. 3 An impact structure matrix
After this general exposition of the main features of spatial impact
analysis, the following conditions that have to be fulfilled by an
operational elaboration of the method may be mentioned (Nijkamp &
Van Pelt, 1982):
- a focus on policy issues and instruments
- a complete picture of all relevant impacts
- a consistent treatment of all relevant data
a multidimensional representation of the spatial unit at hand
- a possibility of a cross-regional or intertemporal comparison.. of effects
- a flexible adjustment to new circumstances
- an orientation towards the available data
- a comprehensive picture of spatial interactions
a possibility for an effectiveness analysis of policy measures
- an orientation to prevailing institutional and political structures.
Given these methodological requirements, the questionarises whetheran operational
and practical framework for spatial impact analysis can be designed, and
more in particular for countries in the developing world. In the next section,
we will first draw attention to specific characteristics of the Third World,
that evoke the need of spatial impact analysis in these areas. Next, in section
4, a systems approach to spatial impact analysis, with a special view on
developing countries, will be developed.

7
3. Spatial Impact Analysis in Developing Countries
In order to discuss the relevance of spatial impact analysis in developing
countries, some attention will be paid to some specific characteristics
of these countries. In many ways, the developing world shows different
development paths from the western world. A different historical background,
different political relationships and different internal factors contribute
to some specific developments in the Third World. In regard to regions and
cities, the developing world shows some tendencies that are worth mentioning.
As far as regional developments are concerned, there is a general trend
in many developing countries that interregional welfare discrepancies are
increasing, that infrastructure facilities are often insufficiënt to
stimulate growth, that rural areas are becoming less able to reach their
first take-off stage, that rising energy costs affect the welfare prospects
of peripheral areas and that perpetuating interregional gaps in welfare
reinforce the trend towards more regional autonomy (Rondinelli and Ruddle,
1978). In general, most of the developing countries are still agricultural
in nature, while many rural people still face severe poverty (Friedmann &
Douglas, 1975). v
The cities in developing countries display also drastic developments.
Whereas the share of population living in cities in developing countries
is still comperatively low, the number of urban citizens is increasing
very fast. The same holds true for the number of cities with more than
one million inhabitants. In fact, the twelve fastest growing "million-cities"
are all to be found in the Third World (Palen, 1976). Among the world's
biggest cities many are also located in developing countries: Mexico City,
Sao Paolo, Calcutta etc.
The large urban agglomerations face serious frictions in labour and
housing markets, while also the level of public facilities appears to
be far from satisfactory (cf. Chatterjee & Nijkamp, 1981). An increasing
percentage of urban population is living in slums and squatters
under extremely bad conditions: Mountjoy (1976) found that these
percentages varied from 20 - 80%.

8
In regard to the labour market, Third World cities are showing increasing
numbers of unemployed and underemployed people (Bairoch, 1973).
A typical feature in these cities is the existence of a dual (or segmented)
labour market, in which a formal sector exists next to an informal sector
(Dholakia 1977, Sinclair 1978, Sethumaran 1981).
Finally, the decay in urban quality-of-life caused by pollution,
overcrowding, .congestion and social alienation has led to severe problems
in large agglomerations in Third World countries. The absorptive capacity. .
of cities is usually insufficiënt to accommodate a growing number of
inhabitants.
The problems of the cities are partly a result of rural developments. The
lack of faci.lities and job opportunities in the rural areas and the
(supposed) attractive urban opportunities in big cities induce a movement
of many rural people to the cities. Besides the natural growth of
population in the cities, the immense immigration is substantially
contributing to the overcrowding of urban areas. Todaro (1976) has
developed a model in order to study the rural-urban migration processes.
This analysis is an important step forward towards a more operational
analysis of migration patterns in developing countries, although it could
be extended in order to arrive to an even more comprehensive
model (see, for instance, Rempel, 1981).
The spatial dynamics in developing countries have led to the need of
appropriate policy programs, such as demographic and migration policies,
rural development strategies, urban revitalization programs, industrialization
programs etc. Unfortunately, many governments of developing countries are
not sufficiently equipped to develop these plans or to implement them
(Bhambri, 1973). The coordination and integration between different policies
at various institutional levels are often lacking. Many policies are hindered
by administrative frictions, mono-disciplinary approaches, lack of information,
political discrepancies and shortage of trained government employees.
The problems in this field are clearly reflècted in regional and urban
planning. The emphasis on sector policies has led to a neglect of urban
and regional dimensions in planning. Various policies have been developed
without an explicit geographical connotation, although they apparently had

y
strong spatial repercussions (like labour market policies, national
energy savings programs, industrial development programs etc.) (Misra
and Sundaram, 1978, Misra et al, 1974). The geographical aspects
of public policies in developing countries have too long been neglected.
In view of the abovementioned shortcomings and frictions in planning,
the relevance of spatial impact analysis for developing countries
has to be emphasized. A systematic method, that aims at assessing the
spatial dimensions of government policies, could shed more light on the
coherence of policies and/or programs and could provide an integrated
frame of reference for such policies and programs. For a healthy
development of cities and regions.a rigorous attempt has to be made
to assess the relevant geographical repercussions of public policies.
Spatial impact analysis offers such an integrated framework for studying
the impacts of policies on cities and regions. The systematic assessment
of all relevant regional, rural or urban consequences of public policies
may lead to more harmonious and balanced regional and urban policy
decisions. The city and the region, often neglected in the past, may hence
obtain a more prominent place in the considerations of planners on various
levels and in various fields.
However, the question arises whether an operational spatial impact analysis
can be designed for developing countries, given the problems these countries
face in the field of information and data availability. Severe shortcomings
can be observed regarding information systems in developing countries.
The data and information base is often very weak (see Nijkamp, 1983).
Information regarding many factors (especially on a time series basis) is
often lacking or otherwise unreliable. Therefore, it is generally impossible
to build and employ complicated, mathematical models in order to arrive
at the assessment of quantitative impacts. Therefore, a less. ambitious
form of spatial impact analysis, especially suited for application in
situations with limited information, has to be developed. In the next two
sections such a spatial impact analysis will be proposed. It will be
demonstrated that - by means of a systems approach - it may be possible to
use even qualitative information in the analysis.

1 U
4. A Systems Approach
In this section, a simple systems approach to spatial impact analysis is
described that may be an operational tooi in development planning.
This approach has the advantage of being fairly simple, while it does
not necessarily require hard or cardinal information. Besides, given the
need to obtain a comprehensive picture of relevant (intended and unintended)
spatial effects of policy measures, a systems approach may offer a
practical frame of reference for spatial impact studies.
In general, a systems approach aims at portraying the processes in a
complex system that encompasses various components which are linked
together by means of functional, technical, institutional or
behavioural linkages and which can also be influenced by changes in
parameters and contiols from the environment outside the system itself
(cf. Harvey, 1969, and Klir and Valach, 1967).
In this definition, three main concepts may be distinguished: controls,
system and influences. In the scope of spatial impact analysis these
concepts may be seen as government policies (measures), the spatial unit
(city or region), and the impacts (of the measures on the city),
respectively.
The approach is based on a stimulus-response method. The government policies.
(stimuli) create changes (responses) in the urban system. The following
illustrative respresentation of the stimulus-response model may be given:
stimuli
government policies/ measures
government policies/ measures
urban or
regional
system
Fig. 3 A stimulus-response representation of a spatialsysténs approach.
We will now draw more attention to the three abovementioned concepts,
respectively.
The first topic is the government policies translated into policy
programmes.

11
In section 2, several aspects of government policies have already been
discussed. In this respect, a multidimensional profile of policy
fields may be distinguished. Applications of spatial impact analysis may
relate to various decision or policy problems. Firstly, it may be used
for the assessment of one individual project (for instance, the construction
of a large seale industrial project nearby a city) or of a set of policy
measures, a programme, or a scenario (for instance, the implementation
of a socio-economic plan in a region). Secondly, the application can be
carried out for various alternative projects or scenario's. In the latter
case, it will be interesting to make comparisons between the impacts of
the alternative plans on the basis of plan evaluation techniques (see
also section 5).
Next, we will turn to the relevant spatial unit (city or region), conceived
of as a system. In section 2, the multidimensional profile of a system
has already been mentioned. The profile contains the variables in a city
or region that reflect the general position of welfare indicators in the
spatial unit concerned. In a system these variables are linked together
by means of causal,.functional, behavioural, institutional or
technical relationships. Thus, the city or region at hand is regarded as
a system,characterized bythe elements of the multidimensional profile.
The relationships might be represented by means of a formal econometrie
model (see for instance Forrester, 1969 and Bertuglia et al, 1981), but
in developing countries this approach is generally not applicable due
to the weak information base. The other possibility, which will be explored
and applied in this paper, is that the relationships are reflected by
means of graphs .or arrows. The latter approach is more modest, as it does
not require the construction of a comprehensive spatial econometrie model.
In this case however, frequently only qualitative statements regarding the
responses of the spatial system to policy stimuli can be made. In developing
countries, with their poor information systems, the latter approach may
be extremely relevant.
In general, it is useful to distinguish relevant subsystems in the spatial
system, in order to examine its most important functional components.

12
A systems representation of a region or a city may include the
following subsystems:
- an economie subsystem
a facilities subsystem
- a demographic subsystem
- a social subsystem.
These subsystems can be distinguished for both urban and rural areas
so as to encapsulate also the urban-rural duality. An example of such
a comprehensive system for a region, consisting of a city and a
surrounding rural area is given in figure 4.
The linkages between the urban system and the rural system are extremely
important, as they draw attention to processes like migration and
commuting.
REGIONAL SYSTEM
RURAL SYSTEM URBAN SYSTEM
facilities subsystem
demographic subsystem
demographic subsystem
economie subsystem
facilities subsystem
demographic subsystem
;
demographic subsystem
economie subsystem
facilities subsystem
demographic subsystem
economie subsystem
•t i
• •
social subsystem
economie subsystem
social subsystem
facilities subsystem
social subsystem
economie subsystem
social subsystem
facilities subsystem
Fig. 4 An illustration of an urban-rural system
The various subsystems can be further analysed on the basis of interactions
between the constituent elements. For instance, a demographic subsystem can
be represented as in figure 5.
births
deaths
natural increase
migration
population growth
initial population
size and composition of population
Fig. 5 An illustration of a demographic subsystem

13
In a similar way, all other subsystems can be depicted (Nijkamp, 1983b,
Van Pelt, 1983). The degree of complexity of these subsystems usually
depends on the policy objectives at hand and on the data availability.
Each of these subsystems can be represented by a figure, like figure 5,
so that ultimately a comprehensive, but comprehensible picture of the
spatial unit concerned emerges.
It should be emphasized that the successive subsystems are not closed.
There are strong mutual interactions between all subsystems.
Examples are:
- a rise in population (demographic subsystem) affects the situation on
the labour market (economie subsystem)
- more medical facilities (facilities subsystem) influence the birth and
death rates (demographic subsystem)
- increased migration from the rural areas to the city (demographic
subsystem) may result in a decay of the social climate in the city
(urban social system)
- high income differences (economie subsystem) cause more geographical
mobility (demographic subsystem)
Thus these linkages have to be included as well. This may lead altogether
to a fairly complex model. Clearly, in every application the question
will arise as to how far the complexity of the model should be increased.
In this respect, one has to trade off comprehensibility against practical
suitability.
Finally, the impacts of the policies on the spatial system have to be
assessed. Here, a step-by-step method may be useful. First the direct
impacts are assessed, after which in the following steps the indirect
impacts can be traced by following the arrows in the system. This approach
can be illustrated by means of figure 6 (Nijkamp & Van Pelt, 1982).

14
Fig. 6 A stepwise spatial impact system
By means of this figure, in which each step reflects the stimulus-
response concept in a more detailed way,the step-by-step method can
be clarified. In the first step it is indicated where (i.e. on which
element.(s) of the system) the policy measures will have their first, and
usual major, impact. The relevant elements are the first-order
intermediate variables • the relevant impacts can be labelled as the
direct impacts. For instance, educational policy will have a first and
major influence on the facilities subsystem.
Next, one has to follow the arrows in the spatial system for assessing
the indirect impacts. When first-order intermediate impacts are changing,
directly related other second-order intermediate elements will change as
well. These impacts are assessed in the second step. In the third step,
the resulting changes in other elements are assessed, and so forth.
This procedure can be repeated for higher-order impacts, üntil indirect
impacts have become negligibly small, the information content is very
unreliable, or the number of steps is fairly high (Nijkamp, 1983b).
Finally, the impact matrix can be constructed (see fig. 3).
In an ideal situation, a dynamic model could enable us to relate the
various impacts to time periods. This, however, will usually not be
possible in developing countries. Therefore, this step-by-step method
is a useful tooi to assess the impacts of policy measures on a spatial
system in a comparative static way.

15
So far, we have disregarded the dimensions of the assessed impacts. As no
formal economie model could be designed to reflect the relations in the
spatial system, only arrows were used. Consequently, not all of the
impacts can be assessed ina quantitative cardinal way; often only
qualitative statements were possible. The next section is devoted to
the nature of these impacts and to a technique that may enable us
to draw cardinal inferences from ordinal data. Then, the theoretical
and methodological framework for an operational spatial impact analysis
suited for application in Third World countries, is completed.
16
5. Qualitative Assessment of Impacts
Due to the nature of the spatial system at hand (in which the relationships
are not reflected by a formal mathematical model, but simply by graphs or
arrows), but also due to lack of data, uncertainties regarding policy
measures or even lack of insight into the structure of complex
urban or regional systems, the impacts can not always be gauged in
quantitative terms. Often, only qualitative statements will be possible.
In this case qualitative assessment methods can be useful. Such methods
attempt to develop an operational framework for gauging regional and urban
impacts of public policies that is oriented towards the needs and possi
bilities of developing countries (Nijkamp, 1983b). A qualitative assess
ment implies that effects are not necessarily measured on a cardinal scale.
Thus, if we turn back to the step-by-step method described in the previous
section, the question of quantitative versus qualitative impacts arises
primarily in the assessment of the direct impacts. During this first stage
many impacts may be gauged in fairly reliable quantitative terms. For
instance, the first-order impact of a housing policy may be an increase in
the stock of dwellings by x units.
The next step is the assessment of the second-and higher - order indirect
impacts. Although it might again be possible to gauge these impacts in
quantitative terms, this will often not be the case. Then, qualitative
inferences may be drawn. In order to do so, a number of options are
available. When only one policy or plan is considered, ordinal, verbal,
nominal or binary statements may be made, for instance, ++, +, 0, -, — , ?
These symbols mean respectively: relative large positive impact,
relative small positive impact, negligible impact, relatively small negative
impact, relatively large negative impact, unknown impact. Other possibilities
are inter alia "high" or "low", or even "yes" or "no".
Ordinal rankings (1, 2, 3) may be used when comparing the impacts of a plan
on the various elements of the system, or - in the case of a scenario -
when comparing the impacts of the various measures on these elements.

1 7
In case of multiple projects or scenario's, ordinal statements may be
very useful, as then comparisons can be made between the alternative
plans. Especially in case of a comparison . of the final impacts, this
may be an interesting approach. The impact matrix, discussed in section 2
(see figure 3), can then be filled with ordinal rankings of the various
plans.
At this point it may be worthwile to compare this impact matrix with a
reference profile (Nijkamp, 1979), in which the desired targets referring
to the elements are listed. The best plan may then be identified by
comparing the ordinal rankings from the actual and the reference profile.
Even in such analyses, interesting conclusions may be drawn. Many practical
experiences have demonstrated that the availability of qualitative
information and the degree- of sophistication in building complex
economie models.are less relevant for planning problems in developing
countries. However, new developments in the area of qualitative data
techniques make it even more appealing to concentrate on qualitative
information. One of these techniques viz. multidimensional scaling analysis,
will now briefly be discussed.
Multidimensional scaling (MDS) analysis has become a popu-lar tooi in social
science problems characterized by qualitative (ordinal) data. In recent
years, several applications in the area of geography, regional science
and economics have been made (see for a survey Nijkamp, 1979). Scaling
methods are multivariate methods aiming at reducing an ordinal data matrix
to a cardinal matrix of a lower dimensionality. In a sense, scaling
methods may be regarded as a qualitative factor analysis.
All scaling methods are based on ordinal (or qualitative) rankings of
(dis)similarities among alternatives (e.g., items, attributes, objects or
individuals). The aim of MDS methods is to identify a geometrie representa
tion of the position's of these alternatives in a Euclidean (metric) space.
Then a scaling algorithm is used in order to find a consistent representation
of these alternatives, so that ultimately metric conclusions can be inferred
regarding the Euclidean distances between the points in this configuration.

18
The basic idea of MDS analysis is to reduce the ordinal information to
a geometrie configuration with fewer dimensions. This implies that more
ordinal conditions are available than geometrie coordinates are necessary.
Hence, this abundant information involves many degrees of freedom that
can be used by scaling algorithms to transfer ordinal inputs into metric
outputs.
The geometrie position of alternatives can be represented by means of
Euclidean coordinates. These are determined such that the inter-point
(metric) distances between the geometrie positions in a Euclidean space
do not contradict the original conditions implied by the ordinal input
data. Thus this monotonicity condition should guarantee a maximum
correspondence between the initial ordinal rankings (in terms of similarities
or dissimilarities) and the Euclidean distances in a geometrie space with
a lower dimensionality. The technique itself of MDS analysis will not be
exposed here in greater detail, but an elaborate exposition can be found
in Nijkamp (1979). In the context of the present paper only an illustrative
explanation will be given.
Assume the existenceofN alternative plans which have to be judged on the
basis of I evaluation criteria. Thus, altogether there are IxN ordinal
conditions. If we want to represent the N alternatives in a two-dimensional
Euclidean space, then we would need 2xN geometrie coordinates (or N(N-l)/2
geometrie distances). Thus, the initial IxN ordinal conditions have to be
transformed into N(N-l)/2 cardinal conditions, such that there is no contradic-
tion between the cardinal statements and the initial ordinal conditions. If
I > (N-l)/2, there are degrees of freedom which may be used to arrive at an
optimal fit (based on a goodness-of-fit or 'stress'-function). Once the
cardinal configuration has been found, one may draw metric conclusions
regarding the positions of the.alternatives.
In conclusion, scaling methods aim at inferring quantitative statements
from initial ordinal information. This will be further illustrated in
section 8.

19
A Case Study of Urban Impact Analysis in Bhubaneswar (India)
During the year 1982, a case study of spatial impact analysis has been
carried out in a country of the developing world, viz. India (Van Pelt,
1983). The case study concerned a special form of spatial impact analysis,
namely urban impact analysis. The research work aimed at assessing the
impact of various scenario's for government policy for one city,
Bhubaneswar.
Bhubaneswar is the capital city of Orissa, a state on the eastern part
of the Indian subcontinent. The city consists of two, more or less
separated sections: Old and New Bhubaneswar. Old Bhubaneswar is fairly
small, but it plays an important role in India due to the presence of
many temples, among which the Lingeraj -Temple is the most famous. New
Bhubaneswar was only constructed af ter 1954, after the decision to shift
the capital form nearby Cuttack to Bhubaneswar.
Bhubaneswar, a to a large extent planned city, was designed to accommodate
40,000 people by 1986. The latest census-figures for 1981 however, reveal
that the number of inhabitants has already exceeded the level of 200,000 in
the late seventies. The population has grown very fast, and it had its
highest growth rates in the decade 1961-1971: 176,1%, even for Indian
standards extremely high.
Bhubaneswar can be characterized as an administrative-cum-service centre.
Due to its capital function, nearly half of the working population is
working in government or semi-government offices, Industries have not yet
cotne up in a significant way, though it is expected that in the near
future the industrial sector will grow fast. Other sectors (commerce, trade,
construction, etc.) mainly serve local demands.
The immense growth of the population, due to an influx of people from
rural as well as urban areas - besides the natural growth - has caused
many problems in the city. The most severe problems are concentrated in
the field of housing: the housing gap could be estimated as 15.000 units
in 1977, whereas there are only signs of a widening gap. Besides, the fast
growing number of "slum-units" (about 15 to 20% of the population lives
in these shelters) illustrate the impossibility of supplying enough shelter
to the citizens. But other facilities show inadequacies as well;

20
especially health and education centres pose many problems for the
inhabitants.
Bhubaneswar is a planned city that is facing many problems representative
for other Third World cities. As many government policies (central state
and local) have strong regional dimensions, an application of urban
impact analysis is a potentially interesting approach. Hence, the
methodology described in the previous sections has been applied. Thus,
first the attention has been focussed on the selection of policy plans
relevant for the city; secondly, ón the construction of the integrated
impact system for Bhubaneswar, and thirdly, on the assessment of the
impacts of the successive policy plans for the Bhubaneswar system
In regard to the policy plans, af ter many discussions, it was decided
to choose three scenario's for regional economie policy. The region
under study is essentially a greater metropolitan and rural area of
Bhubaneswar: it concerns an area of which Bhubaneswar is more or less
the geographical centre, and which includes cities like Cuttack
0+ 300,000 inhabitants) and Puri, Konark and Chaudwar (all less than
100,000 inhabitants), as well as many rural villages and rural areas
(s ee Map).

* * * & ,
IMPORTANT PLACES
BHU SUB
KMS.5
8
G.M.Sahoo , Dept. of Geography , Utkal University , Vani Vihar , Bhubaneswar - 7 5 1 0 0 4

22
7. A Scenario Analysis for Urban Impact Analysis
Three scenarios have been designed for the abovementioned case study.
The three scenario's consisted of packages of govemment measures
aiming at alternative desirable and feasible future developments in the
economie pattern of the region up to the year 2001.
The first scenario was the Master Plan scenario, derived from the
Master Plan of 1978. This scenario is more or less a conservative one,
that is to say: no major changes in the economie structure of the region
are envisaged. The main objectives and proposed measures are listed
below.
1. Bhubaneswar will remain the principal administrative centre of the
state. All government and semi-government offices still located in
Cuttack should be shifted to Bhubaneswar.
measures: The construction of government buildings in Bhubaneswar.
Shifting of the offices to Bhubaneswar as soon as possible.
2. The capital function should continue to attract related administrative
and "liaison" offices to Bhubaneswar.
measures: Encouragement of this objective in various ways (premiums,
provision of buildings etc).
3. Bhubaneswar should get a limited number of small and medium sized
industries, located in the northern part of the city. Choudwar,
Jagatpur and Paradeep should function as the industrial centres.
measures: Encouragement of the rise of a limited number of industries
in Bhubaneswar by land.'allotments, tax concessions, etc.
The other industrial centres should be encouraged by
same measures to grow further.
4. Cuttack should remain the commercial centre. Bhubaneswar's commercial
sector should only serve local demands.
measures: Land allotments.
The second scenario is more progressive. It is envisaged that the
construction of, a bridge over a big river near Cuttack will favour the
growth of an urban-industrial complex between Cuttack and Bhubaneswar.

23
This scenario includes the following objectives and measures.
1. A bridge over the Kuakhai River should be constructed.
measures: Construction of the bridge, and improvement of the road
system.
2. Between Cuttack and Bhubaneswar an industrial area should be planned.
In this area, a large number of small-, medium- and large-scale
industries should be created.
measures: Land allotments.
Stimulatinn of new industries by means of the varied
Incentive Package offered by the Industrial Promotion &
Investment Corporation of Orissa.
3. Between Cuttack and Bhubaneswar, an urban area should be constructed.
measures: Land allotments.
Construction of houses.
4. Government offices should only be shifted to Bhubaneswar, provided
sufficiënt accomodation is available.
measures: Restrictivp. public attitude regarding shifting these offices. v
The third scenario aims at a fast development of the tourist potential
of the region at hand.
1. A significant number of hotels in all classes for foreign and Indian
tourists should be made available.
measures: The construction of various hotels by the government.
Promotion of private construction by land allotments.
Less bureaucratie handling of building requests, etc.
2. The accessibility of tourist centres should be improved.
measures: Construction of a road between Puri and Konark.
Improvement of transport facilities.
More sightseeing tours by the Orissa Tourist Development
Corporation.
3. Tourist centres should be made more attractive.
measures: The temples in Puri, Konark and Bhubaneswar should be better
maintained and protected, of which a special government body
should take care.
In the cities swimming pools, golf courses, cultural facilities
etc. should be developed.

24
4. Industries should mainly be located in the existing sites, avoiding
the tourist centres.
measures: Land allotments
In the second step of the impact analysis, a specific impact system for
the city of Bhubaneswar itself has been designed. The Bhubaneswar
system was extended with various regional variables in order to be able to
take account of various linkages (migration, employment, etc.) that exist
between the city and its rural-urban surroundings. The system itself is
presented in figure 7.
For each of these three scenarios, the impacts on Bhubaneswar have been
gauged in a step-by-step approach, based on the systematics of the above-
mentioned spatial impact analysis, leading to the assessment of final
impacts in the impact structure matrix. As the scenarios were related
to a fairly long time period (1981-2001), the measures belonging to these
scenarios were distributed over four five-year periods. Hence, for each
of these periods the impacts of the relevant measures had to be assessed.
Clearly, the reliability of the assessed impacts in the last five-year
periods is less high than in previous years. The impacts were gauged
mainly on a basis of qualitative, uncertain and verbal information, so
that only qualitative statements could be made.
The results of the three successive scenarios are included in Tables 1-3.
The assessment of the various qualitative impacts has been based on tracing
the chains of successive effects from figure 7. These, results provide
the necessary information on long-term effects of public policies on the
area at hand. The next section will be devoted to a further analysis of
the successive plans.

rural
factors
employrnent
other factors
-s! natural
increase
urban factors
employrnent
-» migration
.1
^ population
increase
Iprimary
|population '
_r\
composition
of population!
f technology
labór
potential
labor
opportunities
..-_ .1....
H
I inves tments'
infrastructure
demand
savings
agglm. advant.
availability
of land
WORKERS
primary sector
secondary sector
iarge scale industry
small and medium scale
industry
construction
tertiary sector
government
institutions
tourism
trade and cumm;rce
transport and
communication
NON-WORKhKS
voluntary
unempl-oyed
unvoluntary
unemployed
size of
population
\*
income distribution
above
poverty line
b e 1 ow
poverty
line
_&. ~~jk soci al cl imate**""
hurcaurracy
supply of
housing h
j
•i bungalow
supply of
housing h
j
k h
j
k moderate hou
demand for housing
h
j
k demand for housing
h
j
k slums
I supply of water, | ,
| sewage, drainage j
J demand for water,
| sewage, drainage
supply of health,
education and
other facilities
demand for health
A education and
' other facilities
favourable w
sewage, drai
moderate wat
sewage, drai
bad water,
1 sewage, dra
favourable he
education and
other facil i t
moderate hea
education an
other facili
bad health,
education an
other facili

26
SCENARIO I : MASTER PLAN
1981-1986 1986-1991
II III IV VI VII VIII IX
REGIONAL SUBSYSTEM
Cuttack gov. employnent -1500 inv. bridge Cuttack inv. B-C region inv. road Puri-Konark inv. tourism/transport
DEMOGRAPHIC SUBSYSTEM
II III IV VI VII VIII IK
-1500
migration/population >600C
EC0N0MIC SUBSYSTEM
inv. industry Chandaka ++
inv. industry Bhub. inv. construction
industry Chandaka ++
industry Bhub. houses C government 0 institutions +
tourism +
commerce bridge B-C region road
inv. government +++
inv. institutions ++
inv. tourism +
inv. transport ++
inv. commerce ++
empl. industry Chand. empl. industry Bhub. empl. industry B-C t«g. empl. construction
ind. Chand. ind. Bhub. houses 0 government institutions tourism commerce bridge B-C region road
empl. government empl. institutions empl. tourism empl. transport empl. commerce labor potential % involuntary unempl. % underemployed % below poverty line
•>6000
0/+
+++
++
0/ +
+4000 «-3000
0 0/ + 0
+1500 ++ ++
0/ +
+ 1500
++
0/+ 0/+
0/+
0/ + ++
FACILITIES SUBSYSTEM
demand for housing demand for facilities supply of housing supply of facilities housing gap Z slums facilities inadequacy
SOCIAL SUBSYSTEM
social climate
++ ++
+7500 +7500
+++
++
+++
Table 1. Impacts of the Master Plan Scenario
1)
1)
B-C region means : Bhubaneswar-Cuttack region.

27
996 1996-2001
II III IV VI VII VIII IX II III IV VI VII VIII IX
0/+
0/+
0 0/+ 0
0/ +
0 0/ +
o 0/+
0/+ 0/ + o
0/+ f-2000 nooo
0/ +
o 0/ + o
0/ +
0/+ 0/->
O/t
o 0/+
o
0/ + 0/+
REGIONAL SUBSYSTEM
Cuttack gov. empl. inv. bridge Cuttack inv. B-C region inv. road P-K inv. tour./transp.
DBM0eBAPHIC SUBSYSTEM
migr./population
ECONOMIC SUBSYSTEM
inv. ind. Chand. inv. ind. Bhub. inv. construction
industry Chand. industry Bhub. houses government institutions tourism commerce bridge B-C region road
inv. government inv. institutions inv. tourism inv. transport inv. commerce emp1. ind. Chand. empl. ind. Bhub. empl. ind. B-C reg. empl. construction
industry Chand. industry Bhub. houses government institutions tourism commerce bridge B-C region road
empl. government empl. institutions empl. tourism empl. transport empl. commerce labor potential % involunt. unempl. % underemployed Z below poverty line
+7500 ++ ++ t-7500
++ ++
FACILITIES SUBSYSTEM
demand for housing demand for facilities supply of housing supply of facilities housing gap % slums fac. inadequacy
S0CIAL SUBSYSTEM
social climate
Table 1 (continued). Impacts of Master Plan Scenario.

28
SCENARIO II : URBAN COMPLEX
1981-1986 1986-1991
II III IV VI VII VIII IX I II III IV V VI VII VIII IX X
REGIONAL SUBSYSTEM
Cuttack gov. employment -500 inv. bridge Cuttack +++ inv. B-C region inv. road Puri-Konark inv. tourism/transport
DEMOGRAPHIC SUBSYSTEM
migration/population >2000
EC0N0MIC SUBSYSTEM
-500
+++
>2000
inv. industry Chandaka inv. industry Bhub.
+++
inv. construction industry Chandaka industry Bhut. houses
+++
0 government institutions
0 0/ +
tourism commeree bridge B-C region road
+
inv. government inv. institutions
++
+
inv. tourism inv. transport +++
inv. commerce empl. industry Chand. empl. industry Bhub. empl. industry B-C reg. empl. construction
ind. Chand.
++
ind. Bhub. houses 0 government institutions tourism commerce bridge B-C region road
+
empl. government empl. institutions empl. tourism empl. transport empl. commerce labor potential % involuntary unempl. % underemployed % below poverty line
07+
07 +
0/ +
+6000 +5000
0/+ 0
0/+
+500
0/+
• 500
0/+
+ + + oh
o +
0/+
0/+ +
0/ +
FACILITIES SUBSYSTEM
demand for housing demand for facilities supply of housing supply of facilities housing gap Z slums facilities inadequacy
SOCIAL SUBSYSTEM
+++ +++
+7500
+++ +++
+7500
++ ++ ++
social climate
Table 2. Impacts of Urban Complex Scenario.

29
1991-1996 1996-2001
I II III IV V VI VII VIII IX X I II III IV V VI VII VIII IX X
-500 +500
>2000 >2000
0/+
0/+
0/+ ++
0/ +
0/+ 0/+
+4000 + 3000
0/+
0/+
+500 0/+ 0/ +
+500 0/+ 0/+
0/+ 0/+ 0/+ 0/+
REGIONAL SÜBSYSTEM
Cuttack gov. empl. inv. bridge Cuttack inv. B-C region inv. road P-K inv. tour./transp.
DKHOSBAPHIC SÜBSYSTEM
migr./population
EC0N0MIC SÜBSYSTEM
inv. ind. Chand. inv. ind. Bhub. inv. construction
industry Chand. • industry Bhub. houses government institutions tourism commerce bridge B-C region road
inv. government inv. institutions inv. tourism inv. transport inv. commerce empl. ind. Chand. empl. ind. Bhub. empl. ind. B-C reg. empl. construction
industry Chand. industry Bhub. houses government institutions tourism commerce bridge P C region road
empl. government empl. institutions empl. tourism empl. transport emp1. commerce labor potential % involunt. unempl. Z underemployed Z below poverty line
FACILITIES SÜBSYSTEM
+7500 +7500
0 demand for housing 0 demand for facili'ties
supply of housing supply of facilities
0/+ housing gap 0 Z slums
0/ + fac. inadequacy
SOCIAL SÜBSYSTEM
0/ + social climate
Table 2 (continued). Impacts of Urban Complex Scenario.

30
SCENARIO III : TOURISM
1981-1986 1986-1991
II III IV VI VII VIII IX I II III IV V VI VII VIII IK
REGIONAL SUBSYSTEM
Cuttack gov. employment inv. bridge Cuttack inv. B-C region inv. road Puri-Konark inv. tourism/transport
DEMOGRAPHIC SUBSYSTEM
migration/population
ECONOMIC SUBSYSTEM
inv. industry Chandaka inv. industry Bhub. inv. construction
industry Chandaka industry Bhub. houses
-500
+++ +++
-500
>2000 >2000
0/t 0/+
government 0 institutions 0/+ tourism ++
commeree bridge B-C region road 01*
inv. government ++
inv. institutions + inv. tourism +++
inv. transport +
inv. commerce ++
empl. industry Chand. empl. industry Bhub. empi. xnauscry 3-C cog'. empl. construction
ind. Chand. ind. Bhub. houses 0 government institutions tourism commerce bridge B-C region road 0/t
empl. government empl. institutions empl. tourism empl. transport empl. commerce labor potential ." involuntary unempl. Z underemployed Z below poverty line
o 0/t
++ ++ +
+2000 + 1500
0/t 0/ +
0 0/+ ++
o 0/+
+500
0/t
+500
0/t
+++ ++
FACILIT.IES SUBSYSTEM
demand for housing demand for facilities supply of housing supply of facilities housing gap 7. slums facilities inadequacy
SOCIAL SUBSYSTEM
+++ +++
++ ++
+7500 +7500
+•++
•*++
+++
++ +++
social climate
Table 3. Impacts of Tourism Scenario.

31
1991-1996 1996-2001
I II III IV V VI VII VIII IX X I II III IV V VI VII VIII IX X
-500 -500
>2000
O/t
>2000
0/+ O/t
0/ +
O/t 0/+
++
0/+ ++
0/+
0/+ ++
i-l 000
0/ + +500
0/+
0/+
o o 0/ +
0/4
+500
0/ + ++
0/ +
o o
0/+
+500
0/+
O/t 0/+
o o 0/+
++
++
++
++
++ + 7500 +7500
++
++
++
REGIONAL SUBSYSTEM
Cuttack gov. empl.
inv. bridge Cuttack
inv. B-C region
inv. road P-K
inv. tour./transp.
DSM06EAPHIC SUBSYSTEM
mi gr./popuiation
ECONOMIC SUBSYSTEM
inv. ind. Chand.
inv.- ind. Bhub.
inv. construction
industry Chand.
industry Bhub.
houses
government
institutions
tourism
commeree
bridge
B-C region
road
inv. government
inv. institutions
inv. tourism
inv. transport
inv. commerce
empl. ind. Chand.
empl. ind. Bhub.
empl. ind, B-C reg.
empl. construction
industry Chand.
industry Bhub.
houses *
government
institutions
tourism
commerce
bridge
B-C region
road
empl. government
empl. institutions
empl. tourism
empl. transport
emp1. commerce
labor potential
7. involunt. unempl. % underemployed
% below poverty line
FACILITIES SUBSYSTEM
demand for housing
demand for facilities
supply of housing
supply of facilities
housing gap
Z slums fac. inadequacy
SOCIAL SUBSYSTEM
social climate
Table 3 (continued). Impacts of Tourism Scenario.

32
8. A Comparison of the Impacts of the Scenarios
On the basis of Tables 1-3 some interesting conclusions relating to the
various impacts of the scenarios can be drawn. It appears that a choice
in favour of a specific regional plan is of great significance for
Bhubaneswar. Different choices would imply different developments of
the area concerned.
For instance, an adoption of the Tourism-scenario would imply a
perturbation of the general climate in the city, whereas the implementation
of the Urban-complex scenario would result in a relatively stable development ,
at least in the last two five-year periods.
Comparisons between the three scenarios may be made for all elements of
the system for each of the four five-year periods. In the context of the
present paper, however, only a final comparison based on the final impacts
over all five-year periods,will be made.
For a number of selected elements, the ordinal ranking of the scenarios
according to their final impacts has been assessed. It has to be emphasized
that due to the qualitative and sometimes not fully reliable nature of
the impacts assessed in the various time periods, the ranking of the final
impacts may only be regarded as a tentative operation. However, the
available data base does not allow more precise statements.
The rankings of the final impacts are presented in the following impact matrix
(see Table 4).
33
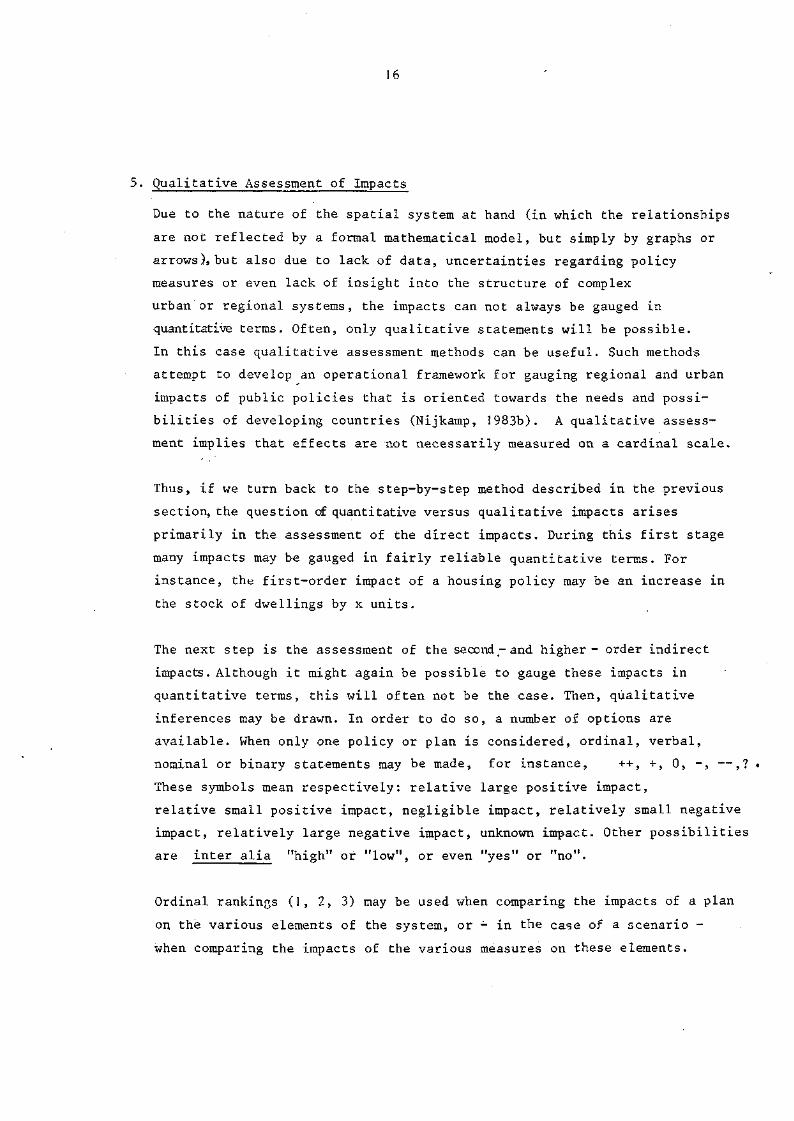
Impacts
1. migration/population 2. empl. industry 3. empl. construction 4. empl. government 5. empl. institutions 6. empl. tourism 7. empl. commerce 8. empl. transport 9. % invol. unemployment 10. % below poverty line 11. supply of housing/facilities 12. demand for housing/facilities 13. housing gap 14. % slums 15. adequate facilities 16. social climate
Master Plan Urban Complex Tourism Scenario (I) Scenario (II) Scenario (III)
3 1 2 2 1 3 2 1 3 1 2 2 1 2 2 2 3 1 2 2 2 2 2 2 3
2 3
2 2 2 3 2 3 2 2 3 3 2 2 3
Table 4. Ordinal impact matrix O
O The ordinal rankings have the following meaning:
1. highest positive impact
2. moderate positive impact
3. lowest positive impact
On the basis of this impact matrix, the multidimensional scaling method
discussed in section 5,has been applied. The results are presented below
in fieure 8.
The results indicate clearly that the three qualitative scenarios have
significant metric differences. Their scattered pattern indicates
that the impacts of these scenarios are very dissimilar. The Master
Plan Scenario (I) is very much oriented to the fulfilment of objectives
regarding employment in government (4) and in institutions (5), and to
a lesser extent in employment and industry (2)and construction (3), involun
tary employment (9), urban poverty (10), slums (14) and social climate (16)
The Urban Complex Scenario (II) appears to address especially targets
regarding employment in transport (8), and to a lesser extent targets
regarding employment in industry (2) and in construction (3), involuntary
employment (9), urban poverty (10), slums (14) and social climate (16).
Finally, the Tourism Scenario (III) places much emphasis on objectives
concerning employment in tourism (6), and addresses also targets regard
ing commercial employment (7) and supply of housing and facilities (11).

dimensiofi 2
• 4,5 O I
L..—,—...—,-U..
2, 3, 9, 10, 14, 16 m
II
7* 11
tl III
1, 12, 13, 15
Figure 8. Results of a multidimensional scaling analysis (impacts: 1, ..*, 16; scenarios; I, II, III)

35
Conclusion
In the foregoing sections, a methodological framework for spatial impact
analysis was described, as well as a case study of urban impact analysis
in India. It appears, that spatial impact analysis, on the basis of a
systems approach, may be a very useful tooi for policy analysis in
developing countries. First, it draws attention to direct and indirect,
intended and unintended impacts of government- policies which makes it
a potential instrument for urban and regional planning. In this respect,
the neglect of the spatial dimensions of cities and regions may to a
cprtain extent be avoided. Secondly, spatial impact analysis need not
necessarily be an expensive, long-lasting research effort that will only
increase the costs of regional and urban policies. The case-study
proved that even an relative outsider in telation to the local situation
can carry out a spatial impact analysis in a reasonable time period at
very low costs. Thirdly, the possibility of including in this method
both quantitative and qualitative information gives it an advantage over
many other methods which (partially) failed during applications in, the
Third World because of its quantitatively-oriented methodology.
However, it should be noted that a minimum quantity of information and
knowledge is necessary in any case.
In conclusion, spatial impact analysis may be helpful in urban and
regional planning in developing countries with a weak information
and data basis. It may favour the coordination of national, regional,
rural and urban policies. The general form of the method may be
extended with various qualitative assessment methods, making the results
more useful in practical planning. In this regard, spatial impact analysis
may provide a useful contribution to an operational policy analysis in
developing countries.

36
Data sources for Bhubaneswar case-study
Main sources
Sinha, B.N., 1982, Bhubaneswar, an Urban Study, Census Monograph, Govt. of
Orissa, Bhubaneswar. Sinha, B.N., and S.N. Tripathy, 1976, Cuttack-Bhubaneswar Urban Complex, in
Pani, N.C. (ed.): Souvenirs on Perspectives for Cuttack's Develópment, Greater Cuttack Improvement Trust, Cuttack.
Town Planning Unit and Directorate of Town Planning, 1978, Bhubaneswar Mas ter Plan, Govt. cf Orissa, Bhubaneswar.
Secondary Sources (apart from verbal interviews)
Ministry of Industry, 1981, Report of the Task Force on Nucleus Industrial Complex at Chandakar Orissa, Govt. of India, Bhubaneswar.
Mishra, R., 1979, Study'of the Slums of Bhubaneswar with Special Reference to Literacy Conditions of the Slumdwellers, mimeographed, Dept. of. Geography, Utkal University, Bhubaneswar.
Mohanty, S., 1982, Tourism Develópment Plan for the State of Orissa, mimeographed, Indian Institute of Technology, Dept. of Architecture and Planning, Kharagpur.
Murti, B.N., 1978, Socio-Economic. Survey of Bhubaneswar's Slums with Special Reference to Service Utilities, Community Facilities and their Accessi-bility, mimeographed, Dept. of Geography, Utkal University, Bhubaneswar.
National Council of Applied Economie Research, 1977, Perspective Plan of Economie Develópment for Orissa 1973/74 - 1983/84, Planning and Co-ordina-tion Departments, Govt. of Orissa, Bhubaneswar.
Sahoo, G.M.., 1976, Slums of Bhubaneswar: the Occupational Structure, a Casestudy, mimeographed, Dept. of Geography, Utkal University, Bhubaneswar.
Satapathy, CR., 1978, Slums of Bhubaneswar: a General Account with Special Reference to Migration Patterns, mimeographed, Dept. of Geography, Utkal University, Bhubaneswar.
Sinha, B.N.,1981, Geography of Orissa, National Book Trust, New Delhi.

37
References
Bairoch, P., 1973, Urban Unemployment in Developing Countries, ILO, Geneva. Bertuglia, C.S., S. Occelli, G.A. Rabino, C. Salomone, R. Tadei, 1981,
A Large Scale Model for Turin Metroplitan Area, IRES, working paper no.3, Turino.
Bhambri, C.P., 1973, Public Administration in India, Vikas Publishing House, New Delhi.
Chatterjee, L., and P. Nijkamp (eds.), 1981, Urban Problems and Economie Development, Sijthoff en Noordhoff, Alphen a/d Rijn.
Chatterji, M., 1982, Regional Science for Developing Countries, Kluwer Nijhoff, Boston.
Dholakia, J., 1977, Unemployment and Employment Policy in India, Sterling Publishers, Delhi.
Forrester, J.W. , 1969, Urban Dynamics, M.I.T. Press, Massachusetts. Friedmann, J., and M. Douglas, 1975, Agropolitan Development for Regional
Planning in Asia, United Nations Centre for Regional Develpment, Nagoya. Glickman, N.J. (ed.), 1980, The Urban Impacts of Federal Policies, Johns
Hopkins University Press, Baltimore. Harvey, D., 1969, Explanation in Geography, Edward Arnold, London. Klir, J., and M. Valach, 1967, Cybernetic Modelling, Iliffe Books, London. Misra, R.P., and K.V. Sundaram, 1978, Growth Foei as Instruments of Moderni-
sation in India, in : Kuklinski,A.(ed.), Regional Policies in Nigeria, India and Brazil, Mouton Publishers, New York.
Misra, R.P., K.V. Sundaram, and V.L.S. Prakasa Rao, 1974, Regional Development Planning in India, Vikas Publishing House, New Delhi.
Mountjoy, A.B., 1976, Urbanisation, the'Squatter and Developing in the Third World, Tijdschrift voor Economische en Sociale Geografie, no. 3, pp. 130-137.
Nijkamp, P., 1979, Multidimensional Spatial Data and Decision Analysis, John Wiley, New York/Chiehester.
Nijkamp, P., 1981, Urban Impact Analysis in a Spatial Context, Research Memorandum, no. 1981-5, Free University, Amsterdam.
Nijkamp, P., 1983a,Qualitative Spatial Impact Analysis for Development Programming, in : Chatterji, M. , T.R. Lakshmanan, P. Nijkamp, and CR. Pathak (eds.), Urban and Regional Change in Developing Countries, Gower, Aldershot (forthcoming).
Nijkamp, P., 1983b,Qualitative Impact Assessments of Spatial Policies in Developing Countries, Regional Development Dialogue (forthcoming).
Nijkamp, P., and M.J.F, van Pelt, 1983, Urban and Regional Impact Analysis in Development Programming, in : L. Chatterjee and P. Nijkamp (eds.), Urban and Regional Policy Analysis in Developing Countries, Gower, v
Aldershot (forthcoming). OECD, 1981, Working Papers for Expert Meeting on the Evaluation of the Urban
Impacts of National Policies, Paris. Palen, J.J., 1975, The Urban World, McGraw-Hill, U.S.A. Pelt, M.J.F, van, 1983, Stedelijke Effect Analyse in de Derde Wereld (Master's
Thesis), Erasmus University Rotterdam, Dept. of Economics, mimeographed (forthcoming).
Pleeter, S. (ed.), 1980, Economie Impact Analysis, Martinus Nijhoff, Boston. Rempel, H., 1981, Rural-Urban Labor Migration and Urban Unemployment,
International Institute for Applied Systems Analysis, RR-81-24, Laxenburg, Austria.
Richardson, H.W., The Relevance and Applicability of Regional Economie to Developing Countries, Regional Development Dialogue, vol. 1, no. 1, 1980, pp. 57-78.

38
Rondinelli, D.A., and R. Ruddle, 1978, Urbanization and Rural Development, Praeger Publishers, New York.
Sethumaran, S.V., 1981, The Informal Sector in Developing Countries, ILO, Geneva.
Sinclair, S.W., 1978, Urbanization and Labor Markets in Developing Countries, Croom Helm, London.
Todaro, M.P-, 1976, Internal Migration in Developing Countries, ILO, Geneva.