Embed Size (px)
Citation preview

0:45 Surface Color
Maria E. Nadal Edward A. Early1
Robert R. Bousquet2
NIST Special Publication SP250-71

NIST Special Publication SP250-71
0:45 Surface Color
Maria E. Nadal Edward A. Early1
Robert R. Bousquet2
Optical Technology Division
Physics Laboratory National Institute of Standards and Technology
Gaithersburg, MD 20899-0001
January 2008
U.S. Department of Commerce Carlos M. Gutierrez, Secretary
National Institute of Standards and Technology
James M. Turner, Acting Director

1AFRL/HEDO, 2650 Loiuse Bauer Drive, Brooks City-Base, TX 78235 2Genesis Engineering Solution, 9811 Greenbelt Road, Lanham, MD, 20706
Certain commercial entities, equipment, or materials may be identified in this document in order to describe an experimental procedure or concept adequately. Such
identification is not intended to imply recommendation or endorsement by the National Institute of Standards and Technology, nor is it intended to imply that the entities, materials, or equipment are necessarily the best available for the purpose.
National Institute of Standards and Technology Special Publication SP250-71 Natl. Inst. Stand. Technol. Spec. Publ. SP250-71, 84 pages (January 2008)
CODEN: NSPUE2

ABSTRACT This document, SP250-71 (2007), NIST Measurements Services: 0:45 Surface Color, describes the instrumentation, standards, and techniques used to measure the surface color of reflective, non-fluorescent materials at a 0:45 geometry, that is an irradiance angle of 0° and measuring angle of 45°. The organization of this document is as follows. Section 1 describes the motivation for establishing a 0:45 Reflectometer and associated calibration services that are available. Section 2 presents the theory relevant to the measurements described in this document. Section 3 describes the 0:45 reference standard. The NIST 0:45 Reflectometer including illuminator, sample wheel, and receiver and the associated characterization and validation of the instrument are described in Section 4. Section 5 presents the sources of uncertainty and the associated analysis. A sample calibration report and reference containing details of the uncertainty method are presented as appendices.

TABLE OF CONTENTS 1. Introduction ........................................................................................................1 2. Theory ................................................................................................................2 2.1 Measurement Equations ...............................................................................2 2.2 Color Values ................................................................................................4
2.2.1 Tristimulus Values ...........................................................................4 2.2.2 Chromaticity Coordinates ................................................................5 2.2.3 CIE Color Spaces .............................................................................6
3. Reference Standard ............................................................................................6 3.1 Method of Calibration ..................................................................................6 3.2 Uncertainty ...................................................................................................7 3.3 Maintenance of Reference Standards ...........................................................8 4. Reference 0:45 Reflectometer ............................................................................8 4.1 Instrument Description and Properties.........................................................8 4.2 Characterization of Instrument ..................................................................11 4.3 Instrument Validation ................................................................................13 4.4 Calibration Services ...................................................................................16 5. Uncertainty Analysis ........................................................................................16
5.1 Sources of Uncertainty ...............................................................................17 5.2 Uncertainty and Correlation of R(λ) ..........................................................21 5.3 Uncertainties in L*, a*, and b* ..................................................................22
Acknowledgements ................................................................................................28 References ..............................................................................................................29 Appendix A: Sample Report of Calibration for 0:45 Surface Color Appendix B: Uncertainty Analysis for Reflectance Colorimetry (Copy of Ref. 16)

LIST OF FIGURES 3.1 Typical 0:45 spectral reflectance factor of a Spectralon reference standard ..............................................................................................8 4.1 Schematic of the 0:45 reflectometer ..................................................................9 4.2 Top view of the components and optical path of the illuminator ....................10 4.3 Schematic of the optical path of the receiver ...................................................11 4.4 Spectral line spread function measured by scanning over the 546.074 nm Hg lamp emission line using variable exit slit width as listed in the legend .......................................................................12 4.5 Typical 0:45 spectral reflectance factor of cyan, deep gray, and orange check standards .............................................................................14 4.6 Control chart of the measured L* for the cyan tile. The solid lines represent the tolerance condition. ............................................15 5.1 An example of a bandpass function z0(λ) ........................................................19 5.2 An example of the error due to a 5 nm FWHM triangular bandpass of the monochromator for the measurements of a yellow BCRA tile......................................................................................20 5.3 Standard uncertainties in L*, a*, and b* ..........................................................27

LIST OF TABLES 4.1 Geometrical specifications of 0:45 reflectometer ............................................11 4.2 Sources and wavelength of emission lines used for the wavelength calibration. ........................................................................13 4.3 Spectral specifications of 0:45 illuminator ......................................................13 4.4 Comparison standards ......................................................................................15 4.5 Acceptance criteria for 0:45 test samples ........................................................16 5.1 Standard, u and expanded (k = 2), U uncertainties of the CIELAB values for each source of uncertainty for the CIE standard illuminant D65 and the CIE 1931 standard observer for selected color tiles .......................................................................25

1
1. Introduction The National Institute of Standards and Technology (NIST) have a long history in color and appearance, with many important contributions to our present understanding of color measurements. Interest in colorimetry at NIST dates back to the 1930’s [1,2]. NIST continues to take an active role in the measurement of color with the development of the Reference 0:45 Reflectometer, henceforth referred to as the 0:45 reflectometer. The primary purpose of the 0:45 reflectometer is to disseminate color standards to the color and appearance community through a set of calibrated color tiles, British Ceramic Research (BCRA) series II*. These tiles are used to transfer the NIST 0:45 color scale to other instruments. Because color often plays a major role in the acceptability of a product, this calibration service is designed to meet a demand for improved measurements and standards to enhance the color matching of products. The surface color of an object depends upon several factors – the spectral power distribution of the illuminant, the spectral sensitivity of the observer, the geometrical conditions of illumination and observation, and the optical properties of the object. Only the last factor depends upon the object, and is quantified by the spectral reflectance factor for opaque reflecting materials under the given geometrical conditions. Once the spectral reflectance factor is known, the tristimulus values are calculated for a given illuminant and observer, and from these values other quantities are derived, such as chromaticity coordinates and color space values.
The 0:45 reflectometer was designed to provide calibrated reflectance color standards with a target of ΔE*ab < 0.5 as the primary design specification. The instrument specifications were determined by a series of simulation of errors caused by the measuring instrument on the calibrated spectral reflectance of color standard and calculated color values. Particular attention was given to the inherent properties of the instrument such as stray light, band pass error, random noise, and wavelength uncertainty. The calibrations are performed at a geometry of 0° for the irradiation angle and at a measuring angle of 45°. The calibration process is carried out by measuring the reflected flux for each sample and the reference standard for wavelength from 380 nm to 780 nm in 5 nm increments. The measurements are performed for two orthogonal polarizations and averaged. Up to 20 samples can be measured automatically during a given scan. The spectral reflectance factor for each sample is determined by the ratio of the reflected radiant flux of the sample to the reflected radiant flux of a reference standard. Once the spectral reflectance factors have been determined, the color values along with their associated uncertainties can be determined for the samples. * Certain commercial equipment, instruments, or materials are identified in this paper in order to specify the experimental procedure adequately. Such identification is not intended to imply recommendation or endorsement by the National Institute of Standards and Technology, nor is it intended to imply that the materials or equipment identified are necessarily the best available for the purpose.

2
The 0:45 reflectometer consists of a source section, a sample section and a detection section. The source section consists of a dual lamp housing, a double grating monochromator, and optics that direct the incident beam towards the sample. The sample section consists of a rotating sample holder which holds and positions the sample and standards in the incident beam. The detection section consists of silicon photodiodes that measure the reflected flux and monitor the incident radiation. Comparisons and check standards ensure that instrument is operating within its uncertainties on a measurement to measurement basis while periodic realizations of the scales are used to maintain the traceability of the instrument. This document is intended to provide customers and potential customers of the 0:45 surface color measurements with a detailed overview of the capabilities and procedures used in performing the measurements. The NIST Calibration Services Program offers Service ID Number 38091S, Special Test of 0:45 Surface Color, as listed in the Surface Color and Appearance section of the Optical Radiation Measurements Chapter of the NIST Calibration Services Users Guide [3]. The measurement service quality system is based on the International Organization for Standardization (ISO), 17025 standard [4]. 2. Theory This section details the basic definitions and the relevant measurement equations to determine 0:45 reflectance factors and color values for a given measurement. The approach used in this section is based upon the concepts presented in Refs. 5-7. 2.1 Measurement Equations
According to the CIE international Lighting Vocabulary, reflectance factor is defined as the ratio of the radiant flux reflected (from a sample) in the directions delimited by a given cone angle to that reflected in the same directions by the perfect reflecting diffuser identically irradiated (same spectral composition, polarization, and geometrical distribution [8, 9]. If the cone angle is infinitely small, reflectance factor is equal to radiance factor. If the cone angle is a whole hemisphere, the reflectance factor is equal to reflectance. In this document, an infinitely small cone angle is always assumed for reflectance factor and the cone angle is not described hereinafter. The measurement of the spectral reflectance factor of a sample by the 0:45 reflectometer is performed by comparing signals from the sample and reference standard, under the same measurement conditions, at each wavelength and two orthogonal polarization of the incident radiant flux. This process is described by the measurement equation
( ) ( )( ) ( )σλ
σλσλσλ ,
,,, s
s
x x i
i
ii R
ssR ⋅= (2.1)
where λi and σ are the wavelength and polarization, respectively, of the incident radiation from the instrument illuminator, sx and ss are the measured signals from the sample and reference standard, respectively, and Rx and Rs are the reflectance factors for the sample

3
and reference standard, respectively. The 0:45 signals from the sample and the reference standard are normalized by the signals from a monitor photodiode to account for drift in the radiant flux from the illuminator. Measurements are performed at polarizations of 0°
and 90° relative to the illumination plane, so the reflectance factor of the sample for unpolarized incident radiant flux is given by
[ ])90,()0,(21)( xxx °+°= iii RRR λλλ . (2.2)
A scan means measuring the 0:45 and monitoring signals for all samples and
reference standards for the wavelength range of 380 nm to 780 nm at 5 nm increments and s and p polarization σ resulting in the reflectance factor for the samples. Μultiple scans are used to compute the final spectral reflectance factor of the samples.
Let i index the scan, j index the reference standard, and k index the signal reading. The signals from the sample are sx(λ, σ, i, k), the signals from the reference standard are ss(λ, σ, i, j, k), the signals from the monitor photodiode while measuring the sample are sm,x(λ, σ, i, k), and the signals from the monitor photodiode while measuring the reference standard are sm,s(λ, σ, i, j, k). The average signal from the sample is
∑=
=l
k
kisl
is1
xx ),,,(1),,( σλσλ , (2.3)
where l is the number of repetitions. The equation is applied similarly for the other signals ss, sm,x, and sm,s. The normalized signals N are obtained by dividing the average signals from the sample photodiode by those from the monitor photodiode, given by
),,(
),,(),,(xm,
xx is
isiNσλ
σλσλ = and (2.4)
),,,(
),,,(),,,(sm,
ss jis
jisjiNσλ
σλσλ = . (2.5)
The normalized signals are used to reduce the effect of changes in the output radiant flux from the illuminator. The ratio Qs of the reflectance factor of the reference standard to the normalized signal is given by
),,,(
),,(),,,(
s
ss jiN
jRjiQ
σλσλ
σλ = , (2.6)
and the average of these ratios for all the reference standards is given by
∑=
=m
jjiQ
miQ
1ss ),,,(1),,( σλσλ . (2.7)

4
The reflectance factor R of the sample, for each scan, wavelength, and polarization, is given by ),,(),,(),,( sx x iQiNiR σλσλσλ ⋅= . (2.8) Averaging over polarizations, usually σ = 0° and 90° with respect to the plane of incidence, yields the reflectance factor for unpolarized incident radiant flux, given by
[ ]),90,(),0,(21),( x x x iRiRiR λλλ += . (2.9)
The final spectral reflectance factor for a sample is obtained by averaging over all scans, n, given by
∑=
=n
i
iRn
R1
x x ),(1)( λλ . (2.10)
After the determination of the final reflectance factor, the methods specified in the next section are used to determine the color values for a specified observer and illuminant. Hereafter, for convenience, we will denote Rx(λ) by R(λ). 2.2 Color Values The color values determined by the 0:45 reflectometer consist of the Commission Internationale de l’Eclairage, (CIE) tristimulus values, chromaticity coordinates, and color-space values. The determination of each of these values is briefly discussed. Further details on the derivation and the application of these values can be found in reference [10, 11]. 2.2.1 CIE Tristimulus values The CIE tristimulus values can be determined by the integration of the spectral reflectance factor, R(λ), over the visible wavelength range with a set of spectral weighting factors, W(λ).
( ) ( )xX R W dλ
λ λ λ= ∫ , (2.11)
( ) ( )yY R W dλ
λ λ λ= ∫ ,
( ) ( )zZ R W dλ
λ λ λ= ∫ ,
with

5
( ) ( ) ( )xW kS xλ λ λ=
( ) ( ) ( )yW kS yλ λ λ=
( ) ( ) ( )zW kS zλ λ λ= where S(λ) is the relative spectral power of one of the CIE standard illuminants, x (λ), y (λ) and z (λ) are the color matching functions of the CIE colorimetric standard observer, and k is the normalizing factor for Y equaling 100 for the perfect diffuser. Practically, the tristimulus values are determined by a set of summations over the wavelength range. Conversion of the 2.11 equations to summations results in the following equations,
( ) ( )X k R Wλ
λ λ λ= Δ∑ , (2.12)
( ) ( )Y k R Wλ
λ λ λ= Δ∑ ,
( ) ( )Z k R Wλ
λ λ λ= Δ∑ , with
100 / ( ) ( )k S yλ
λ λ λ= Δ∑ . The CIE defines standard tables of color matching functions and illuminant spectral power distributions for the calculation of tristimulus values [12, 13]. 2.2.2 CIE Chromaticity Coordinates The relative amounts of the tristimulus values are determined by the ratio of each value to the sum of the values. The results are referred to as the chromaticity coordinates.
/( )x X X Y Z= + + (2.13)
/( )y Y X Y Z= + +
/( )z Z X Y Z= + + , these coordinates satisfy the following condition
1x y z+ + = . (2.14)

6
The chromaticity coordinates are generally specified by x and y, since the two known coordinates can be used to calculate the third coordinate. The two-dimensional plot of (x, y) is called the CIE 1931 chromaticity diagram. 2.2.3 CIE 1976 (L* a* b*) Color Space The (x, y) chromaticity coordinates specify any color of light stimuli but not the color of an object surface, which has another dimension, lightness (black to white). CIE defines two object color spaces: L*a*b* and L*u*v* [11]. In this document, L*a*b* is used to specify object colors, as it is most commonly used in the color community. This object color space is produced by plotting, in three dimensional coordinates, the quantities L*, a*, and b* defined as follow:
16116*3/1
−⎟⎟⎠
⎞⎜⎜⎝
⎛=
nYYL
⎥⎥⎦
⎤
⎢⎢⎣
⎡⎟⎟⎠
⎞⎜⎜⎝
⎛−⎟⎟
⎠
⎞⎜⎜⎝
⎛=
3/13/1
500*nn Y
YXXa (2.15)
⎥⎥⎦
⎤
⎢⎢⎣
⎡⎟⎟⎠
⎞⎜⎜⎝
⎛−⎟⎟
⎠
⎞⎜⎜⎝
⎛=
3/13/1
200*nn Z
ZYYb
where X/Xn; Y/Yn; Z/Zn > 0.01 and Xn, Yn, and Zn define the tristimulus values of the reference white that is calculated from the reflectance from a perfect diffuser. The color difference *
abEΔ between two color samples is determined from
( ) ( ) ( )[ ] 2/1222* *** baLEab Δ+Δ+Δ=Δ (2.16)
where *2
*1
*2
*1
*2
*1 * and ,* ,* bbbaaaLLL −=Δ−=Δ−=Δ and the subscripts 1 and 2 refer to
the two samples. 3. Reference Standard 3.1 Method of Calibration
The 0:45 reflectometer measures the 0:45 spectral reflectance factor of a sample by comparing the signal from the sample and a reference standard, under the same measurement conditions, at each wavelength and two orthogonal polarizations of the incident radiant flux. The reference standards are 50.8 mm square sintered PTFE, Spectralon mounted in a 101.6 mm holder with the front of the sample parallel to the front of the sample holder. There are three reference standards denoted SP01, 02, and 03. These reference standards are also used as working standards for routine calibrations.

7
The reference standards are calibrated on the Spectral Tri-function Automated Reference Reflectometer (STARR) [14]. The STARR instrument is the national reference instrument for spectral reflectance measurements of spectrally neutral, non-fluorescent samples at room temperature. STARR performs absolute measurements of bi-directional reflectance on samples with widths ranging from 50 mm (2 in) to 300 mm (12 in). The measurements are all in-plane, meaning the sample normal, illumination axis, and receiver axis, all lie within the same horizontal plane.
The major components of the STARR instrument are a source, a sample holder,
and a detector. The source system provides a collimated, monochromatic beam of light with a known polarization over the spectral region of 200 nm to 2500 nm. The goniometer is a monoplane gonio-instrument with a rotating sample table and a movable detector arm. The sample table and the detector arm can rotate at a constant distance independently of each other but normal to the plane of incidence. The goniometer varies the angle of incidence from 0º to 80º, and the viewing angle can be any value greater than 5º relative to the incident beam. The absolute reflectance is calculated from measurements of the incident and the reflected radiant fluxes obtained by rotating the detector arm. The receiver is attached to the goniometer and has a precision aperture, a lens, and a photodiode detector, either Si, or a cooled extended InGaAs. The sampling aperture, defined by the illumination beam, has a diameter of 17 mm and is located at the center of the calibration item. The maximum deviation of any ray within the illumination beam from the illumination angle is 0.36º. The entrance pupil of the receiver has an area of 796.7 mm2 and is located 671.4 mm from the sampling aperture, resulting in a solid angle of collection of 0.00177 sr. The maximum deviation of any ray within the receiver beam from the viewing angle is 1.9º.
The fundamental quantity for spectral reflectance factor measurements is the bi-directional reflectance distribution function (BRDF). For a fixed linear polarization of the incident beam and incident and viewing directions in the same plane, the measurement equation for BRDF is given by
( ) ( ) ri
rirrir ;
);;,(;;,Ω⋅
=σλ
σλθθσλθθs
sf (2.17)
where θi and θr are the incident and reflected angles, respectively, λ is the wavelength, σ is the polarization, sr and si are the signals recorded by the detector during the measurement of the reflected radiance and incident irradiance, respectively, and Ωr is the projected solid angle from the center of the area of illumination to the aperture stop of the detector. Reflectance factor, R is calculated from the BRDF by
( ) ( )σλφθφθπσλφθφθ ;;,;,;;,;, rriirrii fR ⋅= (2.18) 3.2 Uncertainty
Following the procedure for uncertainty analysis presented in Ref. [14], the relative expanded uncertainty (k=2) for the 0:45 spectral reflectance factor of Spectralon

8
is 0.4 %. The components of uncertainly are divided into those arising from random and systematic effects. The random effects, which include signal noise, result in a relative expanded uncertainty of 0.02 %. The systematic effects, which include the wavelength uncertainty, stray light, angle of reflection, aperture stop area, and the distance from the sample to the aperture stop, result in a relative expanded uncertainty of 0.2 %. 3.3 Maintenance of Reference Standards The reference standards are measured on STARR every year. The new reflectance factors are used in the 0:45 reflectometer measurements. The typical 0:45 spectral reflectance factor of a Spectralon reference standard is shown in Figure 3.1.
300 400 500 600 700 800
0.975
0.980
0.985
0.990
0.995
1.000
1.005
1.010
1.015
1.020
Polarization [deg]
0/45
Ref
lect
ance
Fac
tor
Wavelength [nm]
0 90
Figure 3.1 Typical 0:45 spectral reflectance factor of a Spectralon reference standard.
4. Reference 0:45 Reflectometer 4.1 Instrument Description and Properties
The 0:45 reflectometer consists of a monochromatic illuminator, sample wheel, and receiver on a vibration-isolation table and is described in details in ref. [5]. The illuminator and receiver are fixed while the sample wheel rotates holding up to 20 samples. A computer located adjacent to the instrument provides fully automated system control, data acquisition, and analysis. A schematic of the 0:45 reflectometer indicating the major components is shown in Fig 4.1.

9
Double Monochomator
Sample WheelReceiver
MonitorRecevier
LampHousing
Figure 4.1 Schematic of the 0:45 reflectometer consisting of a monochromatic
illuminator, sample wheel, and receivers.
The illuminator provides a monochromatic, polarized influx beam centered on the sample compartment of the sample wheel with a triangular spectral bandwidth of 5 nm at full width half maximum (FWHM). The illuminator consists of a dual-source illuminator, filter wheel, double monochromator, telecentric aperture, light chopper, ellipsoidal and flat mirrors, silica window, monitor diode, and polarizer. The monochromator dual illuminator housing holds a 150 W Xe arc lamp and a 100 W quartz-tungsten-halogen (QTH) incandescent lamp. The sources are selected by rotating a mirror. In general, the Xe lamp is used for wavelengths ≤ 460 nm and the QTH lamp is used for wavelengths > 460 nm. The filter wheel has four long-pass filters which are used for order-sorting to eliminate higher-order wavelengths from passing through the monochromator and is located between the source and entrance slit of the monochromator.
The double additive monochromator has a focal length of half meter and f/# of 7.3. The gratings are 110 mm square, 600 grooves/mm, and are blazed at 550 nm. The mirrors and gratings are coated with aluminum (Al) on a quartz substrate with an over-coating of magnesium fluoride (MgF2). The focal length of the exit mirror is 546 mm giving a mirror magnification ratio of 1.1. There is a slit height mask of 4 mm on the exit slit cemented to the inside of the slit assembly. A telecentric aperture of diameter 7.23 mm is attached to the monochromator exit slit assembly at 75 mm ± 0.3 mm from the exit slit plane and defines the convergence angle to be ± 0.95°. In a telecentric configuration, the aperture stop is placed at the focal point of the lens therefore the central ray of each bundle is parallel to the lens axis providing uniform illumination on the sample. An optical light chopper is placed after the telecentric aperture. The chopper is used to square-wave modulate the intensity of the optical signal at a stable frequency which can be amplified easily.
A 15° off-axis ellipsoidal mirror made of Al and Ni plated with a protective layer
of MgF2, surface roughness of 2 nm, f1 = 300 mm, and f2 = 900 mm is used to relay the exit slit of the monochromator to the sample plane. This mirror has a 177.8 mm focal

10
length mirror with a 3 times magnification which produces a 10 mm x 12 mm rectangular illumination area on the sample. A periscope follows the ellipsoidal mirror to steer the beam for alignment and to compensate for the difference in height between the exit slit of the monochromator and the sample plane. The polarizer is a Glan-Thompson polarizing prism with an extinction ratio of 1 x 10⁻⁶ at λ = 633 nm and is used to perform measurements for polarizations of the incident beam both parallel and perpendicular to the plane of incidence. The monitor diode is the same type as the signal diode described below. The purpose is to monitor the influx beam to correct for drift in the output of the instrument illuminator. Figure 4.2 shows a top view of the components and optical path of the illuminator.
Double Monochromator
Grating Grating
150 W Xe100 W QTH
Filter Wheel
Lamp Housing Ellipsoidal Mirror
Chopper
FlatMirror
Telecentric Aperture
Silica Window
Polarizer
MonitorDiode
FlatMirror
Figure 4.2 Top view of the components and optical path of the illuminator.
Motions of the monochromator components including the grating, port selection,
and slit width, filter wheel, and source selector are driven by precision stepper motors. The grating position is read by an absolute rotary encoder attached to the end of the grating lead screw.
The sample wheel is custom-made and is mounted on a computer control rotation
stage. The wheel is 81 cm in diameter, fabricated from one piece of aluminum, and has 20 sample compartments. Each sample compartment can be individually aligned. Samples with widths from 3 cm to 10 cm and heights from 3 cm to 20 cm can be accommodated.
The receiver measures the efflux beam from the sample at an angle of 45° and
consists of a bi-convex lens, a telecentric aperture stop, and a Si photodiode mounted in a tube. The receiver aperture is 3.55 mm in diameter and is located 3.5 mm from the receiver. The telecentric aperture is sized to provide a receiver half subtended angle of ±

11
1.36°, to closely match the geometry of STARR. The detector is underfilled with the image of the illumination area at an exitance of 45° to the sample plane. A schematic of the optical path of the receiver is shown in Fig. 4.3. A summary of the geometrical specifications of the 0:45 reflectometer is given in Table 4.1.
The receiver lens is an achromat mounted with an optimized meniscus lens with
an effective focal length of 70.5 mm and coated for low reflectance in the visible wavelength region. The receiver optical detector is a Si photodiode with UV to visible sensitivity and suppressed IR sensitivity and an active area of 10 mm x 10 mm. The current from the Si photodiode is converted to voltage by a transimpedance amplifier and measured with a lock-in amplifier which auto-ranges. The signal from the test sample is normalized to the signal from the reference standard. A signal proportional to the reflected radiant flux is measured at each wavelength and each sample for one polarization. Then, the polarization is rotated and the measurements are repeated.
300 mm
Sample
Bi-convex lens
Receiver aperturestop
Photodiode
70.5 mm3.5 mm
Figure 4.3 Schematic of the optical path of the receiver. Table 4.1 Geometrical specifications of 0:45 reflectometer Illuminator Receiver Type of geometry Directional Directional (uniplanar) Direction of axis 0° ± 0.1° 45° ± 0.1° Area 10 mm by 12 mm 20 mm by 24 mm Cone half-angle 0.30° 1.36° 4.2 Characterization of Instrument
The line spectral function (LSF) was measured by scanning several lines of emission lamps with variable entrance and exit slit widths. An example is shown in Fig. 4.4 of the 546.074 nm line of an Hg emission lamp with variable entrance and exit slit widths. An entrance slit width of 3.01 mm, exit slit width of 3.31 mm, and center slit width of 4 mm, results in a triangular spectral bandwidth at FWHM of 5 nm.
The stray-light rejection level was measured using a multimode Ar+ laser
illuminating an integrating sphere at the front entrance slit. The bandwidth was set to 5

12
nm with no polarizer in the beam path and a 22.5° mirror placed in one of the sample compartments. The stray-light rejection level was determined to be 1 x 10⁻³ 5 nm away from the set wavelength and 1 x 10⁻⁶ 15 nm away from the set wavelength.
The wavelength scale was calibrated using a 22.5° mirror at the sample position, the polarizer was removed from the beam path, and an integrating sphere illuminated with pen-ray lamps was placed at the front entrance port. The emission lamps and corresponding lines are listed in Table 4.2. These emission lines were selected for their signal strength and separation from other emission lines. The front entrance slit was set to a width of 1.73 mm, the front exit slit was set to 1.9 mm, and the center slit was set to 4 mm. Wavelength scale calibration of the monochromator relates the motor step of the grating drive to wavelength. The calibration consists of scanning a set of emission lines, calculating the motor step centroids of the lines, and fitting the wavelengths of the lines to the centroids. Single fits were able to reproduce the wavelengths of the lines to within 0.01 nm. However, the motor step centroids changed with each scan, and these changes were within 0.05 nm. Therefore, the standard uncertainty in wavelength scale is assigned to be u(λi) = 0.05 nm at all wavelengths. This provides a conservative estimate of the wavelength uncertainty without considering further details about possible wavelength dependencies. A summary of the spectral specifications of the illuminator is given in Table 4.3.
Figure 4.4 Spectral line spread function measured by scanning over the 546.074 nm
Hg lamp emission line using variable exit slit widths as listed in the legend. The entrance slit width was 0.909 of the exit slit width and the center slit width was 4 mm.
0.E+00
1.E+05
2.E+05
3.E+05
4.E+05
540 542 544 546 548 550 552
Wavelength [nm]
Sign
al [ μ
V]
0.5 mm1.1 mm2.1 mm3.1 mm3.3 mm
4 x 10⁵
0
3 x 10⁵
2 x 10⁵
1 x 10⁵
0.E+00
1.E+05
2.E+05
3.E+05
4.E+05
540 542 544 546 548 550 552
Wavelength [nm]
Sign
al [ μ
V]
0.5 mm1.1 mm2.1 mm3.1 mm3.3 mm
0.E+00
1.E+05
2.E+05
3.E+05
4.E+05
540 542 544 546 548 550 552
Wavelength [nm]
Sign
al [ μ
V]
0.5 mm1.1 mm2.1 mm3.1 mm3.3 mm
4 x 10⁵
0
3 x 10⁵
2 x 10⁵
1 x 10⁵

13
Table 4.2 Sources and wavelength of emission lines used for the wavelength
calibration.
Source Wavelength [nm] Hg 435.834 Hg 546.074 Ne 692.947 Ar 763.510
Table 4.3 Spectral specifications of 0:45 illuminator
Property Value Wavelength Range 380 nm to 780 nm/ 5nm interval Spectral Bandwidth 5 nm, triangular Stray-light Rejection less than 1.5 x 10⁻⁶
Wavelength Uncertainty 0.05 nm (standard uncertainty)
Polarization 0º (parallel to plane of illumination) 90º (perpendicular to plane of illumination)
Each sample compartment was aligned by placing a mirror and adjusting the
degrees of freedom so that the reflection was retro-reflected. Differences in the angles of illumination and viewing are less than 0.04°, based upon the angular alignment of each sample position. In addition, a set of color tiles was measured multiple times in random sample compartments of the sample wheel and no changes were found correlated with the sample compartments.
The signals are assumed to be directly proportional to the radiant fluxes reflected
by the sample and reference standard. The measured signal levels depend on the sample being measured. For dark colored samples such as black or deep gray the reflected flux is lower than for the reference standard. Therefore, several sensitivity ranges of the lock-in-amplifiers are required to cover the dynamic range. The linearity of the photodiode-amplifier-lock-in-amplifier combination was measured at the sensitivity ranges used during data acquisition. The signal levels at the detector were adjusted by scanning the wavelength of the monochromator to yield radiant flux levels at the different sensitivity ranges used in the lock-in-amplifier during measurements. The measured relative responsivity of the photodiode-amplifier combination is linear within 0.2 % for the sensitivity ranges of 50 µV to 20 mV. 4.3 Instrument Validation The purpose of validation is to ensure proper operation of the 0:45 Reflectometer and is accomplished by repeated measurements of check standards. These measurements over time provide the control charts for the instrument to track its performance. The

14
validation of the instrument includes measurements of reference, check, and comparison standards.
The reference standards are measured on STARR every year for the measurement geometry of 0:45 and the wavelength range of 380 nm to 780 nm at 5 nm increments. The reference standards are 50.8 mm square Spectralon mounted in a 101.6 mm square holder with the front of the Spectralon parallel to the front of the sample holder.
The check standards for the 0:45 reflectometer are measured every year, or after
significant changes to the instrument, to verify proper operation of the 0:45 reflectometer. The check standards are all fourteen BCRA Series II tiles, serial number NISTCS-1. The CIE Lab color space values are determined and recorded in a spreadsheet to distinguish any changes in the measured values outside of the expanded uncertainty (k = 2). The 0:45 spectral reflectance factors of selected check standards are measured during each calibration. The selected check standards are the cyan, deep grey and orange tiles of set NIST CS-1. The 0:45 spectral reflectance factors of the three selected check standards are shown in Fig. 4.5. The measured spectral reflectance factors of the tiles should be within the expanded uncertainties of the 0:45 reflectometer. Control charts are maintained for measured L, a, and b values of the check standard. Figure 4.6 is a control chart for the measured L for the cyan tile. The lines represent the tolerance condition which is based on a 95 % confidence interval of the instrument repeatability.
0.0
0.1
0.2
0.3
0.4
0.5
0.6
0.7
0.8
0.9
380 430 480 530 580 630 680 730 780
Wavelength [nm]
0/45
Ref
lect
ance
Fac
tor
CyanDeep GrayOrange
Figure 4.5 Typical 0:45 spectral reflectance factors of cyan, deep gray, and orange
check standards.

15
52.90
52.92
52.94
52.96
52.98
53.00
53.02
53.04
53.06
53.08
53.10
0 2 4 6 8 10 12
Time
Mea
sure
d L*
Figure 4.6 Control chart of the measured L* for the cyan tile. The solid lines
represent the tolerance condition.
The comparison standards are measured as needed on both the 0:45 reflectometer and on STARR to verify equivalence between the two instruments for neutral colors. The comparison standards are five neutral, matte BCRA Series II tiles, serial number NS-1, listed in Table 4.4. Table 4.4 Comparison Standards
Sample White
70 % Grey Mid Grey 40 % Grey
Black The five tiles are placed in the sample compartments of the 0:45 reflectometer along with the reference standards. The spectral reflectance factors for each tile are determined and each value is compared to the values obtained with STARR. The spectral reflectance factors should be within the combined expanded uncertainties due to random effects.

16
4.4 Calibration Services The 0:45 measurements are available at cost on submitted samples or as a set of calibrated BCRA Series II color tiles available for purchase. A preliminary discussion with NIST staff is required before the samples are submitted. Upon receipt of submitted samples, the samples are inspected and the condition is noted. Submitted samples that do not meet the minimum requirements listed in Table 4.5 require additional arrangements before acceptance. The samples will not be cleaned with the exception of dust that can be removed with an air bulb blower. The samples are kept in the original measurement container provided by the customer, and powder free gloves are used while handling the sample to prevent contamination. Table 4.5 Acceptance criteria for 0:45 test samples
Physical Damage Sample should be undamaged in the measurement area (No major scratches, chips, etc.)
Uniformity The samples should be of uniform appearance in the measurement area (i.e. smooth, no stains and no fingerprints).
Fluorescence Samples should not exhibit fluorescence upon radiation in the measurement spectrum (360 nm to 800 nm)
Cleanliness The measurement surface of the sample should be clean.
Foreign contaminants other than light dust will not be removed from the sample surface
The availability of BCRA Series II color tiles from NIST is dependent on the availability from the supplier. The color tile set consists of fourteen BCRA glossy color tiles manufactured by CERAM Research, 10 cm square. The set is divided in a wooden box containing twelve colored tiles and a twin box containing a black and a white tile. Each tile in the set is identified by its color designation. An example of the calibration report for the set of BCRA Series II tiles is provided for reference in Appendix A of this document. This report provides a description of the calibration items, the calibration method, results, and general information on the calibration. 5. Uncertainty Analysis The purpose of the 0:45 reflectometer is to provide calibrations of color standards of the highest possible quality to establish traceability which requires an estimate of the uncertainty [15]. Therefore the uncertainties in the color standard samples provided by the NIST 0:45 reflectometer are carefully determined following international accepted protocols describe in the ISO Guide to the Expression of Uncertainty in Measurement [16]. Recent publications have applied the principles of this Guide to uncertainty analysis for colorimetry, emphasizing the treatment of correlation [17,18]

17
The sources of uncertainty associated with the 0:45 reflectometer were identified from the characterization of the instrument [5]. The components of uncertainties were characterized and analyzed in [19, 20]. The procedure for determining these uncertainties follows the approach given in [21], which presents a systematic, analytical method for calculating uncertainties. Two key points are emphasized in this method. First, the measurement equation, which relates the measured signals to the reflectance factor, is the starting point for the analysis (this has been developed in section 2 of this work). Since ratios of signals are present in the measurement equation, the spectral properties of the reference reflectance reflectometer are required. Second, the effects of correlations both between signals at the same wavelength and between reflectance factors at different wavelengths must be included in the analysis. Once the uncertainties of all components in these measurements have been established, the uncertainties in the other values may be determined by the propagation of uncertainties. The systematic, analytical method for calculating uncertainties presented in reference [19] provides a step-by-step procedure for analyzing uncertainties, and this procedure is followed here. The steps are 1. Identify all independent sources of uncertainty. 2. Assign standard uncertainties to these sources of uncertainty. 3. Calculate the standard uncertainty (called uncertainty contribution) in spectral
reflectance factor, u(R(λi)), for each source of uncertainty, using the measurement equation and taking any correlations between signals at the same wavelength into account.
4. Calculate the correlation coefficient between spectral reflectance factors at different wavelengths, r(R(λi), R(λj)), for each source of uncertainty.
5. Calculate the sensitivity coefficient for each color space value Γ with respect to R(λi). 6. Calculate the uncertainty contribution in each color space value, u(Γ), using the results
from steps 3 and 4 for each source of uncertainty. 7. Calculate the combined standard uncertainty, uc, in each color space value according
to the uncertainty propagation principle. 8. Calculate expanded uncertainty, U, with a coverage factor (k = 2). 5.1 Sources of Uncertainty
The sources of uncertainty associated with the 0:45 reflectometer are mainly the signals from the sample and reference standard, the wavelength of the monochromator, bandpass of the monochromator, and the reflectance factor of the reference standard. The uncertainties in L*, a*, and b* from these sources of uncertainty are evaluated for a set of color tiles, which are available as calibrated standards from NIST. Therefore, in the following the terms sample and color tile are synonymous.
Uncertainties in the L*, a*, and b* values caused by random effects, primarily
signal noise in both the sample and monitor receivers, are evaluated by Type A methods and are given by the standard deviations, u1, of the values from ten repeat measurements.

18
Uncertainties in the signals caused by systematic effects are evaluated by Type B methods and are non-linearity of the signal from the sample relative to the signal from the reference standard, and the effect of stray-light on both signals. Mis-alignment of the specimen is a possible source of uncertainty and is a result of a difference in angle or location, with respect to the reference plane, between the specimen and reference standard. Differences in the angles of illumination and viewing are less than 0.04°, based upon the angular alignment of each sample position. The changes in reflectance factors resulting from these differences were evaluated for each color tile using the reference reflectometer, and found to be negligible. Because the receiver is a telecentric optical system, and the size of the sampling aperture is less than the field-of-view of the receiver at the reference plane, differences in location between the specimen and reference standard with respect to the reference plane have no effect on the measured reflectance factor of a uniform sample.
The signals are assumed to be directly proportional to the radiant fluxes reflected
by the sample and reference standard. However, non-linearity of the detector results in the ratio of the signals not being equal to the ratio of the reflected fluxes. Non-linearity arises both within the ranges of the current-to-voltage and lock-in amplifiers and between ranges of the lock-in amplifier. The relative standard uncertainty in the signal from the sample due to non-linearity is
002.0),()),((1 =
σλσλ
ix
ix
SSu (5.1)
Stray-light is radiant flux that reaches the detector at wavelengths outside the nominal spectral bandwidth of the instrument, which contributes to the signal. This contribution depends upon the spectral distribution of the illuminator, the spectral reflectance of both the sample and reference standard, and the responsivity of the receiver. The stray-light rejection of the monochromator is less than 10-6 at wavelengths 10 nm and larger from the set wavelength, and 10-3 at wavelengths 5 nm from the set wavelength. Therefore, the estimated error in the signals due to stray-light is given by ( ) [ ]∑ ++−+⋅= −−
'
36 ),5(),5(1010),'(),(λ
σλσλσλσλε iii ssss (5.2)
where s is the signal from either the sample or reference standard and the summation is over all wavelengths from 350 nm to 1100 nm for the source used at wavelength λi, excluding those at wavelengths of λi – 5 nm, λi, and λi + 5 nm. The wavelength calibration of the monochromator was discussed in Section 4.2 and resulted in a standard uncertainty in wavelength of u(λi) = 0.05 nm at all wavelengths.
The bandpass of the monochromator can cause errors when the spectral reflectance factor curve is not linear within the full-bandwidth of the bandpass, and can cause significant errors where spectral reflectance factor curves change rapidly, e.g., for

19
saturated color samples. The measured spectral reflectance factor is a convolution of the true reflectance factor and the normalized bandpass function. At each wavelength point, measured reflectance factor Rm (λ0 ) is calculated as a product of the true spectral reflectance factor R(λ) and the normalized bandpass function z0(λ), thus,
Rm (λ0 ) = R(λ0 − λ)
λ∫ ⋅ z(λ0 − λ) dλ with z(λ) =1
λ∫ . (5.3)
An example of the bandpass function z0(λ) is shown in Fig. 5.1.
0.0
0.5
1.0
1.5
-10 -5 0 5 10l (nm)
Nor
mal
ized
Ban
dpas
s Fu
nctio
n
Fig. 5.1 An example of a bandpass function z0(λ). To estimate this error without knowing the true reflectance factor R(λ), the measured data is used as R(λ) for an approximation. The spectral reflectance factor data is first interpolated to 1 nm interval, and the z(λ) function (normally a triangular function) also prepared at 1 nm intervals, normalized so that the sum of all z(λ) values is equal to 1, then a sum-product calculation is performed as given in Eq. (5.3). The relative error due to the bandpass can be evaluated by looking at the difference between Rm (λ) and R(λ).
εB,rel (λ) =
Rm (λ) − R(λ)R(λ)
(5.4)
In substitution measurements, this error tends to be cancelled out if the sample and reference standard have similar spectral reflectance factor curves. In this case, the relative error for the sample )(samplerel,B, λε and for the reference standard εB,rel,std (λ) can be calculated, respectively, and the substitution error εB,sub(λ) in the measured test sample is given by
)()()( stdrel,B,samplerel,B,subB, λελελε −= (5.5) An example of the calculation of bandpass error for a yellow BCRA tile for a triangular bandpass of 5 nm (FWHM) is shown in Fig. 5.2.

20
-0.2
0.0
0.2
0.4
0.6
0.8
1.0
350 400 450 500 550 600 650 700 750Wavelength (nm)
Ref
lect
ance
fact
or
-0.5%
0.0%
0.5%
1.0%
1.5%
2.0%
2.5%
Erro
r (%
) in
Ref
lect
ance
Fac
tor
BCRA yellow
(%)Error
Fig. 5.2 An example of the error due to a 5 nm (FWHM) triangular bandpass of the
monochromator for the measurement of a yellow BCRA tile. The corresponding error in color difference is ΔEab
* = 0.09. The error in a color quantity Γ (such as L*, a*, b*) is given by calculating the color quantity value from Rm (λ) and R(λ),
))(())(()(subB, λλε RRm Γ−Γ=Γ (5.6)
If this error is not corrected, this estimated error is converted to a standard uncertainty by
3/)()( subB,2 Γ=Γ εu (5.7)
The calculation presented above is only for estimation of error. For correction of bandpass errors, other methods [22, 23] are available. The relative standard uncertainties due to random and systematic effects during the calibration of the reference standards with STARR are
0002.0),()),((
s
s3 =σλσλ
i
i
RRu and (5.8)
002.0),()),((
s
s4 =σλσλ
i
i
RRu , (5.9)

21
respectively, and are both evaluated using Type B methods for the uncertainty analysis of the 0:45 reflectometer. 5.2 Uncertainty and Correlation of R(λ) Determining the standard uncertainty u(R(λi)) for each source of uncertainty caused by systematic effects uses Eqs. (2.1) and (2.2), which relate the reflectance factor of the sample to the signals and the reflectance factor of the reference standard, and the reflectance factor for unpolarized incident radiant flux to the reflectance factors when the incident radiant flux is polarized. Beginning with polarized incident radiant flux, from Eq. 2.1, the standard uncertainty due to uncertainties in the signals is given by
( ) ( ) ( )
( ) ( ) ( )),(),,(),(),(
),(),(2
),(),(
),(),(
),(),(
xx
x
2s
s2
2x
x2
2
2
σλσλσλσλ
σλσλ
σλσλ
σλσλ
σλσλ
isiis
is
i
i
i
i
i
i
i
i
ssrssu
ssu
ssu
ssu
RRu
−
+= (5.10)
For non-linearity of the signal from the sample, u(ss(λi, σ) = 0 and Eq. 5.10 reduces to
( ) ( )),(),(
),(),( 45
σλσλ
σλσλ
ix
ix
i
i
ssu
RRu
= . (5.11)
For stray-light effects on both signals, the correlation coefficient r(sx(λi, σ), ss(λi, σ)) = 1 and Eq. 5.10 reduces to
( ) ( ) ( )⎥⎦
⎤⎢⎣
⎡−=
),(),(
),(),(
),(),( s556
σλσλ
σλσλ
σλσλ
is
i
ix
ix
i
i
ssu
ssu
RRu . (5.12)
The uncertainty in R due to the wavelength uncertainty is also fully correlated between the signals from the sample and the reference standard, and the relative standard uncertainty is given by
( ) )(),(
),(
),(),(7 λ
λσλ
σλ
σλσλ u
SS
RRu is
ix
is
i ⋅∂
⎟⎠⎞⎜
⎝⎛∂
= . (5.13)
Proceeding to unpolarized incident radiant flux, from Eq. 2.2, the reference standard uncertainty is given by

22
( ) ( ) ( )
( ) ( ) ( ))90,(),0,()90,()0,(21
)90,(41)0,(
41)( 222
°°⋅°°+
°+°=
iiii
iii
RRrRuRu
RuRuRu
λλλλ
λλλ (5.14)
Assuming the sources of uncertainty are completely correlated between polarizations, so r(R(λi,0°), R(λi,90°)) = 1 and Eq. 5.14 reduces to
( ) ( ) ( )[ ])90,()0,(21)( °+°= iii RuRuRu λλλ . (5.15)
From Eq. 5.10, the correlation coefficients r(R(λi), R(λj)) between reflectance factors at wavelengths λi and λj are needed for the calculation of uncertainties in L*, a*, and b*. For uncertainties caused by non-linearity of the signal, the correlation coefficient is one, while for uncertainties caused by stray-light the correlation coefficient is
⎟⎟⎠
⎞⎜⎜⎝
⎛−⋅⎟⎟
⎠
⎞⎜⎜⎝
⎛−=
)(1
)(1sgn
)(1
)(1sgn))(),((
ss jjxiixji ssss
RRrλλλλ
λλ . (5.16)
However, since ss > sx at all wavelengths for the reference standard used, the correlation coefficient is one. For uncertainties caused by wavelength, which are treated as constant in magnitude and sign at all wavelengths, the correlation coefficient is
⎟⎟⎟⎟
⎠
⎞
⎜⎜⎜⎜
⎝
⎛
∂
⎟⎠⎞
⎜⎝⎛∂
⋅⎟⎟⎟⎟
⎠
⎞
⎜⎜⎜⎜
⎝
⎛
∂
⎟⎠⎞⎜
⎝⎛∂
=λ
λλ
λλ
λ
λλ)(
)(
sgn)(
)(
sgn))(),(( s
x
s
xj
j
i
i
ji
ss
ss
RRr , (5.17)
while for uncertainties caused by the reflectance factor of the reference standard, the correlation coefficient is zero for those caused by random effects and is assumed to be one for those caused by systematic effects. 5.3 Uncertainties in L*, a*, and b* The uncertainties in L*, a*, and b* are obtained by propagating the uncertainties in R(λi) using
))(())(())(),(()()(
2
))(()(
)(
1
1 1
22
1
2
jijij
m
i
m
ij i
i
m
i i
RuRuRRrRR
RuR
u
λλλλλλ
λλ
⋅⋅⋅⎟⎟⎠
⎞⎜⎜⎝
⎛
∂Γ∂
⎟⎟⎠
⎞⎜⎜⎝
⎛∂
Γ∂+
⎟⎟⎠
⎞⎜⎜⎝
⎛∂
Γ∂=Γ
∑ ∑
∑−
= +=
= (5.18)

23
where Γ represents any of the color space values, u(R(λi)) is the standard uncertainty of the reflectance factor at wavelength λi, and r(R(λi), R(λj)) is the correlation coefficient between reflectance factors at different wavelengths. The sensitivity coefficients are given by
)(13
116)(
* 31
n2 iy
i
WYYR
L λλ
⋅⎟⎟⎠
⎞⎜⎜⎝
⎛=
∂∂
, (5.19)
)(13
500)(13
500)(
* 31
n2
31
n2 iyix
i
WYY
WXXR
a λλλ
⋅⎥⎥
⎦
⎤
⎢⎢
⎣
⎡
⎟⎟⎠
⎞⎜⎜⎝
⎛−⋅
⎥⎥
⎦
⎤
⎢⎢
⎣
⎡
⎟⎟⎠
⎞⎜⎜⎝
⎛=
∂∂
, and (5.20)
)(13
200)(13
200)(
* 31
n2
31
n2 iziy
i
WZZ
WYYR
b λλλ
⋅⎥⎥
⎦
⎤
⎢⎢
⎣
⎡
⎟⎟⎠
⎞⎜⎜⎝
⎛−⋅
⎥⎥
⎦
⎤
⎢⎢
⎣
⎡
⎟⎟⎠
⎞⎜⎜⎝
⎛=
∂∂
. (5.21)
The uncertainties in L*, a*, and b* for a set of color tiles available from NIST as calibrated standards were calculated for each source of uncertainty for CIE Standard Illuminant D65 and the 1931 CIE 2° Standard Observer. The uncertainties caused by random effects were calculated from the standard deviations of L*, a*, and b* from repeat measurements of each color tile. Therefore, only systematic effects are considered for other sources of uncertainty. The results are given in Table 5.1 for a representative set of color tiles. The expanded uncertainty U is the root-sum-square of the standard uncertainties from all the sources, multiplied by a coverage factor k = 2. The uncertainties for the CIE 1964 Standard Observer are similar to those in Table 5.1. Except for the uncertainties caused by repeatability, which change slightly with each set of measurements of a color tile set, the other uncertainties are those listed in the calibration report that accompanies a set of calibrated color tiles. Color difference and combined color uncertainty are two distinct yet related concepts in color space. The following discussion is meant to provide a simple approach on the relationship between the two; a full analysis is beyond the scope of this paper. Color difference ΔE*ab in the CIELAB color space applies to comparisons between the color space values of two different specimens, or to a single specimen measured by two different instruments. The color difference is given by 222
ab* *)(*)(*)( baLE Δ+Δ+Δ=Δ , (5.22)
where ΔL*, Δa*, and Δb* are the differences in color space values. Combined color uncertainty ΔE applies to a single measurement on a single specimen, and is given by *)(*)(*)( 222 buauLuE ++=Δ . (5.23)

24
The combined color uncertainty assists with interpreting a color difference. Let ΔE1 and ΔE2 be the combined color uncertainties of two different specimens, or a single specimen measured by two different instruments. If the relationship ΔE*ab < 2
22
1 )()( EE Δ+Δ is valid, then the color space values agree within the limits imposed by the uncertainties. If the relationship is not valid, then the color space values disagree. Values of ΔE for all the color tiles are given in Table 5.1. Note that the expanded, combined color uncertainties are all less than 0.5, indicating that the design goal for the NIST 0:45 reflectometer was met for all the standard color tiles. Since tables of numbers are often difficult to easily interpret, the uncertainties for selected color tiles (those used in Ref. [19]) are presented in Fig. 5.3. The two most significant differences between the previous analysis presented in ref. [19] and the one presented here are the inclusion of the polarization of the incident radiant flux and evaluating the effects of signal noise from repeat measurements rather than assuming a constant noise of 0.1 % for all signals. Other differences are an uncertainty from an non-linearity of the signal of 0.2 % rather than 0.1 %, a more sophisticated calculation of the contribution to the signals from stray-light rejection level by including signals from both sources over the entire wavelength range of responsivity of the silicon detector, and an improved wavelength uncertainty of 0.05 nm rather than 0.1 nm. The standard uncertainties of the reference standard remained unchanged. Several generalities and conclusions can be drawn from Table 5.1 and Figure 5.3. For the neutral color tiles (black, deep gray, mid gray, diff gray, pale gray, and white), there is negligible uncertainty due to stray-light and wavelength since the spectral shapes of the reflectance factors of these samples are similar to that of the reference standard. The uncertainties due to signal non-linearity affect only the uncertainty in L* and are generally directly proportional to L*, whereas uncertainties due to repeatability affect the uncertainties in L*, a*, and b* and are generally inversely proportional to L*. For the colored color tiles (deep pink, red, orange, yellow, green, diff green, cyan, and deep blue), uncertainties from all the sources contribute to the combined uncertainties in L*, a*, and b*. Uncertainties due to repeatability affect all the color space values, and are roughly directly proportional to L*, as are uncertainties due to signal non-linearity. Uncertainties due to signal stray-light depend on the spectral shape of the reflectance factor, and are largest for those colors with rapid changes from low to high reflectance factor (red, orange, and yellow). Overall, those color tiles whose reflectance factors have a spectral shape similar to that of the reference standard have the lowest uncertainties in color space values.

25
Table 5.1 Standard, u, and expanded (k = 2), U, uncertainties of the CIELAB values for each source of uncertainty for CIE Illuminant D65 and the CIE 1931 Standard Observer and the indicated color tiles. The standard uncertainties are u1 – repeatability, u2 – bandpass of the monochromator, u3 – random effects from the calibration of the reference standard, u4 – systematic effects from the calibration of the reference standard, u5 – non-linearity of the signals due to non-linearity of the detectors, u6 – stray light effects, and u7 – wavelength of the monochromator.
Color Tile Value Standard Uncertainty uc U
u1 u2 u3 u4 u5 u6 u7
Black
L* 5.63 0.025 0.000 0.000 0.014 0.014 0.005 0.000 0.03 0.06a* -1.36 0.043 0.002 0.001 0.001 0.001 0.005 0.001 0.04 0.09b* 0.05 0.060 -0.001 0.001 0.000 0.000 0.021 0.000 0.06 0.13ΔE 0.078 0.002 0.001 0.014 0.014 0.022 0.001 0.08 0.17
Deep Gray
L* 26.97 0.005 0.000 0.001 0.029 0.029 0.004 0.000 0.04 0.08a* -0.14 0.007 0.003 0.002 0.000 0.000 0.003 0.000 0.01 0.02b* 1.33 0.032 -0.003 0.001 0.001 0.001 0.017 0.001 0.04 0.07ΔE 0.033 0.004 0.002 0.029 0.029 0.018 0.001 0.06 0.11
Mid Gray
L* 57.63 0.004 0.000 0.001 0.049 0.049 0.000 0.000 0.07 0.14a* -0.15 0.014 0.000 0.003 0.000 0.000 0.000 0.000 0.01 0.03b* 0.55 0.018 -0.003 0.003 0.000 0.000 0.001 0.000 0.02 0.04ΔE 0.023 0.003 0.004 0.049 0.049 0.001 0.001 0.07 0.15
Diff Gray
L* 58.21 0.003 0.000 0.001 0.049 0.049 0.000 0.000 0.07 0.14a* -2.50 0.007 0.002 0.003 0.002 0.002 0.000 0.001 0.01 0.02b* 2.41 0.011 -0.004 0.003 0.002 0.002 0.001 0.004 0.01 0.03ΔE 0.013 0.004 0.004 0.050 0.050 0.001 0.005 0.07 0.14
Pale Gray
L* 83.43 0.002 0.000 0.001 0.066 0.066 0.000 0.000 0.09 0.19a* -0.41 0.008 0.000 0.004 0.000 0.000 0.000 0.000 0.01 0.02b* 0.37 0.011 -0.005 0.003 0.000 0.000 0.001 0.001 0.01 0.02ΔE 0.014 0.005 0.005 0.066 0.066 0.001 0.001 0.10 0.19

26
Color Tile Value Standard Uncertainty uc U
u1 u2 u3 u4 u5 u6 u7
White
L* 95.99 0.010 0.000 0.001 0.075 0.075 0.000 0.000 0.11 0.21a* -0.41 0.007 0.001 0.004 0.000 0.000 0.000 0.001 0.01 0.02b* 1.13 0.010 -0.006 0.004 0.001 0.001 0.001 0.001 0.01 0.02ΔE 0.015 0.006 0.006 0.075 0.075 0.001 0.001 0.11 0.21
Deep Pink
L* 40.47 0.008 0.006 0.001 0.038 0.038 0.005 0.011 0.06 0.11a* 30.12 0.022 -0.008 0.002 0.020 0.020 0.006 0.006 0.04 0.08b* 5.32 0.037 0.004 0.002 0.004 0.004 0.017 0.032 0.05 0.11ΔE 0.044 0.011 0.003 0.043 0.043 0.018 0.035 0.09 0.17
Red
L* 38.00 0.011 0.013 0.001 0.036 0.036 0.011 0.023 0.06 0.12a* 52.65 0.015 -0.019 0.002 0.035 0.035 0.015 0.032 0.06 0.12b* 36.56 0.032 0.018 0.002 0.025 0.025 0.140 0.037 0.15 0.31ΔE 0.037 0.029 0.002 0.056 0.056 0.141 0.049 0.18 0.35
Orange
L* 65.89 0.010 0.002 0.001 0.055 0.055 0.005 0.022 0.08 0.16a* 40.35 0.025 -0.030 0.002 0.027 0.027 0.005 0.036 0.07 0.13b* 60.88 0.086 -0.001 0.002 0.041 0.041 0.085 0.035 0.14 0.28ΔE 0.090 0.030 0.004 0.073 0.073 0.086 0.055 0.17 0.35
Yellow
L* 83.63 0.008 -0.004 0.001 0.066 0.066 0.002 0.010 0.09 0.19a* -4.49 0.027 0.013 0.004 0.003 0.003 0.006 0.027 0.04 0.08b* 84.87 0.039 -0.050 0.002 0.057 0.057 0.087 0.026 0.14 0.27ΔE 0.048 0.052 0.005 0.087 0.087 0.087 0.039 0.17 0.34
Green
L* 53.44 0.012 -0.002 0.001 0.046 0.046 0.001 0.008 0.07 0.13a* -35.79 0.044 0.036 0.003 0.024 0.024 0.005 0.012 0.07 0.13b* 15.80 0.036 -0.023 0.002 0.011 0.011 0.010 0.043 0.06 0.13ΔE 0.058 0.043 0.004 0.053 0.053 0.011 0.045 0.11 0.23
Diff Green
L* 53.66 0.013 -0.002 0.001 0.046 0.046 0.001 0.007 0.07 0.13a* -35.77 0.034 0.037 0.003 0.024 0.024 0.005 0.009 0.06 0.12b* 19.81 0.026 -0.025 0.002 0.013 0.013 0.013 0.042 0.06 0.12ΔE 0.044 0.044 0.004 0.054 0.054 0.014 0.044 0.11 0.22
Cyan
L* 50.88 0.012 0.004 0.001 0.045 0.045 0.002 0.015 0.07 0.13a* -13.64 0.048 0.000 0.003 0.009 0.009 0.003 0.043 0.07 0.13b* -33.00 0.030 0.011 0.003 0.022 0.022 0.005 0.032 0.06 0.11ΔE 0.058 0.012 0.004 0.051 0.051 0.006 0.055 0.11 0.22
Deep Blue
L* 9.95 0.005 0.003 0.000 0.017 0.017 0.014 0.004 0.03 0.06a* 22.65 0.119 0.000 0.002 0.015 0.015 0.023 0.025 0.13 0.25b* -32.64 0.108 -0.005 0.001 0.022 0.022 0.008 0.029 0.12 0.23ΔE 0.161 0.006 0.002 0.032 0.032 0.029 0.038 0.17 0.35

27
Figure 5.3 Standard uncertainties in L*, a*, and b* caused by the indicated sources of
uncertainty for selected samples for CIE Standard Illuminant D65 and the CIE 1964 Standard Observer. The standard uncertainties are u1 – repeatability, u2 – bandpass of the monochromator, u3 – random effects from the calibration of the reference standard, u4 – systematic effects from the calibration of the reference standard, u5 – non-linearity of the signals due to non-linearity of the detectors, u6 – stray light effects, and u7 – wavelength of the monochromator.
Red
-0.04
-0.02
0.00
0.02
0.04
0.06
0.08
0.10
0.12
0.14
0.16
u1 u2 u3 u4 u5 u6 u7
Source of Uncertainty
Stan
dard
Unc
erta
inty
L*a*b*
Mid Gray
-0.04
-0.02
0.00
0.02
0.04
0.06
0.08
0.10
0.12
0.14
0.16
Source of Uncertainty
Stan
dard
Unc
erta
inty
L*a*b*
u1 u2 u3 u4 u5 u6 u7
Red
-0.04
-0.02
0.00
0.02
0.04
0.06
0.08
0.10
0.12
0.14
0.16
u1 u2 u3 u4 u5 u6 u7
Source of Uncertainty
Stan
dard
Unc
erta
inty
L*a*b*
Mid Gray
-0.04
-0.02
0.00
0.02
0.04
0.06
0.08
0.10
0.12
0.14
0.16
Source of Uncertainty
Stan
dard
Unc
erta
inty
L*a*b*
u1 u2 u3 u4 u5 u6 u7

28
Acknowledgments
The success of the measurement service for 0:45 Color measurements was aided by the efforts of Dr. Gerald Fraser and Dr. Yoshihiro Ohno.

29
References 1. D. B. Judd and G. Wyszecki, Color in Business, Science, and Industry (3rd ed.), John
Wiley & Sons, Inc., New York, 1975. 2. D. B. Judd, “Contributions to Color Science”, NBS Special Publication 545, U. S.
Dept of Commerce (1979). 3. NIST Calibration Program: Calibration Services Users Guide, SP 250 Appendix Fee
Schedule 2007. 4. ISO/IEC Guide 17025:2005, “General Requirements for the Competence of Testing
and Calibration Laboratories.” 5. M. E. Nadal and E. A. Early, “0:45 NIST Reference Reflectometer,” accepted for
publication in Color Res. Appl 6. R.W.G. Hunt, “Measuring Color”, 3rd ed”, Fountain Press, England, 1998. 7. G. Wyszecki and W.S. Styles “Color Science: Concepts and Methods, Quantitative
Data and Formulae” Wiley-Interscience, 2000. 8. Standard Terminology of Appearance, E284. West Conshohocken, Pennsylvania:
American Society for Testing and Materials; 1999.ASTM “Standards on Color and Appearance Measurements, 6th edition”, American Society for Testing and Materials, 2000.
9. CIE Publication no. 17.4, CIE International Lighting Vocabulary (1987). 10. Standard Practice for Computing the Colors of Objects by Using the CIE System,
E308. West Conshohocken, Pennsylvania: American Society for Testing and Materials; 2000.
11. CIE Publication No. 15:2004, Colorimetry, Vienna, Austria. 12. CIE S014-1/E:2006: Colorimetry – Part I: CIE Standard Colorimetric Observer. 13. CIE S014-2/E:2006: Colorimetry – Part II: CIE Standard Illuminants. 14. P. Y. Barnes, E. A. Early, and A. C. Parr, “NIST Measurement Services: Spectral
Reflectance,” NIST Spec. Pub. 250-48, U. S. Dept. of Commerce (1998). 15. ISO, International Vocabulary of Basic and General Terms in Metrology, second
edition (International Organization for Standardization, Geneva, Switzerland, 1993), definition 6.10.
16. Guide to the Expression of Uncertainty in measurement. Geneva: International Organization for Standardization; 1993.
17. J. L. Gardner and R. B. Frenkel, “Correlation coefficients for Tristimulus Response Value Uncertainties,” Metrologia, 36, 477-480 (1999).
18. J. L. Gardner, “Uncertainty Estimation in Colour Measurement,” Color Res. Appl., 25, 349-355 (2000).
19. E. A. Early and M. E. Nadal, “Uncertainty Analysis for Reflectance Colorimetry,” Color Res. Appl., 29, 205-216 (2004).
20. E. A. Early and M. E. Nadal, “Uncertainty Analysis for the 0:45 Reference Reflectometer,” accepted for publication in Color Res. Appl.
21. B. N. Taylor and C. E. Kuyatt, “Guidelines for Evaluating and Expressing the Uncertainty of NIST Measurement Results,” Natl. Inst. Stand. Technol. Tech. Note 1297 (1994).

30
22. E. I. Stearns and R. E. Stearns, “An Example of a Method for Correcting Radiance Data for Bandpass Error,” Color Res. Appl. 13-4, 257-259 (1988).
23. Y. Ohno, “A Flexible Bandpass Correction Method for Spectrometers,” Proc. AIC’05 Granada, Spain, May 9-13, 2005, pp. 697-700 (2005).

REPORT OF CALIBRATION 38091S 0:45 Surface Color Color Tile Set Any Company, Inc. Serial No.: NISTCS-XX
1
Appendix A
REPORT OF CALIBRATION 38091S 0:45 Surface Color
for
Color Tile Set
Submitted by:
Any Company, Inc. Attn.: Ms. Jane Doe
123 Calibration Street Measurement City, MD 20800-1234
(See your Purchase Order No. 12345, dated January 1, 2006)
1. Description of Calibration Items One color tile set consisting of fourteen BCRA glossy color tiles manufactured by CERAM Research, 10 cm square, set number NISTCS-XX, supplied by NIST. The set is divided into a wooden box containing twelve colored tiles and a twin box containing a black and a white tile. Each tile in the set is identified by its color designation. 2. Description of Calibration The surface color of an item depends on the spectral power distribution of the illuminant, the spectral responsivity of the observer, the geometrical conditions of illumination and observation, and the optical properties of the item. Only the last factor depends on the item, and is quantified by the spectral reflectance factor. The spectral reflectance factor R is the ratio of the radiant flux reflected by the item to the radiant flux that would be reflected by a perfect Lambertian diffuser, under identical measurement conditions, as a function of wavelength. The designation 0:45 refers to the bi-directional geometry of the measurement, where the illumination angle is 0º and the viewing angle is 45º. The calibration items were measured using the NIST 0:45 Reference Reflectometer. A spherical mirror focuses radiant flux from a source through an order-sorting filter onto the entrance slit of a ½ m double-grating monochromator. The beam emerging from the exit slit of the monochromator is incident on a circular aperture and focused by an elliptical mirror in a telecentric arrangement, passes through a Glan-Taylor polarizer, and is incident upon the item. Radiant flux reflected from the item is collected by a receiver consisting of a lens and circular aperture in a telecentric arrangement and a Si

REPORT OF CALIBRATION 38091S 0:45 Surface Color Color Tile Set Any Company, Inc. Serial No.: NISTCS-XX
2
photodiode. A sample wheel with twenty positions contains the measured items. At each wavelength and polarization, signals are measured from each position of the sample wheel containing an item. These signals are proportional to the reflected radiant flux. Since the receiver uses a lock-in amplifier to measure the signal from the detector, no dark signals are measured. Measuring the 0:45 spectral reflectance factor of the calibration items is a relative measurement and therefore requires comparison to a transfer standard with a calibrated 0:45 spectral reflectance factor. The transfer standard is Spectralon, a sintered polytetrafluoroethylene (PTFE) manufactured by Labsphere, Inc., whose 0:45 spectral reflectance factor was determined using the NIST Spectral Tri-function Automated Reference Reflectometer (STARR) [1]. Three Spectralon standards and the calibration items were cleaned with an air bulb and mounted in the sample wheel with the front surfaces aligned normal to the illumination beam and at the same distance from the receiver aperture. The sampling aperture, defined by the illumination beam, was 10 mm by 12 mm and was located at the center of the reference standards and calibration items. The angle of illumination was 0º from the normal of the item, and the maximum deviation of any ray within the illumination beam from the angle of illumination was 0.92º. The angle of viewing was 45º from the normal of the item, the solid angle of collection was 0.00176 sr, and the maximum deviation of any ray within the receiver beam from the angle of viewing was 1.36º. This geometry is designated as 0:45. The reference standards and calibration items were measured at wavelengths from 380 nm to 780 nm every 5 nm. The spectral bandwidth of the illumination beam was 5 nm. The source was a Xe arc lamp for wavelengths of 460 nm and shorter and a quartz-tungsten-halogen incandescent lamp for longer wavelengths. Each reference standard and calibration item was measured three times for polarizations of the illumination beam both parallel and perpendicular to the plane of illumination 3. Results of Calibration The reflectance factor R at each wavelength λ and polarization σ is given by
),(),(),(),( σλ
σλσλσλ s
s
RSSR ⋅= , 3.1
where S and Ss are the measured signals from the item and reference standard, respectively, and Rs is the reflectance factor of the reference standard. The final 0:45 spectral reflectance factor was obtained by averaging the values from multiple scans. The certified 0:45 spectral reflectance factor of each calibration item, measured according to the details given above, is given in Tables 1 to 14.

REPORT OF CALIBRATION 38091S 0:45 Surface Color Color Tile Set Any Company, Inc. Serial No.: NISTCS-XX
3
The tristimulus values X, Y, and Z of each item were calculated for CIE standard illuminant D65 and CIE 1931 standard observer [2]. The chromaticity coordinates x and y were derived from the tristimulus values [3]. The tristimulus values, for reflectance factors regularly spaced in wavelength, are given by
∑=
⋅=m
iii RWX
1x, , 3.2
∑=
⋅=m
iii RWY
1y, , and 3.3
∑=
⋅=m
iii RWZ
1z, , 3.4
where i indexes the wavelengths, Wx,i, Wy,i, and Wz,i are the normalized tristimulus weighting factors for a particular illuminant and observer combination, and Ri is the spectral reflectance factor. The chromaticity coordinates are given by
ZYXXx
++= and 3.5
ZYXYy
++= . 3.6
The tristimulus value Y and chromaticity coordinates x and y for CIE standard illuminant D65 and CIE 1931 standard observer of each of the calibrated items is given in Table 15. Uncertainties were calculated according to the procedures outlined in Reference 4 and 5]. From the measurement equation for the spectral reflectance factor, Eq. (3.1), uncertainties in S, Ss, Rs, and λ all contribute to an uncertainty in R. An important consideration for determining the uncertainty in R is correlations between signals S and Ss at the same wavelength. The uncertainties in Y, x, and y were calculated by propagating the uncertainties in the spectral reflectance factor thorough the calculations, including correlations between the uncertainties in R at different wavelengths. The sources of uncertainty are signal noise, offset in the signal, and uncertainties in the reference standard and the wavelength. Signal noise is the result of random processes in both the source and the detector. Offsets in the signal include non-linearity and stray light. Non-linearity is a deviation of the signal from proportionality with the radiant flux as the signal changes value. Stray light is radiant flux that reaches the detector at wavelengths outside the nominal spectral bandwidth of the instrument. The reference standard has an uncertainty from its calibration, and there is an uncertainty associated with the wavelength setting of the measuring instrument.

REPORT OF CALIBRATION 38091S 0:45 Surface Color Color Tile Set Any Company, Inc. Serial No.: NISTCS-XX
4
The uncertainties from signal noise include source stability and detector noise. The uncertainty contributions caused by these effects were evaluated by multiple measurements of the items. The uncertainties from non-linearity, stray light, wavelength, and reference standard were evaluated as part of the characterization of the 0:45 Reference Reflectometer and their values are given in Table 16. The expanded uncertainty was obtained from the root-sum-square of the uncertainty contributions multiplied by a coverage factor k = 2. The expanded uncertainty in 0:45 spectral reflectance factor of each calibration item is given in Tables 1 to 14. The expanded uncertainties in tristimulus value and chromaticity coordinates of each calibration item are given in Table 15. 4. General Information 1) The values in Tables 1 to 15 apply only to the central 10 mm by 12 mm area of the
calibration item. 2) This calibration report may not be reproduced except in full without the written
consent of this Laboratory. Prepared by: Approved by: Maria E. Nadal Gerald T. Fraser Optical Technology Division For the Director, Physics Laboratory National Institute of (301) 975-4632 Standards and Technology
(301) 975-3797 References: [1] P. Y. Barnes, E. A. Early, and A. C. Parr, “NIST Measurement Services: Spectral
Reflectance,” NIST Special Publication 250-48 (1998). [2] Commission International de l’Eclairage: International Lighting Vocabulary,
Colorimetry, 2nd ed., Publ. No. 15.2 (1986). [3] ASTM E308, “Standard Practice for Computing the Colors of Objects by Using the
CIE System Gloss,” in ASTM standards on Color and Appearance Measurement, 6th ed., (ASTM, Philadelphia, PA, 2000).
[4] B. N. Taylor and C. E. Kuyatt, “Guidelines for Evaluating and Expressing the
Uncertainty of NIST Measurement Results,” NIST Technical Note 1297 (1994). [5] E. A. Early and M. E. Nadal, “Uncertainty Analysis for Reflectance Colorimetry,”
Color Res. Appl. 29:205-216 (2004).

REPORT OF CALIBRATION 38091S 0:45 Surface Color Color Tile Set Any Company, Inc. Serial No.: NISTCS-XX
5
Table 1. 0:45 spectral reflectance factor R and expanded uncertainty U (k = 2) as a function of wavelength λ of the Black color tile, set number NISTCS-XX
λ [nm] R U λ [nm] R U λ [nm] R U
380 0.0051 0.0007 515 0.0067 0.0003 650 0.0058 0.0001 385 0.0055 0.0012 520 0.0067 0.0001 655 0.0059 0.0001 390 0.0056 0.0011 525 0.0067 0.0001 660 0.0060 0.0001 395 0.0056 0.0008 530 0.0068 0.0000 665 0.0062 0.0001 400 0.0059 0.0008 535 0.0070 0.0001 670 0.0066 0.0001 405 0.0059 0.0007 540 0.0069 0.0001 675 0.0070 0.0001 410 0.0062 0.0003 545 0.0070 0.0002 680 0.0078 0.0001 415 0.0061 0.0002 550 0.0068 0.0002 685 0.0088 0.0001 420 0.0060 0.0003 555 0.0067 0.0001 690 0.0100 0.0001 425 0.0061 0.0004 560 0.0065 0.0001 695 0.0115 0.0001 430 0.0061 0.0002 565 0.0062 0.0001 700 0.0133 0.0001 435 0.0061 0.0000 570 0.0060 0.0001 705 0.0151 0.0001 440 0.0062 0.0001 575 0.0058 0.0002 710 0.0171 0.0001 445 0.0062 0.0001 580 0.0056 0.0002 715 0.0190 0.0002 450 0.0062 0.0001 585 0.0056 0.0001 720 0.0209 0.0002 455 0.0063 0.0001 590 0.0055 0.0001 725 0.0229 0.0002 460 0.0062 0.0004 595 0.0054 0.0000 730 0.0247 0.0002 465 0.0063 0.0005 600 0.0053 0.0001 735 0.0265 0.0002 470 0.0062 0.0002 605 0.0052 0.0001 740 0.0282 0.0003 475 0.0064 0.0007 610 0.0051 0.0001 745 0.0298 0.0002 480 0.0062 0.0004 615 0.0052 0.0001 750 0.0313 0.0002 485 0.0061 0.0002 620 0.0053 0.0001 755 0.0329 0.0002 490 0.0062 0.0004 625 0.0055 0.0001 760 0.0344 0.0002 495 0.0062 0.0005 630 0.0057 0.0001 765 0.0359 0.0002 500 0.0063 0.0004 635 0.0057 0.0001 770 0.0373 0.0002 505 0.0063 0.0002 640 0.0058 0.0001 775 0.0388 0.0003 510 0.0065 0.0001 645 0.0059 0.0001 780 0.0404 0.0003

REPORT OF CALIBRATION 38091S 0:45 Surface Color Color Tile Set Any Company, Inc. Serial No.: NISTCS-XX
6
Table 2. 0:45 spectral reflectance factor R and expanded uncertainty U (k = 2) as a function of wavelength λ of the Cyan color tile, set number NISTCS-XX
λ [nm] R U λ [nm] R U λ [nm] R U
380 0.1665 0.0020 515 0.3246 0.0019 650 0.0712 0.0004 385 0.1911 0.0017 520 0.3007 0.0019 655 0.0722 0.0004 390 0.2164 0.0018 525 0.2769 0.0017 660 0.0735 0.0004 395 0.2404 0.0030 530 0.2540 0.0017 665 0.0753 0.0004 400 0.2627 0.0024 535 0.2322 0.0014 670 0.0776 0.0005 405 0.2846 0.0020 540 0.2121 0.0013 675 0.0804 0.0005 410 0.3050 0.0021 545 0.1935 0.0012 680 0.0838 0.0005 415 0.3235 0.0023 550 0.1767 0.0011 685 0.0877 0.0005 420 0.3413 0.0021 555 0.1618 0.0010 690 0.0922 0.0006 425 0.3570 0.0027 560 0.1483 0.0009 695 0.0974 0.0006 430 0.3719 0.0022 565 0.1365 0.0008 700 0.1032 0.0006 435 0.3857 0.0023 570 0.1260 0.0008 705 0.1095 0.0006 440 0.3984 0.0026 575 0.1168 0.0007 710 0.1159 0.0007 445 0.4095 0.0024 580 0.1088 0.0007 715 0.1218 0.0007 450 0.4200 0.0025 585 0.1018 0.0006 720 0.1269 0.0007 455 0.4287 0.0025 590 0.0958 0.0006 725 0.1311 0.0007 460 0.4370 0.0026 595 0.0906 0.0005 730 0.1342 0.0008 465 0.4416 0.0027 600 0.0862 0.0005 735 0.1364 0.0008 470 0.4432 0.0026 605 0.0824 0.0005 740 0.1376 0.0008 475 0.4428 0.0026 610 0.0792 0.0005 745 0.1381 0.0008 480 0.4387 0.0028 615 0.0766 0.0005 750 0.1380 0.0008 485 0.4316 0.0025 620 0.0746 0.0004 755 0.1374 0.0008 490 0.4208 0.0026 625 0.0729 0.0004 760 0.1365 0.0008 495 0.4069 0.0024 630 0.0717 0.0004 765 0.1352 0.0008 500 0.3900 0.0023 635 0.0710 0.0004 770 0.1340 0.0008 505 0.3700 0.0022 640 0.0707 0.0004 775 0.1326 0.0008 510 0.3480 0.0022 645 0.0708 0.0004 780 0.1314 0.0008

REPORT OF CALIBRATION 38091S 0:45 Surface Color Color Tile Set Any Company, Inc. Serial No.: NISTCS-XX
7
Table 3. 0:45 spectral reflectance factor R and expanded uncertainty U (k = 2) as a function of wavelength λ of the Deep Blue color tile, set number NISTCS-XX
λ [nm] R U λ [nm] R U λ [nm] R U
380 0.1169 0.0038 515 0.0116 0.0003 650 0.0078 0.0002 385 0.1253 0.0023 520 0.0114 0.0001 655 0.0080 0.0001 390 0.1322 0.0013 525 0.0113 0.0003 660 0.0085 0.0001 395 0.1379 0.0016 530 0.0114 0.0001 665 0.0092 0.0001 400 0.1407 0.0010 535 0.0116 0.0002 670 0.0101 0.0001 405 0.1410 0.0012 540 0.0120 0.0001 675 0.0117 0.0001 410 0.1388 0.0010 545 0.0121 0.0001 680 0.0142 0.0001 415 0.1336 0.0015 550 0.0121 0.0001 685 0.0182 0.0002 420 0.1256 0.0010 555 0.0115 0.0001 690 0.0246 0.0003 425 0.1160 0.0012 560 0.0106 0.0002 695 0.0342 0.0030 430 0.1050 0.0011 565 0.0096 0.0001 700 0.0508 0.0005 435 0.0933 0.0010 570 0.0088 0.0001 705 0.0737 0.0007 440 0.0816 0.0009 575 0.0080 0.0001 710 0.1049 0.0010 445 0.0703 0.0009 580 0.0075 0.0001 715 0.1444 0.0012 450 0.0593 0.0008 585 0.0072 0.0001 720 0.1913 0.0015 455 0.0500 0.0007 590 0.0070 0.0001 725 0.2436 0.0019 460 0.0399 0.0008 595 0.0070 0.0001 730 0.2981 0.0021 465 0.0329 0.0008 600 0.0072 0.0000 735 0.3519 0.0024 470 0.0273 0.0007 605 0.0073 0.0001 740 0.4012 0.0026 475 0.0232 0.0004 610 0.0074 0.0001 745 0.4440 0.0027 480 0.0197 0.0018 615 0.0075 0.0001 750 0.4785 0.0028 485 0.0178 0.0003 620 0.0075 0.0001 755 0.5042 0.0029 490 0.0162 0.0003 625 0.0076 0.0001 760 0.5221 0.0030 495 0.0148 0.0005 630 0.0075 0.0000 765 0.5331 0.0034 500 0.0137 0.0003 635 0.0075 0.0000 770 0.5379 0.0031 505 0.0124 0.0011 640 0.0076 0.0002 775 0.5392 0.0031 510 0.0121 0.0002 645 0.0074 0.0007 780 0.5368 0.0031

REPORT OF CALIBRATION 38091S 0:45 Surface Color Color Tile Set Any Company, Inc. Serial No.: NISTCS-XX
8
Table 4. 0:45 spectral reflectance factor R and expanded uncertainty U (k = 2) as a function of wavelength λ of the Deep Gray color tile, set number NISTCS-XX
λ [nm] R U λ [nm] R U λ [nm] R U
380 0.0452 0.0028 515 0.0491 0.0003 650 0.0540 0.0003 385 0.0459 0.0019 520 0.0496 0.0003 655 0.0543 0.0003 390 0.0466 0.0011 525 0.0501 0.0003 660 0.0551 0.0003 395 0.0470 0.0011 530 0.0507 0.0003 665 0.0564 0.0003 400 0.0477 0.0008 535 0.0513 0.0004 670 0.0585 0.0003 405 0.0477 0.0006 540 0.0520 0.0003 675 0.0615 0.0004 410 0.0479 0.0004 545 0.0525 0.0003 680 0.0654 0.0004 415 0.0480 0.0006 550 0.0527 0.0003 685 0.0702 0.0004 420 0.0479 0.0005 555 0.0526 0.0003 690 0.0758 0.0005 425 0.0479 0.0003 560 0.0522 0.0003 695 0.0819 0.0005 430 0.0478 0.0004 565 0.0516 0.0003 700 0.0884 0.0005 435 0.0478 0.0004 570 0.0510 0.0003 705 0.0954 0.0006 440 0.0479 0.0003 575 0.0507 0.0003 710 0.1028 0.0006 445 0.0479 0.0003 580 0.0505 0.0003 715 0.1104 0.0007 450 0.0479 0.0003 585 0.0503 0.0003 720 0.1182 0.0007 455 0.0482 0.0003 590 0.0503 0.0003 725 0.1262 0.0007 460 0.0482 0.0008 595 0.0501 0.0003 730 0.1343 0.0008 465 0.0485 0.0010 600 0.0498 0.0003 735 0.1426 0.0009 470 0.0483 0.0009 605 0.0495 0.0003 740 0.1507 0.0009 475 0.0484 0.0006 610 0.0495 0.0003 745 0.1585 0.0009 480 0.0484 0.0006 615 0.0499 0.0003 750 0.1657 0.0010 485 0.0484 0.0003 620 0.0507 0.0003 755 0.1721 0.0010 490 0.0484 0.0004 625 0.0515 0.0003 760 0.1779 0.0010 495 0.0483 0.0004 630 0.0523 0.0003 765 0.1827 0.0011 500 0.0484 0.0003 635 0.0529 0.0003 770 0.1870 0.0011 505 0.0487 0.0004 640 0.0534 0.0003 775 0.1909 0.0011 510 0.0488 0.0004 645 0.0537 0.0003 780 0.1946 0.0012

REPORT OF CALIBRATION 38091S 0:45 Surface Color Color Tile Set Any Company, Inc. Serial No.: NISTCS-XX
9
Table 5. 0:45 spectral reflectance factor R and expanded uncertainty U (k = 2) as a function of wavelength λ of the Deep Pink color tile, set number NISTCS-XX
λ [nm] R U λ [nm] R U λ [nm] R U
380 0.1483 0.0034 515 0.0648 0.0005 650 0.3584 0.0021 385 0.1487 0.0018 520 0.0650 0.0004 655 0.3765 0.0022 390 0.1489 0.0017 525 0.0658 0.0004 660 0.3944 0.0023 395 0.1471 0.0013 530 0.0672 0.0005 665 0.4114 0.0024 400 0.1459 0.0012 535 0.0694 0.0005 670 0.4276 0.0026 405 0.1435 0.0011 540 0.0723 0.0004 675 0.4428 0.0026 410 0.1400 0.0015 545 0.0758 0.0004 680 0.4567 0.0026 415 0.1358 0.0011 550 0.0800 0.0005 685 0.4690 0.0028 420 0.1311 0.0013 555 0.0849 0.0005 690 0.4797 0.0028 425 0.1260 0.0011 560 0.0905 0.0005 695 0.4899 0.0028 430 0.1207 0.0008 565 0.0970 0.0006 700 0.4990 0.0028 435 0.1154 0.0009 570 0.1046 0.0008 705 0.5064 0.0033 440 0.1102 0.0008 575 0.1129 0.0007 710 0.5138 0.0031 445 0.1052 0.0006 580 0.1226 0.0007 715 0.5191 0.0036 450 0.1002 0.0007 585 0.1335 0.0008 720 0.5236 0.0030 455 0.0957 0.0008 590 0.1458 0.0009 725 0.5271 0.0030 460 0.0901 0.0008 595 0.1593 0.0010 730 0.5290 0.0031 465 0.0861 0.0007 600 0.1742 0.0012 735 0.5308 0.0032 470 0.0824 0.0007 605 0.1902 0.0012 740 0.5310 0.0030 475 0.0789 0.0008 610 0.2073 0.0013 745 0.5305 0.0031 480 0.0759 0.0008 615 0.2252 0.0014 750 0.5296 0.0031 485 0.0732 0.0006 620 0.2438 0.0015 755 0.5282 0.0030 490 0.0696 0.0063 625 0.2630 0.0015 760 0.5264 0.0030 495 0.0688 0.0004 630 0.2822 0.0017 765 0.5241 0.0031 500 0.0672 0.0005 635 0.3016 0.0018 770 0.5217 0.0030 505 0.0646 0.0055 640 0.3209 0.0019 775 0.5187 0.0030 510 0.0651 0.0005 645 0.3399 0.0020 780 0.5158 0.0029

REPORT OF CALIBRATION 38091S 0:45 Surface Color Color Tile Set Any Company, Inc. Serial No.: NISTCS-XX
10
Table 6. 0:45 spectral reflectance factor R and expanded uncertainty U (k = 2) as a function of wavelength λ of the Diff Gray color tile, set number NISTCS-XX
λ [nm] R U λ [nm] R U λ [nm] R U
380 0.2002 0.0026 515 0.2663 0.0014 650 0.2538 0.0015 385 0.2063 0.0024 520 0.2668 0.0015 655 0.2534 0.0015 390 0.2100 0.0013 525 0.2670 0.0015 660 0.2538 0.0015 395 0.2137 0.0014 530 0.2672 0.0015 665 0.2542 0.0015 400 0.2173 0.0018 535 0.2671 0.0015 670 0.2549 0.0014 405 0.2203 0.0016 540 0.2672 0.0015 675 0.2557 0.0015 410 0.2236 0.0014 545 0.2668 0.0015 680 0.2567 0.0015 415 0.2264 0.0015 550 0.2661 0.0015 685 0.2577 0.0015 420 0.2292 0.0014 555 0.2651 0.0015 690 0.2586 0.0015 425 0.2322 0.0015 560 0.2637 0.0015 695 0.2596 0.0015 430 0.2348 0.0015 565 0.2622 0.0015 700 0.2605 0.0015 435 0.2377 0.0015 570 0.2606 0.0015 705 0.2610 0.0015 440 0.2405 0.0015 575 0.2590 0.0015 710 0.2612 0.0015 445 0.2433 0.0014 580 0.2577 0.0014 715 0.2612 0.0015 450 0.2459 0.0015 585 0.2566 0.0015 720 0.2611 0.0015 455 0.2483 0.0015 590 0.2562 0.0015 725 0.2607 0.0015 460 0.2508 0.0015 595 0.2561 0.0015 730 0.2602 0.0015 465 0.2530 0.0015 600 0.2561 0.0016 735 0.2595 0.0014 470 0.2547 0.0015 605 0.2561 0.0015 740 0.2585 0.0015 475 0.2567 0.0015 610 0.2562 0.0015 745 0.2579 0.0015 480 0.2588 0.0015 615 0.2561 0.0015 750 0.2569 0.0014 485 0.2603 0.0014 620 0.2560 0.0015 755 0.2557 0.0014 490 0.2620 0.0015 625 0.2557 0.0015 760 0.2546 0.0014 495 0.2634 0.0015 630 0.2554 0.0015 765 0.2534 0.0015 500 0.2645 0.0015 635 0.2548 0.0015 770 0.2521 0.0014 505 0.2655 0.0015 640 0.2544 0.0015 775 0.2509 0.0014 510 0.2661 0.0015 645 0.2543 0.0015 780 0.2496 0.0014

REPORT OF CALIBRATION 38091S 0:45 Surface Color Color Tile Set Any Company, Inc. Serial No.: NISTCS-XX
11
Table 7. 0:45 spectral reflectance factor R and expanded uncertainty U (k = 2) as a function of wavelength λ of the Diff Green color tile, set number NISTCS-XX
λ [nm] R U λ [nm] R U λ [nm] R U
380 0.0511 0.0027 515 0.3366 0.0020 650 0.1127 0.0006 385 0.0544 0.0020 520 0.3328 0.0020 655 0.1139 0.0006 390 0.0565 0.0020 525 0.3225 0.0019 660 0.1157 0.0007 395 0.0584 0.0009 530 0.3079 0.0018 665 0.1182 0.0006 400 0.0604 0.0009 535 0.2908 0.0018 670 0.1212 0.0007 405 0.0624 0.0008 540 0.2731 0.0016 675 0.1249 0.0007 410 0.0641 0.0008 545 0.2549 0.0015 680 0.1293 0.0007 415 0.0661 0.0007 550 0.2377 0.0014 685 0.1345 0.0008 420 0.0685 0.0006 555 0.2215 0.0013 690 0.1402 0.0008 425 0.0712 0.0006 560 0.2066 0.0012 695 0.1468 0.0008 430 0.0746 0.0006 565 0.1931 0.0011 700 0.1542 0.0009 435 0.0787 0.0006 570 0.1808 0.0010 705 0.1620 0.0009 440 0.0835 0.0007 575 0.1696 0.0011 710 0.1697 0.0010 445 0.0893 0.0007 580 0.1599 0.0009 715 0.1769 0.0010 450 0.0966 0.0008 585 0.1513 0.0009 720 0.1830 0.0010 455 0.1051 0.0010 590 0.1438 0.0008 725 0.1880 0.0011 460 0.1182 0.0009 595 0.1373 0.0008 730 0.1914 0.0011 465 0.1315 0.0012 600 0.1318 0.0008 735 0.1939 0.0011 470 0.1479 0.0012 605 0.1269 0.0007 740 0.1953 0.0011 475 0.1675 0.0012 610 0.1229 0.0007 745 0.1958 0.0011 480 0.1901 0.0015 615 0.1195 0.0007 750 0.1956 0.0011 485 0.2159 0.0015 620 0.1168 0.0007 755 0.1949 0.0011 490 0.2440 0.0016 625 0.1147 0.0006 760 0.1938 0.0011 495 0.2730 0.0018 630 0.1133 0.0006 765 0.1923 0.0011 500 0.2991 0.0020 635 0.1123 0.0006 770 0.1907 0.0011 505 0.3199 0.0019 640 0.1119 0.0006 775 0.1891 0.0010 510 0.3326 0.0020 645 0.1121 0.0006 780 0.1875 0.0011

REPORT OF CALIBRATION 38091S 0:45 Surface Color Color Tile Set Any Company, Inc. Serial No.: NISTCS-XX
12
Table 8. 0:45 spectral reflectance factor R and expanded uncertainty U (k = 2) as a function of wavelength λ of the Green color tile, set number NISTCS-XX
λ [nm] R U λ [nm] R U λ [nm] R U
380 0.0584 0.0041 515 0.3401 0.0020 650 0.1075 0.0006 385 0.0616 0.0018 520 0.3335 0.0020 655 0.1086 0.0007 390 0.0653 0.0017 525 0.3212 0.0020 660 0.1104 0.0006 395 0.0675 0.0012 530 0.3052 0.0019 665 0.1129 0.0007 400 0.0698 0.0010 535 0.2871 0.0018 670 0.1160 0.0007 405 0.0721 0.0007 540 0.2686 0.0017 675 0.1196 0.0007 410 0.0744 0.0006 545 0.2502 0.0015 680 0.1240 0.0007 415 0.0768 0.0007 550 0.2326 0.0014 685 0.1291 0.0008 420 0.0796 0.0006 555 0.2163 0.0013 690 0.1350 0.0008 425 0.0828 0.0006 560 0.2012 0.0012 695 0.1416 0.0008 430 0.0863 0.0007 565 0.1875 0.0011 700 0.1489 0.0009 435 0.0909 0.0007 570 0.1752 0.0010 705 0.1567 0.0009 440 0.0962 0.0007 575 0.1641 0.0010 710 0.1645 0.0010 445 0.1026 0.0008 580 0.1543 0.0009 715 0.1717 0.0010 450 0.1106 0.0010 585 0.1457 0.0009 720 0.1779 0.0010 455 0.1197 0.0010 590 0.1383 0.0008 725 0.1828 0.0011 460 0.1339 0.0010 595 0.1318 0.0008 730 0.1865 0.0011 465 0.1481 0.0012 600 0.1264 0.0008 735 0.1889 0.0011 470 0.1653 0.0012 605 0.1215 0.0007 740 0.1903 0.0011 475 0.1857 0.0013 610 0.1175 0.0007 745 0.1908 0.0011 480 0.2088 0.0014 615 0.1142 0.0007 750 0.1907 0.0011 485 0.2347 0.0015 620 0.1115 0.0006 755 0.1899 0.0011 490 0.2624 0.0017 625 0.1095 0.0006 760 0.1888 0.0011 495 0.2897 0.0018 630 0.1080 0.0006 765 0.1873 0.0011 500 0.3130 0.0020 635 0.1071 0.0006 770 0.1857 0.0011 505 0.3302 0.0020 640 0.1067 0.0006 775 0.1841 0.0010 510 0.3397 0.0020 645 0.1068 0.0006 780 0.1826 0.0011

REPORT OF CALIBRATION 38091S 0:45 Surface Color Color Tile Set Any Company, Inc. Serial No.: NISTCS-XX
13
Table 9. 0:45 spectral reflectance factor R and expanded uncertainty U (k = 2) as a function of wavelength λ of the Mid Gray color tile, set number NISTCS-XX
λ [nm] R U λ [nm] R U λ [nm] R U
380 0.2162 0.0023 515 0.2533 0.0015 650 0.2548 0.0015 385 0.2217 0.0026 520 0.2540 0.0015 655 0.2544 0.0015 390 0.2255 0.0015 525 0.2547 0.0015 660 0.2543 0.0015 395 0.2298 0.0016 530 0.2555 0.0015 665 0.2545 0.0015 400 0.2337 0.0014 535 0.2563 0.0015 670 0.2547 0.0015 405 0.2368 0.0014 540 0.2572 0.0016 675 0.2552 0.0015 410 0.2399 0.0017 545 0.2579 0.0015 680 0.2556 0.0015 415 0.2424 0.0014 550 0.2581 0.0015 685 0.2562 0.0015 420 0.2451 0.0015 555 0.2582 0.0015 690 0.2566 0.0015 425 0.2476 0.0015 560 0.2577 0.0015 695 0.2569 0.0015 430 0.2496 0.0016 565 0.2573 0.0015 700 0.2570 0.0015 435 0.2514 0.0016 570 0.2565 0.0015 705 0.2568 0.0015 440 0.2525 0.0015 575 0.2556 0.0015 710 0.2565 0.0015 445 0.2539 0.0015 580 0.2551 0.0015 715 0.2558 0.0015 450 0.2544 0.0016 585 0.2548 0.0015 720 0.2551 0.0015 455 0.2548 0.0015 590 0.2548 0.0014 725 0.2542 0.0014 460 0.2547 0.0015 595 0.2552 0.0015 730 0.2534 0.0014 465 0.2544 0.0018 600 0.2558 0.0015 735 0.2523 0.0014 470 0.2536 0.0016 605 0.2563 0.0015 740 0.2514 0.0014 475 0.2532 0.0015 610 0.2566 0.0015 745 0.2503 0.0014 480 0.2528 0.0016 615 0.2568 0.0015 750 0.2493 0.0014 485 0.2525 0.0015 620 0.2570 0.0015 755 0.2481 0.0014 490 0.2524 0.0014 625 0.2569 0.0015 760 0.2471 0.0014 495 0.2524 0.0015 630 0.2567 0.0015 765 0.2458 0.0014 500 0.2525 0.0015 635 0.2562 0.0015 770 0.2445 0.0014 505 0.2526 0.0015 640 0.2558 0.0015 775 0.2431 0.0014 510 0.2530 0.0015 645 0.2555 0.0015 780 0.2418 0.0014

REPORT OF CALIBRATION 38091S 0:45 Surface Color Color Tile Set Any Company, Inc. Serial No.: NISTCS-XX
14
Table 10. 0:45 spectral reflectance factor R and expanded uncertainty U (k = 2) as a function of wavelength λ of the Orange color tile, set number NISTCS-XX
λ [nm] R U λ [nm] R U λ [nm] R U
380 0.0520 0.0066 515 0.0806 0.0006 650 0.7699 0.0044 385 0.0529 0.0042 520 0.0838 0.0005 655 0.7742 0.0044 390 0.0545 0.0028 525 0.0876 0.0006 660 0.7789 0.0045 395 0.0555 0.0021 530 0.0937 0.0006 665 0.7834 0.0045 400 0.0566 0.0014 535 0.1051 0.0007 670 0.7871 0.0045 405 0.0573 0.0013 540 0.1260 0.0010 675 0.7913 0.0046 410 0.0581 0.0011 545 0.1608 0.0014 680 0.7947 0.0045 415 0.0591 0.0011 550 0.2124 0.0018 685 0.7983 0.0047 420 0.0601 0.0010 555 0.2791 0.0023 690 0.8015 0.0046 425 0.0607 0.0007 560 0.3539 0.0026 695 0.8047 0.0046 430 0.0616 0.0009 565 0.4280 0.0029 700 0.8081 0.0046 435 0.0625 0.0008 570 0.4934 0.0031 705 0.8113 0.0046 440 0.0623 0.0059 575 0.5475 0.0034 710 0.8150 0.0047 445 0.0643 0.0008 580 0.5903 0.0035 715 0.8180 0.0047 450 0.0656 0.0009 585 0.6240 0.0036 720 0.8211 0.0047 455 0.0666 0.0009 590 0.6512 0.0038 725 0.8231 0.0047 460 0.0617 0.0010 595 0.6726 0.0039 730 0.8244 0.0047 465 0.0625 0.0010 600 0.6902 0.0040 735 0.8255 0.0048 470 0.0634 0.0008 605 0.7041 0.0040 740 0.8263 0.0047 475 0.0641 0.0009 610 0.7155 0.0041 745 0.8273 0.0047 480 0.0649 0.0006 615 0.7257 0.0042 750 0.8281 0.0048 485 0.0657 0.0006 620 0.7336 0.0046 755 0.8293 0.0047 490 0.0670 0.0005 625 0.7415 0.0042 760 0.8305 0.0047 495 0.0681 0.0006 630 0.7486 0.0043 765 0.8308 0.0047 500 0.0700 0.0006 635 0.7543 0.0043 770 0.8318 0.0048 505 0.0731 0.0006 640 0.7601 0.0043 775 0.8323 0.0047 510 0.0769 0.0006 645 0.7651 0.0044 780 0.8329 0.0048

REPORT OF CALIBRATION 38091S 0:45 Surface Color Color Tile Set Any Company, Inc. Serial No.: NISTCS-XX
15
Table 11. 0:45 spectral reflectance factor R and expanded uncertainty U (k = 2) as a function of wavelength λ of the Pale Gray color tile, set number NISTCS-XX
λ [nm] R U λ [nm] R U λ [nm] R U
380 0.5670 0.0044 515 0.6306 0.0036 650 0.6273 0.0036 385 0.5783 0.0039 520 0.6310 0.0036 655 0.6269 0.0036 390 0.5864 0.0047 525 0.6312 0.0036 660 0.6270 0.0036 395 0.5935 0.0042 530 0.6318 0.0036 665 0.6271 0.0036 400 0.5994 0.0034 535 0.6322 0.0036 670 0.6271 0.0036 405 0.6043 0.0035 540 0.6324 0.0037 675 0.6278 0.0036 410 0.6081 0.0041 545 0.6325 0.0037 680 0.6283 0.0036 415 0.6113 0.0043 550 0.6320 0.0036 685 0.6286 0.0036 420 0.6148 0.0039 555 0.6316 0.0036 690 0.6291 0.0037 425 0.6175 0.0037 560 0.6307 0.0036 695 0.6289 0.0038 430 0.6203 0.0040 565 0.6297 0.0036 700 0.6292 0.0036 435 0.6229 0.0040 570 0.6287 0.0036 705 0.6286 0.0036 440 0.6236 0.0036 575 0.6276 0.0036 710 0.6284 0.0036 445 0.6261 0.0037 580 0.6272 0.0037 715 0.6278 0.0036 450 0.6269 0.0041 585 0.6266 0.0037 720 0.6273 0.0036 455 0.6282 0.0039 590 0.6270 0.0036 725 0.6263 0.0036 460 0.6285 0.0036 595 0.6272 0.0036 730 0.6252 0.0036 465 0.6286 0.0036 600 0.6280 0.0038 735 0.6242 0.0036 470 0.6288 0.0036 605 0.6280 0.0036 740 0.6234 0.0036 475 0.6288 0.0036 610 0.6285 0.0036 745 0.6224 0.0036 480 0.6286 0.0036 615 0.6287 0.0036 750 0.6212 0.0036 485 0.6288 0.0037 620 0.6290 0.0036 755 0.6201 0.0035 490 0.6289 0.0036 625 0.6289 0.0036 760 0.6187 0.0038 495 0.6292 0.0036 630 0.6286 0.0036 765 0.6176 0.0035 500 0.6292 0.0039 635 0.6282 0.0036 770 0.6164 0.0036 505 0.6300 0.0036 640 0.6280 0.0036 775 0.6150 0.0035 510 0.6302 0.0036 645 0.6277 0.0036 780 0.6139 0.0035

REPORT OF CALIBRATION 38091S 0:45 Surface Color Color Tile Set Any Company, Inc. Serial No.: NISTCS-XX
16
Table 12. 0:45 spectral reflectance factor R and expanded uncertainty U (k = 2) as a function of wavelength λ of the Red color tile, set number NISTCS-XX
λ [nm] R U λ [nm] R U λ [nm] R U
380 0.0156 0.0058 515 0.0269 0.0004 650 0.6471 0.0037 385 0.0165 0.0036 520 0.0280 0.0003 655 0.6619 0.0038 390 0.0170 0.0024 525 0.0294 0.0003 660 0.6764 0.0039 395 0.0181 0.0018 530 0.0309 0.0003 665 0.6891 0.0039 400 0.0187 0.0014 535 0.0324 0.0003 670 0.7009 0.0040 405 0.0191 0.0012 540 0.0337 0.0003 675 0.7111 0.0041 410 0.0196 0.0010 545 0.0350 0.0003 680 0.7207 0.0041 415 0.0202 0.0007 550 0.0364 0.0003 685 0.7297 0.0043 420 0.0206 0.0007 555 0.0373 0.0035 690 0.7373 0.0042 425 0.0208 0.0005 560 0.0405 0.0003 695 0.7460 0.0043 430 0.0212 0.0005 565 0.0442 0.0003 700 0.7544 0.0044 435 0.0214 0.0004 570 0.0500 0.0003 705 0.7623 0.0044 440 0.0218 0.0004 575 0.0584 0.0004 710 0.7703 0.0044 445 0.0217 0.0020 580 0.0699 0.0005 715 0.7782 0.0045 450 0.0224 0.0003 585 0.0851 0.0006 720 0.7845 0.0045 455 0.0228 0.0003 590 0.1049 0.0008 725 0.7891 0.0045 460 0.0223 0.0010 595 0.1314 0.0010 730 0.7914 0.0045 465 0.0228 0.0009 600 0.1674 0.0014 735 0.7925 0.0047 470 0.0231 0.0006 605 0.2159 0.0019 740 0.7932 0.0048 475 0.0233 0.0005 610 0.2773 0.0022 745 0.7944 0.0045 480 0.0236 0.0005 615 0.3480 0.0026 750 0.7957 0.0046 485 0.0235 0.0022 620 0.4193 0.0029 755 0.7967 0.0048 490 0.0248 0.0004 625 0.4834 0.0031 760 0.7978 0.0045 495 0.0251 0.0003 630 0.5355 0.0032 765 0.7986 0.0046 500 0.0252 0.0004 635 0.5753 0.0033 770 0.7991 0.0046 505 0.0255 0.0004 640 0.6057 0.0035 775 0.7996 0.0046 510 0.0262 0.0003 645 0.6292 0.0037 780 0.8002 0.0046

REPORT OF CALIBRATION 38091S 0:45 Surface Color Color Tile Set Any Company, Inc. Serial No.: NISTCS-XX
17
Table 13. 0:45 spectral reflectance factor R and expanded uncertainty U (k = 2) as a function of wavelength λ of the White color tile, set number NISTCS-XX
λ [nm] R U λ [nm] R U λ [nm] R U
380 0.7564 0.0050 515 0.8988 0.0051 650 0.9028 0.0051 385 0.7791 0.0053 520 0.8992 0.0052 655 0.9028 0.0051 390 0.8014 0.0053 525 0.8998 0.0052 660 0.9035 0.0052 395 0.8199 0.0048 530 0.9003 0.0051 665 0.9047 0.0052 400 0.8356 0.0050 535 0.9008 0.0052 670 0.9052 0.0052 405 0.8482 0.0055 540 0.9008 0.0052 675 0.9057 0.0052 410 0.8577 0.0053 545 0.9009 0.0052 680 0.9064 0.0052 415 0.8631 0.0050 550 0.9010 0.0052 685 0.9067 0.0052 420 0.8687 0.0060 555 0.9010 0.0053 690 0.9069 0.0052 425 0.8736 0.0052 560 0.9010 0.0052 695 0.9069 0.0053 430 0.8764 0.0051 565 0.9010 0.0051 700 0.9075 0.0052 435 0.8775 0.0052 570 0.9002 0.0051 705 0.9076 0.0052 440 0.8798 0.0052 575 0.8996 0.0051 710 0.9076 0.0054 445 0.8811 0.0052 580 0.8994 0.0051 715 0.9084 0.0052 450 0.8824 0.0054 585 0.8994 0.0052 720 0.9082 0.0052 455 0.8860 0.0058 590 0.9006 0.0052 725 0.9084 0.0052 460 0.8869 0.0051 595 0.9010 0.0051 730 0.9084 0.0052 465 0.8896 0.0051 600 0.9021 0.0054 735 0.9085 0.0052 470 0.8910 0.0052 605 0.9017 0.0052 740 0.9082 0.0052 475 0.8924 0.0051 610 0.9019 0.0052 745 0.9081 0.0052 480 0.8935 0.0051 615 0.9020 0.0052 750 0.9084 0.0052 485 0.8942 0.0053 620 0.9020 0.0052 755 0.9084 0.0052 490 0.8952 0.0051 625 0.9026 0.0051 760 0.9084 0.0052 495 0.8962 0.0052 630 0.9022 0.0052 765 0.9079 0.0052 500 0.8971 0.0052 635 0.9021 0.0052 770 0.9082 0.0052 505 0.8980 0.0051 640 0.9026 0.0052 775 0.9079 0.0052 510 0.8986 0.0051 645 0.9032 0.0051 780 0.9078 0.0052

REPORT OF CALIBRATION 38091S 0:45 Surface Color Color Tile Set Any Company, Inc. Serial No.: NISTCS-XX
18
Table 14. 0:45 spectral reflectance factor R and expanded uncertainty U (k = 2) as a function of wavelength λ of the Yellow color tile, set number NISTCS-XX
λ [nm] R U λ [nm] R U λ [nm] R U
380 0.0240 0.0075 515 0.4630 0.0030 650 0.7904 0.0045 385 0.0249 0.0051 520 0.5179 0.0033 655 0.7916 0.0047 390 0.0253 0.0034 525 0.5656 0.0034 660 0.7943 0.0046 395 0.0252 0.0023 530 0.6050 0.0036 665 0.7966 0.0046 400 0.0255 0.0017 535 0.6364 0.0037 670 0.7989 0.0047 405 0.0262 0.0015 540 0.6611 0.0040 675 0.8011 0.0046 410 0.0270 0.0013 545 0.6802 0.0040 680 0.8028 0.0046 415 0.0277 0.0010 550 0.6951 0.0040 685 0.8047 0.0046 420 0.0289 0.0009 555 0.7072 0.0041 690 0.8060 0.0047 425 0.0304 0.0008 560 0.7165 0.0041 695 0.8077 0.0046 430 0.0322 0.0007 565 0.7249 0.0042 700 0.8095 0.0046 435 0.0345 0.0006 570 0.7309 0.0042 705 0.8107 0.0046 440 0.0375 0.0005 575 0.7326 0.0042 710 0.8125 0.0046 445 0.0413 0.0006 580 0.7361 0.0042 715 0.8137 0.0047 450 0.0463 0.0005 585 0.7404 0.0042 720 0.8149 0.0046 455 0.0522 0.0007 590 0.7455 0.0043 725 0.8159 0.0047 460 0.0619 0.0010 595 0.7520 0.0043 730 0.8168 0.0047 465 0.0728 0.0011 600 0.7591 0.0045 735 0.8163 0.0048 470 0.0863 0.0009 605 0.7644 0.0044 740 0.8144 0.0047 475 0.1040 0.0009 610 0.7694 0.0045 745 0.8167 0.0047 480 0.1265 0.0011 615 0.7735 0.0044 750 0.8158 0.0047 485 0.1550 0.0012 620 0.7771 0.0044 755 0.8184 0.0047 490 0.1911 0.0015 625 0.7796 0.0047 760 0.8204 0.0047 495 0.2348 0.0017 630 0.7824 0.0045 765 0.8228 0.0048 500 0.2857 0.0022 635 0.7846 0.0045 770 0.8245 0.0047 505 0.3430 0.0024 640 0.7869 0.0045 775 0.8246 0.0056 510 0.4036 0.0028 645 0.7893 0.0045 780 0.8266 0.0048

REPORT OF CALIBRATION 38091S 0:45 Surface Color Color Tile Set Any Company, Inc. Serial No.: NISTCS-XX
19
Table 15. Tristimulus values Y and chromaticity coordinates x and y, with expanded uncertainties U (k=2) for CIE standard illuminant D65 and CIE 1931 standard observer for each color tile, set number NISTCS-XX
Tile Y U x U y U
Black 0.624 0.006 0.3010 0.0011 0.3355 0.0018 Cyan 19.161 0.113 0.1986 0.0000 0.2416 0.0003
Deep Blue 1.119 0.009 0.1994 0.0003 0.1206 0.0008 Deep Gray 5.084 0.029 0.3182 0.0003 0.3356 0.0003 Deep Pink 11.531 0.068 0.4127 0.0004 0.3059 0.0004 Diff Gray 26.181 0.148 0.3140 0.0000 0.3382 0.0000 Diff Green 21.651 0.126 0.2845 0.0002 0.4379 0.0004
Green 21.455 0.125 0.2748 0.0002 0.4236 0.0005 Mid Gray 25.577 0.145 0.3139 0.0000 0.3307 0.0001 Orange 35.184 0.209 0.5228 0.0005 0.3976 0.0005
Pale Gray 62.975 0.357 0.3128 0.0001 0.3301 0.0000 Red 10.086 0.067 0.5850 0.0011 0.3337 0.0005
White 89.994 0.511 0.3141 0.0001 0.3314 0.0001 Yellow 63.350 0.362 0.4467 0.0003 0.4850 0.0002

REPORT OF CALIBRATION 38091S 0:45 Surface Color Color Tile Set Any Company, Inc. Serial No.: NISTCS-XX
20
Table 16. Sources of uncertainty and their standard uncertainty or value for a color tile set, set number NISTCS-XX
Source of Uncertainty Standard Uncertainty
or Value
Signal
Noise 0.01 % - 0.2 %
Non-linearity 0.2 %
Stray Light 10-6
Wavelength 0.05 nm
Standard
Random 0.02 %
Systematic 0.2 %


2
Appendix B Appeared in Color Research Applications, Vol. 29, June 2004
Uncertainty Analysis for Reflectance Colorimetry
E. A. Early and M. E. Nadal
Optical Technology Division National Institute of Standards and Technology
100 Bureau Drive, Stop 8441 Gaithersburg, MD 20899-8441 USA
Abstract The uncertainty associated with the quantitative description of the color of an object is often necessary for determining the acceptability of that object for its intended application. Uncertainties are also required for establishing the traceability of a measurement to a national metrology institute. A systematic, analytical approach to uncertainty analysis, which conforms to currently accepted practice, is presented for reflectance colorimetry. Two important concepts are stressed – the measurement equation describing the relation between signals and spectral reflectance factor, and correlations both between signals at the same wavelength and between reflectance factors at different wavelengths. The approach is illustrated by considering representative object colors and instrument parameters. Keywords: colorimetry, correlation, uncertainty

3
I. Introduction
Determining the uncertainty in the measured color of a specimen has been a topic of interest for many years.1-9 It has received additional attention with the publication of the ISO Guide to the Expression of Uncertainty in Measurement,10 which describes methods for estimating uncertainties in a consistent manner. Recent publications have applied the principles of this Guide to uncertainty analysis for colorimetry, emphasizing the treatment of correlation.11,12
The development of a new reference instrument for reflectance colorimetry at the National Institute of Standards and Technology (NIST) has prompted a detailed analysis of the uncertainties associated with this measurement. From a review of the literature, three important aspects of previous uncertainty analyses for colorimetry became apparent. First, while sources of uncertainty can be caused by either random or systematic effects, most of the previous analyses were restricted to considering only uncertainties caused by random effects.1,5,6,8,9 Where uncertainties caused by systematic effects were considered, modeling was performed to calculate2,4 or minimize7 the effects of these uncertainties. Second, the importance of correlations due to spectral overlap of the color-matching functions was recognized from the beginning,1,4,5 and has received renewed attention.9,11,12 Third, the analyses started with a given uncertainty in the spectral reflectance factor,1,2,4-9 without considering the underlying measurement used to calculate it.
The analysis detailed here presents a systematic, analytical method for calculating uncertainties in reflectance colorimetry and emphasizes two key points. First, the spectral properties of the measurement instrument are important because ratios of signals are used to calculate the spectral reflectance factor of a specimen. Therefore, the measurement equation is used to determine the uncertainty in the spectral reflectance factor. Second, since correlations exist both between signals at the same wavelength and between reflectance factors at different wavelengths, the effects of these correlations are included in the analysis. These concepts are illustrated by considering common sources of uncertainty for a double-grating, single-detector instrument and applying the analysis to representative object colors.
II. Equations for Reflectance Colorimetry
The surface color of a specimen depends upon several factors – the spectral power distribution of the illuminant, the spectral sensitivity of the observer, the geometrical conditions of illumination and observation, and the optical properties of the specimen. Only the last factor depends upon the specimen, and is quantified by the spectral reflectance factor under the given geometrical conditions. Once the spectral reflectance factor is known, the tristimulus values are calculated for a given illuminant and observer, and from these values other quantities are derived, such as chromaticity coordinates or color space values.
The measurement of the spectral reflectance factor of a specimen is performed by comparing signals from the specimen and a standard, under the same measurement conditions. This process is described by the measurement equation

4
)()()(
)( ss
ii
ii R
SS
R λλλ
λ ⋅= , (2.1)
where λi is the wavelength setting of the instrument, S and Ss are the measured signals from the specimen and standard, respectively, and R and Rs are the reflectance factors for the specimen and standard, respectively. For ease of notation, in the following the wavelength dependence of the signals and reflectance factors will be indicated by subscripts i and j. Therefore, Eq. (2.1) becomes
ii
ii R
SS
R ,s,s
⋅= . (2.2)
The tristimulus values X, Y, and Z, for reflectance factors regularly spaced in wavelength, are given by
∑=
⋅=m
iii RWX
1x, , (2.3)
∑=
⋅=m
iii RWY
1y, , and (2.4)
∑=
⋅=m
iii RWZ
1z, , (2.5)
where Wx,i, Wy,i, and Wz,i are the normalized tristimulus weighting factors for a particular illuminant and observer combination and spectral bandwidth and interval.13 These tristimulus values are then used to calculate chromaticity coordinates, such as x and y or u’ and v’, or color space values, such as L*, a*, and b* or L*, u*, and v*, as given in Ref. [13]. III. Basics of Uncertainty Analysis The approach to the uncertainty analysis presented here follows the Guide.10 This section details the basic definitions and equations used in the uncertainty analysis. In general, the purpose of a measurement is to determine the value of a measurand y, which is obtained from n other quantities xk through the functional relationship f, given by ),,,,,( 21 nk xxxxfy KK= . (3.1) An example of such a functional relationship, which is used extensively in this paper, is Eq. (2.2), where Ri = f(Si, Ss,i, Rs,i, λ). The standard uncertainty of an input quantity xk is the estimated standard deviation associated with this quantity and is denoted by u(xk). The estimated standard uncertainty in the measurand y is the combined standard uncertainty uc(y), given by the law of propagation of uncertainty as
),(2)()(1
1 1
22
1
2c lk
n
k
n
kl lkk
n
k k
xxuxf
xfxu
xfyu ∑ ∑∑
−
= +==
⋅⎟⎟⎠
⎞⎜⎜⎝
⎛∂∂
⎟⎟⎠
⎞⎜⎜⎝
⎛∂∂
+⎟⎟⎠
⎞⎜⎜⎝
⎛∂∂
= . (3.2)
Here, ∂f/∂xk is the sensitivity coefficient with respect to xk and u(xk, xl) is the covariance of xk and xl. The covariance is related to the correlation coefficient r(xk, xl) by
)()(
),(),(
lk
lklk xuxu
xxuxxr
⋅= , (3.3)

5
where the correlation coefficient is a pure number between –1 and +1, inclusive. For two input quantities that are uncorrelated, r(xk, xl) = 0, while two quantities that are fully correlated have r(xk, xl) = ±1. In general, sources of uncertainty arising from random and independent effects are uncorrelated, while those arising from systematic effects are correlated. In terms of the correlation coefficients, Eq. (3.2) becomes
.)()(),(2)()(1
1 1
22
1
2c lklk
n
k
n
kl lkk
n
k k
xuxuxxrxf
xfxu
xfyu ⋅⋅⋅⎟⎟
⎠
⎞⎜⎜⎝
⎛∂∂
⎟⎟⎠
⎞⎜⎜⎝
⎛∂∂
+⎟⎟⎠
⎞⎜⎜⎝
⎛∂∂
= ∑ ∑∑−
= +==
(3.4)
The covariance, and hence the correlation coefficient, can be calculated using two different techniques, depending on the knowledge of the input quantities xk and xl. If the quantities are obtained from coincident experimental data with H values for each quantity, then the covariance is given by
∑=
−−=H
hlhlkhklk xxxx
Hxxu
1,, ))((1),( , (3.5)
where kx and lx are the averages of xk and xl, respectively. The standard deviations of the quantities are
∑=
−=H
hkhkk xx
Hxu
1
2, )(1)( and (3.6)
∑=
−=H
hlhll xx
Hxu
1
2, )(1)( . (3.7)
Substituting Eqs. (3.5) to (3.7) into Eq. (3.3) yields the correlation coefficient
∑ ∑
∑
= =
=
−−
−−=
H
h
H
llhlkhk
H
hljlkhk
lk
xxxx
xxxxxxr
1 1
2,
2,
1,,
)()(
))((),( . (3.8)
In the other technique, analytical expressions for the input quantities are known, so that the quantities are functions of additional variables, given by ),,,,,( 21 Hhkk qqqqgx KK= . (3.9) Then, if u(qh) is the standard uncertainty associated with the quantity qh,
and)()(),(2
)()(
1
1 1
22
1
2
phphp
kH
h
H
hp h
k
h
H
h h
kk
ququqqrqg
qg
quqg
xu
⋅⋅⋅⎟⎟⎠
⎞⎜⎜⎝
⎛
∂∂
⎟⎟⎠
⎞⎜⎜⎝
⎛∂∂
+
⎟⎟⎠
⎞⎜⎜⎝
⎛∂∂
=
∑ ∑
∑−
= +=
= (3.10)
.)()(),(
)(),(
1
1 1
1
2
∑ ∑
∑−
= +=
=
⋅⋅⋅⎥⎥⎦
⎤
⎢⎢⎣
⎡⎟⎟⎠
⎞⎜⎜⎝
⎛∂∂
⎟⎟⎠
⎞⎜⎜⎝
⎛
∂∂
+⎟⎟⎠
⎞⎜⎜⎝
⎛
∂∂
⎟⎟⎠
⎞⎜⎜⎝
⎛∂∂
+
∂∂
∂∂
=
H
h
H
hpphph
h
l
p
k
p
l
h
k
H
hh
h
l
h
klk
ququqqrqg
qg
qg
qg
quqg
qgxxu
(3.11)

6
Substitution of Eqs. (3.10) and (3.11) into Eq. (3.3) yields the correlation coefficient r(xk, xl). For this technique to work, the correlation coefficients for the additional variables r(qh, qp) must be known. As an example of the second technique, consider a common situation in which the input quantities xk and xl are given by ),( αα agax kk =+= and (3.12) ),( ββ bgbx ll =+= , (3.13) where the variables are a, b, α, and β, and only α and β are possibly correlated. The standard uncertainties, using Eq. (3.10) and the sensitivity coefficients from Eqs. (3.12) and (3.13), are )()()(0)(1)(0)(1)( 2222222 αβα uauuubuauxu k +=⋅+⋅+⋅+⋅= and (3.14) )()()(1)(0)(1)(0)( 2222222 ββα ubuuubuauxu l +=⋅+⋅+⋅+⋅= . (3.15) The covariance, from Eq. (3.11), is )()(),()0011(),( βαβα uurxxu lk ⋅⋅⋅⋅+⋅= . (3.16) Substituting Eqs. (3.14) to (3.16) into Eq. (3.3) yields the correlation coefficient
)()()()(
)()(),(),(2222 βα
βαβα
ubuuauuurxxr lk
++
⋅⋅= . (3.17)
If the only source of uncertainty in Eqs. (3.12) and (3.13) is α and β, so that u(a) = u(b) = 0, then r(xk, xl) = r(α, β). To continue this example further, let the variables α and β be given by sA ⋅=α and (3.18) sB ⋅=β , (3.19) where the variables A and B are uncorrelated and the variable s is a common factor. Using Eqs. (3.10) and (3.11), assuming no uncertainty in A and B, and the sensitivity coefficients derived from Eqs. (3.18) and (3.19), yields )()( 222 suAu ⋅=α , (3.20) )()( 222 suBu ⋅=β , and (3.21) )(),( 2 suBAu ⋅⋅=βα . (3.22) Therefore,
1)()(
)(),(2222
2
=⋅⋅
⋅⋅=
suBsuAsuBAr βα . (3.23)
IV. Application to Reflectance Colorimetry
A. Overview
As detailed in Section II, the progression from measurement to surface color is spectral reflectance factor, tristimulus values, and chromaticity coordinates or color space values. Therefore, to arrive at the uncertainties in the final values describing the surface color of a specimen, the uncertainties in spectral reflectance factor must be propagated through the calculations. From the measurement equation for the spectral reflectance

7
factor Ri, given by Eq. (2.2), uncertainties in Si, Ss,i, Rs,i and λ all contribute to an uncertainty in Ri.
Uncertainties in the final color values can be calculated using two different approaches. In the first, the uncertainties in Ri are propagated through to uncertainties in the tristimulus values, which are then used to calculate the uncertainties in the chromaticity coordinates or color space values. In the second approach, Eqs. (2.3) to (2.5) are substituted into the definitions of the final values to obtain equations in terms of Ri. The uncertainties in the final color values given by these equations are calculated directly from the uncertainties in Ri. In both approaches the correlations between the uncertainties in Ri at different wavelengths must be included in the calculations. In addition, if the first approach is used, the correlations between the tristimulus values are also required.
These concepts of propagating uncertainties and taking correlations into account are developed below by considering common sources of uncertainty in Ri
14,15 – signal noise, non-linearity in the signal, and uncertainties in the standard and the wavelength. Signal noise is the result of random processes in both the optical source and detector. Non-linearitys in the signal can arise from several sources; those considered here are an improper zero, mis-alignment of the specimen, and stray-light. An improper zero adds a constant value to all signals, while mis-alignment of the specimen is the result of a difference in location, with respect to the reference plane, between the specimen and the standard. For example, if the specimen and standard are physically different, it may not be possible to align one of the front surfaces with the reference plane. Stray-light is radiant flux that reaches the detector at wavelengths outside the nominal spectral bandwidth of the instrument, which adds a value to each signal. This value depends upon the spectral shape of the illumination, the spectral reflectance of both the specimen and standard, and the responsivity of the receiver. The standard has an uncertainty from its calibration, and there is an uncertainty associated with the wavelength setting of the measuring instrument.
Uncertainties in the normalized tristimulus weighting factors Wx,i, Wy,i, and Wz,i can be an additional source of uncertainty for reflectance colorimetry. For example, the weighting factors chosen for the calculation may not be appropriate for the spectral bandwidth and interval of the measuring instrument. However, the effect of this source of uncertainty is beyond the scope of this paper. Also, this paper does not address the method for obtaining the uncertainties in the signal, standard, and wavelength, other than to recommend applying the techniques found in the Guide.10
In the following, each source of uncertainty – signal noise, signal non-linearity, standard, and wavelength – is considered separately, and the sensitivity coefficients of Ri for each source are obtained using the measurement equation. The correlations between signals at the same wavelength and between reflectance factors at different wavelengths for each of these sources are considered in the analysis.
B. Uncertainty in Spectral Reflectance Factor
The sensitivity coefficients of Ri for the signals Si and Ss,i are
i
i
i
i
i
i
SR
SR
SR
==∂∂
,s
,s and (4.1)

8
i
i
i
ii
i
i
SR
SSR
SR
,s2,s
,s
,s
−=
−=
∂∂
. (4.2)
Substituting these into Eq. (3.4) and dividing by Ri2 yields the component of standard
uncertainty in Ri due to uncertainty in the signals,
),()()(2
)()()(,s
,s
,s2,s
,s2
2
2
2
2c
iii
i
i
i
i
i
i
i
i
i SSrSSu
SSu
SSu
SSu
RRu
−+= . (4.3)
The correlation coefficient r(Si, Ss,i) between the two signals depends upon the source of uncertainty. Since signal noise is a random effect, the standard uncertainties are uncorrelated and r(Si, Ss,i) = 0. From Eq. (4.3), the resulting component of standard uncertainty in Ri due to signal noise is
2,s
,s2
2
2
2
2c )()()(
i
i
i
i
i
i
SSu
SSu
RRu
+= . (4.4)
For an non-linearity in the signals, the example given by Eqs. (3.12) and (3.13) and following applies by replacing xk and xl by Si and Ss,i, respectively. If the non-linearity affects only one of the signals, for example a mis-alignment of the specimen relative to the standard, then β = 0 and there is no uncertainty in Ss,i, so Eq. (4.3) becomes
2
2
2
2c )()(
i
i
i
i
SSu
RRu
= . (4.5)
If the non-linearity affects both signals, then the correlation coefficient r(Si, Ss,i) is needed. For an improper zero, α = β since it affects both signals with the same value, so r(α, β) = 1 and therefore r(Si, Ss,i) = 1. For an non-linearity caused by stray-light, the magnitudes of the non-linearity will be different for the two signals because of the different spectral reflectance factors of the specimen and standard. However, the non-linearity can be modeled as Eqs. (3.18) and (3.19) (see Eqs. (5.2) and (5.3)), so r(α, β) = 1 and hence r(Si, Ss,i) = 1. For the non-linearity affecting both signals considered here, where r(Si, Ss,i) = 1, Eq. (4.3) becomes
2
,s
,s2
2c )()()(
⎥⎥⎦
⎤
⎢⎢⎣
⎡−=
i
i
i
i
i
i
SSu
SSu
RRu
. (4.6)
Note that for the case of an non-linearity that is the same for both signals, Eq. (4.6) implies that if the signals from the specimen and standard are the same, meaning they are similar materials, then the standard uncertainty in Ri is zero. The sensitivity coefficient of Ri for the spectral reflectance factor of the standard Rs,i is
i
i
i
i
i
i
RR
SS
RR
,s,s,s
==∂∂
, (4.7)
and Eq. (3.4) becomes
2,s
,s2
2
2c )()(
i
i
i
i
RRu
RRu
= . (4.8)
Finally, the sensitivity coefficient of Ri for wavelength λ is

9
ii
i
i RS
SR
,s,s
λλ ∂
⎟⎠⎞
⎜⎝⎛∂
=∂∂
(4.9)
and Eq. (3.4) becomes
)()( 2
2
,s2
2,s
2
2c λ
λu
SS
RR
RRu i
i
i
i
i
i
⎟⎟⎟⎟
⎠
⎞
⎜⎜⎜⎜
⎝
⎛
∂
⎟⎠⎞
⎜⎝⎛∂
= . (4.10)
Any uncertainty in Rs,i due to wavelength is included in Eq. (4.8). C. Correlations between Wavelengths The correlation coefficients r(Ri, Rj) for spectral reflectance factors at different wavelengths i and j are calculated for the sources of uncertainty considered here. These correlation coefficients are used in succeeding sections to determine the uncertainty in tristimulus values and chromaticity coordinates and color space values. For all calculations in the following, the signals and spectral reflectance factors are assumed to be positive. The sources of uncertainty associated with the signals are noise and an non-linearity. Since signal noise is a random effect, there is no correlation between wavelengths, and hence r(Ri, Rj) = 0. For an non-linearity, an extension of the approach leading to Eq. (4.6) is used, but now with four signals (from the specimen and the standard at the two wavelengths). If the non-linearity affects only one pair of signals, for example those from the specimen, then r(Ri, Rj) = 1. If the non-linearity affects all four signals, as for an improper zero or stray-light, then the correlation coefficient is given by
⎟⎟⎠
⎞⎜⎜⎝
⎛−⋅⎟
⎟⎠
⎞⎜⎜⎝
⎛−=
jjiiji SSSS
RRr,s,s
11sgn11sgn),( , (4.11)
where sgn(x) = +1 if x > 0, –1 if x < 0, and 0 if x = 0. Equation (4.11) is a result of taking the absolute values of the sensitivity coefficients for the denominator of Eq. (3.3). For the common situation where the standard has a greater reflectance factor than the specimen, Ss,i > Si for all i and r(Ri, Rj) = +1 for all i and j. On the other hand, if the standard and specimen have similar spectral reflectance factors, then r(Ri, Rj) can be –1, 0, or +1 depending upon the four signals. The spectral reflectance factor of the standard, Rs,i, has uncertainties caused by both random and systematic effects. For the random effects, r(Ri, Rj) = 0, while additional analysis is needed for the systematic effects. The spectral reflectance factor of the standard is assigned based upon absolute measurements, which involve ratios of signals and other factors. Therefore, let Rs,i be a function of these variables, so that ),,( ,2,1,s ξiii SSfR = , (4.12) where ξ accounts for the other factors that are common to all wavelengths. The sensitivity coefficients of the spectral reflectance factor of the specimen with respect to the variable ξ are

10
ξξξ ∂
∂=
∂∂
∂∂
=∂∂ i
i
ii
i
ii RRRR
RRR ,s
,s
,s
,s
and (4.13)
ξξξ ∂
∂=
∂∂
∂∂
=∂∂ j
j
jj
j
jj RRRR
RRR ,s
,s
,s
,s
. (4.14)
Therefore, the correlation coefficient is given by
⎟⎟⎠
⎞⎜⎜⎝
⎛∂
∂⋅⎟⎟
⎠
⎞⎜⎜⎝
⎛∂
∂=
ξξji
ji
RRRRr ,s,s sgnsgn),( . (4.15)
In nearly all cases, this reduces to r(Ri, Rj) = +1. For example, for the common 0:45 geometry (illumination angle of 0°, viewing angle of 45°), the spectral reflectance factor of the standard is obtained from signals proportional to the illuminating and reflected radiant flux, SI and SR, and from the projected solid angle Ω from the center of the standard to the entrance pupil of the receiver, and is given by
Ω
=1
,I
,R,s
i
ii S
SR . (4.16)
The common factor is Ω, and applying Eq. (4.15) yields r(Ri, Rj) = +1. Finally, uncertainty in the wavelength of the instrument can be correlated between wavelengths. If the uncertainty arises from random effects, then r(Ri, Rj) = 0, as usual. However, the uncertainty can also arise from systematic effects. For example, an non-linearity in wavelength may be constant or vary in a systematic manner across the wavelength range of the instrument. The sensitivity coefficients are given by Eq. (4.9), and the correlation coefficient is
⎟⎟⎟⎟
⎠
⎞
⎜⎜⎜⎜
⎝
⎛
∂
⎟⎠⎞
⎜⎝⎛∂
⋅
⎟⎟⎟⎟
⎠
⎞
⎜⎜⎜⎜
⎝
⎛
∂
⎟⎠⎞
⎜⎝⎛∂
=λλ
j
j
i
i
ji
SS
SS
RRr ,s,s sgnsgn),( . (4.17)
Therefore, the correlation coefficient for an uncertainty caused by wavelength depends upon the slopes of the signal ratios at the two wavelengths, and can have values of –1, 0, or +1. The correlation coefficients, both between signals at the same wavelength and between spectral reflectance factors at different wavelengths, are summarized in Table 1 for the common sources of uncertainty considered here. D. Calculations Based on Tristimulus Values The uncertainties in spectral reflectance factor, u(Ri) as given in Section IV.B, and their correlations between wavelengths, r(Ri, Rj) as given in Section IV.C, are used to calculate the uncertainty in the tristimulus values. The uncertainties in the tristimulus values are then used to calculate the uncertainty in the chromaticity coordinates or the color space values, taking correlations between tristimulus values into account. The uncertainty in the tristimulus value X is presented here, and similar considerations apply for Y and Z. For a given source of uncertainty, the uncertainty in X is, from Eq. (3.4), given by

11
.)()(),(2)()(1
1 1
22
1
2c jiji
j
m
i
m
ij ii
m
i i
RuRuRRrRX
RXRu
RXXu ⋅⋅⋅⎟
⎟⎠
⎞⎜⎜⎝
⎛
∂∂
⎟⎟⎠
⎞⎜⎜⎝
⎛∂∂
+⎟⎟⎠
⎞⎜⎜⎝
⎛∂∂
= ∑ ∑∑−
= +==
(4.18)
From Eq. (2.3), the sensitivity coefficients are
ii
WRX
,x=∂∂
, (4.19)
which, when substituted into Eq. (4.18) yield
)()(),(2)()(1
1 1,x,x
2
1
2,x
2c jiji
m
i
m
ijjii
m
ii RuRuRRrWWRuWXu ⋅⋅⋅⋅+⋅= ∑ ∑∑
−
= +==
. (4.20)
If r(Ri, Rj) = 0 for all wavelengths, Eq. (4.20) reduces to
∑=
⋅=m
iii RuWXu
1
22,x
2c )()( , (4.21)
while if r(Ri, Rj) = +1 for all wavelengths it becomes
2
1,x
2c )()( ⎥
⎦
⎤⎢⎣
⎡⋅= ∑
=
m
iii RuWXu . (4.22)
However, if r(Ri, Rj) = –1 for all wavelengths or depends upon the wavelengths, then Eq. (4.20) does not reduce to a simple form. The correlations between tristimulus values X and Y are presented here, and as before similar considerations apply for correlations between X and Z and between Y and Z. Substituting Eq. (4.19) and its equivalent for Y into Eq. (3.11) yields
[ ] .)()(),(
)(
)()(),(
)(),(
1
1 1,y,x,y,x
2
1,y,x
1
1 1
2
1
jiji
m
i
m
ijijji
i
m
iii
jiji
m
i
m
ij ijji
ii
m
i i
RuRuRRrWWWW
RuWW
RuRuRRrRY
RX
RY
RX
RuRY
RXYXu
⋅⋅⋅⋅+⋅+
⋅⋅=
⋅⋅⋅⎥⎥⎦
⎤
⎢⎢⎣
⎡
∂∂
∂∂
+∂∂
∂∂
+
∂∂
∂∂
=
∑ ∑
∑
∑ ∑
∑
−
= +=
=
−
= +=
=
(4.23)
Substituting Eq. (4.23) and the square roots of Eq. (4.20) and its equivalent for Y into Eq. (3.3) yields the correlation coefficient between X and Y,
)()(
),(),(YuXu
YXuYXr⋅
= . (4.24)
Note that r(X, Y) can have values between –1 and +1, depending on the values of r(Ri, Rj), u(Ri), and u(Rj), and hence is a function of the source of uncertainty. The uncertainties in chromaticity coordinates and color space values are obtained from their dependence on the tristimulus values. Let Γ represent either a chromaticity coordinate or a color space value. Using Eq. (3.4) with xk = X, Y, or Z, the combined uncertainty from each source is given by

12
.)()(),(2
)()(),(2
)()(),(2
)()()()( 22
22
22
2
ZuYuZYrZY
ZuXuZXrZX
YuXuYXrYX
ZuZ
YuY
XuX
uc
⋅⋅⋅⎟⎠⎞
⎜⎝⎛
∂Γ∂
⎟⎠⎞
⎜⎝⎛
∂Γ∂
+
⋅⋅⋅⎟⎠⎞
⎜⎝⎛
∂Γ∂
⎟⎠⎞
⎜⎝⎛
∂Γ∂
+
⋅⋅⋅⎟⎠⎞
⎜⎝⎛
∂Γ∂
⎟⎠⎞
⎜⎝⎛
∂Γ∂
+
⎟⎠⎞
⎜⎝⎛
∂Γ∂
+⎟⎠⎞
⎜⎝⎛
∂Γ∂
+⎟⎠⎞
⎜⎝⎛
∂Γ∂
=Γ
(4.25)
The sensitivity coefficients for common chromaticity coordinates and color space values are given in Appendix A, while the standard uncertainties u(X), u(Y), and u(Z) are given by Eq. (4.18) and its equivalents, and the correlation coefficients r(X, Y), r(X, Z) and r(Y, Z) are given by Eq. (4.24) and its equivalents. An interesting result for the chromaticity coordinates x and y is that, if the standard uncertainty is a constant proportion of the reflectance factor at all wavelengths, and the correlation coefficient between wavelengths is +1, then the uncertainty in x and y is zero. This is usually the case for an uncertainty in the standard caused by systematic effects. The uncertainties in chroma C and hue h can be derived is a similar fashion. Using the L*, a*, b* color space as an example, the chroma Cab* is given by 22
ab *)(*)(* baC += (4.26) and the combined uncertainty in chroma is given by
.*)(*)(*)*,(
**
**2
*)(***)(
***)(
abab
22
ab22
abab
2c
buaubarb
Ca
C
bub
Caua
CCu
⋅⋅⋅⎟⎠⎞
⎜⎝⎛
∂∂
⎟⎠⎞
⎜⎝⎛
∂∂
+
⎟⎠⎞
⎜⎝⎛
∂∂
+⎟⎠⎞
⎜⎝⎛
∂∂
= (4.27)
A similar equation applies for hab*. The correlation coefficient r(a*, b*) is given by
*)(*)(
*)*,(*)*,(buau
baubar⋅
= , (4.28)
where u(a*) and u(b*) are given by Eq. (4.25) and u(a*, b*), from Eq. (3.11), is given by
.)()(),(****
)()(),(****
)()(),(****
)(***)*,( 2
ZuYuZYrYb
Za
Zb
Ya
ZuXuZXrXb
Za
Zb
Xa
YuXuYXrXb
Ya
Yb
Xa
YuYb
Yabau
⋅⋅⋅⎥⎦⎤
⎢⎣⎡
∂∂
∂∂
+∂∂
∂∂
+
⋅⋅⋅⎥⎦⎤
⎢⎣⎡
∂∂
∂∂
+∂∂
∂∂
+
⋅⋅⋅⎥⎦⎤
⎢⎣⎡
∂∂
∂∂
+∂∂
∂∂
+
∂∂
∂∂
=
(4.29)
Note that the correlation coefficient r(a*, b*) applies to both Cab* and hab*.

13
E. Calculations Based on Spectral Reflectance Factors The chromaticity coordinates and color space values can also be calculated directly from the spectral reflectance factor by substituting Eqs. (2.3) to (2.5) into their definitions. The uncertainties in the chromaticity coordinates and color space values are then calculated from the uncertainties in the spectral reflectance factor using Eq. (3.4). The sensitivity coefficients in terms of the spectral reflectance factor are obtained by applying the chain rule, so again letting Γ represent either a chromaticity coordinate or a color space value
iiii R
ZZR
YYR
XXR ∂
∂∂
Γ∂+
∂∂
∂Γ∂
+∂∂
∂Γ∂
=∂
Γ∂ . (4.30)
The derivatives with respect to the tristimulus values are given in Appendix A. Using Eq. (4.30) with Eq. (3.4) yields the combined uncertainty in Γ for each source of uncertainty,
)()(),(2)()(1
1 1
22
1
2c jiji
j
m
i
m
ij ii
m
i i
RuRuRRrRR
RuR
u ⋅⋅⋅⎟⎟⎠
⎞⎜⎜⎝
⎛
∂Γ∂
⎟⎟⎠
⎞⎜⎜⎝
⎛∂
Γ∂+⎟⎟
⎠
⎞⎜⎜⎝
⎛∂
Γ∂=Γ ∑ ∑∑
−
= +==
. (4.31)
The uncertainties in chroma and hue in terms of uncertainties in the spectral reflectance factor are also obtained by applying the chain rule. Using the example of Cab*,
iii R
bb
CRa
aC
RC
∂∂
∂∂
+∂∂
∂∂
=∂
∂ ****
*** ababab , (4.32)
where ∂a*/∂Ri and ∂b*/∂Ri are given by Eq. (4.30). F. Summary A step-by-step summary of the procedure for analyzing uncertainties in reflectance colorimetry is presented below. The relevant equations and sections for each step are given in brackets. The variable Γ below represents the final value, either a chromaticity coordinate such as u’ or v’ or a color space value such as L*, a*, or b*. 1. Identify all independent sources of uncertainty. 2. Assign standard uncertainties to these sources, as described in the Guide. 3. Calculate the standard uncertainty in spectral reflectance factor, u(Ri), for each source
of uncertainty, using the measurement equation and taking any correlations between signals at the same wavelength into account with the correlation coefficient r(Si, Ss,i). [Eq. (2.2) and Section IV.B]
4. Calculate the correlation coefficient between spectral reflectance factors at different wavelengths, r(Ri, Rj), for each source of uncertainty. [Section IV.C]
5. If using the tristimulus values to calculate Γ a. Calculate the uncertainties in the tristimulus values based on u(Ri) and r(Ri, Rj)
from steps 3 and 4 for each source of uncertainty. [Eq. (4.18)] b. Calculate the correlation coefficients between the tristimulus values for each
source of uncertainty. [Eq. (4.24)] c. Calculate the sensitivity coefficients for Γ with respect to the tristimulus values,
∂Γ/∂X, ∂Γ/∂Y, and ∂Γ/∂Z. [Appendix A]

14
d. Calculate the uncertainty in Γ using the results from steps a, b, and c for each source of uncertainty. [Eq. (4.25)]
6. If using the spectral reflectance factor to calculate Γ a. Calculate the sensitivity coefficient for Γ with respect to Ri. [Eq. (4.30) and
Appendix A] b. Calculate the uncertainty in Γ using the results from steps 3 and 4 for each source
of uncertainty. [Eq. (4.31)] 7. Calculate the final uncertainty in Γ using the root-sum-square of the uncertainties
from all the sources obtained in step 5.d or 6.b. V. Example Calculations The general concepts of uncertainty analysis for reflectance colorimetry detailed above are applied to an example. The uncertainties in the L*, a*, b* color space values from the common sources of uncertainty considered above for four representative specimens are calculated for the Commission Internationale de l’Eclairage (CIE) D65 Standard Illuminant and the 1964 Standard Colorimetric Observer.16 The signals used in the calculations are taken from measurements on a reference instrument. The instrument consists of a quartz-tungsten-halogen lamp, a monochromator illuminator, and a silicon photodiode detector, the geometry of measurement is 0:45, and the wavelength increment and spectral bandwidth were both 5 nm. While the uncertainties calculated below are specific to the specimens and instrument, the purpose of this example is to illustrate the uncertainty analysis so that it can be more easily applied to other specimens and instruments. The spectral reflectance factors of the four representative specimens and the standard are shown in Fig. 1, along with designations based upon their color. These designations will be used for the remainder of this section. The standard was Spectralon*, which has a nearly constant reflectance factor over the wavelength range. The gray specimen is spectrally neutral, while the red specimen has a reflectance factor that is small at short wavelengths and then increases rapidly to become large at long wavelengths. The green and deep blue specimens have maxima of their reflectance factors at different wavelengths. The wavelength range in Fig. 1 extends past the limits for color calculations, 380 nm to 780 nm, because stray-light contributes to the signal from all wavelengths at which the detector is sensitive, in this case as long as 1100 nm. The weighting factors for the D65 Illuminant and the 1964 Observer are shown in Fig. 2. The signals from the instrument when measuring the Spectralon standard are shown in Fig. 3 as a function of wavelength. The features in the signal at wavelengths of 460 nm and 750 nm are due to a change of the order-sorting filter. From the measurement equation, Eq. (2.2), since the reflectance factor of the standard is nearly constant, the signals from the specimen are essentially the reflectance factors multiplied by the signal shown in Fig. 3.
* Certain commercial equipment, instruments, or materials are identified in this paper to foster understanding. Such identification does not imply recommendation or endorsement by the National Institute of Standards and Technology, nor does it imply that the materials or equipment identified are necessarily the best available for the purpose.

15
Following the first two steps in Section IV.F, the sources of uncertainty are the same as those considered above and listed in Table 1. The standard uncertainties for each source are chosen to be representative of a high-quality instrument. The uncertainty due to noise in the signals is a constant 0.1 % for both the specimen and the standard, so
001.0)()(
,s
,s ==i
i
i
i
SSu
SSu . (5.1)
The uncertainty due to an non-linearity of the specimen affects only the signal from the specimen, and is also a constant 0.1 %. The uncertainty due to stray-light affects both the specimen and standard signals. The uncertainty is modeled by ∑ −⋅=
i
Nii SSu 10)( and (5.2)
∑ −⋅=i
Nii SSu 10)( ,s,s , (5.3)
where N is the stray-light rejection, taken to be N = 6 for this example. The uncertainty due to wavelength is u(λ) = 0.1 nm across the entire wavelength range. The uncertainty in the reflectance factor of the standard due to random effects is 0.02 %, while the uncertainty due to systematic effects is 0.2 %. These uncertainties for the standard are typical of those from a national metrology institute.17 The third step in Section IV.F is to calculate the standard uncertainty in the spectral reflectance factor for each source of uncertainty. Using Eq. (5.1) for the uncertainty in the signals due to noise, and Eq. (4.4), the standard uncertainty in the reflectance factor is
0014.0)001.0()001.0()( 22c =+=
i
i
RRu
. (5.4)
For an uncertainty due to an non-linearity affecting only the signal from the specimen, Eq. (4.5) is applicable, and so
001.0)(c =
i
i
RRu
. (5.5)
However, for an uncertainty due to stray-light, which affects both signals, Eq. (4.6) is applicable, so combining this with Eqs. (5.2) and (5.3) and taking the positive square root yields
i
i
i
i
i
i
SS
SS
RRu
,s
,s6c 10)( ∑∑ −= − . (5.6)
For an uncertainty due to wavelength, Eq. (4.10) applies, and so
nm1.0)( ,s,sc ⋅
∂
⎟⎠⎞
⎜⎝⎛∂
=λ
i
i
i
i
i
iS
S
RR
RRu
. (5.7)
For the uncertainties in the standard due to both random and systematic effects, Eq. (4.8) applies, so
0002.0)(c =
i
i
RRu
(5.8)

16
for the random effects and
002.0)(c =
i
i
RRu
(5.9)
for the systematic effects. The fourth step in Section IV.F is to calculate the correlation coefficient between spectral reflectance factors at different wavelengths for each source of uncertainty. These are given in Table 1. The fifth and sixth steps are to calculate the uncertainties in L*, a*, and b* from either the tristimulus values or directly from the spectral reflectance factors. Both approaches are presented here. Given the uncertainties in spectral reflectance factor and their correlations for each source of uncertainty, and the weighting factors for the Illuminant and Observer, the uncertainties in the tristimulus values are given by Eq. (4.20) for X and its equivalent for Y and Z. The correlation coefficients between tristimulus values are given by Eqs. (4.23) and (4.24) for X, with similar equations for Y and Z. For uncertainties due to systematic effects (those with r(Ri, Rj) = –1 or +1), the correlation coefficients are identically one. The correlation coefficients for uncertainties due to random effects are given in Table 2 for each specimen. Referring to Figs. 1 and 2, the correlation coefficient for X and Y is largest for all the colors in Table 2 because these weighting functions have the most overlap with each other. This behavior is enhanced for the red specimen because the reflectance factor is small for wavelengths shorter than 600 nm. The uncertainties in L*, a*, and b* are calculated using Eq. (4.25). The sensitivity coefficients ∂L*/∂Y, ∂a*/∂X, ∂a*/∂Y, ∂b*/∂Y, and ∂b*/∂Z are given by Eqs. (A.13) to (A.17), the uncertainties in the tristimulus values u(X), u(Y), and u(Z) are given by Eq. (4.20) and its equivalents, and the correlation coefficients between the tristimulus values r(X, Y), r(X, Z) and r(Y, Z) are either +1 for uncertainties caused by systematic effects or are given in Table 2 for uncertainties caused by random effects. For example, L* is a function only of Y, so the uncertainty in L* is given by
)(13
116*)( 2
23
1
22c Yu
YYLu
n ⎥⎥
⎦
⎤
⎢⎢
⎣
⎡
⎟⎟⎠
⎞⎜⎜⎝
⎛= (5.10)
while a* is a function of X and Y so the uncertainty in a* is given by
.)()(),(113
5003
5002
)(13500)(1
3500*)(
31
n2
31
n2
2
23
1
n2
2
23
1
n2
2c
YuXuYXrYYXX
YuYY
XuXX
au
⋅⋅⎟⎟⎠
⎞⎜⎜⎝
⎛⎟⎟⎠
⎞⎜⎜⎝
⎛⋅⋅−
⎥⎥
⎦
⎤
⎢⎢
⎣
⎡
⎟⎟⎠
⎞⎜⎜⎝
⎛−+
⎥⎥
⎦
⎤
⎢⎢
⎣
⎡
⎟⎟⎠
⎞⎜⎜⎝
⎛=
(5.11)
The uncertainties in Cab* and hab* are calculated using Eq. (4.27) and its equivalent for hab* and the uncertainties u(a*) and u(b*) given by the procedure detailed in the previous paragraph. The correlation coefficient r(a*, b*) = –1 or +1 for uncertainties caused by systematic effects, and is given in Table 2 for uncertainties caused by random effects. The sensitivity coefficients ∂Cab*/∂a*, ∂Cab*/∂b*, ∂hab*/∂a*, and ∂hab*/∂b* are given by Eqs. (A.18) to (A.21). For example, the uncertainty in Cab* is given by
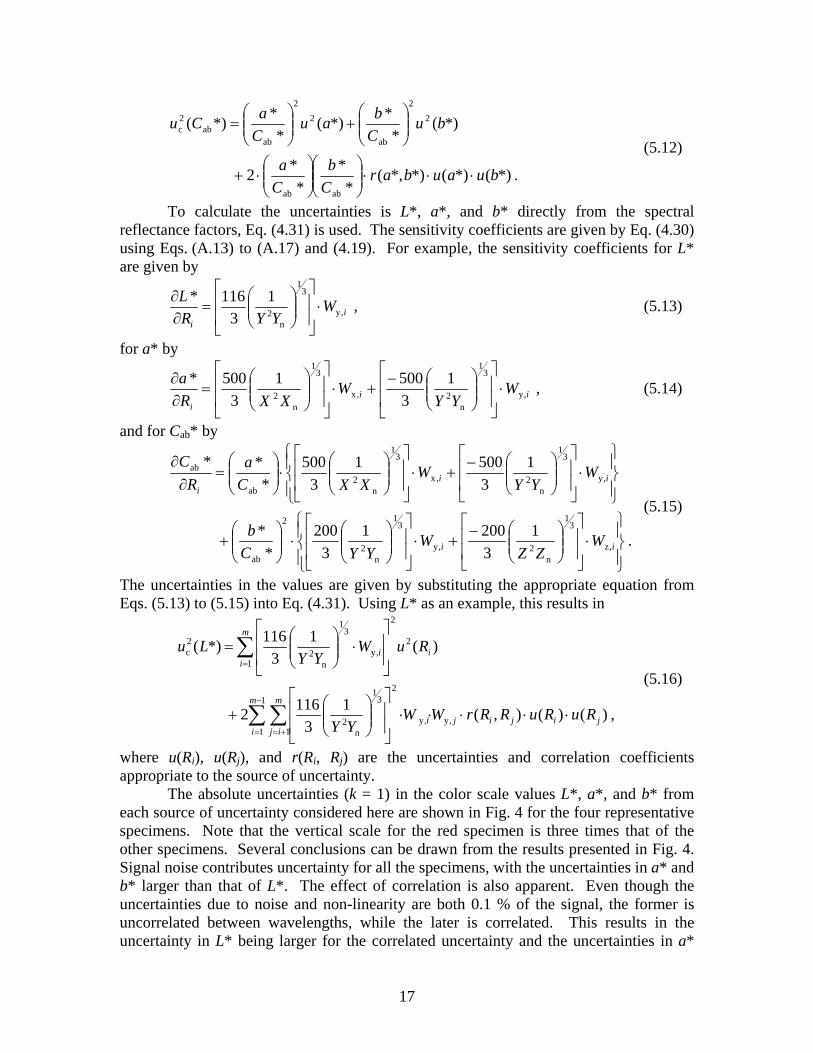
17
.*)(*)(*)*,(*
**
*2
*)(*
**)(*
**)(
abab
22
ab
22
abab
2c
buaubarCb
Ca
buCbau
CaCu
⋅⋅⋅⎟⎟⎠
⎞⎜⎜⎝
⎛⎟⎟⎠
⎞⎜⎜⎝
⎛⋅+
⎟⎟⎠
⎞⎜⎜⎝
⎛+⎟⎟
⎠
⎞⎜⎜⎝
⎛=
(5.12)
To calculate the uncertainties is L*, a*, and b* directly from the spectral reflectance factors, Eq. (4.31) is used. The sensitivity coefficients are given by Eq. (4.30) using Eqs. (A.13) to (A.17) and (4.19). For example, the sensitivity coefficients for L* are given by
ii
WYYR
L,y
31
n21
3116*
⋅⎥⎥
⎦
⎤
⎢⎢
⎣
⎡⎟⎟⎠
⎞⎜⎜⎝
⎛=
∂∂ , (5.13)
for a* by
iii
WYY
WXXR
a,y
31
n2,x
31
n2
135001
3500*
⋅⎥⎥
⎦
⎤
⎢⎢
⎣
⎡
⎟⎟⎠
⎞⎜⎜⎝
⎛−+⋅
⎥⎥
⎦
⎤
⎢⎢
⎣
⎡
⎟⎟⎠
⎞⎜⎜⎝
⎛=
∂∂ , (5.14)
and for Cab* by
.132001
3200
**
135001
3500
***
,z
31
n2,y
31
n2
2
ab
,y
31
n2,x
31
n2
ab
ab
⎪⎭
⎪⎬⎫
⎪⎩
⎪⎨⎧
⋅⎥⎥
⎦
⎤
⎢⎢
⎣
⎡
⎟⎟⎠
⎞⎜⎜⎝
⎛−+⋅
⎥⎥
⎦
⎤
⎢⎢
⎣
⎡
⎟⎟⎠
⎞⎜⎜⎝
⎛⋅⎟⎟
⎠
⎞⎜⎜⎝
⎛+
⎪⎭
⎪⎬⎫
⎪⎩
⎪⎨⎧
⋅⎥⎥
⎦
⎤
⎢⎢
⎣
⎡
⎟⎟⎠
⎞⎜⎜⎝
⎛−+⋅
⎥⎥
⎦
⎤
⎢⎢
⎣
⎡
⎟⎟⎠
⎞⎜⎜⎝
⎛⋅⎟⎟
⎠
⎞⎜⎜⎝
⎛=
∂∂
ii
iii
WZZ
WYYC
b
WYY
WXXC
aR
C
(5.15)
The uncertainties in the values are given by substituting the appropriate equation from Eqs. (5.13) to (5.15) into Eq. (4.31). Using L* as an example, this results in
,)()(),(13
1162
)(13
116*)(
,y,y
21
1 1
31
n2
1
2
2
,y
31
n2
2c
jijiji
m
i
m
ij
m
iii
RuRuRRrWWYY
RuWYY
Lu
⋅⋅⋅⋅⋅⎥⎥
⎦
⎤
⎢⎢
⎣
⎡⎟⎟⎠
⎞⎜⎜⎝
⎛+
⎥⎥
⎦
⎤
⎢⎢
⎣
⎡⋅⎟⎟
⎠
⎞⎜⎜⎝
⎛=
∑ ∑
∑
−
= +=
=
(5.16)
where u(Ri), u(Rj), and r(Ri, Rj) are the uncertainties and correlation coefficients appropriate to the source of uncertainty. The absolute uncertainties (k = 1) in the color scale values L*, a*, and b* from each source of uncertainty considered here are shown in Fig. 4 for the four representative specimens. Note that the vertical scale for the red specimen is three times that of the other specimens. Several conclusions can be drawn from the results presented in Fig. 4. Signal noise contributes uncertainty for all the specimens, with the uncertainties in a* and b* larger than that of L*. The effect of correlation is also apparent. Even though the uncertainties due to noise and non-linearity are both 0.1 % of the signal, the former is uncorrelated between wavelengths, while the later is correlated. This results in the uncertainty in L* being larger for the correlated uncertainty and the uncertainties in a*

18
and b* being smaller. The uncertainties caused by random effects in the standard are simply reduced in magnitude from those caused by signal noise. The uncertainties caused by systematic effects in the standard are significant for all the specimens, and can be the largest source of uncertainty for those specimens with nearly constant reflectance factor over the visible wavelength region. The uncertainties caused by wavelength and stray-light also depend on the spectral shape of the reflectance factor. The largest uncertainties due to wavelength are for the red specimen, whose reflectance factor increases rapidly with wavelength. The reflectance factors of the deep blue and green specimens also depend upon wavelength, but the slope of the reflectance factor, and hence the sensitivity coefficients, changes sign several times over the wavelength range. In addition, the reflectance factor of the deep blue specimen is nearly constant over much of the visible wavelength range. The uncertainty due to stray-light is largest for the red specimen because of the combination of the spectral reflectance factor of this color, shown in Fig. 1, and the radiant flux illuminating the specimen, which is proportional to the signal in Fig. 3. Since the reflectance factor is small over the wavelength range where the flux is also low, while both are large at longer wavelengths, there is a significant stray-light contribution to the signals at short wavelengths and hence a contribution to the uncertainty in L*, a*, and b*. Finally, the uncertainties are smallest for those specimens with a spectral reflectance factor similar to that of the standard, namely gray, while the uncertainties are largest for those specimens that are most dissimilar. The results shown in Fig. 4 are not sensitive to the Standard Illuminant or Observer chosen for the analysis, provided an illuminant with sharp spectral features at only one or a few wavelengths is not used. Also, the uncertainties are proportional to the magnitudes of uncertainties of the sources. If the uncertainty for one of the sources is increased by a factor of ten, then the corresponding uncertainty shown in Fig. 4 is also increased by a factor of ten. The combined uncertainty in L*, a*, or b* is the root-sum-square of the uncertainties due to all the sources. For example, for the red specimen, the combined uncertainty in b* is uc(b*) = [0.0102 + 0.0122 + 0.2842 + 0.0712 + 0.0012 + 0.0242]1/2 = 0.294. The expanded uncertainty of b*, with a coverage factor k = 2, is 0.588. VI. Summary
Uncertainties in reflectance colorimetry are important, and have received attention over the years. Application of the ISO Guide to the Expression of Uncertainty in Measurement allows the uncertainties to be calculated using a systematic, analytical approach. This requires consideration of the measurement equation, relating signals to spectral reflectance factor, and correlations both between signals at the same wavelength and between reflectance factors at different wavelengths. This approach was detailed for common sources of uncertainty and applied to representative object colors and instrument parameters. Acknowledgements James Gardner is thanked for several useful discussions.

19
References of Appendix B 1. Nimeroff I. Propagation of errors in spectrophotometric colorimetry. J Opt Soc Am
1953; 43: 531-533. 2. Shipley T, Walker GL. Chromatic significance of spectrophotometric errors. J Opt
Soc Am 1956; 46: 1052-1060. 3. Nimeroff I. Propagation of errors in tristimulus colorimetry. J Opt Soc Am 1957;
47: 697-702. 4. Robertson AR,. Colorimetric significance of spectrophotometric errors. J Opt Soc
Am 1967; 57: 691-698. 5. Kishner SJ. Effect of spectrophotometric errors on color difference. J Opt Soc Am
1977; 67: 772-778. 6. Wyszecki G, Stiles WS, Color Science: Concepts and Methods, Quantitative Data
and Formulae, 2nd Edition. New York: John Wiley and Sons; 1982, p. 328-330. 7. Berns RS, Petersen KH. Empirical modeling of systematic spectrophotometric
errors. Color Res Appl 1988; 13: 243-256. 8. Fairchild MD, Reniff L. Propagation of random errors in spectrophotometric
colorimetry. Color Res Appl 1991; 16: 360-367. 9. Burns PD, Berns RS. Error propagation analysis in color measurement and imaging.
Color Res Appl 1997; 22: 280-289. 10. Guide to the Expression of Uncertainty in Measurement. Geneva: International
Organization for Standardization; 1993. 11. Gardner JL, Frenkel RB. Correlation coefficients for tristimulus response value
uncertainties. Metrologia 1999; 36: 477-480. 12. Gardner JL. Uncertainty estimation in colour measurement. Color Res Appl 2000;
25: 349-355. 13. Standard Practice for Computing the Colors of Objects by Using the CIE System,
E 308. West Conshohocken, Pennsylvania: American Society for Testing and Materials; 1999.
14. Zwinkels JC. Errors in colorimetry caused by the measuring instrument. Text Chem Color 1989; 21: 23-29.
15. Good Practice Guide to Surface Colour Measurement. European Commission, EUR 19552; 2001.
16. CIE Publication No. 15.2, Colorimetry, 2nd Edition. Vienna, Austria: Commission Internationale de l’Eclairage; 1986.
17. Barnes PY, Early EA, Parr AC. Spectral reflectance, NIST Special Publication 250-48. U. S. Dept. of Commerce; 1998.

20
Appendix A. Sensitivity coefficients for common chromaticity coordinates and color space values 1. Chromaticity coordinates a. x, y
2)( ZYXZY
Xx
+++
=∂∂ (A.1)
2)( ZYXX
Yx
++−
=∂∂ (A.2)
2)( ZYXX
Zx
++−
=∂∂ (A.3)
2)( ZYXY
Xy
++−
=∂∂ (A.4)
2)( ZYXZX
Yy
+++
=∂∂ (A.5)
2)( ZYXY
Zy
++−
=∂∂ (A.6)
b. u’, v’
2)315(1260
ZYXZY
Xu
+++
=∂
′∂ (A.7)
2)315(60
ZYXX
Yu
++−
=∂
′∂ (A.8)
2)315(12
ZYXX
Zu
++−
=∂
′∂ (A.9)
2)315(9
ZYXY
Xv
++−
=∂
′∂ (A.10)
2)315(279
ZYXZX
Yv
+++
=∂
′∂ (A.11)
2)315(27
ZYXY
Zv
++−
=∂
′∂ (A.12)
2. Color space values a. L*, a*, b*
3
1
n2
13
116*⎟⎟⎠
⎞⎜⎜⎝
⎛=
∂∂
YYYL
(A.13)

21
3
1
n21
3500*
⎟⎟⎠
⎞⎜⎜⎝
⎛=
∂∂
XXXa (A.14)
3
1
n21
3500*
⎟⎟⎠
⎞⎜⎜⎝
⎛−=
∂∂
YYYa (A.15)
3
1
n21
3200*
⎟⎟⎠
⎞⎜⎜⎝
⎛=
∂∂
YYYb (A.16)
3
1
n21
3200*
⎟⎟⎠
⎞⎜⎜⎝
⎛−=
∂∂
ZZZb (A.17)
*
***
ab
ab
Ca
aC
=∂
∂ (A.18)
*
***
ab
ab
Cb
bC
=∂
∂ (A.19)
( )2
ab
ab
**
**
Cb
ah −
=∂
∂ (A.20)
( )2
ab
ab
**
**
Ca
bh
=∂
∂ (A.21)
b. L*, u*, v*
3
1
n2
13
116*⎟⎟⎠
⎞⎜⎜⎝
⎛=
∂∂
YYYL
(A.22)
2)315(1260*13*
ZYXZYL
Xu
+++
⋅=∂∂ (A.23)
2n
31
n2 )315(
60*13)(13
11613*ZYX
XLuuYYY
u++
−⋅+′−′⎟⎟
⎠
⎞⎜⎜⎝
⎛=
∂∂ (A.24)
2)315(12*13*
ZYXXL
Zu
++−
⋅=∂∂ (A.25)
2)315(9*13*
ZYXYL
Xv
++−
⋅=∂∂ (A.26)
2n
31
n2 )315(
279*13)(13
11613*ZYX
ZXLvvYYY
v++
+⋅+′−′⎟⎟
⎠
⎞⎜⎜⎝
⎛=
∂∂ (A.27)
2)315(27*13*
ZYXYL
Zv
++−
⋅=∂∂ (A.28)
*
***
uv
uv
Cu
uC
=∂
∂ (A.29)

22
*
***
uv
uv
Cv
vC
=∂
∂ (A.30)
( )2*
***
uv
uv
Cv
uh −
=∂
∂ (A.31)
( )2*
***
uv
uv
Cu
vh
=∂
∂ (A.32)

23
Tables Table 1. Correlation coefficients for common sources of uncertainty
Correlation Coefficient Source of Uncertainty r(Si, Ss,i) r(Ri, Rj) Signal Noise 0 0 Non-linearity One signal -- +1 Two signals +1 +1 a [Eq. (4.11)] Standard Random effects -- 0 Systematic effects -- +1 b [Eq. (4.15)] Wavelength -- –1, 0, or +1 [Eq. (4.17)] Notes:
a r(Ri, Rj) = +1 if Ss,i > Si or Ss,i < Si for all wavelengths i. Otherwise, r(Ri, Rj) = –1, 0, or
+1 depending on the magnitudes of the signals.
b +1 in nearly all cases
Table 2. Correlation coefficients between tristimulus values and a* and b* due to
uncertainties caused by random effects Correlation Coefficient
Specimen Color Gray Deep Blue Green Red
r(X, Y) 0.7746 0.7289 0.7299 0.9648 r(X, Z) 0.2957 0.3070 0.2299 0.0281 r(Y, Z) 0.1381 0.1549 0.1850 0.0330 r(a*, b*) -0.4215 -0.3653 -0.4344 0.5539

24
Figure Captions
Figure 1. Reflectance factor as a function of wavelength for the example specimens and the standard. The colors of the specimens are indicated.
Figure 2. Weighting factors as a function of wavelength for the D65 Illuminant and 1964 Observer.
Figure 3. Signal as a function of wavelength when measuring the standard. Figure 4. Absolute uncertainties (k = 1) in the L*, a*, b* color scale values caused by the
indicated sources of uncertainty for the example specimens. The sources of uncertainty are noise in the signals, an non-linearity of the specimen signals, stray-light contribution to the signals, the wavelength of the instrument (WL), and the reflectance factor of the standard (Std) caused by random (R) and systematic (S) effects.

25
300 400 500 600 700 800 900 1000 11000.0
0.1
0.2
0.3
0.4
0.5
0.6
0.7
0.8
0.9
1.0
GreenDeep Blue
Red
Gray
StandardR
efle
ctan
ce F
acto
r
Wavelength [nm]
Figure 1.
300 400 500 600 700 8000
1
2
3
4
5
6
7
8
9
10
11Wz
WyWx
Wei
ghtin
g Fa
ctor
Wavelength [nm]
Figure 2.

26
300 400 500 600 700 800 900 1000 1100
0
10
20
30
40
50Si
gnal
[mV]
Wavelength [nm]
Figure 3.

27
Noise Offset Stray WL Std (R)Std (S)0.00
0.03
0.06
0.09
0.12 (c) Green
Unc
erta
inty
Source of Uncertainty
L* a* b*
Noise Offset Stray WL Std (R)Std (S)0.00
0.09
0.18
0.27
0.36 (d) Red
Unc
erta
inty
Source of Uncertainty
L* a* b*
Noise Offset Stray WL Std (R)Std (S)0.00
0.03
0.06
0.09
0.12(b) Deep Blue
Unc
erta
inty
Source of Uncertainty
L* a* b*
Noise Offset Stray WL Std (R)Std (S)0.00
0.03
0.06
0.09
0.12(a) Gray
Unc
erta
inty
Source of Uncertainty
L* a* b*
Figure 4.


![NBS TECHNICAL NOTE - NIST Page · 2014. 6. 23. · experiencedintheU.S.Cullen[6,7]measuredeffectsofsubstrates,surface color, insulation andsurface treatment on solarheating and radiativecooling](https://img.dokumen.tips/doc/110x75/60bfc0f2d91a8f4e66214bd7/nbs-technical-note-nist-page-2014-6-23-experiencedintheuscullen67measuredeffectsofsubstratessurface.jpg)


![SS47 THE LOVIBOND COLOR SYSTEM - NIST Page · Gibson,Harris,] rp^LovihmdCohrSysUm 5 obtainedbythisbureaudirectlyfromtheLovibondestablishment, TheTintometer(Ltd.),inEngland,arenotconsistentamongthem-](https://img.dokumen.tips/doc/110x75/5b15ce447f8b9a8b288e382d/ss47-the-lovibond-color-system-nist-page-gibsonharris-rplovihmdcohrsysum.jpg)