Embed Size (px)
Citation preview
SOCIAL AND ECONOMIC COST-BENEFIT ANALYSIS of
RURAL MAINTENANCE PROGRAMME IN BANGLADESH
(September 2006)
Rural Maintenance Programme (RMP) CARE Bangladesh
SOCIAL AND ECONOMIC COST-BENEFIT ANALYSIS of
RURAL MAINTENANCE PROGRAMME IN BANGLADESH
(September 2006)
Rural Maintenance Programme (RMP) CARE Bangladesh

Social and Economic Cost Benefit Analysis: Conducted by: Ashraf Uddin Chowdhury, Abul Barkat, Avijit Poddar, Murtaza Majid,
Nazme Sabina, Matiur Rahman, Saiful Hoque. Human Development Research Centre (HDRC) ([email protected], [email protected]) David B.C. Williams, Jack Baker
AgroDev Canada Inc. (email)
Supervised by: Farzana Bilkes, Project Coordinator, Research, Evaluation and Development
(RED) Unit, RMP, CARE Bangladesh Supported by: Md. Belayet Hossain, Ansar A. Siddique, Sharlene Ramkissoon, RED Unit, RMP,
CARE Bangladesh

Preface: RMP is grateful to the team comprised of the Human Development Research Centre (HDRC) and AgroDev Canada for carrying out this important Social and Economic Cost Benefit Analysis of our programme. We are highly indebted to Professors Abul Barkat and Ashraf Chowdhury and their research team at HDRC, and to David Williams and Jack Baker of AgroDev for jointly conducting this research and analysis and developing this report. We would like to thank Farzana Bilkes (Project Coordinator, RED Unit, RMP) for supervising this activity. We would also like to thank the RED Unit (Md. Belayet Hossain, Ansar A. Siddique and Sharlene Ramkissoon), the Programme Support Unit (especially AFM Rokon Alam), and the Operations Unit (headed by S.M.M. Kabir) for providing invaluable support throughout the entire process. RMP also gratefully acknowledges Irena Wosk, former Programme Coordinator of RMP, Dr. Philip Tanner, Asia Regional Director, CARE Canada, and Jalal Bhuiyan, Programme Manager, International Operations, CARE Canada, for their crucial contributions to this undertaking. We would like to thank our Field Office staff who provided us with support. We are also indebted to Hasan M. Mazumdar, Deputy Director of CARE Bangladesh, and our esteemed donors from the EC and CIDA for their guidance. Our gratitude is also extended to those who participated in the survey, and all others who aided us in producing this report.

Table of Contents Acknowledgements Abbreviations Executive Summary ………………………..………………………………………………...…………i
CHAPTER 1: INTRODUCTION ................................................................................................................ 1
1.1. BACKGROUND ............................................................................................................................... 1 1.2. EVOLUTION OF RMP ..................................................................................................................... 2 1.3. PREVIOUS STUDIES ON RMP ......................................................................................................... 2 1.4. OBJECTIVES AND SCOPE ................................................................................................................ 4 1.5. ORGANIZATION OF THE REPORT ................................................................................................... 5
CHAPTER 2: METHODOLOGY ............................................................................................................... 6
2.1 CONCEPTS AND DEFINITIONS ........................................................................................................ 6 2.2 COST AND BENEFIT COMPONENTS ................................................................................................ 6 2.3 STUDY DESIGN .............................................................................................................................. 7 2.4 IMPACT INDICATORS ..................................................................................................................... 7 2.5 DATA AND DATA COLLECTION INSTRUMENTS ............................................................................. 8 2.6 OVERVIEW OF STUDY IMPLEMENTATION .................................................................................... 10
CHAPTER 3: STUDY AREA AND HOUSEHOLD PROFILE ............................................................. 11
3.1 SAMPLE UNIONS PROFILE ........................................................................................................... 11 3.2 HOUSEHOLD PROFILE - GENERAL ............................................................................................... 14 3.3 HOUSEHOLD PROFILE - DESTITUTE WOMEN ............................................................................... 15
CHAPTER 4: BENEFIT STREAM OF RMP – STOCK & FLOW OF TRAFFIC ............................. 16
4.1 STOCK OF VEHICLES ................................................................................................................... 16 4.2 VEHICLE FLOW ........................................................................................................................... 16 4.3 HOUSEHOLDS’ RMP ROAD USE STATUS .................................................................................... 17 4.4 PURPOSE OF RMP ROAD USE ...................................................................................................... 18
CHAPTER 5: BENEFIT STREAM – HOUSEHOLD LEVEL .............................................................. 19
5.1 CATEGORIES OF HOUSEHOLD BENEFITS ..................................................................................... 19 5.2 INCOME BENEFITS ....................................................................................................................... 23 5.3 EDUCATION BENEFITS ................................................................................................................ 24 5.4 HEALTH BENEFITS ...................................................................................................................... 25 5.5 MARKET AND ORGANIZATIONAL FACILITY DEVELOPMENT ....................................................... 26 5.6 TRAINING .................................................................................................................................... 28
CHAPTER 6: BENEFIT STREAM – DESTITUTE WOMEN .............................................................. 29
6.1 ECONOMIC BENEFIT .................................................................................................................... 29 6.2 SOCIAL AND OTHER BENEFITS ..................................................................................................... 31 6.3 POVERTY LEVELS OF RMP AND NON-RMP WOMEN ................................................................... 32
CHAPTER 7: COSTS & OUTPUTS ....................................................................................................... 33
7.1 RMP COST BY COMPONENT ....................................................................................................... 33 7.2 RMP OUTPUTS BY COMPONENT ................................................................................................. 33 7.3 COST PER UNIT OF OUTPUT ......................................................................................................... 34
CHAPTER 8: ECONOMIC ANALYSIS .................................................................................................. 35
8.1 A LOOK BACK ............................................................................................................................. 35 8.2 A LOOK FORWARD ...................................................................................................................... 38
CHAPTER 9: KEY FINDINGS & RECOMMENDATIONS ................................................................ 41
9.1 KEY FINDINGS ............................................................................................................................. 41 9.2 RECOMMENDATIONS ................................................................................................................... 42
References ……………………………………………………………………………………………………..…44

TABLES TABLE 1: MEASUREMENT INDICATORS AND VERIFICATION FOR HOUSEHOLDS ........................................................ 8 TABLE 2: DATA COLLECTION INSTRUMENTS ........................................................................................................... 9 TABLE 3: SAMPLE UNION PROFILE - KEY COMMUNITY FEATURES .......................................................................... 12 TABLE 4: SAMPLE UNION PROFILE - CHARACTERISTICS OF ROAD NETWORK .......................................................... 13 TABLE 5: SAMPLE UNION PROFILE - LAND USE ...................................................................................................... 13 TABLE 6: SAMPLE UNION PROFILE – NUMBER OF SHOPS BY LOCATIONS ................................................................ 13 TABLE 7: HOUSEHOLD PROFILE – GENERAL........................................................................................................... 14 TABLE 8: HOUSEHOLD PROFILE – GENERAL - MARITAL STATUS ............................................................................ 14 TABLE 9: HOUSEHOLD PROFILE OF DESTITUTE WOMEN OF SAMPLE UNION ............................................................ 15 TABLE 10: AVERAGE STOCK OF VEHICLES PER UNION BEFORE & AFTER RMP ..................................................... 16 TABLE 11: AVERAGE TRAFFIC FLOW PER UNION IN THE MAIN RMP ROAD (1 DAY) ............................................. 17 TABLE 12: DISTRIBUTION OF HOUSEHOLDS BY MODE OF TRAFFIC ......................................................................... 17 TABLE 13: PURPOSE OF RMP ROAD USE BY HOUSEHOLD MEMBERS ...................................................................... 18 TABLE 14: RMP - MONETIZED AND NON-MONETIZED BENEFITS ........................................................................... 20 TABLE 15: SECTORAL CONTRIBUTION TO INCOME BENEFIT OF THE AVERAGE RURAL HOUSEHOLD, 2005 - 2006 .. 24 TABLE 16: MOST DOMINANT (PRIMARY) FACTORS CONTRIBUTING TO INCREASED AGRICULTURAL INCOME, % .... 24 TABLE 17: TIME SAVINGS TRAVELING TO/FROM EDUCATIONAL INSTITUTIONS ...................................................... 25 TABLE 18: TIME SPENT TRAVELING TO/FROM HOSPITAL WITH AND WITHOUT RMP .............................................. 26 TABLE 19: HOSPITAL VISITS – ANNUAL TIME AND COST SAVINGS ......................................................................... 26 TABLE 20: INCOME DIFFERENTIAL (2005 – 06), RMP-GRADUATED VS. NON-RMP HOUSEHOLDS ......................... 29 TABLE 21: SOME ECONOMIC AND FINANCIAL STATUS BETWEEN RMP GRADUATED AND NON-RMP WOMEN
HOUSEHOLDS ............................................................................................................................................... 30 TABLE 22: SOCIAL AND PSYCHO-SOCIAL STATUS OF RMP GRADUATED AND NON-RMP WOMEN ......................... 32 TABLE 23: COST OF RMP BY COMPONENT (TK MILLIONS).................................................................................... 33 TABLE 24: OUTPUTS OF RMP BY COMPONENT ..................................................................................................... 33 TABLE 25: RMP PROGRAM – OVERALL DELIVERY COST PER UNIT BENEFIT .......................................................... 34 TABLE 26: SUMMARY OF COST OF RMP BY COMPONENT, TAKA MILLIONS ........................................................... 35 TABLE 27: ANNUAL ROAD MAINTENANCE BENEFIT ............................................................................................. 35 TABLE 28: HOUSEHOLD BENEFITS - COMPARISON OF BENEFICIARY GROUPS ......................................................... 36 TABLE 29: CALCULATION OF COST-BENEFIT RATIO ............................................................................................. 37 TABLE 30: RMP - FACTS AND FIGURES ................................................................................................................. 38 TABLE 31: FINANCIAL ANALYSIS - RESULTS .......................................................................................................... 38 TABLE 32: SENSITIVITY INDICATORS ..................................................................................................................... 39 TABLE 33: ECONOMIC ANALYSIS - RESULTS .......................................................................................................... 40 FIGURES FIGURE 1: SOCIAL AND ECONOMIC COST-BENEFIT OF RMP: A CONCEPTUAL FRAMEWORK ..................................... 6 FIGURE 2: SOCIAL & ECONOMIC COST-BENEFIT ANALYSIS OF RMP - STUDY DESIGN ............................................. 7 FIGURE 3: GEOGRAPHIC DISTRIBUTION OF 30 SAMPLE UNIONS .............................................................................. 11 FIGURE 4: PERCENT OF HOUSEHOLDS REPORTING BENEFITS IN 7 CATEGORIES ...................................................... 21 FIGURE 5: HOUSEHOLD BENEFITS - GOODS SECTOR ............................................................................................. 21 FIGURE 6: HOUSEHOLD BENEFITS - LABOUR SECTOR ........................................................................................... 21 FIGURE 7: HOUSEHOLD BENEFITS - TRADE & COMMERCE .................................................................................... 22 FIGURE 8: HOUSEHOLD BENEFITS - TRANSPORT & COMMUNICATION .................................................................. 22 FIGURE 9: HOUSEHOLD BENEFITS - HEALTH & HYGIENE ...................................................................................... 22 FIGURE 10: HOUSEHOLD BENEFITS - EDUCATION ................................................................................................. 23 FIGURE 11: HOUSEHOLD BENEFITS - PSYCHO-SOCIAL ........................................................................................... 23 FIGURE 12: SPIDER WEB OF BENEFITS – TRADE & COMMERCE SECTOR ............................................................... 27 FIGURE 13: WORKING EXAMPLE - NON-MONETIZED BENEFITS AS A PERCENTAGE OF MONETIZED BENEFITS ......... 40

Abbreviations
ANC Antenatal Care BBS Bangladesh Bureau of Statistics BCR Benefit Cost Ratio CBA Cost benefit analysis CIDA Canadian International Development Agency CS Capacity Strengthening CSC Capacity Strengthening Component CUP Chairman of Union Parishad DCI Data collection instruments EC European Commission EIRR Economic Internal Rate of Return EU European Union FIRR Financial Internal Rate of Return GoB Government of Bangladesh HDRC Human Development Research Centre HH Household IDC Income Diversification Component IFI International Financial Institution IGA Income Generating Activities IGVGD Income Generation for Vulnerable Group Development IRR Internal Rate of Return KII Key Informant Interview LG Local Government LGD Local Government Department MOLGRDC Ministry of Local Government, Rural Development and Cooperatives MUP Member of Union Parishad NGO Non-government Organization NPV Net Present Value PESP Primary Education Stipend Programme PMC Project Management Committee PNC Postnatal Care RMA Road Maintenance Association RMC Rural Maintenance Component RMP Rural Maintenance Programme ROI Return on investment SCF Standard Conversion Factor SECBA Social & Economic Cost Benefit Analysis SUP Secretary of Union Parishad UNO Upazila Nirbahi (Executive) Officer UP Union Parishad (Council) VGD Vulnerable Group Development VGD Vulnerable Group Development

Executive Summary
Introduction: The Rural Maintenance Programme (RMP) is a large poverty alleviation programme that covers 93% of the rural areas of Bangladesh. Begun in 1983 as a cash-for-work program in 7 unions, RMP has grown into a multi-dimensional program of wages, mandatory savings and training for destitute women and local government officials in 4,150 unions in 61 districts. Objectives & scope: While there is a substantial body of independent research that demonstrates the success of the RMP, none of the previous studies compared the costs of RMP with the benefits. The objective of the study is to determine whether or not the investment in RMP over the three most recent fiscal years has been a sound one, resulting in a positive return on investment (ROI). Methodology: The study has used cost benefit analysis (CBA) techniques to compare accrued benefits with its costs. Recognizing that CBA declines in importance as non-monetized social benefits increase, CBA is supplemented by a qualitative treatment of non-monetized benefits. The study has made use of primary and secondary data sources. Primary benefit data was collected in a statistically valid household survey, a destitute women survey, traffic flow survey, and key informant interviews. The study has used seven different types of data collection instruments (DCI). Field survey preparation included no fewer than five pre-tests. The study team included both national and international members who developed the study methodology in joint consultation with CARE. Sample union profile: The study was conducted in 30 randomly selected unions. The average union area is 30 km2 and ranges from 4 - 43 km2. The average population is 28,505 and varies between 14,752 and 47,571 per union. The average household size is about 5. The average union has 55 km of roads, 75% are earthen. Of the 55% of earthen roads that are maintained, RMP accounts for 83% for an average of 19 km of maintained earthen roads per union. Benefit stream of RMP – Traffic Survey: Before RMP started maintaining roads, a union would average 319 vehicles, with only 16% motorized. Today, vehicle stock has more than doubled to 681 vehicles and motorized vehicle stock has doubled in percentage terms to 30%. The growth in vehicle stock cannot be ascribed to the influence of RMP roads alone. However, with RMP accounting for the maintenance of nearly half the rural earthen roads in a union, it is clear that RMP has contributed to vehicle growth and the increase in economic and social activity it signifies. Benefit Stream – Household survey: Sample households reported 43 economic benefits of RMP roads. In addition to these economic benefits are eight benefits reported in the course of the destitute women’s survey and six benefits reported in the key informant interviews. Of the total list of 57 benefits, 29 are monetized benefits and 28 are non-monetized. Economic Benefits: The study area represented by the sample households has experienced 6.3% income growth or Tk. 2,874/household that is attributable to RMP. Most of the income benefit (65%) relates back to agricultural activity. Improved roads have been instrumental in accessing production materials, inputs, agricultural extension personnel and access to markets at lower cost and in less time. Education benefits: Education is another key area where benefits have been generated by road maintenance and other RMP activities. Benefits include: increased enrollment, improved attendance, time savings and expenditure savings. The average time saved is 8 minutes/school day or 31 hours/household/year. Expenditure savings are Tk 1.1/school day or Tk 251/household/year. Health benefits: Respondents reported time and expenditure savings related to health care as well. Average annual time savings from the maintenance of RMP roads is 21 minutes/year. The average annual cost savings are Tk 46/household.
Training benefits: Considerable training benefits are realized in the Income Diversification (IDC) and Capacity Strengthening (CSC) components of RMP. In IDC, women receive training in road maintenance, human rights, gender equality, health and nutrition, numeracy and business management. 165,750 women have been trained through IDC in over 1 million trainee days. CSC provides training in local governance and conflict resolution to local Project Management Committees (PMCs). To date, 95,097 local government persons have been trained through CSC. Benefit stream – destitute women: Three categories of benefits are enjoyed by destitute women: economic, social and poverty alleviation. Economically, RMP graduate households have enjoyed an annual income of Tk. 16,575 or 63% more than the Tk. 10,159 earned by non-RMP women households. RMP graduates have enjoyed 20% greater asset accumulation as well. Socially, a variety of non-monetized social benefits accrue to RMP households, including: empowerment of women, increased mobility, greater participation in decision-making, increased awareness, greater health-seeking behaviour and greater dissemination of knowledge. Fewer RMP households (58%) were found to be below the absolute poverty line than non-RMP households (68%). Costs & outputs: The average annual cost of RMP is about Tk. 1 billion of which 85% is spent on RMC. RMP has maintained 64,000 km of earthen roads annually. Training is an important part of both IDC and CSC with 166,000 IDC trainees and 95,000 CSC trainees since inception. Important unit costs include: the annual cost of employing a woman on a road maintenance crew (Tk 25,321); the cost of maintaining 1 km of road is Tk 12,660; the cost of delivering 1 Tk of wage to a destitute woman in the RMC is TK 0.09; the cost per trainee day is Tk. 441 for IDC and Tk. 345 for CSC. Economic analysis – a look back: The economic analysis takes a retrospective look back at the last three fiscal years of the RMP using cost data and monetized benefits estimated from data collected in the various surveys. The return on investment (ROI) or Benefit Cost Ratio (BCR) of RMC for the 3-year period under review is 1.27; that is for every Taka of cost, there is 1.27 Taka of benefit. The result is sufficiently robust that the costs of the income diversification and capacity strengthening components can be included and benefit still exceeds cost at BCR = 1.08. It is important to note that the calculation is made using only monetized benefits.
Economic analysis – a look forward: Assuming a 10-year continuation of RMP in its current format, there will be 100,000 additional beneficiaries and 60,000 new graduates. Net present value (NPV) = Tk 536 million when discounted at 12%. BCR = 1.09. Finally, FIRR = 29%. Understandably, the results are hyper-sensitive to any increase in the annual cost of the RMC or changes in the value of household benefits. Economic analysis is conducted using a standard conversion factor (SCF) of 0.90 to account for price distortions. Compared to the financial analysis, economic NPV more than doubles to Tk 1,217 million, economic BCR increases to 1.24 while EIRR almost doubles to 62%. The number and variety of benefits of road maintenance that has accrued to rural families is one of the more striking findings of the household survey. A “working example” showed the impact on FIRR if non-monetized benefits as a group are assigned a value equal to some percentage of monetized benefits. At 25% of the value of monetized benefits, FIRR jumps from 28% to 97%. At 50%, FIRR jumps to 264% while at 75%, FIRR jumps to 949%. The “working example” is instructive in showing the strong positive impact of non-monetized benefits on results. Recommendations: Three categories of recommendations are made: First, as a key poverty reduction program in Bangladesh and considering its high economic return, RMP should be continued with all its program components (RMC, IDC & CSC). Second, given the importance of non-monetized benefits to RMP impact, in-depth studies should aim at monetizing these benefits. Third, the future design of RMP should reflect more pro-active participation of poor and women in planning and implementation of all components. RMP needs to be designed so as to ensure that most RMP graduate women undertake income generation activities (IGA) and continue them sustainably.
CHAPTER 1 INTRODUCTION
1.1. Background
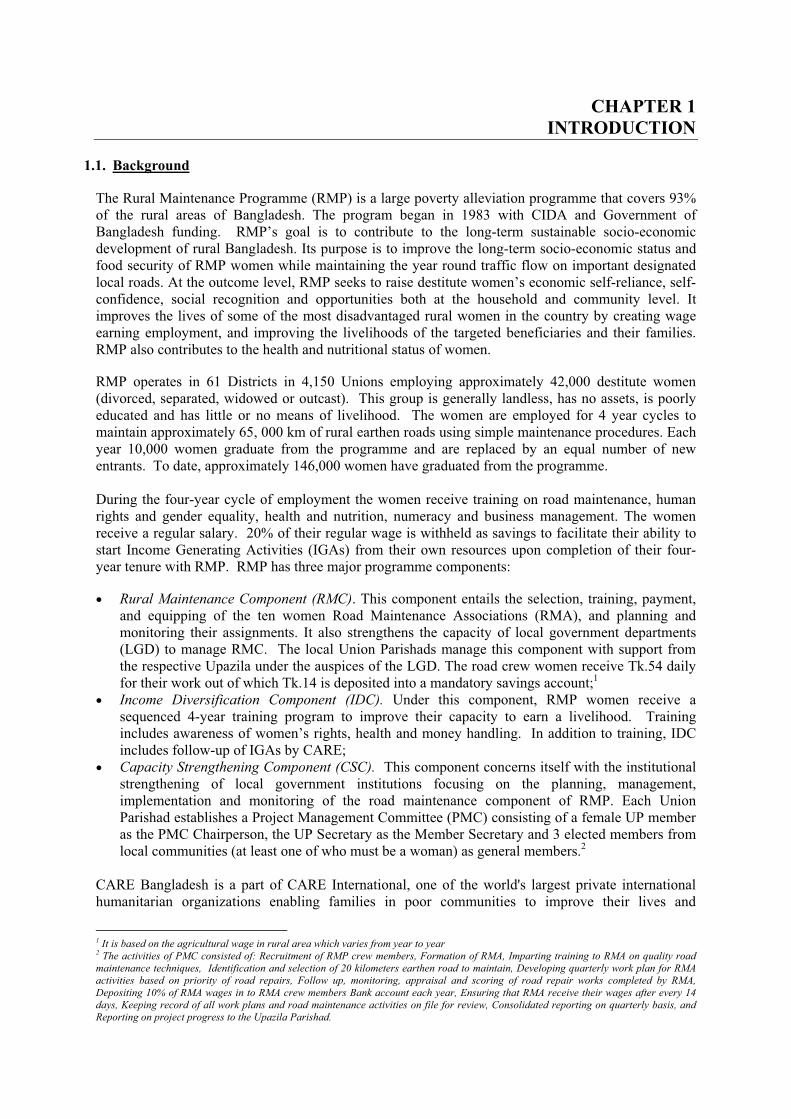
The Rural Maintenance Programme (RMP) is a large poverty alleviation programme that covers 93% of the rural areas of Bangladesh. The program began in 1983 with CIDA and Government of Bangladesh funding. RMP’s goal is to contribute to the long-term sustainable socio-economic development of rural Bangladesh. Its purpose is to improve the long-term socio-economic status and food security of RMP women while maintaining the year round traffic flow on important designated local roads. At the outcome level, RMP seeks to raise destitute women’s economic self-reliance, self-confidence, social recognition and opportunities both at the household and community level. It improves the lives of some of the most disadvantaged rural women in the country by creating wage earning employment, and improving the livelihoods of the targeted beneficiaries and their families. RMP also contributes to the health and nutritional status of women. RMP operates in 61 Districts in 4,150 Unions employing approximately 42,000 destitute women (divorced, separated, widowed or outcast). This group is generally landless, has no assets, is poorly educated and has little or no means of livelihood. The women are employed for 4 year cycles to maintain approximately 65, 000 km of rural earthen roads using simple maintenance procedures. Each year 10,000 women graduate from the programme and are replaced by an equal number of new entrants. To date, approximately 146,000 women have graduated from the programme. During the four-year cycle of employment the women receive training on road maintenance, human rights and gender equality, health and nutrition, numeracy and business management. The women receive a regular salary. 20% of their regular wage is withheld as savings to facilitate their ability to start Income Generating Activities (IGAs) from their own resources upon completion of their four-year tenure with RMP. RMP has three major programme components: � Rural Maintenance Component (RMC). This component entails the selection, training, payment,
and equipping of the ten women Road Maintenance Associations (RMA), and planning and monitoring their assignments. It also strengthens the capacity of local government departments (LGD) to manage RMC. The local Union Parishads manage this component with support from the respective Upazila under the auspices of the LGD. The road crew women receive Tk.54 daily for their work out of which Tk.14 is deposited into a mandatory savings account;1
� Income Diversification Component (IDC). Under this component, RMP women receive a sequenced 4-year training program to improve their capacity to earn a livelihood. Training includes awareness of women’s rights, health and money handling. In addition to training, IDC includes follow-up of IGAs by CARE;
� Capacity Strengthening Component (CSC). This component concerns itself with the institutional strengthening of local government institutions focusing on the planning, management, implementation and monitoring of the road maintenance component of RMP. Each Union Parishad establishes a Project Management Committee (PMC) consisting of a female UP member as the PMC Chairperson, the UP Secretary as the Member Secretary and 3 elected members from local communities (at least one of who must be a woman) as general members.2
CARE Bangladesh is a part of CARE International, one of the world's largest private international humanitarian organizations enabling families in poor communities to improve their lives and
1 It is based on the agricultural wage in rural area which varies from year to year 2 The activities of PMC consisted of: Recruitment of RMP crew members, Formation of RMA, Imparting training to RMA on quality road maintenance techniques, Identification and selection of 20 kilometers earthen road to maintain, Developing quarterly work plan for RMA activities based on priority of road repairs, Follow up, monitoring, appraisal and scoring of road repair works completed by RMA, Depositing 10% of RMA wages in to RMA crew members Bank account each year, Ensuring that RMA receive their wages after every 14 days, Keeping record of all work plans and road maintenance activities on file for review, Consolidated reporting on quarterly basis, and Reporting on project progress to the Upazila Parishad.

Social & Economic Cost-Benefit Analysis of RMP: HDRC & Agrodev Canada Inc.
2
overcome poverty. CARE began work in Bangladesh in 1949 with CARE packages that the Americans sent to survivors of World War II in Europe and Asia. The plain brown boxes holding food and other essential items were harbingers of hope. Today, CARE partners with communities, community based organizations, the Government and national NGOs to identify and confront root causes of the poverty. CARE's programmes focus on agriculture, education, health, water and sanitation, nutrition, infrastructure and small enterprise development, reaching around 20 million households in 64 districts of Bangladesh. In the fiscal year July 2004 to June 2005, the total value of the CARE programme was over US$ 28 million.
1.2. Evolution of RMP
RMP was undertaken against a backdrop of high poverty levels in Bangladesh, especially widespread and endemic poverty in female–headed households. These households were characterized by livelihood vulnerability, food insecurity, extremely low income and consumption, a low resource base, gender inequality and discrimination and social exclusion. RMP was implemented in three phases – all funded by the GoB and CIDA through the proceeds of food aid donated by Canada. In 1983, Phase I was initiated as a food-for-work road maintenance project within a food security framework in 7 unions in 7 districts. In 1992, RMP was redesigned as a food security cum sustainable development project by adding an income diversification component (IDC). The redesigned RMP continued as a phase II until 1994. Thereafter, RMP was further expanded through the addition of a capacity strengthening component (CSC) targeting local government institutions. Phase III with three components has been thus implemented in three stages. CIDA and GoB continued as sole funders of RMP through stages 1 & 2 (1995 – 2001) of Phase III. Starting in 2001, the European Community contributed to funding as well until mid-2006. GoB took over sole responsibility for the programme’s total funding and operation as of mid-2006. RMP is being implemented in 4,150 unions. The defined outputs are:
� The extent of earthen roads maintained; � The number of RMP women crew members recruited; � The number of RMP women crew trained; � The number of RMP women trainee days; � The number of LGD persons trained; and � The number of LG trainee days.
1.3. Previous Studies on RMP
RMP crew women make significant socio-economic gains over their situation at entry simply by virtue of having steady employment. The wages were, and remain, a substantial factor in the increased well being of RMP crewmembers. One of the earliest reviews3 of RMP, conducted before IDC and graduation were part of it, noted the considerable impact of wages on housing, food consumption,
3 Ian Smillie, Brenda Cupper, Akram Hossain, Peter Nichols, Ann Schwartz, The Long and Winding Road: An Evaluation of the Bangladesh Rural Maintenance Programme, Final Version, August 1992.
EVOLUTION OF RMP: 1983 – 2006
PHASE -I (1983-1988) � Food-for-work road maintenance (RMC) � Funding: GoB, CIDA
PHASE -II (1989 - 1994) � RMC + Income Diversification Component (IDC) � Funding: GoB, CIDA
PHASE-III, Stages 1 & 2: (1995 - 2000) � RMC + IDC + Capacity Strengthening (CSC) � Funding: GoB, CIDA
PHASE –III, Stage 3: (2001 - 2005) � RMC + IDC + CSC � Funding : GoB, CIDA, EC
Future: (2006 � ): Handed over to GoB
Social & Economic Cost-Benefit Analysis of RMP: HDRC & Agrodev Canada Inc.
3
access to health and education, informal credit and asset accumulation. These indicators were used later in measuring the success of IDC as destitute women gained confidence and economic security. Wage employment remains a vital dimension of RMP. In spite of the demands of daily physical work, the women value this more than any other aspect of the RMP experience. It is the real indicator of their shift from dependence and destitution. Wage employment is the platform on which they build a better life. The critical issue is whether the gains from wage employment are sustainable. This was the rationale for introducing the IDC, which has been the subject of several external studies. The earliest of these, in 1994-95, looked at IDC pilot projects.4 85 participants were studied two years after leaving RMP, having been crewmembers for about ten years. The survey found that 69%, had not fallen back into destitution. About half were earning a stable income from IGAs. More far-ranging studies were conducted at the beginning of Stage 2, by which time IDC was integrated across the whole programme area. Studies5 of social-economic impacts and impact of the road maintenance were conducted in 1998. The former sampled women currently in an RMC road crew, graduates from the IDC training, and VGD programme women as a control, and conducted village-level profiles in seven unions. The incomes of the IDC graduates were slightly lower than the wages of the RMC women (Tk 302 vs. Tk. 315/week); however, both were much higher than the VGD control group (Tk221/week). The percentage of women eating food three times daily was also higher for the RMC sample (87%) than for the IDC sample (77%). About half the women in the groups said their income was insufficient to meet basic needs. 78% of the IDC women reported improvements in their social and economic condition, including mobility, quality of housing, and access to credit. The rates on these indicators for the IDC women were marginally higher than for the women still in RMC while RMP women were higher on all indicators than the control group. Results may have been lowered by the fact that, in 1998, severe floods adversely affected more than half of the women in both groups. Overall, about three quarters of IDC graduates were doing well and had escaped destitution. In 2000, a survey6 of the social and economic position of 854 graduates of RMP found considerable asset accumulation (80% with homestead or agricultural land), positive comments on the IDC training, and high scores on access to education, credit, and health.7 Average incomes from labour and IGA were 15% higher than the wage income from RMP. The study's overall "success index” for all the indicators rated 63% of the graduates as moderately successful and 16% as highly successful; however, 21% remained in or had fallen back into destitution.8 The external surveys confirmed that RMP was achieving its purpose. Three years after graduation, over 60% of RMP graduates had not slipped back into destitution. They were earning enough to satisfy their basic needs. The field survey conducted for a CIDA-sponsored review of RMP in April 2003 confirmed that among current crew members, school attendance of their children had increased as had their affiliation with NGOs. Family income increased, mostly from wages but also from IGAs, during their term on the road crew. There were improvements in nutrition, health and sanitation, and household assets. The evaluation found that women who left RMP the previous year could cite several gains from their RMP experience. Social and behavioral gains were emphasized as much as economic impacts. Only 7% of women said they had fallen back into destitution. Although their current incomes tended to be less than what they earned from both wages and IGAs when they were in RMP, they were not in debt, and had attained food security. The roadwork has been at the core of RMP since its beginnings. Previous studies showed that Bangladesh's rural economy benefits when village-level feeder roads are kept open to local traffic. The review's technical consultants confirmed that RMP's roadwork contributed to local economic 4 Raka Rashid, RMP Income Diversification Pilot Project Evaluation 1994, CARE-Bangladesh, July 1994 and RMP Income
Diversification Pilot Project Evaluation 1995, CARE-Bangladesh, August 1995. 5 Study of the Socio-Economic Impact (Household Survey), House of Consultants Ltd. Dhaka, June 1999 (Draft Final) and
Impact Assessment Study Report on RMP: The Village Profiles, Nacob Consultancy Services, Dhaka, January 1999 (final). 6 IRT, Income and Livelihood Security Assessment of RMP Ex-Crew Women: IDC 2001 Survey, CARE-BD, May 2000 & July 2001. 7 Graduates had been out of RMP for 2 - 7 years. Survey data were supplemented by eight focus group discussions. 8 Considerable regional variation was observed, perhaps due to the 1998 floods.

Social & Economic Cost-Benefit Analysis of RMP: HDRC & Agrodev Canada Inc.
4
development. The main criterion for road quality was whether roads are passable by light traffic, accounting for seasonal conditions. An external study in 2000 found that 97% of the unions had a good or moderate rating on this criterion in the dry season. The field survey for the April 2003 review was conducted in the dry season. It looked at RMC operations in 36 unions. For a majority of the unions, RMC crews were keeping roads passable 90% of the time in the dry season. Union authorities said the maintenance had positive effects on local commerce and several suggested they could use larger crews and greater coverage. Recent studies (2006) confirm the significant impact of all the components of RMP. For example:
� The aggregate human development score for all RMP women and the extreme poor category revealed that both the extreme poor and all RMP graduates have continued their development. Not only is RMP pro-poor, but also pro-extreme poor endeavor.9
� The composite well-being score of RMP women is 20% higher than that of their counterpart non-RMP destitute women. Various indicators contributed most to enhanced well-being status including housing, food security, health, savings, water and sanitation as well as life satisfaction, income, expenditure, and safety/security.10
� Capacity strengthening made notable positive impacts on the planning and implementation of RMP in Bangladesh. This training enormously enhanced the managerial abilities of PMC members11.
1.4. Objectives and Scope
While there is a substantial body of independent research that demonstrates the success of the RMP, none of the previous studies compared the costs of RMP with the benefits. The purpose of this social and economic cost benefit analysis (SECBA) is to determine whether or not the investment in RMP over the three most recent fiscal years (FY ’04 – FY ’06) has been a sound one, resulting in a positive return on investment (ROI). The study seeks to identify the costs and benefits associated with RMP and, to the extent possible, estimate them in monetary terms. Recognizing that some benefits cannot be monetized, the study will identify non-monetized benefits as well and discuss their importance to RMP in qualitative terms. The cost analysis of the study includes but is not limited to:
� Cost per kilometer of RMP road maintenance; � Cost per person of RMP crew recruited; � Cost per person of various training activities; � Cost per trainee day; � Cost per woman in terms of road maintenance wages; � Differences in costs between similar activities from other programmes;
The benefit analysis includes but is not limited to:
� Return on investment (ROI) / Benefit cost ratio (BCR) of the overall program; � Activity-based BCR for RMC and IDC components;12 � Financial internal rate of return (FIRR) of the overall programme; � Economic internal rate of return (EIRR) of the overall programme; � Sensitivity analysis of the results.
9 Barkat A, N Sabina, A Poddar, S Hoque, G Mahiyuddin, M Rahman and M Majid, An Assessment of Livelihood Security of RMP
Graduated Women, Human Development Research Centre, August 2005, Care Bangladesh, May 2006. 10 Barkat A, S Halim, G Mahiyuddin, A Poddar, HM Mohiuddin and S Hoque, A Study on Well-being Status of Graduated RMP Women,
Human Development Research Centre, Care – Bangladesh, June 2006. 11 Barkat A, S Mukkavilli, B Rahman, R Ara, KA Mohib, S Hoque and M Rahman, Impact Assessment of the Capactiy Strengthening
Activities of the Rural Maintenance Component of the RMP, Human Development Research Centre, and DevTech Solutions Inc., Care-Bangladesh, 2006.
12 It was not possible to monetize CSC benefits so a BCR / ROI could not be estimated for this particular component.
Social & Economic Cost-Benefit Analysis of RMP: HDRC & Agrodev Canada Inc.
5
In addition to the quantitative analysis, the study looks at a wide range of social and economic aspects of the rural population. These include:
� The impact on skills development, employment and empowerment among RMP beneficiaries; � The impact of RMP maintained roads on traffic, commerce, schooling, etc; � The increase in market activity due to RMP road maintenance; � The impact of increased accessibility to local growth centers and socially significant places; � The implications of road maintenance on cost savings for road users; � The increase in employment and mobility from road maintenance; � The benefit of increased mobility for women; � Local market growth attributed to RMP road maintenance; and � Documentation of major issues/causes underlying programme effectiveness and efficiency;
1.5. Organization of the Report
Chapter 2 discusses various issues relating to the methodology of the study. Chapter 3 profiles the study area and the surveyed households. Chapter 4 reviews traffic flows in the study area. Chapter 5 provides analysis of various types of socio-economic benefits that accrued to the households as well as incremental income that accrue to households from various socio-economic activities. Chapter 5 also details the educational, health, market and organizational training and other benefits. Benefits to destitute women are detailed in Chapter 6. Chapter 7 addresses issues related to the costs and output of RMP. Chapter 8 contains the results of the economic analysis. Key findings and recommendations are presented in Chapter 9. The main report is supported by a set of appendices.

Social & Economic Cost-Benefit Analysis of RMP: HDRC & Agrodev Canada Inc.
6
CHAPTER 2 METHODOLOGY
2.1 Concepts and Definitions
The study compares the accrued benefits of RMP with the incurred costs both by project component (e.g., RMC, IDC and CSC) and of the project as a whole. CBA identifies and then monetizes all quantifiable costs and benefits. The time value of money is taken into account by applying discount rates that reflect the opportunity cost of capital. While a powerful analytical tool, CBA declines in importance as unquantified costs and benefits increase. Accordingly, CBA is supplemented by a qualitative treatment of the non-monetized benefits that clearly play an important role in RMP. The overall approach is shown in Figure 1.
Figure 1: Social and economic cost-benefit of RMP: a conceptual framework
2.2 Cost and Benefit Components
CARE Bangladesh provided the primary cost data that was supplemented by field survey data. The most important cost components are:
� The wages paid to and obligatory savings made on behalf of RMP women; � Program delivery costs, estimated by component (e.g., RMC, IDC, CSC); � Program general administrative costs;13 � Cost of materials for implementation of RMP at site.
Benefits, by definition, are more difficult to quantify than costs. In the context of RMP, the benefits that are relatively easy to quantify and evaluate are:
� Household income (with and without RMP; without RMP means in absence of RMP); � Household income of RMP graduates; � Household income of non-RMP women; � Expenditure savings in education and health through reduced time of transport on RMP roads.
13 Apportioned to the three components by CARE on a pre-determined basis
Cost Benefit
RMP Components:
� RMC � IDC � CSC
Economic and Social
Monetized
With RMP
Without RMP
Non-monetized
With RMP
Without RMP
Cost-benefit
Net benefit due to RMP
Net benefit due to RMP
Social & Economic Cost-Benefit Analysis of RMP: HDRC & Agrodev Canada Inc.
7
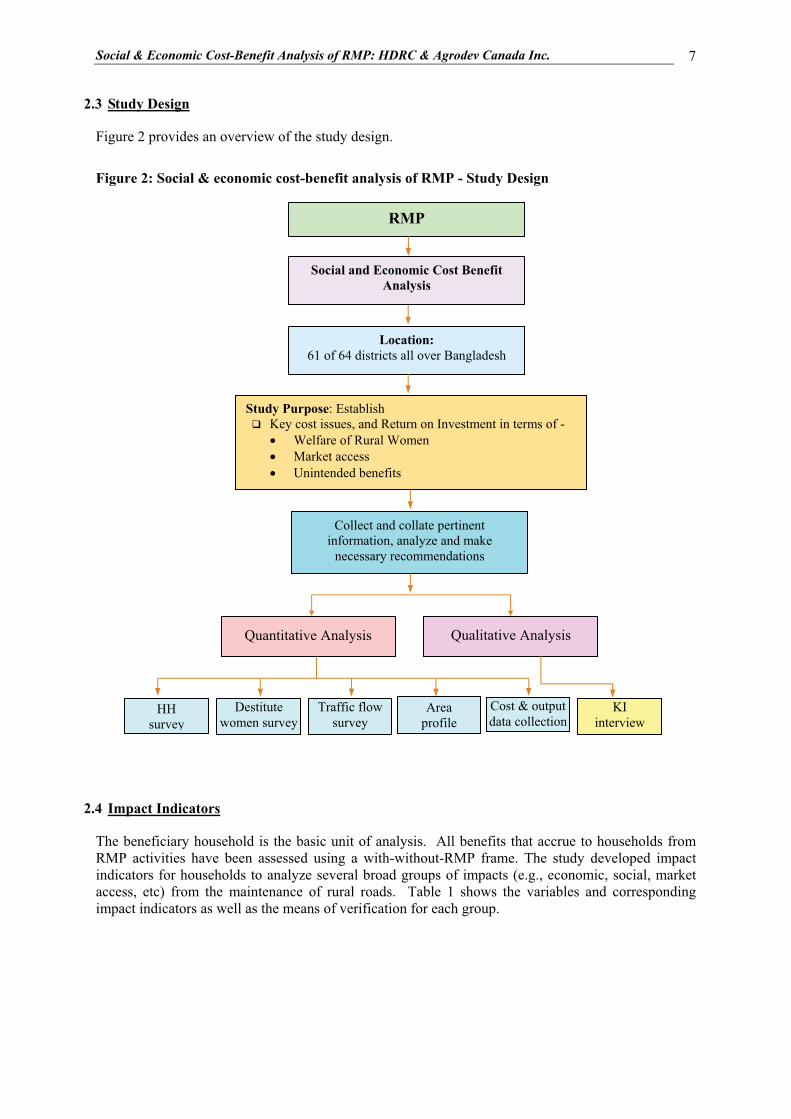
2.3 Study Design
Figure 2 provides an overview of the study design.
Figure 2: Social & economic cost-benefit analysis of RMP - Study Design
2.4 Impact Indicators
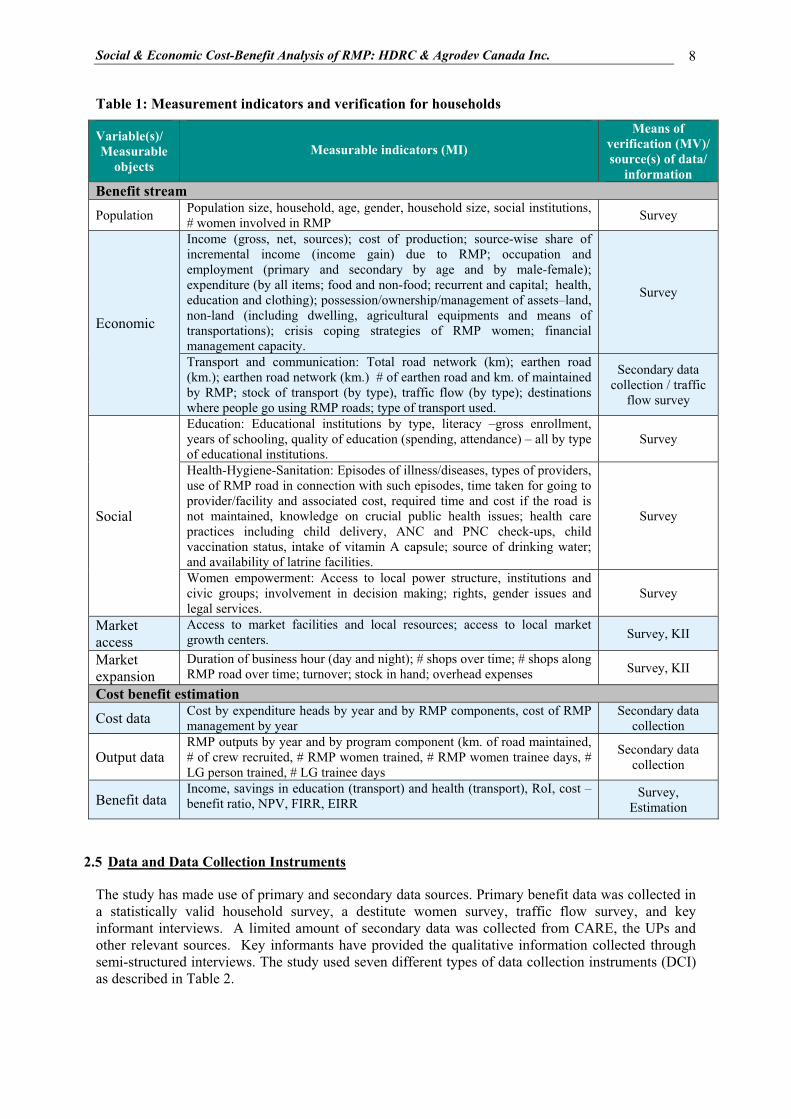
The beneficiary household is the basic unit of analysis. All benefits that accrue to households from RMP activities have been assessed using a with-without-RMP frame. The study developed impact indicators for households to analyze several broad groups of impacts (e.g., economic, social, market access, etc) from the maintenance of rural roads. Table 1 shows the variables and corresponding impact indicators as well as the means of verification for each group.
RMP
Social and Economic Cost Benefit Analysis
Location: 61 of 64 districts all over Bangladesh
Study Purpose: Establish � Key cost issues, and Return on Investment in terms of -
� Welfare of Rural Women � Market access � Unintended benefits
Collect and collate pertinent information, analyze and make
necessary recommendations
Quantitative Analysis
Qualitative Analysis
HH survey
Destitute women survey
Traffic flow survey
Cost & output data collection
Area profile
KI interview
Social & Economic Cost-Benefit Analysis of RMP: HDRC & Agrodev Canada Inc.
8
Table 1: Measurement indicators and verification for households
Variable(s)/ Measurable
objects
Measurable indicators (MI) Means of
verification (MV)/ source(s) of data/
information Benefit stream Population Population size, household, age, gender, household size, social institutions,
# women involved in RMP Survey
Economic
Income (gross, net, sources); cost of production; source-wise share of incremental income (income gain) due to RMP; occupation and employment (primary and secondary by age and by male-female); expenditure (by all items; food and non-food; recurrent and capital; health, education and clothing); possession/ownership/management of assets–land, non-land (including dwelling, agricultural equipments and means of transportations); crisis coping strategies of RMP women; financial management capacity.
Survey
Transport and communication: Total road network (km); earthen road (km.); earthen road network (km.) # of earthen road and km. of maintained by RMP; stock of transport (by type), traffic flow (by type); destinations where people go using RMP roads; type of transport used.
Secondary data collection / traffic
flow survey
Social
Education: Educational institutions by type, literacy –gross enrollment, years of schooling, quality of education (spending, attendance) – all by type of educational institutions.
Survey
Health-Hygiene-Sanitation: Episodes of illness/diseases, types of providers, use of RMP road in connection with such episodes, time taken for going to provider/facility and associated cost, required time and cost if the road is not maintained, knowledge on crucial public health issues; health care practices including child delivery, ANC and PNC check-ups, child vaccination status, intake of vitamin A capsule; source of drinking water; and availability of latrine facilities.
Survey
Women empowerment: Access to local power structure, institutions and civic groups; involvement in decision making; rights, gender issues and legal services.
Survey
Market access
Access to market facilities and local resources; access to local market growth centers. Survey, KII
Market expansion
Duration of business hour (day and night); # shops over time; # shops along RMP road over time; turnover; stock in hand; overhead expenses Survey, KII
Cost benefit estimation
Cost data Cost by expenditure heads by year and by RMP components, cost of RMP management by year
Secondary data collection
Output data RMP outputs by year and by program component (km. of road maintained, # of crew recruited, # RMP women trained, # RMP women trainee days, # LG person trained, # LG trainee days
Secondary data collection
Benefit data Income, savings in education (transport) and health (transport), RoI, cost –benefit ratio, NPV, FIRR, EIRR
Survey, Estimation
2.5 Data and Data Collection Instruments
The study has made use of primary and secondary data sources. Primary benefit data was collected in a statistically valid household survey, a destitute women survey, traffic flow survey, and key informant interviews. A limited amount of secondary data was collected from CARE, the UPs and other relevant sources. Key informants have provided the qualitative information collected through semi-structured interviews. The study used seven different types of data collection instruments (DCI) as described in Table 2.

Social & Economic Cost-Benefit Analysis of RMP: HDRC & Agrodev Canada Inc.
9
Table 2: Data Collection Instruments DCI type
Respondent
Purpose
Areas addressed
Information type
Nature wise Source wise
Household survey questionnaire: DCI-1
Household male/female head
Household survey
Household identification, background information, RMP road use status, income by source, crop production, assets, benefits of RMP to education, benefits of RMP to health, benefit stream of RMP.
Quantitative
Primary data
Destitute women survey questionnaire: DCI-2
RMP women/destitute women
Destitute women survey
Household identification, background information, source-wise income, crop culture, IGA, assets, expenditure, financial management, women empowerment, health, education.
Quantitative Primary data
Traffic flow survey format: DCI-3
Observation Traffic flow survey
Traffic flow by type, information on seasonal variations (wet and dry seasons)
Quantitative Primary data
Key informant interview guideline: DCI-4A
Entrepreneur/other knowledgeable persons
Key informant interview
Market development, market access, marketing channels, organizational facility, diversification and quality aspects, observation on RMP
Qualitative Primary data
Key informant interview guideline: DCI-4B
CARE staff/UP chairman/PMC member
Key informant interview
Evaluation of CS trainings, comment on RMP Qualitative Primary
data
Secondary data collection/compila-tion format: Union Profile: DCI-5
UP chairman/secretary/member/ local key informant
Secondary data collection
Landscape, main crop and non-crop agriculture, union characteristics (administrative, demographic, infrastructure, etc.) RMP road related information at two points
Quantitative Second-ary data
Secondary data collection/compilation format: Cost data: DCI-6
RMP/CARE Secondary data collection
RMP cost by year by components and cost-items Quantitative Second-
ary data
Secondary data collection/compilation format: Output data: DCI-7
RMP/CARE Secondary data collection
RMP output by year and by component Quantitative Second-
ary data
The methodology of field survey preparation and implementation included the following steps:
� Consensus-building with CARE – Bangladesh � Initial development of 7 DCIs � First pre-test of draft DCIs � Revision and subsequent pre-tests on an iterative basis. Five pre-tests in all were conducted. � Identification of sample unions and sample households within sample unions � Enumeration staff recruitment, training, deployment
Additional details of the data collection exercise may be found in Appendix A.2. The DCIs are included in Appendix A.3.

Social & Economic Cost-Benefit Analysis of RMP: HDRC & Agrodev Canada Inc.
10
2.6 Overview of Study Implementation
The main activities carried out during the study were:
� Planning and consensus building meetings between the relevant RMP staff and consultants; � Review of relevant documents; � Finalization of methodological issues and detailed work plan; � Development of data collection instrument(s), pre-testing and finalization; � Recruitment of field data collection staff and training; � Data/information collection; � Data/information management; � Preparation of tabulation plan; � Data analysis with interpretation; � Preparation of draft report/ sharing key findings with RMP/CARE, and � Report finalization.
The study team included both national and international members. The national and international consultant groups jointly developed the study methodology in consultation with RMP CARE.
Social & Economic Cost-Benefit Analysis of RMP: HDRC & Agrodev Canada Inc.
11
CHAPTER 3 STUDY AREA AND HOUSEHOLD PROFILE
3.1 Sample Unions Profile
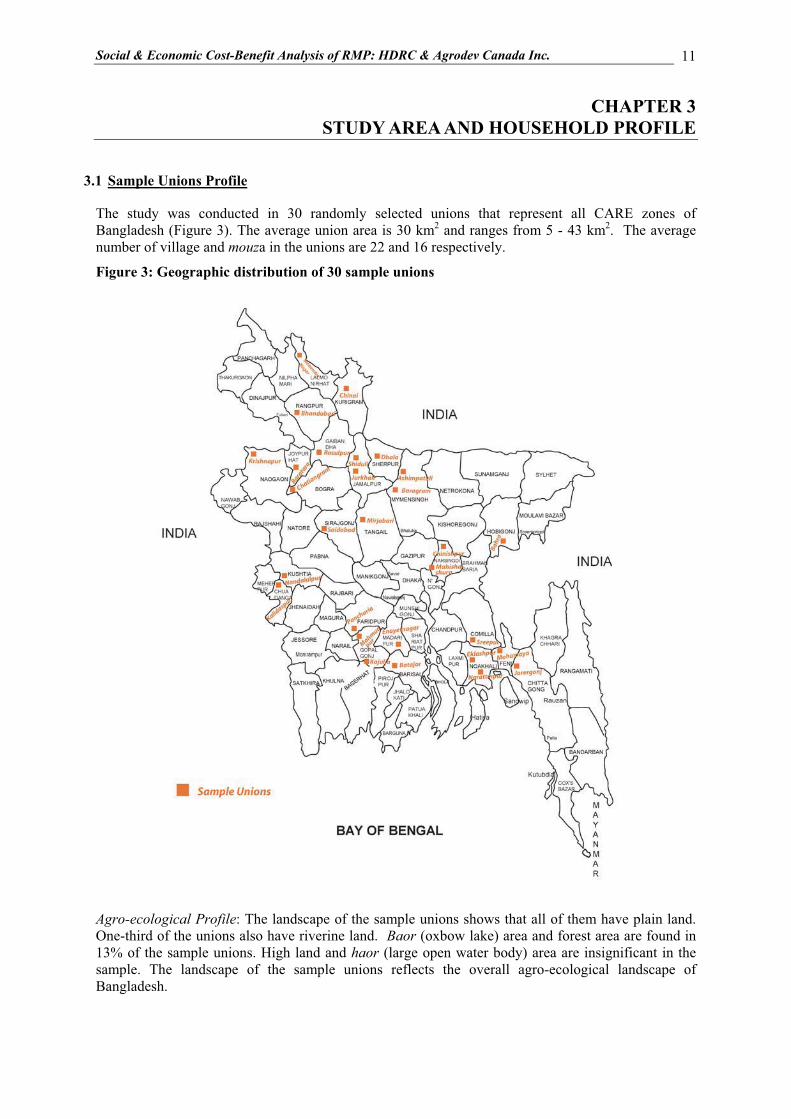
The study was conducted in 30 randomly selected unions that represent all CARE zones of Bangladesh (Figure 3). The average union area is 30 km2 and ranges from 5 - 43 km2. The average number of village and mouza in the unions are 22 and 16 respectively.
Figure 3: Geographic distribution of 30 sample unions
Agro-ecological Profile: The landscape of the sample unions shows that all of them have plain land. One-third of the unions also have riverine land. Baor (oxbow lake) area and forest area are found in 13% of the sample unions. High land and haor (large open water body) area are insignificant in the sample. The landscape of the sample unions reflects the overall agro-ecological landscape of Bangladesh.

Social & Economic Cost-Benefit Analysis of RMP: HDRC & Agrodev Canada Inc.
12
Population: The average population is 28,505 and varies between 14,752 and 47,571. 52% of the population is male, and the average household size is about 5. The key demographic and other community features of the sample unions are summarized in Table 3.
Table 3: Sample union profile - key community features
Indicators Average (of 30 union)
Range (#)
Demographic Population 28,505 14,752 - 47,571 No. of male 14,677 8,846 - 24,679 No. of female 13,828 7,332- 23,189 No. of household 5,015 2,421 – 7,389
Educational Institutions No. of govt. primary schools 8 04 - 12 No. of non-govt. primary schools 6 01 - 21 No. of high schools 3 01 - 09 No. of colleges 1 0 – 02 No. of madrasas (religion-based education system) 6 0 – 25 No. of makhtabs (elementary level religious education)
16 0 – 60
No. of total educational institutions 39 17 - 83
Health facilities and Providers No. of govt. health facilities 2 0 – 07 No. of NGO facilities 1 0 – 04 No. of non-govt. qualified health service providers (doctor + pharmacy)
37 0 – 25
Community Places No. of mosques 42 17 - 116 No. of community centres 1 0 – 06 No. of cinema halls 0.13 0 – 02
Physical Infrastructure: The average number of educational institutions per sample union is 39. A significant finding of the survey was that the number of religious educational institutions (madrasah and makhtabs) far outweighs the other formal educational institutions. The average number of government health facility in the sample unions (1.6) is higher than that of NGO health facilities (0.6). An average of only 2.2 health facilities per union is an indicator of overall health-vulnerability in rural Bangladesh. The average number of mosques (42) is far higher than the number of community centres (< 1) and cultural centres (< 1). The average number of hut / bazaar per union is 4. Road Network: The average union has 55 km of roads ranging between 13 and 111 km. 25% of the roads are paved. The remaining 75% are earthen roads. 45% of earthen roads are not maintained. Of the 55% that are maintained, RMP maintains 83% of them. Of 41 km of earthen roads in a sample union, 23 km are maintained and 19 km are maintained by RMP (Table 4).

Social & Economic Cost-Benefit Analysis of RMP: HDRC & Agrodev Canada Inc.
13
Table 4: Sample union profile - characteristics of road network
Indicators Average Range No. of villages not connected with road (#) 2 0 – 07 Paved road (including herring bone) (Km) 14 0 – 47 Earthen road (Km) 42 13 – 95 Earthen road maintained (Km) 23 10 – 50 Earthen road maintained by RMP (Km) 19 10 – 20 Total road (Km) 55 13 – 111 No. of roads (#) 12 0 – 30 Distance between UP HQ and nearest pucca road (Km) 0.5 0 – 03 Distance from UP HQ to nearest road connecting Upazila HQ (Km) 1.3 0 – 08 Distance from UP HQ to nearest road connecting district HQ (Km) 2 0 – 08 Distance from UP HQ to nearest road connecting highway (Km) 2.4 0 – 09
Land Use: Agricultural land per union is 4,646 acres, ranging from 2,429 to 7,634 acres. Boro is grown on 62% of agricultural land, followed by aman (52%). The average area of pond, water bodies and forest are small (Table 5).
Table 5: Sample union profile - land use
Indicators Average Range Agricultural land (Acres) 4,646 2,429 - 7,634 Aman as % of agricultural land (%) 52 0 - 100 Boro as % of agricultural land (%) 62 0 – 100 Other crops as % of agricultural land (%) 19 0 – 74 Ponds (Acres) 141 42 – 606 Water bodies (Acres) 144 0 - 1,606 Forest (Acres) 130 0 - 2,000
The main agricultural crop is paddy (100%), followed by jute (63%), vegetables (87%), wheat (53%) and sugar cane (50%). Signifying proximity to rivers in 1/3 of unions, fish cultivation is the most frequently observed non-crop agricultural products (90% of sample unions). Other non-crop products include: fish (90%), poultry (80%), livestock (63%), and forest products (33%). Appendix Table 4-1. Commerce: A significant change has been identified in the number of shops among the sample unions. Before RMP road maintenance started, the average number of shops in the union was 212. Today, it has doubled to 428. Of even greater interest, the number of shops along RMP roads has tripled during the same time period from 28 to 82 (Table 6).
Table 6: Sample union profile – number of shops by locations
Shop location Before RMP Current (2006) Change (%)
Shops along RMP roads (#) 28 82 + 192 Shops in union (#) 212 428 + 101
Vehicles: The number of vehicles, both non-motorized and motorized, has increased sharply in the sample unions since the days before RMP road maintenance. The number of non-motorized vehicle increased by 80% (267 to 475) while motorized vehicle numbers were observed to increase by 113% (319 to 681). The issue of vehicle stock and flow is dealt with detail in Chapter 4.
Social & Economic Cost-Benefit Analysis of RMP: HDRC & Agrodev Canada Inc.
14
3.2 Household Profile - General
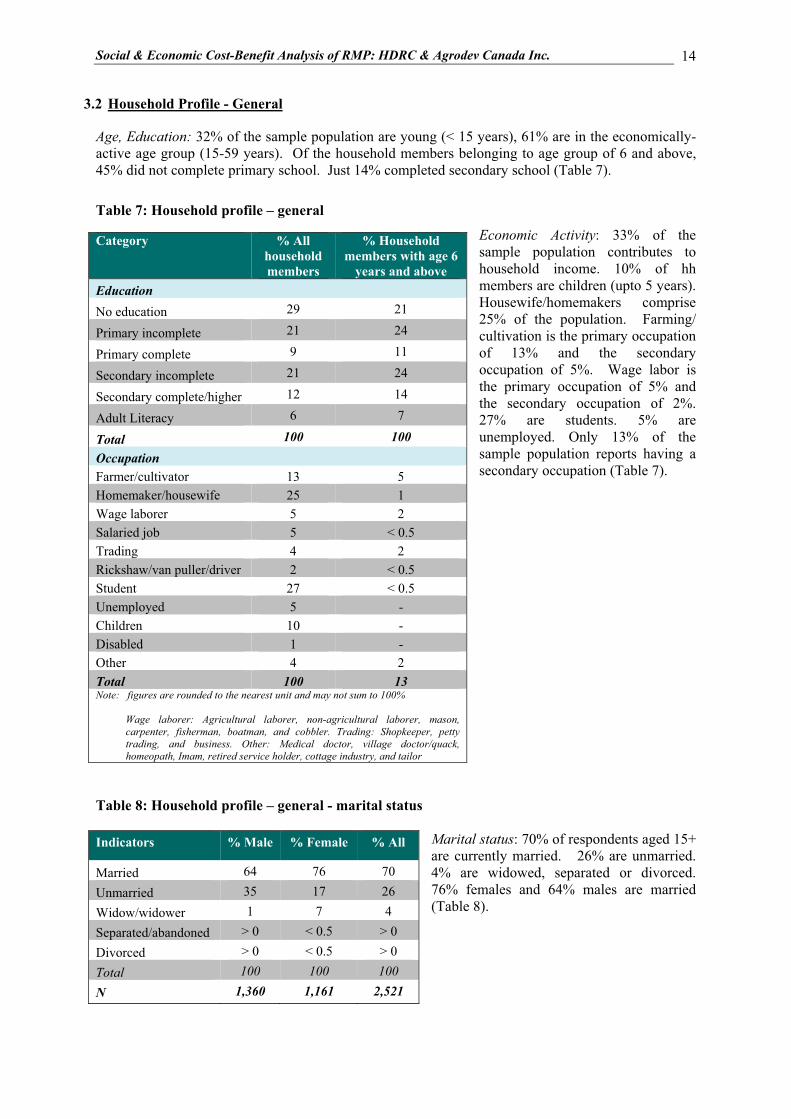
Age, Education: 32% of the sample population are young (< 15 years), 61% are in the economically- active age group (15-59 years). Of the household members belonging to age group of 6 and above, 45% did not complete primary school. Just 14% completed secondary school (Table 7).
Table 7: Household profile – general
Economic Activity: 33% of the sample population contributes to household income. 10% of hh members are children (upto 5 years). Housewife/homemakers comprise 25% of the population. Farming/ cultivation is the primary occupation of 13% and the secondary occupation of 5%. Wage labor is the primary occupation of 5% and the secondary occupation of 2%. 27% are students. 5% are unemployed. Only 13% of the sample population reports having a secondary occupation (Table 7).
Table 8: Household profile – general - marital status
Marital status: 70% of respondents aged 15+ are currently married. 26% are unmarried. 4% are widowed, separated or divorced. 76% females and 64% males are married (Table 8).
Category % All household members
% Household members with age 6
years and above Education No education 29 21
Primary incomplete 21 24
Primary complete 9 11
Secondary incomplete 21 24
Secondary complete/higher 12 14
Adult Literacy 6 7
Total 100 100 Occupation Farmer/cultivator 13 5 Homemaker/housewife 25 1 Wage laborer 5 2 Salaried job 5 < 0.5 Trading 4 2 Rickshaw/van puller/driver 2 < 0.5 Student 27 < 0.5 Unemployed 5 - Children 10 - Disabled 1 - Other 4 2 Total 100 13 Note: figures are rounded to the nearest unit and may not sum to 100% Wage laborer: Agricultural laborer, non-agricultural laborer, mason,
carpenter, fisherman, boatman, and cobbler. Trading: Shopkeeper, petty trading, and business. Other: Medical doctor, village doctor/quack, homeopath, Imam, retired service holder, cottage industry, and tailor
Indicators % Male % Female % All
Married 64 76 70 Unmarried 35 17 26 Widow/widower 1 7 4 Separated/abandoned > 0 < 0.5 > 0 Divorced > 0 < 0.5 > 0 Total 100 100 100 N 1,360 1,161 2,521
Social & Economic Cost-Benefit Analysis of RMP: HDRC & Agrodev Canada Inc.
15
3.3 Household Profile - Destitute Women
Table 9: Household profile of destitute women of sample union
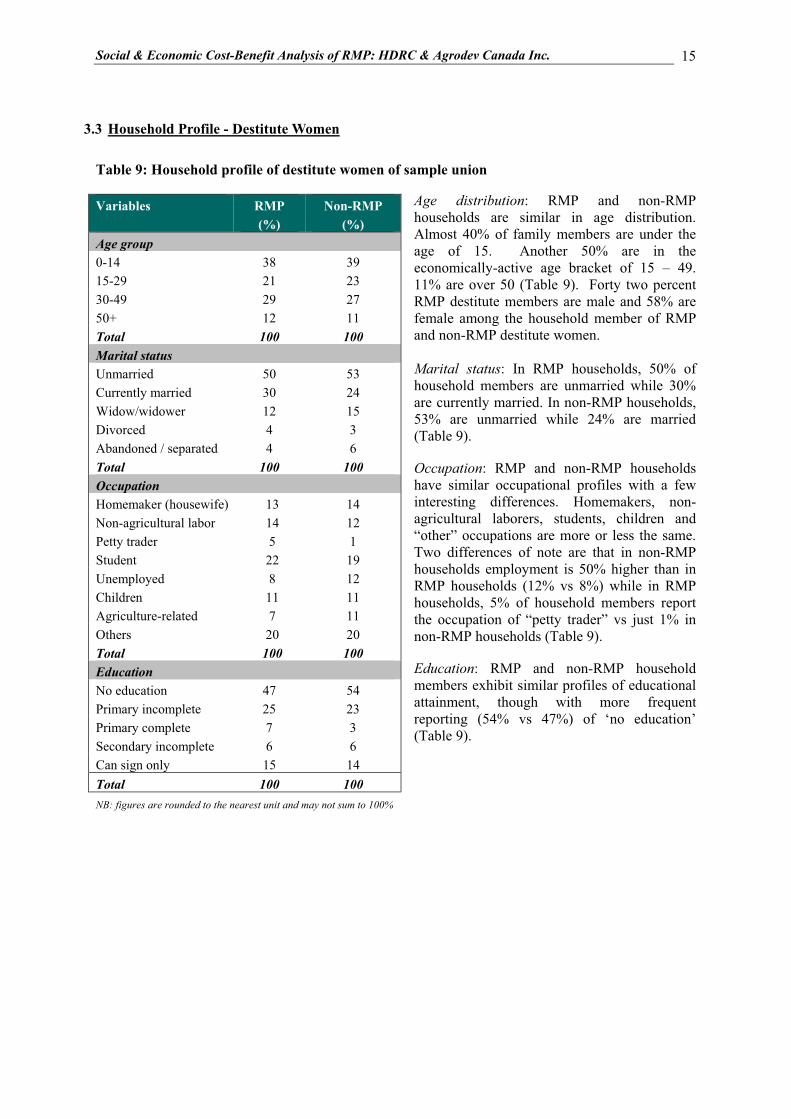
Age distribution: RMP and non-RMP households are similar in age distribution. Almost 40% of family members are under the age of 15. Another 50% are in the economically-active age bracket of 15 – 49. 11% are over 50 (Table 9). Forty two percent RMP destitute members are male and 58% are female among the household member of RMP and non-RMP destitute women. Marital status: In RMP households, 50% of household members are unmarried while 30% are currently married. In non-RMP households, 53% are unmarried while 24% are married (Table 9). Occupation: RMP and non-RMP households have similar occupational profiles with a few interesting differences. Homemakers, non-agricultural laborers, students, children and “other” occupations are more or less the same. Two differences of note are that in non-RMP households employment is 50% higher than in RMP households (12% vs 8%) while in RMP households, 5% of household members report the occupation of “petty trader” vs just 1% in non-RMP households (Table 9). Education: RMP and non-RMP household members exhibit similar profiles of educational attainment, though with more frequent reporting (54% vs 47%) of ‘no education’ (Table 9).
Variables RMP (%)
Non-RMP (%)
Age group 0-14 38 39 15-29 21 23 30-49 29 27 50+ 12 11 Total 100 100 Marital status Unmarried 50 53 Currently married 30 24 Widow/widower 12 15 Divorced 4 3 Abandoned / separated 4 6 Total 100 100 Occupation Homemaker (housewife) 13 14 Non-agricultural labor 14 12 Petty trader 5 1 Student 22 19 Unemployed 8 12 Children 11 11 Agriculture-related 7 11 Others 20 20 Total 100 100 Education No education 47 54 Primary incomplete 25 23 Primary complete 7 3 Secondary incomplete 6 6 Can sign only 15 14 Total 100 100 NB: figures are rounded to the nearest unit and may not sum to 100%
Social & Economic Cost-Benefit Analysis of RMP: HDRC & Agrodev Canada Inc.
16
CHAPTER 4 BENEFIT STREAM OF RMP– STOCK & FLOW OF TRAFFIC
4.1 Stock of Vehicles
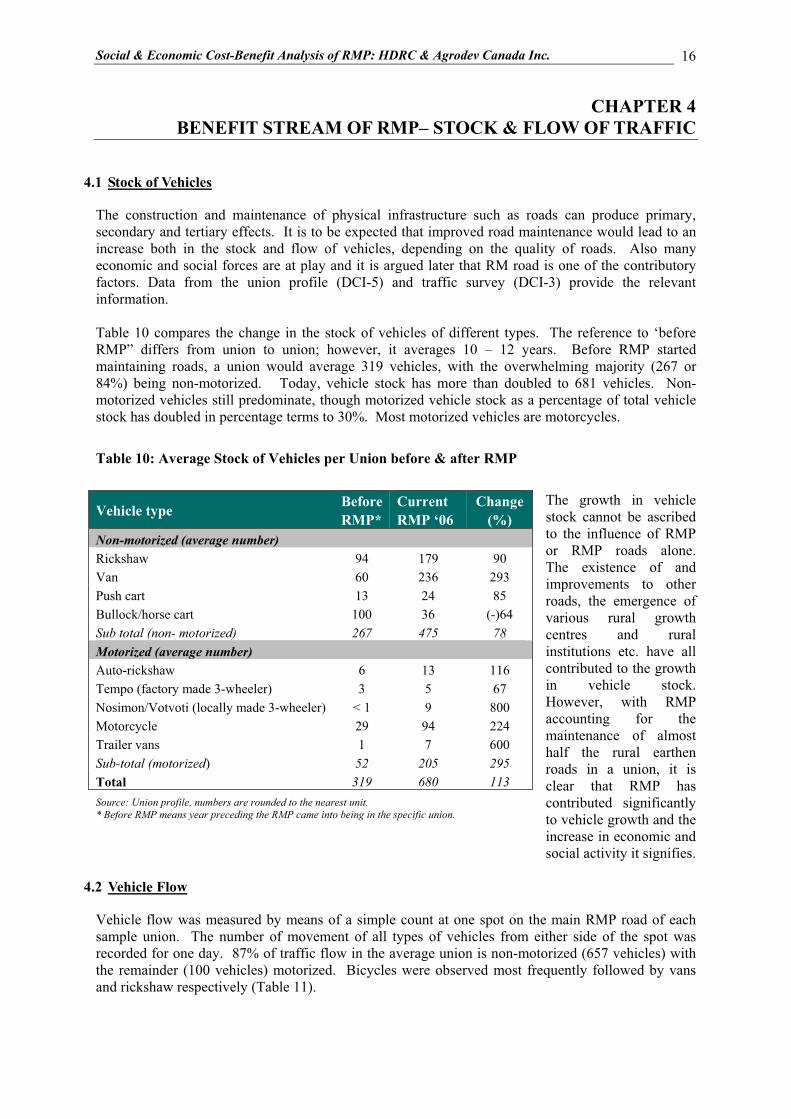
The construction and maintenance of physical infrastructure such as roads can produce primary, secondary and tertiary effects. It is to be expected that improved road maintenance would lead to an increase both in the stock and flow of vehicles, depending on the quality of roads. Also many economic and social forces are at play and it is argued later that RM road is one of the contributory factors. Data from the union profile (DCI-5) and traffic survey (DCI-3) provide the relevant information. Table 10 compares the change in the stock of vehicles of different types. The reference to ‘before RMP” differs from union to union; however, it averages 10 – 12 years. Before RMP started maintaining roads, a union would average 319 vehicles, with the overwhelming majority (267 or 84%) being non-motorized. Today, vehicle stock has more than doubled to 681 vehicles. Non-motorized vehicles still predominate, though motorized vehicle stock as a percentage of total vehicle stock has doubled in percentage terms to 30%. Most motorized vehicles are motorcycles.
Table 10: Average Stock of Vehicles per Union before & after RMP The growth in vehicle stock cannot be ascribed to the influence of RMP or RMP roads alone. The existence of and improvements to other roads, the emergence of various rural growth centres and rural institutions etc. have all contributed to the growth in vehicle stock. However, with RMP accounting for the maintenance of almost half the rural earthen roads in a union, it is clear that RMP has contributed significantly to vehicle growth and the increase in economic and social activity it signifies.
4.2 Vehicle Flow
Vehicle flow was measured by means of a simple count at one spot on the main RMP road of each sample union. The number of movement of all types of vehicles from either side of the spot was recorded for one day. 87% of traffic flow in the average union is non-motorized (657 vehicles) with the remainder (100 vehicles) motorized. Bicycles were observed most frequently followed by vans and rickshaw respectively (Table 11).
Vehicle type Before RMP*
Current RMP ‘06
Change (%)
Non-motorized (average number) Rickshaw 94 179 90 Van 60 236 293 Push cart 13 24 85 Bullock/horse cart 100 36 (-)64 Sub total (non- motorized) 267 475 78 Motorized (average number) Auto-rickshaw 6 13 116 Tempo (factory made 3-wheeler) 3 5 67 Nosimon/Votvoti (locally made 3-wheeler) < 1 9 800 Motorcycle 29 94 224 Trailer vans 1 7 600 Sub-total (motorized) 52 205 295 Total 319 680 113
Source: Union profile, numbers are rounded to the nearest unit. * Before RMP means year preceding the RMP came into being in the specific union.

Social & Economic Cost-Benefit Analysis of RMP: HDRC & Agrodev Canada Inc.
17
Table 11: Average Traffic Flow Per Union in the main RMP road (1 day)
Motorcycles accounted for almost 70% of motorized traffic flow followed by 3-wheelers such as nosimon and tempo. It is noteworthy that transport like private cars and jeeps also pass through RMP roads. The average traffic flow is remarkable when one takes into account the fact that the count was done in the rainy season when maintenance of earthen roads is limited at best. It is worthwhile to mentioned that the flow of traffic is consistent with the condition of stock discussed earlier. Among non-motorized vehicles, barring bicycle whose stock is not considered whose stock has the highest growth have also the highest flow in the RMP road. Rickshaw comes next with the second highest growth of stock and second highest level of flow. The same can be said about the motorized vehicles starting with motorcycle.
4.3 Households’ RMP Road Use Status
The use of roads depends on the proximity of households to them. It is no surprise then that 80% of rural households are
within 1 km of RMP road. Approximately 80% of rural households report using RMP roads in various degrees. (Appendix tables 4-2 & 4-3).
Table 12: Distribution of households by mode of traffic About 60% of households lie within 1 km. of the union’s main road. Households tend to lie closer to RMP roads (average distance = 0.5 km) than to main roads (average distance = 1.13 km), hence the increased usage. One can infer that RMP roads were correctly chosen to ensure benefits to a maximum number of households. Understandably non-motorized vehicles are the predominant mode of transport of rural people on earthen RMP road. Logically the percentage of rural households using motorized vehicles declines with the size of the vehicles (Table 12).
Vehicle type Average movement per union
Range (#)
Non-motorized Bicycle 332 33 – 1,318 Rickshaw 125 0 – 648 Van 167 2 – 613 Bullock carts 10 0 – 100 Push cart 17 0 – 163 Horse cart 7 0 – 70 Sub total (non-motorized) 657 51 – 2,579 Motorized Motorcycle 69 0 – 405 Tempo 9 0 – 83 Nosimon 12 0 – 155 Private car 1 0 – 10 Micro-bus 3 0 – 33 Jeep < 1 0 – 6 Truck 5 0 – 105 Bus 1 0 – 30 Sub total (motorized) 100 3 – 618 Total 757 54 – 2,958
Source: Traffic Flow Survey, counts rounded to nearest unit
Type of vehicle % of all households No vehicle/on foot 79 Bicycle 50 Richshaw/Van 71 Bullock carts 6 Auto rickshaw/Tempo 14 Nosimon, Votvoti 8 Motor cycle 11 Bus 4 Truck 2 Car < 1 Jeep < 1 Microbus 2 Others 1 N 690
Note: The percentage figures are results of multiple responses so that the sum of these will far exceed 100%.
Social & Economic Cost-Benefit Analysis of RMP: HDRC & Agrodev Canada Inc.
18
4.4 Purpose of RMP Road use
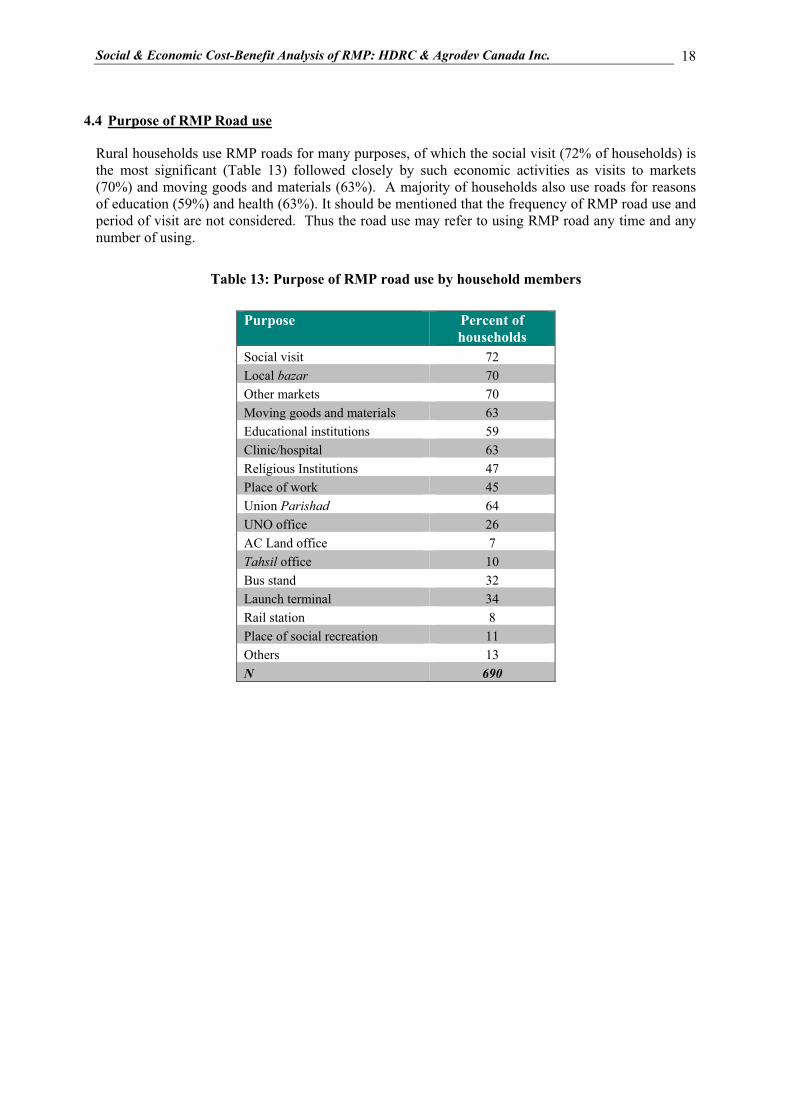
Rural households use RMP roads for many purposes, of which the social visit (72% of households) is the most significant (Table 13) followed closely by such economic activities as visits to markets (70%) and moving goods and materials (63%). A majority of households also use roads for reasons of education (59%) and health (63%). It should be mentioned that the frequency of RMP road use and period of visit are not considered. Thus the road use may refer to using RMP road any time and any number of using.
Table 13: Purpose of RMP road use by household members
Purpose Percent of households
Social visit 72 Local bazar 70 Other markets 70 Moving goods and materials 63 Educational institutions 59 Clinic/hospital 63 Religious Institutions 47 Place of work 45 Union Parishad 64 UNO office 26 AC Land office 7 Tahsil office 10 Bus stand 32 Launch terminal 34 Rail station 8 Place of social recreation 11 Others 13 N 690
Social & Economic Cost-Benefit Analysis of RMP: HDRC & Agrodev Canada Inc.
19
CHAPTER 5 BENEFIT STREAM – HOUSEHOLD LEVEL
5.1 Categories of Household Benefits
This Chapter brings into focus a large number of economic and social benefits that are being derived by the rural households. It is instructive to mention at the outset that the rural households owe to the RMP roads besides other factors for these benefits. 690 sample households reported on benefits received due to RMP road maintenance. 43 benefits were identified. They have been grouped in seven categories, as follows. � Goods sector benefits include a broader scope for crop agriculture, fallow land under cultivation,
production of new agricultural products, increased in crop production and increased opportunities for poultry raising. Benefits from this group apply only to those households with sources of income from these categories.
� Labour market benefits include increases in: scope of work, employment opportunities, earning opportunities from multiples sources, work at night, work days.
� Trade and commerce benefits include lower costs of transportations of agricultural products, increased producer prices of agricultural products, lower prices of agricultural inputs, easy marketing of products, increased commercial opportunities (e.g., opening a shop), increased trade volume, increased numbers of buyers in a specific shop, extended business hours, year round rent of shops, rent of shop/houses, price of homestead land, and expansion of trade and business.
� Transport and communication benefits include increased availability of rickshaw/van, reduced transport costs, reduced time to move goods, fewer accidents, less water logging during rainy season, ease of transport near one’s home.
� Health and hygiene benefits include better access to public health centres, easier shifting of emergency patients to hospitals, reduced incidence of deaths of pregnant women and maternal deaths as well as less open defecation by the RMP roadside.
� Education benefits mainly concentrate on school attendance. For example, increase in school attendance and reduced anxiety among parents sending children to school.
� Psycho-social benefits are related to comfort, security and the mobility both at the individual household level and at the level of the community as a whole. Examples include: mobility at night, a comfortable and uninterrupted journey, matrimonial proposal from afar, improved security, the ability of women to walk in high heeled shoes.
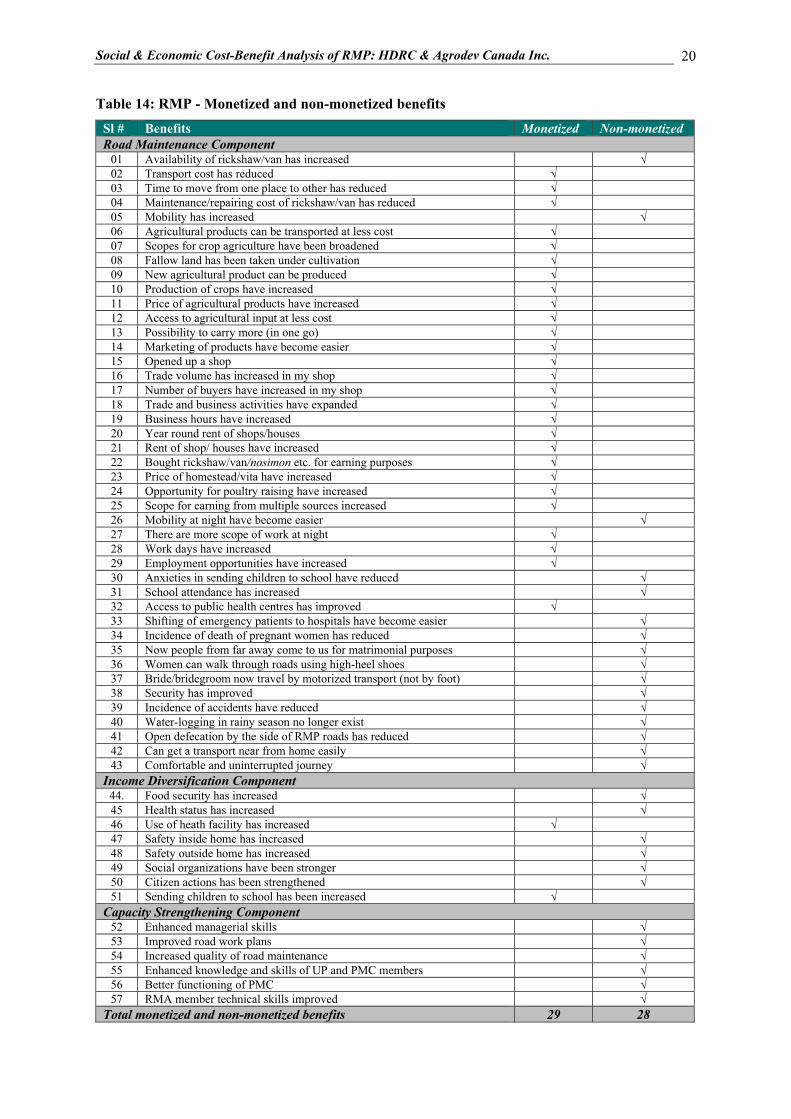
The 43 benefits represent most of the list found in Table 14. In addition to these economic benefits are eight benefits reported in the course of the destitute women’s survey and six benefits reported in the key informant interviews. Of the total list of 57 benefits, 29 monetized benefits and 28 non-monetized benefits are identified. Not all benefits on the list were reported by all households. Of the seven groups of benefits, health and hygiene benefits were reported as a group by 72% of households, the highest percentage among the seven categories. This was followed by psycho-social benefits (70%), transport and communication benefits (59%), education benefits (58.5%), labour market benefits (43%), goods sector benefits (38%), trade and commerce benefits (30%). Most health and hygiene, education and psycho-social benefits cannot be monetized. Some transport and communication benefits (reduction in transport cost, maintenance cost, and time), goods sector benefits (increase in crop production, new agricultural production) and labour market benefits (increase in work days, increase in employment opportunity) can be quantified in monetary terms.
Social & Economic Cost-Benefit Analysis of RMP: HDRC & Agrodev Canada Inc.
20
Table 14: RMP - Monetized and non-monetized benefits
Sl # Benefits Monetized Non-monetized Road Maintenance Component
01 Availability of rickshaw/van has increased � 02 Transport cost has reduced � 03 Time to move from one place to other has reduced � 04 Maintenance/repairing cost of rickshaw/van has reduced � 05 Mobility has increased � 06 Agricultural products can be transported at less cost � 07 Scopes for crop agriculture have been broadened � 08 Fallow land has been taken under cultivation � 09 New agricultural product can be produced � 10 Production of crops have increased � 11 Price of agricultural products have increased � 12 Access to agricultural input at less cost � 13 Possibility to carry more (in one go) � 14 Marketing of products have become easier � 15 Opened up a shop � 16 Trade volume has increased in my shop � 17 Number of buyers have increased in my shop � 18 Trade and business activities have expanded � 19 Business hours have increased � 20 Year round rent of shops/houses � 21 Rent of shop/ houses have increased � 22 Bought rickshaw/van/nosimon etc. for earning purposes � 23 Price of homestead/vita have increased � 24 Opportunity for poultry raising have increased � 25 Scope for earning from multiple sources increased � 26 Mobility at night have become easier � 27 There are more scope of work at night � 28 Work days have increased � 29 Employment opportunities have increased � 30 Anxieties in sending children to school have reduced � 31 School attendance has increased � 32 Access to public health centres has improved � 33 Shifting of emergency patients to hospitals have become easier � 34 Incidence of death of pregnant women has reduced � 35 Now people from far away come to us for matrimonial purposes � 36 Women can walk through roads using high-heel shoes � 37 Bride/bridegroom now travel by motorized transport (not by foot) � 38 Security has improved � 39 Incidence of accidents have reduced � 40 Water-logging in rainy season no longer exist � 41 Open defecation by the side of RMP roads has reduced � 42 Can get a transport near from home easily � 43 Comfortable and uninterrupted journey �
Income Diversification Component 44. Food security has increased � 45 Health status has increased � 46 Use of heath facility has increased � 47 Safety inside home has increased � 48 Safety outside home has increased � 49 Social organizations have been stronger � 50 Citizen actions has been strengthened � 51 Sending children to school has been increased �
Capacity Strengthening Component 52 Enhanced managerial skills � 53 Improved road work plans � 54 Increased quality of road maintenance � 55 Enhanced knowledge and skills of UP and PMC members � 56 Better functioning of PMC � 57 RMA member technical skills improved �
Total monetized and non-monetized benefits 29 28
Social & Economic Cost-Benefit Analysis of RMP: HDRC & Agrodev Canada Inc.
21
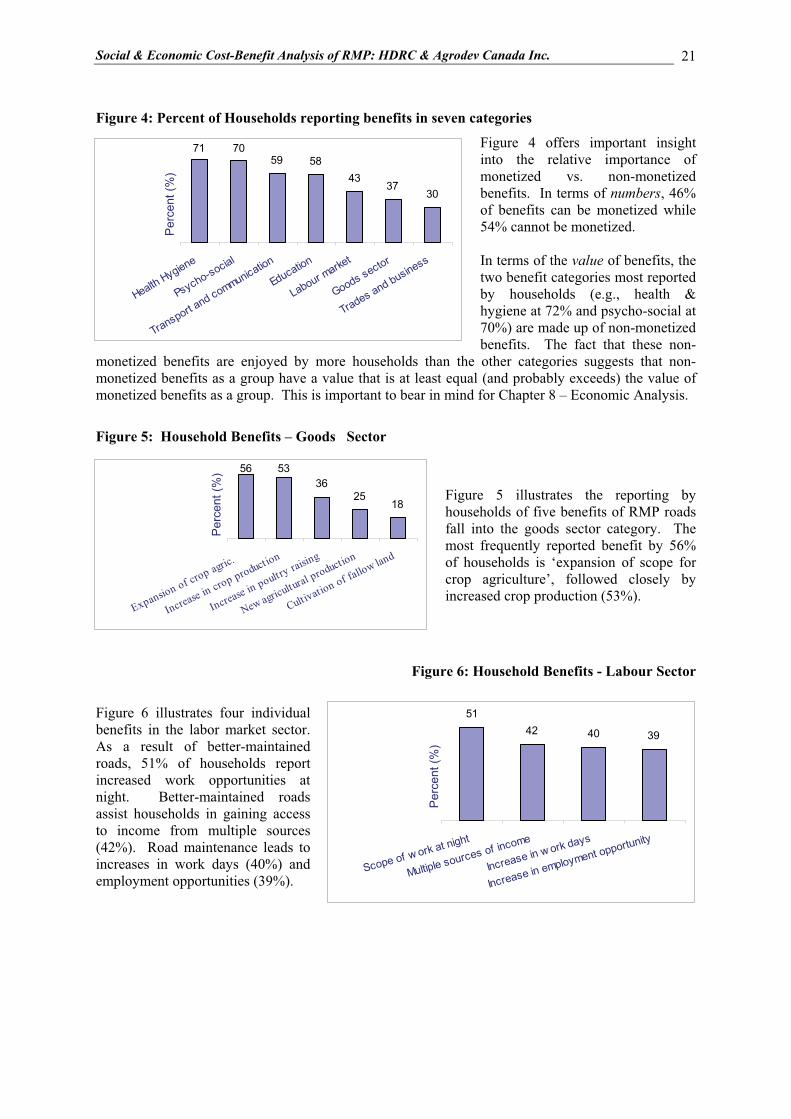
Figure 4: Percent of Households reporting benefits in seven categories
Figure 4 offers important insight into the relative importance of monetized vs. non-monetized benefits. In terms of numbers, 46% of benefits can be monetized while 54% cannot be monetized. In terms of the value of benefits, the two benefit categories most reported by households (e.g., health & hygiene at 72% and psycho-social at 70%) are made up of non-monetized benefits. The fact that these non-
monetized benefits are enjoyed by more households than the other categories suggests that non-monetized benefits as a group have a value that is at least equal (and probably exceeds) the value of monetized benefits as a group. This is important to bear in mind for Chapter 8 – Economic Analysis.
Figure 5: Household Benefits – Goods Sector
Figure 5 illustrates the reporting by households of five benefits of RMP roads fall into the goods sector category. The most frequently reported benefit by 56% of households is ‘expansion of scope for crop agriculture’, followed closely by increased crop production (53%).
Figure 6: Household Benefits - Labour Sector
Figure 6 illustrates four individual benefits in the labor market sector. As a result of better-maintained roads, 51% of households report increased work opportunities at night. Better-maintained roads assist households in gaining access to income from multiple sources (42%). Road maintenance leads to increases in work days (40%) and employment opportunities (39%).
71 7059 58
4337
30
Health Hygiene
Psycho-social
Transport and communication
Education
Labour marke
t
Goods sector
Trades and business
Perc
ent (
%)
5142 40 39
Scope of w ork at night
Multiple sources of income
Increase in w ork days
Increase in employment opportunity
Perc
ent (
%)
56 5336
2518
Expansion of crop agric...
Increase in crop production
Increase in poultry raising
New agricultural production
Cultivation of fallow land
Perc
ent (
%)
Per
cent
(%)
Per
cent
(%)
Per
cent
(%)
Social & Economic Cost-Benefit Analysis of RMP: HDRC & Agrodev Canada Inc.
22
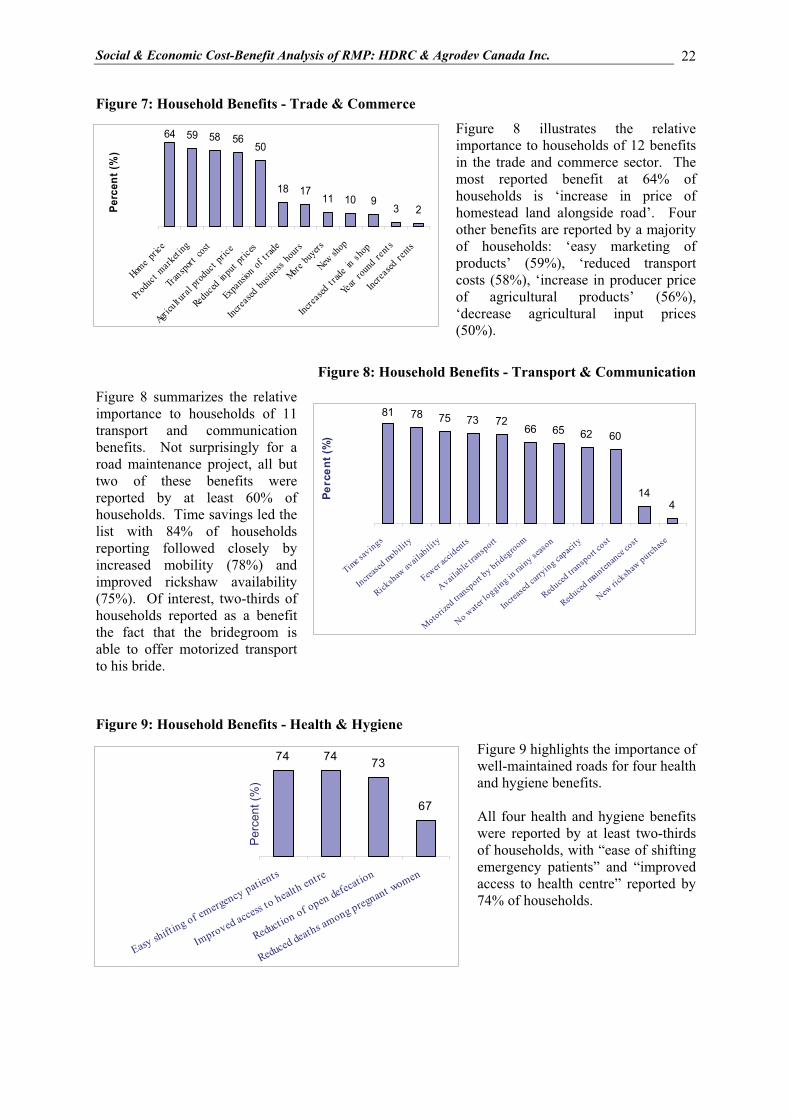
Figure 7: Household Benefits - Trade & Commerce
Figure 8 illustrates the relative importance to households of 12 benefits in the trade and commerce sector. The most reported benefit at 64% of households is ‘increase in price of homestead land alongside road’. Four other benefits are reported by a majority of households: ‘easy marketing of products’ (59%), ‘reduced transport costs (58%), ‘increase in producer price of agricultural products’ (56%), ‘decrease agricultural input prices (50%).
Figure 8: Household Benefits - Transport & Communication
Figure 8 summarizes the relative importance to households of 11 transport and communication benefits. Not surprisingly for a road maintenance project, all but two of these benefits were reported by at least 60% of households. Time savings led the list with 84% of households reporting followed closely by increased mobility (78%) and improved rickshaw availability (75%). Of interest, two-thirds of households reported as a benefit the fact that the bridegroom is able to offer motorized transport to his bride.
Figure 9: Household Benefits - Health & Hygiene
Figure 9 highlights the importance of well-maintained roads for four health and hygiene benefits. All four health and hygiene benefits were reported by at least two-thirds of households, with “ease of shifting emergency patients” and “improved access to health centre” reported by 74% of households.
64 59 58 5650
18 1711 10 9
3 2
Home p
rice
Produ
ct mark
et ing
Transpo
rt cos
t
Agricu
lt ural
prod
uct p
rice
Redu
ced in
put p
rices
Expa
nsion
of t r
ade
Increa
sed bu
siness
hours
More bu
yers
New sh
op
Increa
sed t r
ade in
shop
Year
round
rent s
Increa
sed re
nts
Perc
ent (
%)
81 78 75 73 7266 65 62 60
144
Time s
avings
Increase
d mobility
Ricksh
aw av
ailab
ility
Fewer
acciden
ts
Availab
le tra
nsport
Motorized
transp
ort by brid
egroom
No water lo
gging in rai
ny seaso
n
Increase
d carry
ing capaci
ty
Reduced
transport c
ost
Reduced
mainten
ance co
st
New ric
kshaw purch
ase
Perc
ent (
%)
74 74 73
67
Easy shifting of emergency patients
Improved access to health entre
Reduction of open defecation
Reduced deaths among pregnant women
Perc
ent (
%)
Per
cent
(%)
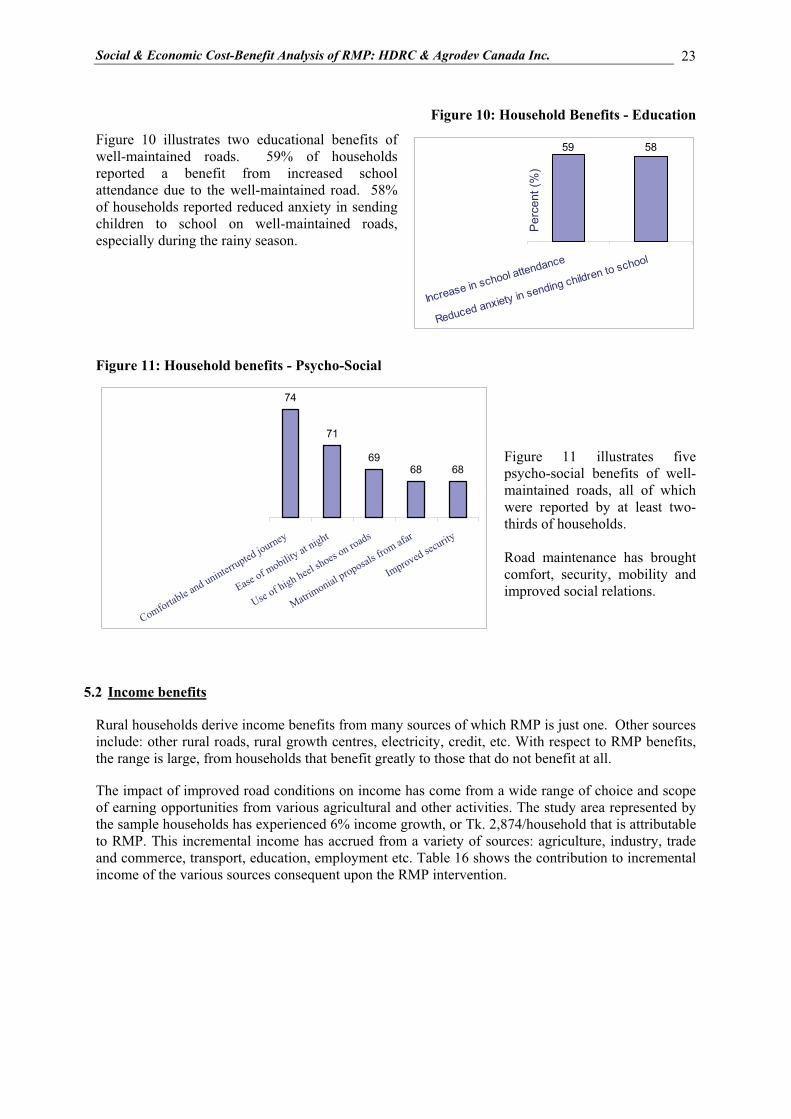
Social & Economic Cost-Benefit Analysis of RMP: HDRC & Agrodev Canada Inc.
23
Figure 10: Household Benefits - Education Figure 10 illustrates two educational benefits of well-maintained roads. 59% of households reported a benefit from increased school attendance due to the well-maintained road. 58% of households reported reduced anxiety in sending children to school on well-maintained roads, especially during the rainy season.
Figure 11: Household benefits - Psycho-Social
Figure 11 illustrates five psycho-social benefits of well-maintained roads, all of which were reported by at least two-thirds of households. Road maintenance has brought comfort, security, mobility and improved social relations.
5.2 Income benefits
Rural households derive income benefits from many sources of which RMP is just one. Other sources include: other rural roads, rural growth centres, electricity, credit, etc. With respect to RMP benefits, the range is large, from households that benefit greatly to those that do not benefit at all. The impact of improved road conditions on income has come from a wide range of choice and scope of earning opportunities from various agricultural and other activities. The study area represented by the sample households has experienced 6% income growth, or Tk. 2,874/household that is attributable to RMP. This incremental income has accrued from a variety of sources: agriculture, industry, trade and commerce, transport, education, employment etc. Table 16 shows the contribution to incremental income of the various sources consequent upon the RMP intervention.
59 58
Increase in school attendance
Reduced anxiety in sending children to school
Perc
ent (
%)
74
71
6968 68
Comfortable and uninterrupted journey
Ease of mobility
at night
Use of high heel shoes on roads
Matrimonial proposals fr
om afar
Improved security
Perc
ent (
%)
Per
cent
(%)
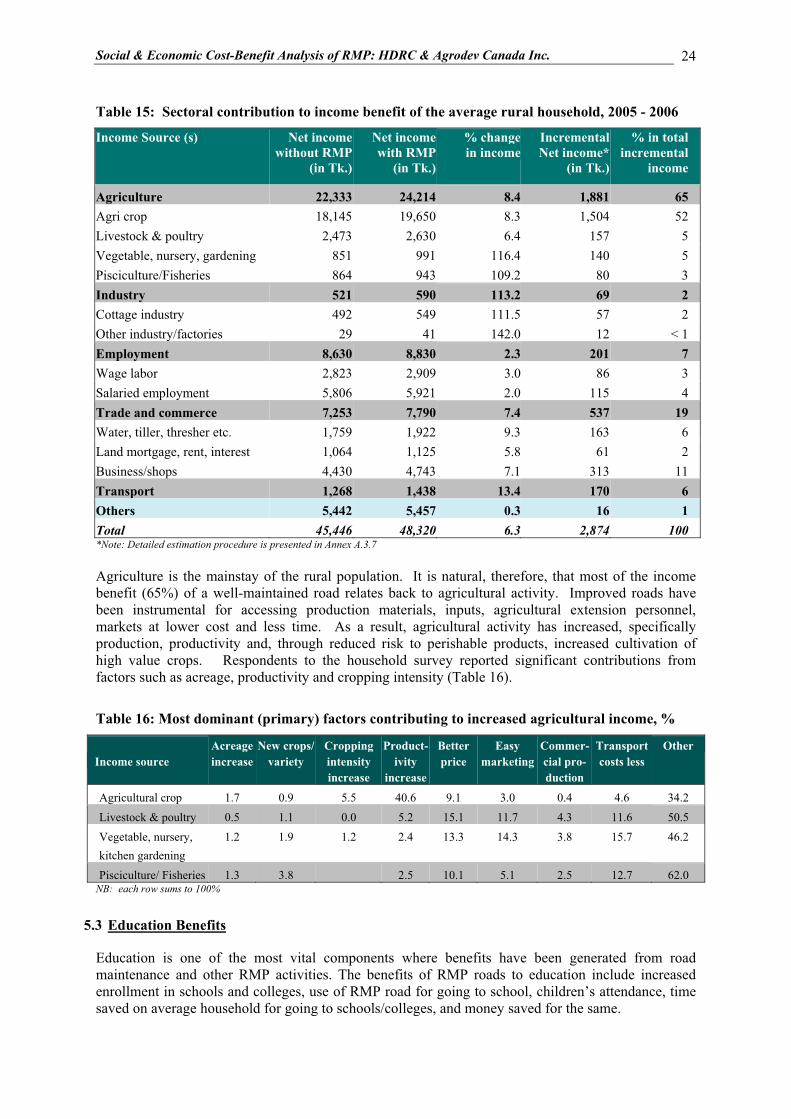
Social & Economic Cost-Benefit Analysis of RMP: HDRC & Agrodev Canada Inc.
24
Table 15: Sectoral contribution to income benefit of the average rural household, 2005 - 2006 Income Source (s) Net income
without RMP(in Tk.)
Net income with RMP
(in Tk.)
% change in income
Incremental Net income*
(in Tk.)
% in total incremental
income
Agriculture 22,333 24,214 8.4 1,881 65 Agri crop 18,145 19,650 8.3 1,504 52 Livestock & poultry 2,473 2,630 6.4 157 5 Vegetable, nursery, gardening 851 991 116.4 140 5 Pisciculture/Fisheries 864 943 109.2 80 3 Industry 521 590 113.2 69 2 Cottage industry 492 549 111.5 57 2 Other industry/factories 29 41 142.0 12 < 1 Employment 8,630 8,830 2.3 201 7 Wage labor 2,823 2,909 3.0 86 3 Salaried employment 5,806 5,921 2.0 115 4 Trade and commerce 7,253 7,790 7.4 537 19 Water, tiller, thresher etc. 1,759 1,922 9.3 163 6 Land mortgage, rent, interest 1,064 1,125 5.8 61 2 Business/shops 4,430 4,743 7.1 313 11 Transport 1,268 1,438 13.4 170 6 Others 5,442 5,457 0.3 16 1 Total 45,446 48,320 6.3 2,874 100 *Note: Detailed estimation procedure is presented in Annex A.3.7 Agriculture is the mainstay of the rural population. It is natural, therefore, that most of the income benefit (65%) of a well-maintained road relates back to agricultural activity. Improved roads have been instrumental for accessing production materials, inputs, agricultural extension personnel, markets at lower cost and less time. As a result, agricultural activity has increased, specifically production, productivity and, through reduced risk to perishable products, increased cultivation of high value crops. Respondents to the household survey reported significant contributions from factors such as acreage, productivity and cropping intensity (Table 16).
Table 16: Most dominant (primary) factors contributing to increased agricultural income, %
Income source Acreage increase
New crops/ variety
Cropping intensity increase
Product-ivity
increase
Better price
Easy marketing
Commer-cial pro-duction
Transport costs less
Other
Agricultural crop 1.7 0.9 5.5 40.6 9.1 3.0 0.4 4.6 34.2 Livestock & poultry 0.5 1.1 0.0 5.2 15.1 11.7 4.3 11.6 50.5 Vegetable, nursery, kitchen gardening
1.2 1.9 1.2 2.4 13.3 14.3 3.8 15.7 46.2
Pisciculture/ Fisheries 1.3 3.8 2.5 10.1 5.1 2.5 12.7 62.0 NB: each row sums to 100%
5.3 Education Benefits
Education is one of the most vital components where benefits have been generated from road maintenance and other RMP activities. The benefits of RMP roads to education include increased enrollment in schools and colleges, use of RMP road for going to school, children’s attendance, time saved on average household for going to schools/colleges, and money saved for the same.

Social & Economic Cost-Benefit Analysis of RMP: HDRC & Agrodev Canada Inc.
25
Respondents with children enrolled in school were asked about the use and influence of RMP roads for going to educational institutions. Among the women having children of primary school age, 71% reported using RMP-maintained roads. The rate of use was 73% for secondary school children and 65% for post-secondary/college children. (Appendix tables 4 – 4 & 4 – 5). The great majority of respondents (e.g., 89% of parents with children of primary school age) reported that their children’s attendance at school or college had increased as a result of access to a maintained RMP road. Furthermore, about half of respondents reported that road condition matters in decision-making such as admissions (48%), improved attendance (53%) and reduced drop-out rates (30%). (Appendix tables 4 – 6 & 4 – 7). To understand the issue of time savings, respondents were asked about differences in the time to travel to and from educational institutions with and without the RMP road. Respondents were asked to comment on their experience throughout the year as a whole and during the rainy season in particular. The results are tabulated in Table 17.
Table 17: Time savings traveling to/from educational institutions
Educational Institutions All households (in minutes)
Without RMP road
With RMP road
Time saved N
In general Primary school/equivalent 12.6 8.4 4.2 690 Secondary school/equivalent 8.2 5.6 2.6 690 Higher secondary/college 3.7 2.5 1.2 690 Overall status of institutions 24.55 16.52 8.03 690
In rainy season Primary school/equivalent 17.4 11.2 6.2 690 Secondary school/equivalent 11.2 6.9 4.3 690 Higher secondary/college 4.8 3.1 1.7 690 Overall status of institutions 33.21 21.04 12.17 690
The average time saved was 8 minutes/school day. During the rainy season, the time saving increased to 12 minutes/school day. With 228 school days in the year, the average time savings per household was 30.5 hours. With RMP reaching 17.8 million households throughout rural Bangladesh, the annual time savings in going to and from educational institutions was a staggering 543 million hours. (Appendix table 4 – 8). Respondents were asked to report savings from the use of well-maintained RMP roads in monetary terms as well. The average savings was Tk 1.1/school day or Tk 251/household/year. Overall, 17.8 million RMP households in 4,150 unions save Tk 4,464 million/year from the use of RMP roads to reach educational institutions. (Appendix table 4 – 9).
5.4 Health Benefits
A quantitative analysis has been made of time and cost impacts of well-maintained roads on hospital visits and treatment of illness. The purpose was to establish a link between well-maintained roads and expenditure savings for health reasons. Respondents were interviewed regarding types of illness during the previous year. 52 types of illness were reported. “Fever” was reported most frequently, by 23% of households. Respondents were interviewed regarding the use of RMP maintained roads to make hospital/clinic visits. Again, “fever”
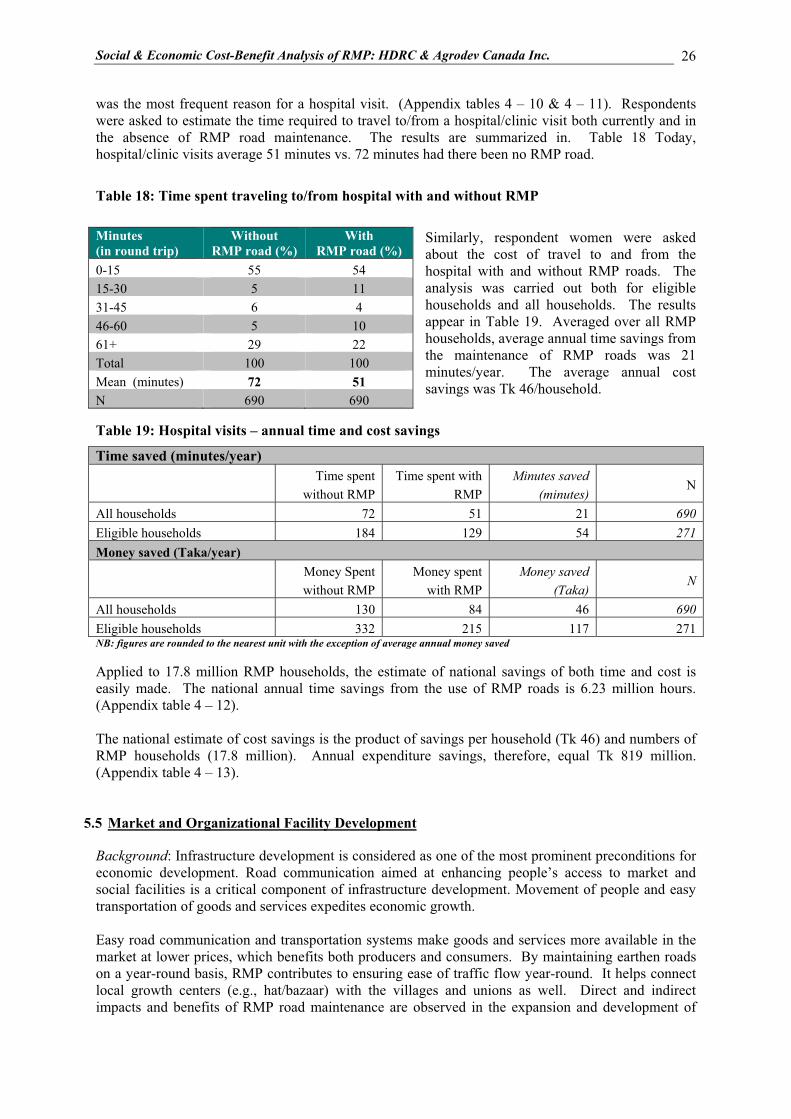
Social & Economic Cost-Benefit Analysis of RMP: HDRC & Agrodev Canada Inc.
26
was the most frequent reason for a hospital visit. (Appendix tables 4 – 10 & 4 – 11). Respondents were asked to estimate the time required to travel to/from a hospital/clinic visit both currently and in the absence of RMP road maintenance. The results are summarized in. Table 18 Today, hospital/clinic visits average 51 minutes vs. 72 minutes had there been no RMP road.
Table 18: Time spent traveling to/from hospital with and without RMP
Similarly, respondent women were asked about the cost of travel to and from the hospital with and without RMP roads. The analysis was carried out both for eligible households and all households. The results appear in Table 19. Averaged over all RMP households, average annual time savings from the maintenance of RMP roads was 21 minutes/year. The average annual cost savings was Tk 46/household.
Table 19: Hospital visits – annual time and cost savings
Time saved (minutes/year)
Time spent
without RMP Time spent with
RMP Minutes saved
(minutes) N
All households 72 51 21 690 Eligible households 184 129 54 271 Money saved (Taka/year)
Money Spent without RMP
Money spent with RMP
Money saved (Taka)
N
All households 130 84 46 690 Eligible households 332 215 117 271 NB: figures are rounded to the nearest unit with the exception of average annual money saved Applied to 17.8 million RMP households, the estimate of national savings of both time and cost is easily made. The national annual time savings from the use of RMP roads is 6.23 million hours. (Appendix table 4 – 12). The national estimate of cost savings is the product of savings per household (Tk 46) and numbers of RMP households (17.8 million). Annual expenditure savings, therefore, equal Tk 819 million. (Appendix table 4 – 13).
5.5 Market and Organizational Facility Development
Background: Infrastructure development is considered as one of the most prominent preconditions for economic development. Road communication aimed at enhancing people’s access to market and social facilities is a critical component of infrastructure development. Movement of people and easy transportation of goods and services expedites economic growth. Easy road communication and transportation systems make goods and services more available in the market at lower prices, which benefits both producers and consumers. By maintaining earthen roads on a year-round basis, RMP contributes to ensuring ease of traffic flow year-round. It helps connect local growth centers (e.g., hat/bazaar) with the villages and unions as well. Direct and indirect impacts and benefits of RMP road maintenance are observed in the expansion and development of
Minutes (in round trip)
Without RMP road (%)
With RMP road (%)
0-15 55 54 15-30 5 11 31-45 6 4 46-60 5 10 61+ 29 22 Total 100 100 Mean (minutes) 72 51 N 690 690
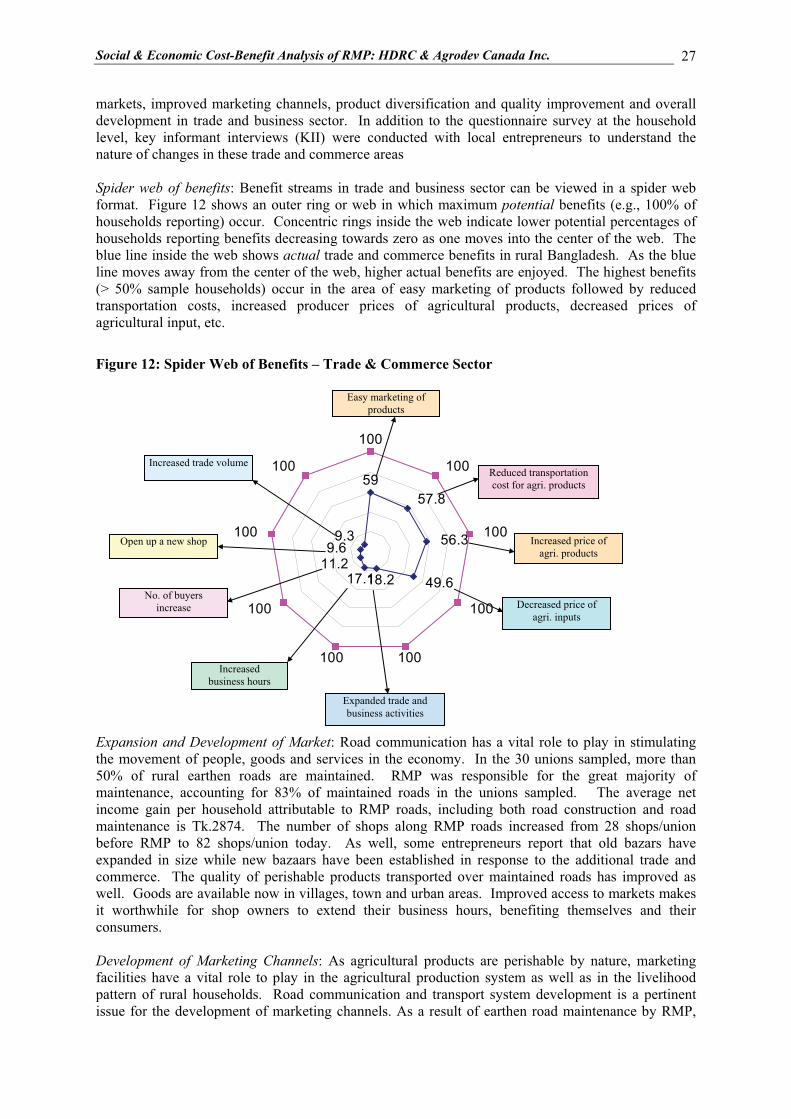
Social & Economic Cost-Benefit Analysis of RMP: HDRC & Agrodev Canada Inc.
27
markets, improved marketing channels, product diversification and quality improvement and overall development in trade and business sector. In addition to the questionnaire survey at the household level, key informant interviews (KII) were conducted with local entrepreneurs to understand the nature of changes in these trade and commerce areas Spider web of benefits: Benefit streams in trade and business sector can be viewed in a spider web format. Figure 12 shows an outer ring or web in which maximum potential benefits (e.g., 100% of households reporting) occur. Concentric rings inside the web indicate lower potential percentages of households reporting benefits decreasing towards zero as one moves into the center of the web. The blue line inside the web shows actual trade and commerce benefits in rural Bangladesh. As the blue line moves away from the center of the web, higher actual benefits are enjoyed. The highest benefits (> 50% sample households) occur in the area of easy marketing of products followed by reduced transportation costs, increased producer prices of agricultural products, decreased prices of agricultural input, etc.
Figure 12: Spider Web of Benefits – Trade & Commerce Sector
Expansion and Development of Market: Road communication has a vital role to play in stimulating the movement of people, goods and services in the economy. In the 30 unions sampled, more than 50% of rural earthen roads are maintained. RMP was responsible for the great majority of maintenance, accounting for 83% of maintained roads in the unions sampled. The average net income gain per household attributable to RMP roads, including both road construction and road maintenance is Tk.2874. The number of shops along RMP roads increased from 28 shops/union before RMP to 82 shops/union today. As well, some entrepreneurs report that old bazars have expanded in size while new bazaars have been established in response to the additional trade and commerce. The quality of perishable products transported over maintained roads has improved as well. Goods are available now in villages, town and urban areas. Improved access to markets makes it worthwhile for shop owners to extend their business hours, benefiting themselves and their consumers. Development of Marketing Channels: As agricultural products are perishable by nature, marketing facilities have a vital role to play in the agricultural production system as well as in the livelihood pattern of rural households. Road communication and transport system development is a pertinent issue for the development of marketing channels. As a result of earthen road maintenance by RMP,
5957.8
56.3
49.618.217.111.29.6
9.3
100
100
100
100
100100
100
100
100 Reduced transportation cost for agri. products
Increased price of agri. products
Easy marketing of products
Decreased price of agri. inputs
Expanded trade and business activities
Increased business hours
No. of buyers increase
Open up a new shop
Increased trade volume
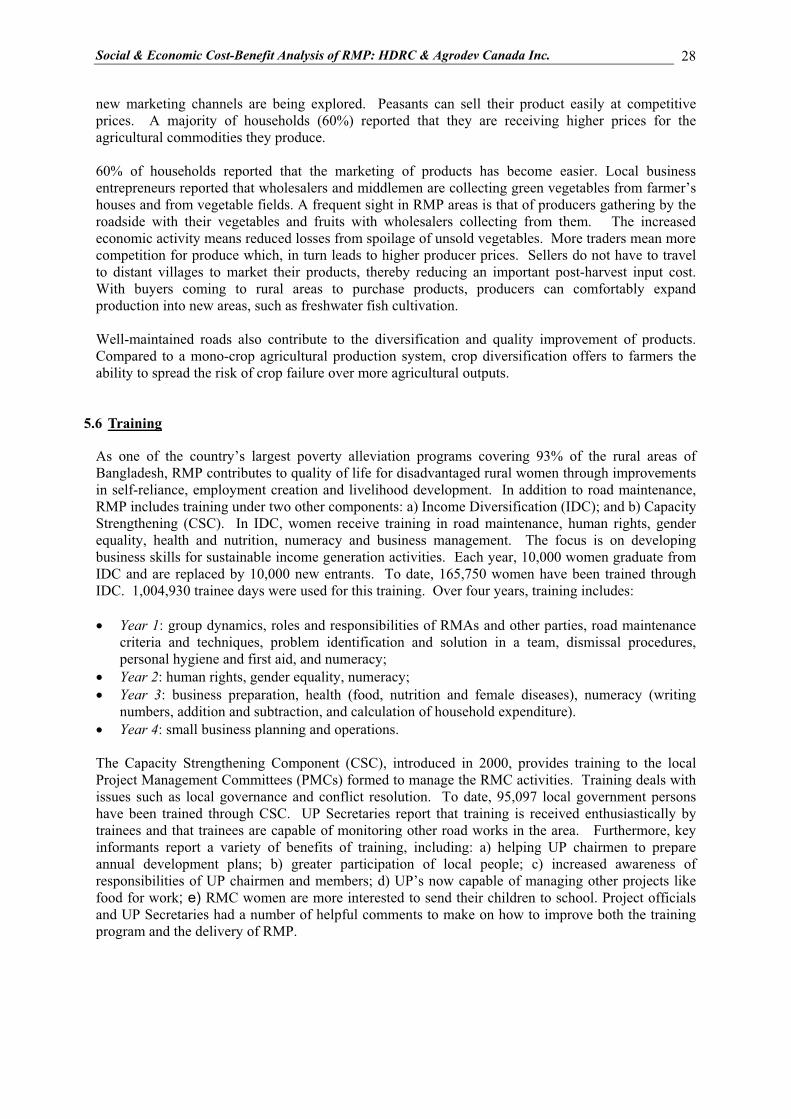
Social & Economic Cost-Benefit Analysis of RMP: HDRC & Agrodev Canada Inc.
28
new marketing channels are being explored. Peasants can sell their product easily at competitive prices. A majority of households (60%) reported that they are receiving higher prices for the agricultural commodities they produce. 60% of households reported that the marketing of products has become easier. Local business entrepreneurs reported that wholesalers and middlemen are collecting green vegetables from farmer’s houses and from vegetable fields. A frequent sight in RMP areas is that of producers gathering by the roadside with their vegetables and fruits with wholesalers collecting from them. The increased economic activity means reduced losses from spoilage of unsold vegetables. More traders mean more competition for produce which, in turn leads to higher producer prices. Sellers do not have to travel to distant villages to market their products, thereby reducing an important post-harvest input cost. With buyers coming to rural areas to purchase products, producers can comfortably expand production into new areas, such as freshwater fish cultivation. Well-maintained roads also contribute to the diversification and quality improvement of products. Compared to a mono-crop agricultural production system, crop diversification offers to farmers the ability to spread the risk of crop failure over more agricultural outputs.
5.6 Training
As one of the country’s largest poverty alleviation programs covering 93% of the rural areas of Bangladesh, RMP contributes to quality of life for disadvantaged rural women through improvements in self-reliance, employment creation and livelihood development. In addition to road maintenance, RMP includes training under two other components: a) Income Diversification (IDC); and b) Capacity Strengthening (CSC). In IDC, women receive training in road maintenance, human rights, gender equality, health and nutrition, numeracy and business management. The focus is on developing business skills for sustainable income generation activities. Each year, 10,000 women graduate from IDC and are replaced by 10,000 new entrants. To date, 165,750 women have been trained through IDC. 1,004,930 trainee days were used for this training. Over four years, training includes: � Year 1: group dynamics, roles and responsibilities of RMAs and other parties, road maintenance
criteria and techniques, problem identification and solution in a team, dismissal procedures, personal hygiene and first aid, and numeracy;
� Year 2: human rights, gender equality, numeracy; � Year 3: business preparation, health (food, nutrition and female diseases), numeracy (writing
numbers, addition and subtraction, and calculation of household expenditure). � Year 4: small business planning and operations. The Capacity Strengthening Component (CSC), introduced in 2000, provides training to the local Project Management Committees (PMCs) formed to manage the RMC activities. Training deals with issues such as local governance and conflict resolution. To date, 95,097 local government persons have been trained through CSC. UP Secretaries report that training is received enthusiastically by trainees and that trainees are capable of monitoring other road works in the area. Furthermore, key informants report a variety of benefits of training, including: a) helping UP chairmen to prepare annual development plans; b) greater participation of local people; c) increased awareness of responsibilities of UP chairmen and members; d) UP’s now capable of managing other projects like food for work; e) RMC women are more interested to send their children to school. Project officials and UP Secretaries had a number of helpful comments to make on how to improve both the training program and the delivery of RMP.
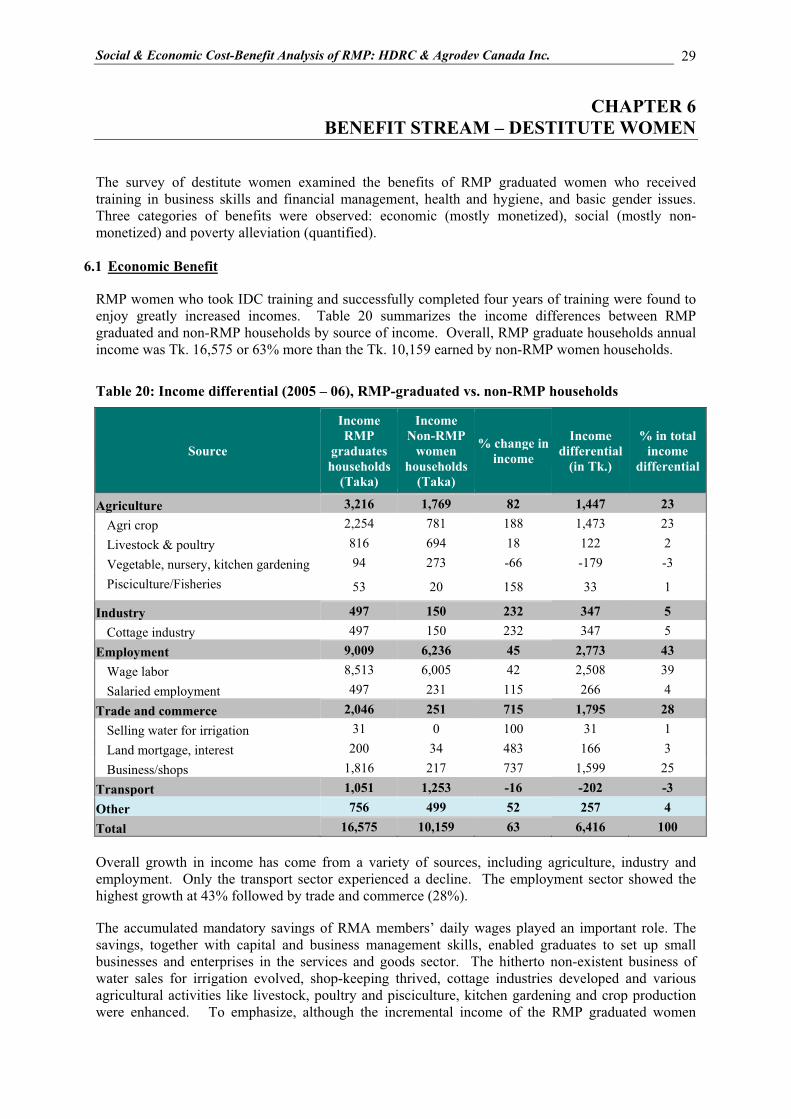
Social & Economic Cost-Benefit Analysis of RMP: HDRC & Agrodev Canada Inc.
29
CHAPTER 6 BENEFIT STREAM – DESTITUTE WOMEN
The survey of destitute women examined the benefits of RMP graduated women who received training in business skills and financial management, health and hygiene, and basic gender issues. Three categories of benefits were observed: economic (mostly monetized), social (mostly non-monetized) and poverty alleviation (quantified).
6.1 Economic Benefit
RMP women who took IDC training and successfully completed four years of training were found to enjoy greatly increased incomes. Table 20 summarizes the income differences between RMP graduated and non-RMP households by source of income. Overall, RMP graduate households annual income was Tk. 16,575 or 63% more than the Tk. 10,159 earned by non-RMP women households.
Table 20: Income differential (2005 – 06), RMP-graduated vs. non-RMP households
Source
Income RMP
graduates households
(Taka)
Income Non-RMP
women households
(Taka)
% change in income
Income differential
(in Tk.)
% in total income
differential
Agriculture 3,216 1,769 82 1,447 23 Agri crop 2,254 781 188 1,473 23 Livestock & poultry 816 694 18 122 2 Vegetable, nursery, kitchen gardening 94 273 -66 -179 -3 Pisciculture/Fisheries 53 20 158 33 1
Industry 497 150 232 347 5 Cottage industry 497 150 232 347 5
Employment 9,009 6,236 45 2,773 43 Wage labor 8,513 6,005 42 2,508 39 Salaried employment 497 231 115 266 4
Trade and commerce 2,046 251 715 1,795 28 Selling water for irrigation 31 0 100 31 1 Land mortgage, interest 200 34 483 166 3 Business/shops 1,816 217 737 1,599 25
Transport 1,051 1,253 -16 -202 -3 Other 756 499 52 257 4 Total 16,575 10,159 63 6,416 100 Overall growth in income has come from a variety of sources, including agriculture, industry and employment. Only the transport sector experienced a decline. The employment sector showed the highest growth at 43% followed by trade and commerce (28%). The accumulated mandatory savings of RMA members’ daily wages played an important role. The savings, together with capital and business management skills, enabled graduates to set up small businesses and enterprises in the services and goods sector. The hitherto non-existent business of water sales for irrigation evolved, shop-keeping thrived, cottage industries developed and various agricultural activities like livestock, poultry and pisciculture, kitchen gardening and crop production were enhanced. To emphasize, although the incremental income of the RMP graduated women
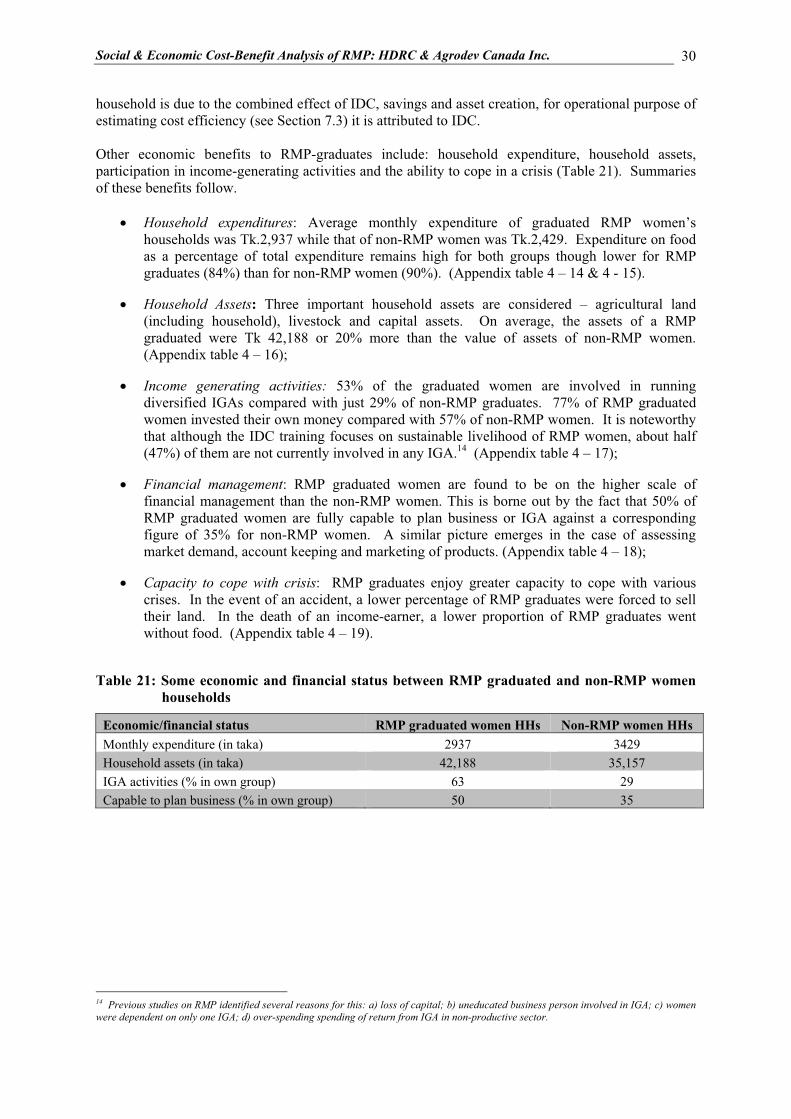
Social & Economic Cost-Benefit Analysis of RMP: HDRC & Agrodev Canada Inc.
30
household is due to the combined effect of IDC, savings and asset creation, for operational purpose of estimating cost efficiency (see Section 7.3) it is attributed to IDC. Other economic benefits to RMP-graduates include: household expenditure, household assets, participation in income-generating activities and the ability to cope in a crisis (Table 21). Summaries of these benefits follow.
� Household expenditures: Average monthly expenditure of graduated RMP women’s households was Tk.2,937 while that of non-RMP women was Tk.2,429. Expenditure on food as a percentage of total expenditure remains high for both groups though lower for RMP graduates (84%) than for non-RMP women (90%). (Appendix table 4 – 14 & 4 - 15).
� Household Assets: Three important household assets are considered – agricultural land (including household), livestock and capital assets. On average, the assets of a RMP graduated were Tk 42,188 or 20% more than the value of assets of non-RMP women. (Appendix table 4 – 16);
� Income generating activities: 53% of the graduated women are involved in running diversified IGAs compared with just 29% of non-RMP graduates. 77% of RMP graduated women invested their own money compared with 57% of non-RMP women. It is noteworthy that although the IDC training focuses on sustainable livelihood of RMP women, about half (47%) of them are not currently involved in any IGA.14 (Appendix table 4 – 17);
� Financial management: RMP graduated women are found to be on the higher scale of financial management than the non-RMP women. This is borne out by the fact that 50% of RMP graduated women are fully capable to plan business or IGA against a corresponding figure of 35% for non-RMP women. A similar picture emerges in the case of assessing market demand, account keeping and marketing of products. (Appendix table 4 – 18);
� Capacity to cope with crisis: RMP graduates enjoy greater capacity to cope with various crises. In the event of an accident, a lower percentage of RMP graduates were forced to sell their land. In the death of an income-earner, a lower proportion of RMP graduates went without food. (Appendix table 4 – 19).
Table 21: Some economic and financial status between RMP graduated and non-RMP women households
Economic/financial status RMP graduated women HHs Non-RMP women HHs Monthly expenditure (in taka) 2937 3429 Household assets (in taka) 42,188 35,157 IGA activities (% in own group) 63 29 Capable to plan business (% in own group) 50 35
14 Previous studies on RMP identified several reasons for this: a) loss of capital; b) uneducated business person involved in IGA; c) women were dependent on only one IGA; d) over-spending spending of return from IGA in non-productive sector.

Social & Economic Cost-Benefit Analysis of RMP: HDRC & Agrodev Canada Inc.
31
6.2 Social and other benefits
A variety of non-monetized social benefits accrue to rural households through RMP (Table 22). These include:
� Empowerment of women: Household membership in local committees or institutions, access to various institutions and civic groups and decision making capability are indicators of empowerment. More graduated RMP women are represented in NGO, CBO and school managing committees than non-RMP women. (Appendix table 4 – 20 & 4 - 21);
� Increased mobility: Access to various institutions, as measured by a mobility coefficient, is higher for RMP graduated women than non-RMP women. Overall, the average mobility coefficient representing access to a wide variety of institutions, civic groups and commercial centers was 0.63 for RMP-graduates vs .50 for non-RMP women. (Appendix table 4 – 22);
� Decision making: While there is little difference in certain kinds of social decision-making between RMP graduates and non-RMP women (e.g., control over daily household shopping; ‘inviting relatives at home; treatment of son/daughter), on some economic decisions such as purchasing land and household assets, the difference is marked. 40% of RMP women are involved in economic decision-making while just 23% of non-RMP are involved. (Appendix table 4 – 23);
� Awareness: Awareness of households is measured in terms of knowledge regarding rights, gender issues, availability of legal aid services, crucial public health issues and knowledge dissemination. It is possible to calculate a “knowledge co-efficient” of rights, gender issues, and legal aid services. This coefficient is 0.86 for RMP and 0.76 for non-RMP women. Among the indicators, the coefficient is highest for knowledge about ‘acid throwing as a punishable criminal offense’ (0.82), followed by ‘equality of men and women in terms of employment, wage’ (0.80), ‘equal rights of men and women to vote and participate in election’ (0.80). Crucial public health issues include: ARI, child vaccination, ANC, PNC, arsenic in drinking water, night blindness and use of sanitary latrine. In all issues the knowledge level of RMP women was better than non-RMP. Here the “knowledge coefficient” is 0.64 for RMP compared to 0.51 for non-RMP. (Appendix table 4 – 24 through 4 - 27);
� Health-seeking behaviour: RMP women households experience about the same number of episodes of illness as non-RMP households; however, they report visiting health centres three times as often. It is difficult to know for sure; however, possibly it is because cost is a barrier to non-RMP women attending health centres as often as is called for. (Appendix table 4 – 28 & 4 - 29);
� Sanitation: RMP women use tubewells in a higher proportion than the non-RMP women. None of the RMP women are using pond/tank/river water. A slightly higher proportion of RMP than non-RMP women reported using hygienic latrine. (Appendix table 4 – 30);
� Dissemination capacity: RMP graduated women disseminate their knowledge on public health, rights, legal aid more compared to non-RMP women. (Appendix table 4 – 31 & 4 - 32).
� Education: Among household members of 5-24 years of age, 79% of RMP women’s households are in different tiers of education: tertiary, secondary, and primary education than non-RMP women. School attendance rates vary by gender. For example, for RMP households, proportion of boys and girls is 35: 37 while for non-RMP households, the rate is 29:25 (Appendix table 4- 33).

Social & Economic Cost-Benefit Analysis of RMP: HDRC & Agrodev Canada Inc.
32
Table 22: Social and psycho-social status of RMP graduated and non-RMP women
Social and psycho-social status RMP graduated women
Non-RMP women
Coped crisis by loan (%) during physical accident during natural disaster
>50 77
33.3 25.0
Empowerment by institutional membership to (%) NGO Union Parishad
20 1.8
1 2
Mobility coefficient 0.63 0.50 Awareness (%)
Knowledge of legal age of daughter’s marriage Knowledge of legal age of boy’s marriage Knowledge that women trafficking is offence Knowledge that child trafficking is offence
75 60 79 78
74 48 67 69
Decision Making: % women in household shopping
63
61
Purchase of assets: % women involved alone
40
24
Sanitation: % household with hygienic latrine
30
24
Dissemination: % disseminate knowledge of gender parity regarding access to resources % disseminate knowledge of gender parity in voting and participating in election
61
70
46
64
Education: % enrolment of HH members (5-24 years)
79
65
6.3 Poverty levels of RMP and non-RMP women
The Direct Calorie Intake (DCI) method was used to investigate the poverty level of RMP graduated and non-RMP women. The cost of a fixed bundle consisting of 17 items7 was considered. Actual calorie intake is compared to the minimal nutritional requirement of 2,122 Kcal/day/person for the absolute poor and 1,805 kcal/day for the hardcore poor. Fewer RMP households (58%) were found to be below the absolute poverty line than non-RMP households (68%) though the proportion of households below the hardcore poverty line was the same at 42%. (Appendix table 4 – 34 through 4 - 36).
7 The items are: rice, wheat, pulses, milk, oil, meat, fish, potato, vegetables, sugar, egg, fruits, puffed rice, spices, salt, and molasses.
Except salt, there is a measurable calorie for each items.

Social & Economic Cost-Benefit Analysis of RMP: HDRC & Agrodev Canada Inc.
33
2003-2004 2004-2005 2005-2006 Total AverageRMC Output: Kms. of Road Maintained 66,629 60,296 64,750 191,675 63,892 # of RMP Crew Recruited 11,000 10,980 8,560 30,540 10,180 IDC Output: # RMP women trained 50,890 53,300 61,560 165,750 55,250 # RMP women trainee days 293,010 308,920 403,000 1,004,930 334,977 CSC Output: # of LG Person trained 21,450 21,780 51,867 95,097 31,699 # of LG trainee days 39,000 39,600 51,867 130,467 43,489
CHAPTER 7 COSTS & OUTPUTS
7.1 RMP Cost by Component
The relevant data on cost for the period of phase III/stage 3 by years (FY 2004 – FY 2006) were supplied by CARE. Local currency costs for different fiscal years have been converted into 2006 prices using BBS deflators. The hard currency exchange rate used was that suggested by CARE. RMP cost records are maintained in five broad operational components.15 Each operational component has sixteen budget/cost line items.16 For the purpose of this analysis, these line items have been put into six groups plus a seventh for the wage costs that are not part of CARE’s records.17,18 Project management costs are allocated between the RMC and IDC components on a 45%:55% basis. The results are summarized in Table 23. (Appendix table 4 – 37 through 4 - 39).
Table 23: Cost of RMP by Component (Tk millions) The average annual RMP cost is about Tk. 1 billion of which 85% is spent on the road maintenance component. 14% of RMP resources are dedicated to “building human and social capital of RMP women” in the income diversification
component. 1% of RMP resources is directed towards enhancing the capacity of the local government institutions in planning and managing development projects at the local level.
7.2 RMP Outputs by Component
RMP III - 3 has maintained annually, on average, around 64,000 km of earthen roads. It has generated sizeable outputs in other areas as well. As Table 24 makes clear, training is an important part of both IDC and CSC with 166,000 IDC trainees and 95,000 CSC trainees.
Table 24: Outputs of RMP by Component
Source: RMP Care-Bangladesh
15 RMC, IDC, Institutionalization, phase-out, and project management 16 Salaries & benefits; project materials & equipment; communication; office accommodation; utilities, maintenance & repair; travel &
lodging; vehicle operating costs; training (staff development); office supplies; furniture, fixtures & equipment; consultants, sundry & miscellaneous; media campaign; counterpart training; vehicle/motorcycle; contingency.
17 The expenses related to wages of RMA women are managed by GoB through RMP Cell of MoLGRDC. At the field level the fund is channeled fortnightly to respective RMA account through the UNO (the upazila RMP cell chairperson). GoB contributes 45%, respective UP contributes 10% and CIDA and EU contributes 45% of the wages (RMP/CARE).
18 The cost of consultants is excluded as it is borne by donors separately when and where necessary. Similarly, the cost of operational phase out component is excluded.
Component FY ‘04 FY ‘05 FY ‘06 Total % RMC 837 901 926 2,665 85 IDC 140 142 161 443 14 CSC 10 15 19 45 1 RMP 988 1,059 1,107 3,153 100
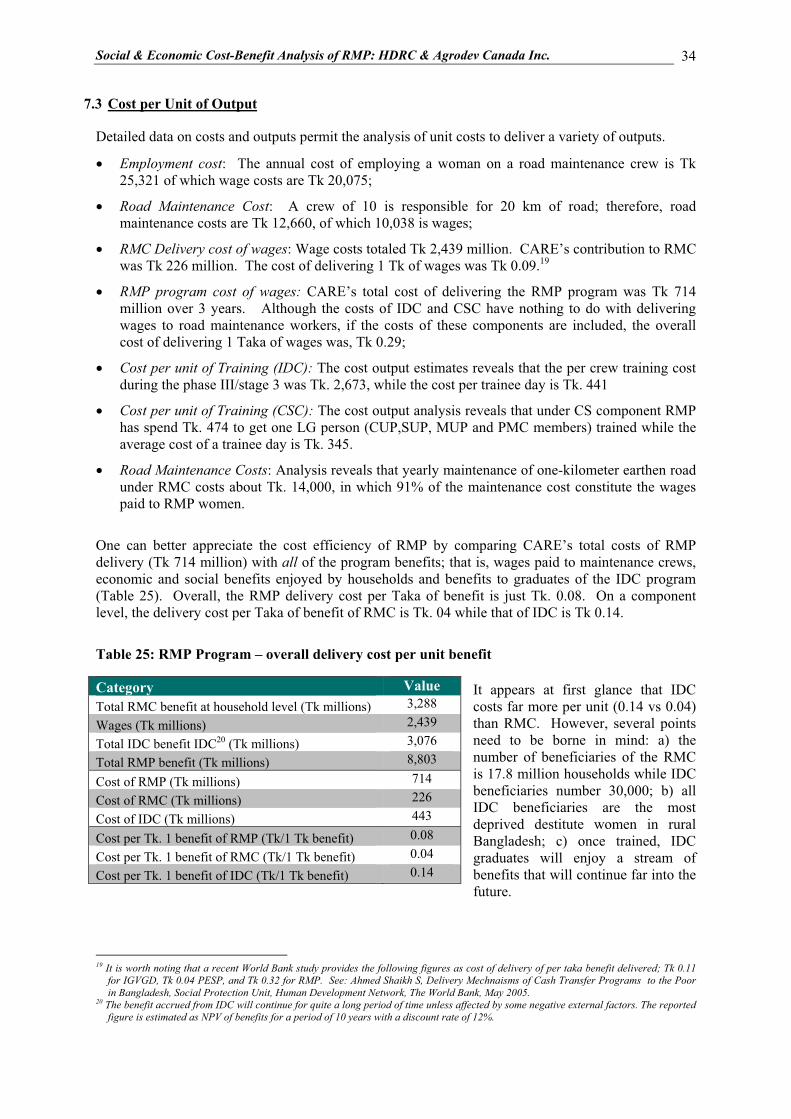
Social & Economic Cost-Benefit Analysis of RMP: HDRC & Agrodev Canada Inc.
34
7.3 Cost per Unit of Output
Detailed data on costs and outputs permit the analysis of unit costs to deliver a variety of outputs.
� Employment cost: The annual cost of employing a woman on a road maintenance crew is Tk 25,321 of which wage costs are Tk 20,075;
� Road Maintenance Cost: A crew of 10 is responsible for 20 km of road; therefore, road maintenance costs are Tk 12,660, of which 10,038 is wages;
� RMC Delivery cost of wages: Wage costs totaled Tk 2,439 million. CARE’s contribution to RMC was Tk 226 million. The cost of delivering 1 Tk of wages was Tk 0.09.19
� RMP program cost of wages: CARE’s total cost of delivering the RMP program was Tk 714 million over 3 years. Although the costs of IDC and CSC have nothing to do with delivering wages to road maintenance workers, if the costs of these components are included, the overall cost of delivering 1 Taka of wages was, Tk 0.29;
� Cost per unit of Training (IDC): The cost output estimates reveals that the per crew training cost during the phase III/stage 3 was Tk. 2,673, while the cost per trainee day is Tk. 441
� Cost per unit of Training (CSC): The cost output analysis reveals that under CS component RMP has spend Tk. 474 to get one LG person (CUP,SUP, MUP and PMC members) trained while the average cost of a trainee day is Tk. 345.
� Road Maintenance Costs: Analysis reveals that yearly maintenance of one-kilometer earthen road under RMC costs about Tk. 14,000, in which 91% of the maintenance cost constitute the wages paid to RMP women.
One can better appreciate the cost efficiency of RMP by comparing CARE’s total costs of RMP delivery (Tk 714 million) with all of the program benefits; that is, wages paid to maintenance crews, economic and social benefits enjoyed by households and benefits to graduates of the IDC program (Table 25). Overall, the RMP delivery cost per Taka of benefit is just Tk. 0.08. On a component level, the delivery cost per Taka of benefit of RMC is Tk. 04 while that of IDC is Tk 0.14.
Table 25: RMP Program – overall delivery cost per unit benefit
It appears at first glance that IDC costs far more per unit (0.14 vs 0.04) than RMC. However, several points need to be borne in mind: a) the number of beneficiaries of the RMC is 17.8 million households while IDC beneficiaries number 30,000; b) all IDC beneficiaries are the most deprived destitute women in rural Bangladesh; c) once trained, IDC graduates will enjoy a stream of benefits that will continue far into the future.
19 It is worth noting that a recent World Bank study provides the following figures as cost of delivery of per taka benefit delivered; Tk 0.11
for IGVGD, Tk 0.04 PESP, and Tk 0.32 for RMP. See: Ahmed Shaikh S, Delivery Mechnaisms of Cash Transfer Programs to the Poor in Bangladesh, Social Protection Unit, Human Development Network, The World Bank, May 2005.
20 The benefit accrued from IDC will continue for quite a long period of time unless affected by some negative external factors. The reported figure is estimated as NPV of benefits for a period of 10 years with a discount rate of 12%.
Category Value Total RMC benefit at household level (Tk millions) 3,288
Wages (Tk millions) 2,439
Total IDC benefit IDC20 (Tk millions) 3,076
Total RMP benefit (Tk millions) 8,803
Cost of RMP (Tk millions) 714
Cost of RMC (Tk millions) 226
Cost of IDC (Tk millions) 443
Cost per Tk. 1 benefit of RMP (Tk/1 Tk benefit) 0.08
Cost per Tk. 1 benefit of RMC (Tk/1 Tk benefit) 0.04
Cost per Tk. 1 benefit of IDC (Tk/1 Tk benefit) 0.14

Social & Economic Cost-Benefit Analysis of RMP: HDRC & Agrodev Canada Inc.
35
Economic Benefit Tk/hh 2,874 Education Benefit Tk/hh 251Health Benefit Tk/hh 46Total HH Benefit Tk/hh 3,171 Conversion to Annual Maintenance BenefitMaintenance as % Capital Cost % 3.9%Residual Benefit Factor number 2.00 Annual HH Benefit - RMP Road MaintenanceEconomic Benefit Tk/hh 55.7 Education Benefit Tk/hh 4.9 Health Benefit Tk/hh 0.9 Annual HH Maintenance Benefit Tk/hh 61.5
CHAPTER 8 ECONOMIC ANALYSIS
The economic analysis consists of two parts: a) a retrospective look at the last three fiscal years of the RMP using actual data on costs and benefits already accrued; and b) a look into the future possibilities of RMP after its hand-over to the GoB.
8.1 A Look Back
8.1.1 Cost of Phase III – 3:
CARE has supplied data on actual costs for three project components for three years. These costs have been expressed in 2006 Taka to make the numbers comparable (Table 26).
Table 26: Summary of Cost of RMP by component, Taka millions
CARE Wages (GoB) Total RMC 226 2,439 2,665 IDC 443 - 443 CSC 45 - 45 Total 714 2,439 3,153 Source: CARE records; expressed in 2006 Taka, millions Of a total Phase III – 3 cost of Tk. 3,153 million, wages paid by GoB to destitute women as part of the Road Maintenance Component represent 77% of the total. CARE’s collective contribution for all three components is Tk. 714 million or 23% of the total.
8.1.2 Benefits
Among the key outputs of the household and destitute women surveys were data on economic and social benefits to households from RMP roads. Respondent households reported a total economic (e.g., income) and social (e.g., education; health) benefits of Tk. 3,175. However, this benefit accrues from both the construction and maintenance of the roads. Also, it is a multi-year benefit; that is, some residual benefit will be enjoyed for a three year period even if maintenance should stop.
Table 27: Annual Road Maintenance Benefit
In Table 27, total benefit is converted to a maintenance benefit using data on road maintenance costs as a percentage of capital costs (3.9%). It is converted to an annual benefit by removing residual benefits that endure, on average 3 years. Converted to an annual road maintenance benefit, the economic and social benefit is Tk 61.5 per RMP household.

Social & Economic Cost-Benefit Analysis of RMP: HDRC & Agrodev Canada Inc.
36
Size of Group Benefit Unit Benefit Total BenefitBeneficiary Group (# persons) Units (Taka) (Taka, millions)Women in Program - wages (1), (2) 41,250 wages/person 14,600 602 Destitue Women in Program - savings (3) 41,250 mandatory savings 5,110 211 Local Government Officials in Program 95,000 government traineesDestitute Women Graduates 170,000 annual benefit/HH 6,414.0 1,090 General community (4) 89,131,197 annual benefit/HH 12.3 1,096
89,437,447 3,000 (1) wage per year per crew member 14,600 (2) average # women in program each year 41,250 (3) savings per year 5,110 (4) number of persons per household 5.0
non-monetized
8.1.3 Benefits & Beneficiaries
The main beneficiary groups of Phase III – 3 of RMP include: � Destitute women currently in the program who receive wages (RMC) and training (IDC); � Destitute women currently in the program for whom savings are accumulated (RMC); � Local government officials who receive training (CSC); � Destitute women who are graduates of the program; and � The community at large.
It is illuminating to compare the various beneficiary groups (Table 28). Observations include:
Table 28: Household Benefits - comparison of beneficiary groups
� Wages paid: for FY ’04 – FY ‘6, there were on average 41,250 destitute women in the
program each year. Each woman received Tk 40/day as take-home pay, or Tk 14,600/year. 21 Depending on which year of the program she was in, a particular participant could receive as much as Tk 43,800 in 3 years;
� Obligatory Savings: Savings were made on behalf of 41,250 destitute women each year for 3 years. At Tk. 14/day, annual savings equaled Tk. 5,110/person.22 Depending on the year of the program, a particular participant could benefit from total savings of up to Tk 15,330 in 3 years;
� Local Government Officials: 95,000 local government officials benefited from training during the program. The unit value of the training as well as the total, are non-monetized;
� Graduates: about 30,000 destitute women graduated during the 3 year period under examination. Added to approximately 140,000 RMP graduates, the cumulative number of RMP graduates as of the end of FY ’06 was 170,000. On average, the income of a RMP graduate was Tk 6,414 greater than that of a non-RMP graduate;
� General Community: Households in the general community enjoy an annual benefit due to the maintenance of RMP roads of Tk 61.5/household. While low individually, it is enjoyed by 17.8 million households, or, at 5 persons/household, by approximately 89 million people.
Individually, direct beneficiaries who are active in road maintenance enjoy an annual wage of Tk 14,600 plus obligatory savings of Tk 5,110 but only as long as they are in the program. These annual benefits end with graduation from the program. On the other hand, graduates of the program enjoy a stream of annual benefits compared to non-RMP women. This annual benefit to a graduate of the 21 Annual wage does not equal incremental benefit because the wage a destitue woman would earn outside the program, approximately Tk 10,500 would have to be subtracted from it. Inremental benefit would be about Tk 4,000/year. 22 Annual obligatory savings may equal incremental benefit from savings because it is highly likely that non-RMP women have no savings.
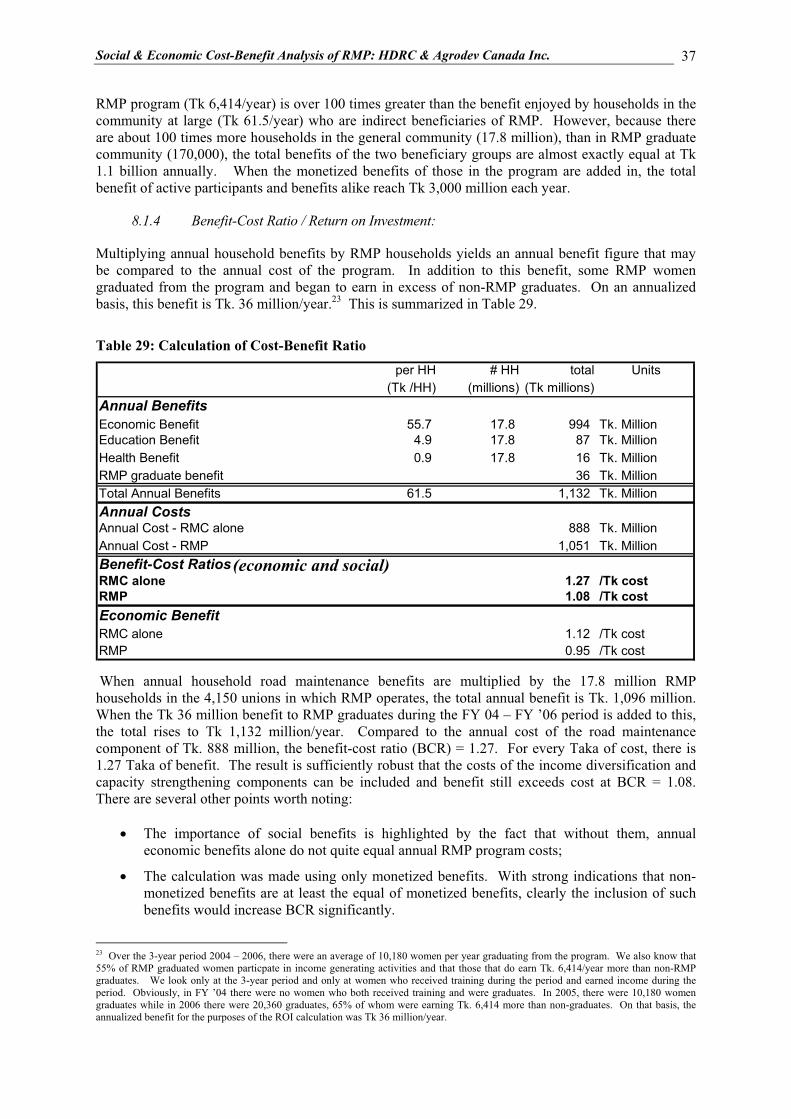
Social & Economic Cost-Benefit Analysis of RMP: HDRC & Agrodev Canada Inc.
37
per HH # HH total Units(Tk /HH) (millions) (Tk millions)
Annual BenefitsEconomic Benefit 55.7 17.8 994 Tk. MillionEducation Benefit 4.9 17.8 87 Tk. MillionHealth Benefit 0.9 17.8 16 Tk. MillionRMP graduate benefit 36 Tk. MillionTotal Annual Benefits 61.5 1,132 Tk. MillionAnnual CostsAnnual Cost - RMC alone 888 Tk. MillionAnnual Cost - RMP 1,051 Tk. MillionBenefit-Cost RatiosRMC alone 1.27 /Tk costRMP 1.08 /Tk costEconomic BenefitRMC alone 1.12 /Tk costRMP 0.95 /Tk cost
RMP program (Tk 6,414/year) is over 100 times greater than the benefit enjoyed by households in the community at large (Tk 61.5/year) who are indirect beneficiaries of RMP. However, because there are about 100 times more households in the general community (17.8 million), than in RMP graduate community (170,000), the total benefits of the two beneficiary groups are almost exactly equal at Tk 1.1 billion annually. When the monetized benefits of those in the program are added in, the total benefit of active participants and benefits alike reach Tk 3,000 million each year.
8.1.4 Benefit-Cost Ratio / Return on Investment:
Multiplying annual household benefits by RMP households yields an annual benefit figure that may be compared to the annual cost of the program. In addition to this benefit, some RMP women graduated from the program and began to earn in excess of non-RMP graduates. On an annualized basis, this benefit is Tk. 36 million/year.23 This is summarized in Table 29.
Table 29: Calculation of Cost-Benefit Ratio
When annual household road maintenance benefits are multiplied by the 17.8 million RMP households in the 4,150 unions in which RMP operates, the total annual benefit is Tk. 1,096 million. When the Tk 36 million benefit to RMP graduates during the FY 04 – FY ’06 period is added to this, the total rises to Tk 1,132 million/year. Compared to the annual cost of the road maintenance component of Tk. 888 million, the benefit-cost ratio (BCR) = 1.27. For every Taka of cost, there is 1.27 Taka of benefit. The result is sufficiently robust that the costs of the income diversification and capacity strengthening components can be included and benefit still exceeds cost at BCR = 1.08. There are several other points worth noting:
� The importance of social benefits is highlighted by the fact that without them, annual economic benefits alone do not quite equal annual RMP program costs;
� The calculation was made using only monetized benefits. With strong indications that non-monetized benefits are at least the equal of monetized benefits, clearly the inclusion of such benefits would increase BCR significantly.
23 Over the 3-year period 2004 – 2006, there were an average of 10,180 women per year graduating from the program. We also know that 55% of RMP graduated women particpate in income generating activities and that those that do earn Tk. 6,414/year more than non-RMP graduates. We look only at the 3-year period and only at women who received training during the period and earned income during the period. Obviously, in FY ’04 there were no women who both received training and were graduates. In 2005, there were 10,180 women graduates while in 2006 there were 20,360 graduates, 65% of whom were earning Tk. 6,414 more than non-graduates. On that basis, the annualized benefit for the purposes of the ROI calculation was Tk 36 million/year.
(economic and social)
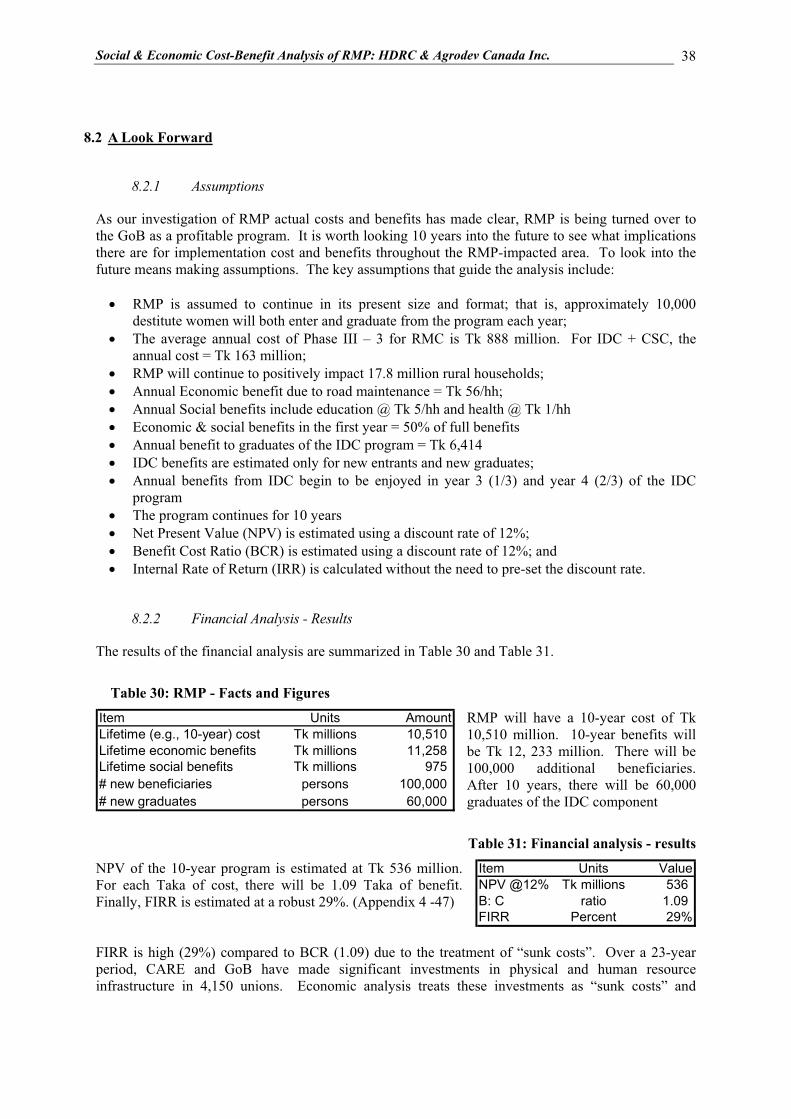
Social & Economic Cost-Benefit Analysis of RMP: HDRC & Agrodev Canada Inc.
38
Item Units AmountLifetime (e.g., 10-year) cost Tk millions 10,510 Lifetime economic benefits Tk millions 11,258 Lifetime social benefits Tk millions 975 # new beneficiaries persons 100,000 # new graduates persons 60,000
Item Units ValueNPV @12% Tk millions 536 B: C ratio 1.09 FIRR Percent 29%
8.2 A Look Forward
8.2.1 Assumptions
As our investigation of RMP actual costs and benefits has made clear, RMP is being turned over to the GoB as a profitable program. It is worth looking 10 years into the future to see what implications there are for implementation cost and benefits throughout the RMP-impacted area. To look into the future means making assumptions. The key assumptions that guide the analysis include: � RMP is assumed to continue in its present size and format; that is, approximately 10,000
destitute women will both enter and graduate from the program each year; � The average annual cost of Phase III – 3 for RMC is Tk 888 million. For IDC + CSC, the
annual cost = Tk 163 million; � RMP will continue to positively impact 17.8 million rural households; � Annual Economic benefit due to road maintenance = Tk 56/hh; � Annual Social benefits include education @ Tk 5/hh and health @ Tk 1/hh � Economic & social benefits in the first year = 50% of full benefits � Annual benefit to graduates of the IDC program = Tk 6,414 � IDC benefits are estimated only for new entrants and new graduates; � Annual benefits from IDC begin to be enjoyed in year 3 (1/3) and year 4 (2/3) of the IDC
program � The program continues for 10 years � Net Present Value (NPV) is estimated using a discount rate of 12%; � Benefit Cost Ratio (BCR) is estimated using a discount rate of 12%; and � Internal Rate of Return (IRR) is calculated without the need to pre-set the discount rate.
8.2.2 Financial Analysis - Results
The results of the financial analysis are summarized in Table 30 and Table 31.
Table 30: RMP - Facts and Figures
RMP will have a 10-year cost of Tk 10,510 million. 10-year benefits will be Tk 12, 233 million. There will be 100,000 additional beneficiaries. After 10 years, there will be 60,000 graduates of the IDC component
Table 31: Financial analysis - results
NPV of the 10-year program is estimated at Tk 536 million. For each Taka of cost, there will be 1.09 Taka of benefit. Finally, FIRR is estimated at a robust 29%. (Appendix 4 -47) FIRR is high (29%) compared to BCR (1.09) due to the treatment of “sunk costs”. Over a 23-year period, CARE and GoB have made significant investments in physical and human resource infrastructure in 4,150 unions. Economic analysis treats these investments as “sunk costs” and
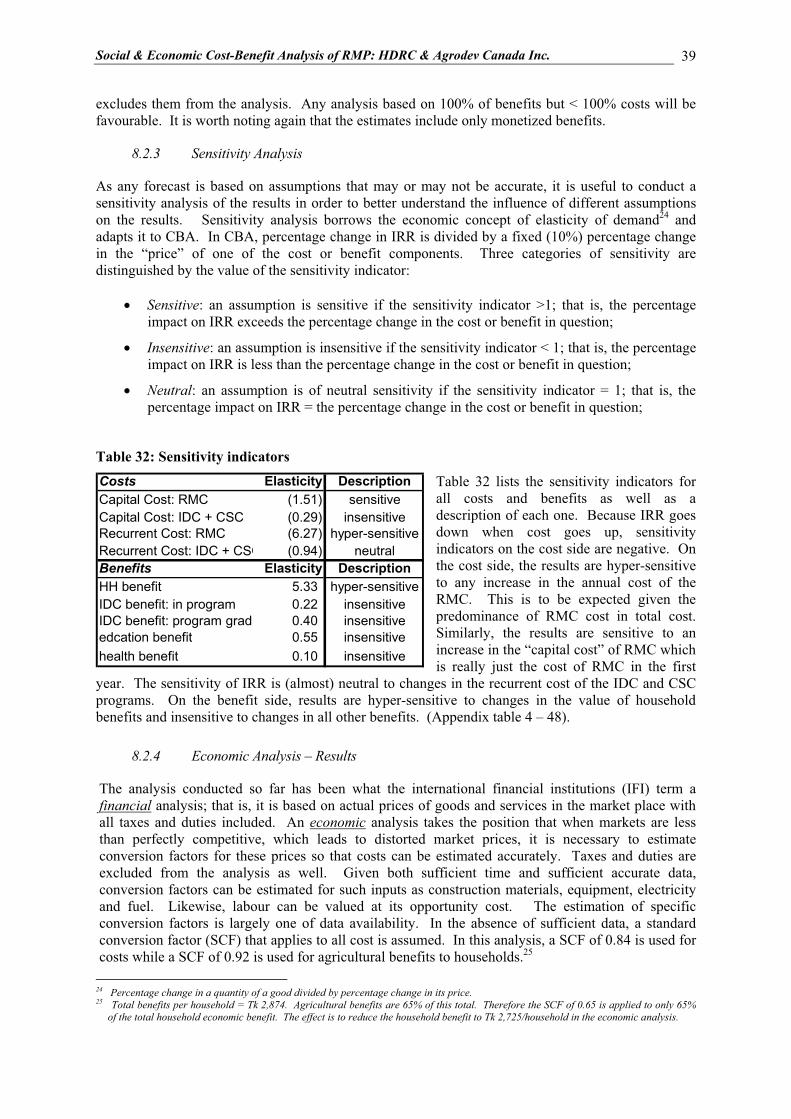
Social & Economic Cost-Benefit Analysis of RMP: HDRC & Agrodev Canada Inc.
39
Costs Elasticity DescriptionCapital Cost: RMC (1.51) sensitiveCapital Cost: IDC + CSC (0.29) insensitiveRecurrent Cost: RMC (6.27) hyper-sensitiveRecurrent Cost: IDC + CSC (0.94) neutralBenefits Elasticity DescriptionHH benefit 5.33 hyper-sensitiveIDC benefit: in program 0.22 insensitiveIDC benefit: program grad 0.40 insensitiveedcation benefit 0.55 insensitivehealth benefit 0.10 insensitive
excludes them from the analysis. Any analysis based on 100% of benefits but < 100% costs will be favourable. It is worth noting again that the estimates include only monetized benefits.
8.2.3 Sensitivity Analysis
As any forecast is based on assumptions that may or may not be accurate, it is useful to conduct a sensitivity analysis of the results in order to better understand the influence of different assumptions on the results. Sensitivity analysis borrows the economic concept of elasticity of demand24 and adapts it to CBA. In CBA, percentage change in IRR is divided by a fixed (10%) percentage change in the “price” of one of the cost or benefit components. Three categories of sensitivity are distinguished by the value of the sensitivity indicator:
� Sensitive: an assumption is sensitive if the sensitivity indicator >1; that is, the percentage impact on IRR exceeds the percentage change in the cost or benefit in question;
� Insensitive: an assumption is insensitive if the sensitivity indicator < 1; that is, the percentage impact on IRR is less than the percentage change in the cost or benefit in question;
� Neutral: an assumption is of neutral sensitivity if the sensitivity indicator = 1; that is, the percentage impact on IRR = the percentage change in the cost or benefit in question;
Table 32: Sensitivity indicators
Table 32 lists the sensitivity indicators for all costs and benefits as well as a description of each one. Because IRR goes down when cost goes up, sensitivity indicators on the cost side are negative. On the cost side, the results are hyper-sensitive to any increase in the annual cost of the RMC. This is to be expected given the predominance of RMC cost in total cost. Similarly, the results are sensitive to an increase in the “capital cost” of RMC which is really just the cost of RMC in the first
year. The sensitivity of IRR is (almost) neutral to changes in the recurrent cost of the IDC and CSC programs. On the benefit side, results are hyper-sensitive to changes in the value of household benefits and insensitive to changes in all other benefits. (Appendix table 4 – 48).
8.2.4 Economic Analysis – Results
The analysis conducted so far has been what the international financial institutions (IFI) term a financial analysis; that is, it is based on actual prices of goods and services in the market place with all taxes and duties included. An economic analysis takes the position that when markets are less than perfectly competitive, which leads to distorted market prices, it is necessary to estimate conversion factors for these prices so that costs can be estimated accurately. Taxes and duties are excluded from the analysis as well. Given both sufficient time and sufficient accurate data, conversion factors can be estimated for such inputs as construction materials, equipment, electricity and fuel. Likewise, labour can be valued at its opportunity cost. The estimation of specific conversion factors is largely one of data availability. In the absence of sufficient data, a standard conversion factor (SCF) that applies to all cost is assumed. In this analysis, a SCF of 0.84 is used for costs while a SCF of 0.92 is used for agricultural benefits to households.25 24 Percentage change in a quantity of a good divided by percentage change in its price. 25 Total benefits per household = Tk 2,874. Agricultural benefits are 65% of this total. Therefore the SCF of 0.65 is applied to only 65%
of the total household economic benefit. The effect is to reduce the household benefit to Tk 2,725/household in the economic analysis.

Social & Economic Cost-Benefit Analysis of RMP: HDRC & Agrodev Canada Inc.
40
97% 134%264%
579%
949%
28%
0%200%400%600%800%
1000%
0% 25% 33% 50% 67% 75%
Non-monetized benefits as % of monetized benefits
FIR
R in
%
Financial Internal Rate of Return (FIRR)
Item Units ValueNPV @12% Tk millions 1,217 B: C ratio 1.24 EIRR Percent 62%
Table 33: Economic analysis - results
Table 33 summarizes the results. Compared to the financial analysis (Table 31), NPV more than doubles to Tk 1,217 million, BCR increases from 1.09 to 1.24 while EIRR is 62% compared to FIRR = 29%. (Appendix 4 – 49).
8.2.5 What if non-monetized benefits could be monetized? A working example
The sheer number and variety of benefits of road maintenance that accrued to rural families was one of the more striking findings of the household survey. Prior to the field exercise, it would have been virtually impossible to even identify a list of benefits of road maintenance that inlcuded such surprises as: anxieties in sending children to school have reduced; the incidence of death of pregnant women has reduced; now people from far away come to us for matrimonial purposes; women can walk through roads using high-heel shoes; and the bride/bridegroom now travel by motorized transport (not by foot). It is evident from a review of the 28 non-monetized benefits, that monetizing such benefits is beyond the scope of economics. How does one put a value on a mother’s peace of mind? Or on self-esteem? Or satisfaction? Or, for that mater, on human life? Still, not only do the number of non-monetized benefits equal the number of monetized benefits, there are indicators that rural people in the 4,150 unions in which RMP operates feel that these non-monetized are equal in value to monetized benefits. One thing is sure: as Figure 4 made clear, a high percentage of households reported that they enjoyed these non-monetized benefits. While an economist would not be able to defend whatever price he might assign to one of these benefits, it nevertheless is an interesting exercise to examine the “what if” scenario. What if non-monetized benefits as a group were equal to (or ¼ of, or ½ of, or ¾ of) monetized benefits as a group? What would the impact be in IRR? The results of this “working example” are illustrated in Figure 13. FIRR rises quickly when non-monetized benefits receive a value. At only 25% of the value of monetized benefits, FIRR jumps from 28% to 97%.
Figure 13: Working example - non-monetized benefits as a percentage of monetized benefits
At ½ the value of monetized benefits, FIRR jumps to 264% and at ¾ the value of monetized benefits, FIRR jumps to 949%. FIRR was too high to calculate when non-monetized benefits = monetized benefits. (Appendix 4 – 50). Admittedly, this exercise is only a “working example” that
cannot stand up to rigorous economic scrutiny. Still, it remains instructive. What it demonstrates is that the monetization of non-monetized benefits will have a huge positive impact on IRR. This should send a message to policy-makers about the importance of a major economic effort to estimate such benefits so that the real impact of a poverty alleviation initiative such as RMP can be understood and the program not just sustained in its current format but enhanced.

Social & Economic Cost-Benefit Analysis of RMP: HDRC & Agrodev Canada Inc.
41
CHAPTER 9 KEY FINDINGS & RECOMMENDATIONS
9.1 Key Findings
Benefit Stream of RMP – Stock & Flow of Traffic � Growth in the stock and flow of non-motorized and motorized vehicles has been significant with
163% and 102% respectively. Traffic flow in respect of non-motorized and motorized vehicles is remarkable about 657 and 100 per day respectively on the RMP road. Not all of the growth may be attributed to RMP roads; however, much of it can.
� Large motorized vehicles (e.g., jeeps, micro-buses, truck) not found in the union stock also use RMP road. RMP roads serve more rural households than do other roads. RMP roads are central to most social, economic and cultural activities of rural households.
Benefit Stream – Household Level � Rural households have mentioned as many as 43 benefits of RMP road. Broadly, 72% of all
households enjoy health and hygiene benefits from RMP road, followed by psycho-social benefits (70%), transport and communication benefits (59%), education benefits (58.5%), labour market benefits (43%), goods sector benefits (37.5%), trade and commerce benefits (30%).
� Among 43 benefits mentioned by the household members 27 are monetized. However, when all 57 benefits were taken into account (including for IDC and CSC) 29 were monetized. Compared to the monetized benefits the non-monetized benefits ones are at least equal in number and importance to households.
� The incremental net income benefit per household attributable to the use of RMP road is Tk.2,874 (including both construction and maintenance). Most of the incremental benefit from RMP roads is associated with agriculture sector (65%).
� RMP played a major role in providing faster transport resulting in time savings and expenditure savings. School/college enrollment and attendance increased due to RMP road. Expenditure savings/household/year due to use of RMP road for education and health are Tk. 251 and Tk. 46 respectively. Nationwide the estimated savings are Tk. 4,450 million and Tk. 882 million respectively.
� RMP roads play an important role in the development of trade and commerce in the locality.
� Various trainings imparted through RMP have increased the income capability among destitute women, monitoring capability among local leaders, and awareness on health, education and other social and economic issues in the community.
Benefit Stream – Destitute Women � The income diversification component (IDC of RMP) coupled with savings from crew wages
contributed significant to the income benefit of Tk.6,416 per graduated women household.
� IDC contributed to the poverty reduction of the beneficiaries – absolute poverty among graduated RMP household is 11% point less than that among their counterpart non-RMP destitute women households.
� Non-monetized IDC benefits are atleast equal in importance to monetized benefits from IDC.

Social & Economic Cost-Benefit Analysis of RMP: HDRC & Agrodev Canada Inc.
42
� The IDC component has contributed individual benefits to the RMP graduated woman such as, empowerment, awareness and social rights in health and education. Moreover, it has raised their dissemination capacity of the knowledge accrued from the IDC training.
Costs and Outputs � The annual maintenance cost of one-km earthen road under RMP is about Taka 14,000 including
91% wages.
� The annual cost of IDC training per crew is Taka 2,700. RMP invests Taka 11,000/woman over a 4-year period through 9 sessions and 29 training days.
� The cost of CSC training of local government persons is Tk 475/person.
� To generate one-Taka benefit RMP costs Tk. 0.08, RMC costs Tk. 0.04 and IDC costs Tk. 0.14. Therefore, RMP as a whole and by program components is sufficiently cost efficient by any standard.
Economic Analysis � The return-on-investment (ROI) to RMC is robust, generating more benefit than cost. ROI = 1.27
(e.g., Tk.1.24 benefit/1 Tk. cost). Overall, ROI = 1.08 for the entire RMP program indicating that RMP including RMC, IDC and CSC is cost efficient;
� A “working example” demonstrated that the impact of non-monetized benefits on FIRR was significant. RMP benefits greatly from the inclusion of non-monetized benefits associated with the income diversification and capacity strengthening components;
� On the assumption that RMP continues in its present form for 10 years after being handed over to GoB, CBA confirms that RMP is a profitable and sustainable programme;
� Unsurprisingly, sensitivity analysis confirms that results are very sensitive to changes in RMC costs (though not IDC and CSC costs) as well as household (though not education and health) benefits;
� An economic analysis conducted using a standard conversion factor of 0.9 to allow for input price distortions resulted in an EIRR (62%) that was approximately double FIRR (29%); thereby confirming that the benefits to society at-large of RMP are significant.
9.2 Recommendations
Based on an in-depth analysis of the key findings, three categories of recommendations are made. Towards the necessity of continuation of RMP � Considering its robust and relatively high economic return, RMP should be continued with all its
program components (road maintenance, income diversification, and capacity strengthening).
� Many benefits of RMC, IDC and CSC are non-monetized (or could not be monetized in the study). The share of such benefits as reported by the beneficiaries is similar to that of the monetized ones. This forms another solid foundation to recommend the continuation of RMP.
� RMP has been instrumental in reducing economic and social poverty (health, education, empowerment) directly among the rural women – the destitute RMP crew members, as well as in reducing poverty among rural people in general (by way of income enhancing and expenditure saving impact of RMP road use). As one of the key poverty reduction strategies in rural Bangladesh, RMP should be continued in the future.
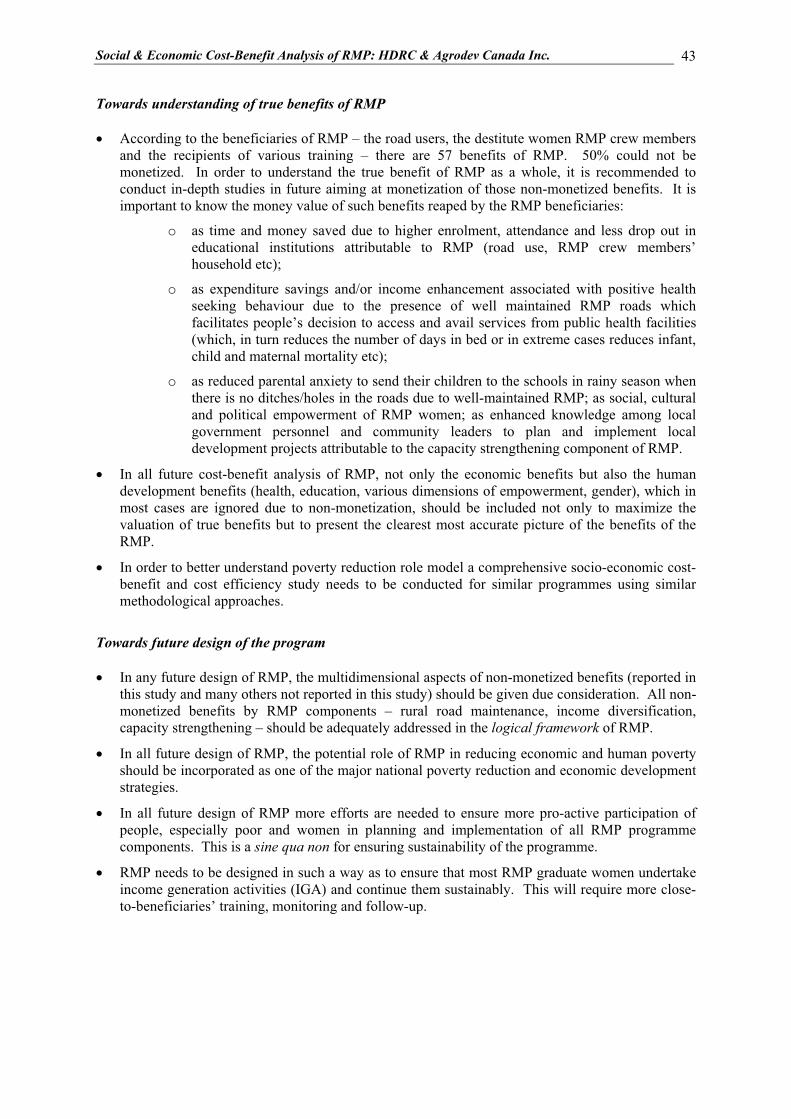
Social & Economic Cost-Benefit Analysis of RMP: HDRC & Agrodev Canada Inc.
43
Towards understanding of true benefits of RMP � According to the beneficiaries of RMP – the road users, the destitute women RMP crew members
and the recipients of various training – there are 57 benefits of RMP. 50% could not be monetized. In order to understand the true benefit of RMP as a whole, it is recommended to conduct in-depth studies in future aiming at monetization of those non-monetized benefits. It is important to know the money value of such benefits reaped by the RMP beneficiaries:
o as time and money saved due to higher enrolment, attendance and less drop out in educational institutions attributable to RMP (road use, RMP crew members’ household etc);
o as expenditure savings and/or income enhancement associated with positive health seeking behaviour due to the presence of well maintained RMP roads which facilitates people’s decision to access and avail services from public health facilities (which, in turn reduces the number of days in bed or in extreme cases reduces infant, child and maternal mortality etc);
o as reduced parental anxiety to send their children to the schools in rainy season when there is no ditches/holes in the roads due to well-maintained RMP; as social, cultural and political empowerment of RMP women; as enhanced knowledge among local government personnel and community leaders to plan and implement local development projects attributable to the capacity strengthening component of RMP.
� In all future cost-benefit analysis of RMP, not only the economic benefits but also the human development benefits (health, education, various dimensions of empowerment, gender), which in most cases are ignored due to non-monetization, should be included not only to maximize the valuation of true benefits but to present the clearest most accurate picture of the benefits of the RMP.
� In order to better understand poverty reduction role model a comprehensive socio-economic cost-benefit and cost efficiency study needs to be conducted for similar programmes using similar methodological approaches.
Towards future design of the program � In any future design of RMP, the multidimensional aspects of non-monetized benefits (reported in
this study and many others not reported in this study) should be given due consideration. All non-monetized benefits by RMP components – rural road maintenance, income diversification, capacity strengthening – should be adequately addressed in the logical framework of RMP.
� In all future design of RMP, the potential role of RMP in reducing economic and human poverty should be incorporated as one of the major national poverty reduction and economic development strategies.
� In all future design of RMP more efforts are needed to ensure more pro-active participation of people, especially poor and women in planning and implementation of all RMP programme components. This is a sine qua non for ensuring sustainability of the programme.
� RMP needs to be designed in such a way as to ensure that most RMP graduate women undertake income generation activities (IGA) and continue them sustainably. This will require more close-to-beneficiaries’ training, monitoring and follow-up.

Social & Economic Cost-Benefit Analysis of RMP: HDRC & Agrodev Canada Inc.
44
References
Ahmed Shaikh S, Delivery Mechnaisms of Cash Transfer Programs to the Poor in Bangladesh, Social Protection Unit, Human Development Network, The World Bank, May 2005.
Barkat A, N Sabina, A Poddar, S Hoque, G Mahiyuddin, M Rahman and M Majid, An Assessment of Livelihood Security of RMP Graduated Women, Human Development Research Centre, August 2005, Care Bangladesh, May 2006.
Barkat A, S Halim, G Mahiyuddin, A Poddar, HM Mohiuddin and S Hoque, A Study on Well-being Status of Graduated RMP Women, Human Development Research Centre, Care – Bangladesh, June 2006.
Barkat A, S Mukkavilli, B Rahman, R Ara, KA Mohib, S Hoque and M Rahman, Impact Assessment of the Capactiy Strengthening Activities of the Rural Maintenance Component of the RMP, Human Development Research Centre, and DevTech Solutions Inc., Care-Bangladesh, 2006.
Cochran William G. Sampling Techniques, Third Edition, Wiley Eastern Limited, New Delhi, 1992.
Ian Smillie, B Cupper, A Hossain, P Nichols, A Schwartz, The Long and Winding Road: An Evaluation of the Bangladesh Rural Maintenance Programme, Final Version, August 1992.
Impact Assessment Study Report on RMP: The Village Profiles, Nacob Consultancy Services, Dhaka, January 1999 (final).
IRT, Income and Livelihood Security Assessment of RMP Ex-Crew Women: IDC 2001 Survey, CARE-BD, May 2000 & July 2001.
Raka Rashid, RMP Income Diversification Pilot Project Evaluation 1994, CARE-Bangladesh, July 1994.
Raka Rashid, RMP Income Diversification Pilot Project Evaluation 1995, CARE-Bangladesh, August 1995.
Study of the Socio-Economic Impact (Household Survey), House of Consultants Ltd. Dhaka, June 1999 (Draft Final).