Embed Size (px)
Citation preview
Research report
Measuring basic skills
for longitudinal study The design and development of instruments for
use with cohort members in the age 34 follow-up
in the 1970 British Cohort Study (BCS70)
Samantha Parsons and John Bynner,
with Vanessa Foudouli
October 2005

Published by the National Research and Development Centre
for Adult Literacy and Numeracy
This document is also available in pdf and text only format from
the NRDC's website, www.nrdc.org.uk
For information on alterative formats, please contact:
Emily Brewer
Marketing and Publications Officer
Institute of Education
University of London
Tel: 020 7947 9501
Email: e.brewer@ ioe.ac.uk
We welcome feedback on the content and accessibility
of this publication. This should be sent to:
Publications
NRDC
Institute of Education
20 Bedford Way
London WC1H 0AL.
Telephone: +44 (0)20 7612 6476
Fax: +44 (0)20 7612 6671
email: [email protected]
ISBN 1-905188-08-0
© Crown Copyright 2005
Extracts from this publication may be used or reproduced for
non-commercial, research, teaching or training purposes on
condition that the source is acknowledged.
NRDC is a consortium of partners led by the Institute of Education,
University of London (see back cover for a list of members) and is
part of the Bedford Group for Lifecourse and Statistical Studies at
the IoE. www.ioe.ac.uk/bedfordgroup
Design: Chapman Design Limited
Print: Bradell

Measuring basic skills for
longitudinal study
Samantha Parsons and John Bynner
CONTENTS
Acknowledgements 8
Peer review 8
Summary 9
1 BACKGROUND TO THE ASSESSMENT 11
1.1 Skills for Life 11
1.2 The case for new assessments 12
1.3 Instrument design 14
1.4 Stucture of the report 14
2 COHORT STUDIES DESIGN OVERVIEW 16
2.1 Introduction 16
2.2 BCS70 in detail 16
2.3 Development of the 2004 survey 17
2.3.1 The Basic Skills Pilot 17
2.3.2 The Parent and Child Survey 18
2.3.3 The dress rehearsal 19
2.4 Coverage 19
3 BASIC SKILLS 21
3.1 Measurements of basic skills in the 2004 survey 21
3.2 Self-reported difficulties 21
3.2.1 Selecting the questions to pilot 22
3.2.2 Feedback from the Basic Skills Pilot 25
3.2.3 Results from the Basic Skills Pilot and dress rehearsal 26
3.3 Literacy and assessment items 29
3.3.1 Previous assessment of basic skills in BCS70 and NCDS 29
3.3.2 The Skills for Life Survey literacy and numeracy assessments 29
3.3.3 Research and design considerations 31
3.3.4 The Basic Skills Pilot: assessment design 31
3.3.5 Aims of the Basic Skills Pilot 32
3.4 Multiple-choice literacy and numeracy assessment items 33
3.4.1 Design of the multiple-choice assessment 35
3.4.2 The Basic Skills Pilot: feedback and results 37
3.4.3 Design of the final multiple-choice assessment 40
3.4.4 Selecting multiple-choice questions for the final assessment 40
3.4.5 Literacy multiple-choice assessment changes 41

3.4.6 Numeracy multiple-choice assessment changes 41
3.4.7 Results from the dress rehearsal 43
3.5 Open-response literacy and numeracy assessment items 44
3.5.1 Selecting the open-response questions 45
3.5.2 Amendments to questions for the Basic Skills Pilot 48
3.5.3 Results from the Basic Skills Pilot 48
3.5.4 Amendments to questions for the dress rehearsal 48
3.5.5 Results from the dress rehearsal 49
3.6 Converting overall performance in literacy and numeracy
assessments into levels 52
3.6.1 For literacy 52
3.6.2 For numeracy 53
3.7 Coverage of the National Curriculum 54
3.7.1 Literacy 54
3.7.2 Numeracy 54
3.8 Handwriting 54
4 DYSLEXIA 56
4.1 Measuring symptoms of dyslexia 56
4.2 The Dyslexia Adult Screening Test (DAST) 56
4.3 Selecting the DAST exercises 57
4.4 Adapting the DAST materials and interviewer instructions 59
4.5 DAST exercises and results from the Basic Skills Pilot and
dress rehearsal 62
4.5.1 Time taken to administer the DAST exercises 62
4.5.2 One-Minute Reading exercise 62
4.5.3 Two-Minute/One-Minute Spelling exercise 64
4.5.4 One-Minute Writing exercise 65
4.5.5 Phonemic Segmentation and Spoonerisms exercise 67
4.5.6 Nonsense Passage Reading exercise 69
5 PARENT AND CHILD INTERVIEW 71
5.1 Assessing the cognitive skills of children: which assessment 71
5.2 Introduction to the British Ability Scales II 73
5.3 Selection of particular subscales 74
5.4 Adapting BAS II for interviwer administration 75
5.5 Interviewer materials 75
5.6 Sample size 76
5.7 General interviewer feedback 76
5.8 Administering BAS II: the Early Years Battery 76
5.8.1 Timing 77
5.8.2 Naming Vocabulary 77
5.8.3 Early Number Concepts 79
5.8.4 Copying 81

5.9 Administering BAS II: the School Age Battery 83
5.9.1 Timing 83
5.9.2 Word Reading 84
5.9.3 Spelling 86
5.9.4 Number Skills 88
5.10 Overview of other components of the Parent and Child Interview 91
5.10.1 Additional interviewer (CAPI) questions 91
5.10.2 Paper self-completions 92
5.10.3 Parent self-completions 92
6 SUMMARY AND CONCLUSIONS 98
6.1 Aims of the assessments 98
6.1.1 Literacy and numeracy 98
6.1.2 Dyslexia 98
6.1.3 Intergenerational comparisons 98
6.2 Operations 99
6.2.1 Self-reported difficulties 100
6.2.2 The adult assessments 100
6.2.3 Dyslexia 101
6.2.4 The child assessments 102
6.3 Overall appraisal 102
REFERENCES 103
APPENDICES 107
Basic Skills appendix 108
Dyslexia appendix 119
Parent and Child appendix 122
FIGURES AND TABLES
Figure 2.1 BCS70 follow-up studies from 1970-2004 17
Table 3.1 Per cent self-reported difficulties in NCDS and BCS70 at
different ages 22
Table 3.2a Reading questions 23
Table 3.2b Writing questions 24
Table 3.2c Maths, numbers and arithmetic questions 25
Table 3.3a Per cent reporting difficulties to the individual
reading questions 26
Table 3.3b Per cent reporting difficulties to the individual
writing questions 26
Table 3.3c Per cent reporting difficulties to the individual
number questions 27
Figure 3.1 Number of reading, writing or number work difficulties
reported in the Basic Skills Pilot and dress rehearsal 28
Figure 3.2 Comparison of previous and new standards 30
Table 3.4 Average time taken for literacy and numeracy assessments 33
Figure 3.3 Example of a drag-and-drop multiple-choice question 35
Figure 3.4a Design of the (pilot) literacy multiple-choice assessment 36
Figure 3.4b Design of the (pilot) numeracy multiple-choice assessment 36
Figure 3.5 Administration of the multiple-choice assessment 36
Figure 3.6a Total literacy score from multiple-choice questions 38
Figure 3.6b Total numeracy score from multiple-choice questions 38
Figure 3.7 Final literacy multiple-choice assessment 41
Figure 3.8 Sequence of difficulty of questions in final
numeracy assessment 42
Figure 3.9a Total literacy score from multiple-choice questions 44
Figure 3.9b Total numeracy score from multiple-choice questions 44
Table 3.5a BCS70 Literacy questions: per cent giving incorrect response
by literacy level 46
Table 3.5b BCS70 Numeracy questions: per cent giving incorrect response
by numeracy level 47
Table 3.6 Comparing per cent incorrect in BCS70 age 21 with 2004
Pilot Study and dress rehearsal 49
Figure 3.10 Comparing per cent incorrect in BCS70 age 21 with per cent
incorrect in 2004 Basic Skills Pilot and dress rehearsal 50
Figure 3.11 Comparing total scores by cohort members for questions in
BCS70 age 21 with 2004 Basic Skills Pilot and dress rehearsal 51
Figure 3.12a ‘Profiles of competence’ based on national standards for adult
literacy: comparison of BCS70 dress rehearsal with National
Baseline Survey results 53
Figure 3.12b ‘Profiles of competence’ based on national standards for adult
numeracy:comparison of BCS70 dress rehearsal with National
Baseline Survey results 54
Figure 3.13 Aspects of the curriculum covered by the numeracy multiple-
choice questions 55
Figure 4.1 DAST attainment and diagnostic measures 57

Figure 4.2 Vinegrad Checklist 59
Figure 4.3 The two examples of marking the DAST One-Minute Reading test
(also used for the Nonsense Passage exercise) 60
Table 4.1 Average time taken to complete the DAST exercises 63
Table 4.2 Results of the One-Minute Reading exercise 64
Figure 4.4 Distribution of scores in the One-Minute Reading exercise 64
Table 4.3 Results of the Two/One-Minute Spelling exercise 65
Figure 4.5 Distribution of Two/One-Minute Spelling scores 66
Table 4.4a Results of the Phonemic segmentation exercise 68
Table 4.4b Results of the Spoonerisms exercise 68
Figure 4.6 Distribution of Spoonerism scores 69
Table 4.5 Results of the Nonsense reading exercise 70
Figure 4.7 Distribution of scores for the nonsense passage exercise 70
Figure 5.1 Selected BAS II subscales 75
Table 5.1 Average time taken to complete scales from the
Early Years Battery 77
Figure 5.2 BAS II Naming Vocabulary Image and CAPI screen 78
Figure 5.3 Early Years Battery: Naming Vocabulary ability scores 79
Figure 5.4 BAS II Early Number Concepts Image and CAPI Screen 80
Figure 5.5 Early Years Battery: Early Number Concepts ability scores 81
Figure 5.6 Example of a completed copying booklet 83
Table 5.2 Average time taken to complete scales from the School
Age Battery 83
Figure 5.7 BAS II Word Reading List 84
Figure 5.8 Ability scores in the School Age Word Reading scale 85
Figure 5.9 Revised BAS Spelling exercise 87
Figure 5.10 Rescaled School Age Spelling scores 88
Figure 5.11 Examples of modified BAS II formats 89
Figure 5.12 Examples of diversity of BAS II Number Skills questions
from each block 90
Figure 5.13 Ability scores in the School Age Number Skills Scale 91
This report is funded by the Department for Education and Skills as part of Skills for
Life: the national strategy for improving adult literacy and numeracy skills. The views
expressed are those of the author(s) and do not necessarily reflect those of the
department.
Research Report8
Acknowledgements
We would like to acknowledge all members of the research team at NatCen involved with the
2004 survey, without whom this report could not have been produced. Our special thanks are
reserved for Carli Lessof, Liz Fuller and Nadine Simmonds whose innovative ideas in the
design of survey instruments and interviewer briefings have shown the way forward. We
would also like to express our gratitude to the NatCen interviewers whose feedback
throughout the development stages was of vital importance to the success of the final design
of all survey instruments. The cohort studies support team, led by Peter Shepherd, played a
vital role in the survey design team, as did Neville Butler, the founder of the 1970 British
Cohort Study (BCS70), whose extensive knowledge and experience of the earlier stages of the
cohort study was critical to its success. The CLS tracing team put in tremendous work to
maximise response rates.
We would also like to acknowledge the earlier support given to the assessment of cohort
members basic skills by The Basic Skills Agency, whose funding over a twelve year
programme of research placed the antecedents and consequences of poor basic skills for
adults firmly on the political and policy making agenda. We give particular thanks to Annabel
Hemstedt and Alan Wells.
Special thanks are also owed to Peter Burke, John Gillespie and Bob Rainbow at the Centre
for Developing and Evaluating Lifelong Learning (CDELL) for their advice and consultation on
the re-design and selection of the items from the Baseline Survey, and to Angela Fawcett for
her guidance on the use of the Dyslexia Adult Screening Test (DAST). We are also grateful to
Richard White at the Department for Education and Skills (DfES) who helpfully commented on
the final report.
We also want to thank the members of the public who willingly took part in the pilot surveys
and, finally, the cohort BCS70 cohort members who took part in the dress rehearsal and main
fieldwork. They freely gave up some of their precious time to take part in our assessments
and to provide us once again with other vital information about their lives. We are particularly
grateful to those who also consented to the involvement of their children.
Peer review
This report was peer reviewed by Professor Steve Reder, Portland State University and
Professor Greg Brooks, University of Sheffield.

Measuring basic skills for longitudinal study 9
Summary
The work here took place against the background of a major new initiative in Britain, both to
understand and to tackle the problem of poor basic skills in a substantial minority of the
population. Concerns were driven by the growing body of international evidence that basic
skills difficulties were a major impediment to successful functioning in modern society, not
least in the UK. This culminated in the work of the Moser Committee, (Moser report (1999), A
fresh start. Improving literacy and numeracy. DfEE), and the government strategy that flowed
from it, Skills for Life.
The 1958 and 1970 British birth cohort studies, longitudinal studies that follow up all babies
born in a single week throughout their lifetime, were an important source of evidence for the
Moser Committee’s enquiry into adult basic skills (literacy and numeracy) that needed
expanding and updating because of the relatively small sub-samples from which the original
basic skills data were collected. The Skills for Life strategy, and the research programme
NRDC set up to support it, offered the opportunity to extend measurement of literacy and
numeracy skills to the whole of one of the birth cohorts – the 1970 cohort at the age of 34, for
which funding was already available for a follow-up in 2004.
The 2004 survey has two main parts: the Core Interview, which every cohort member who
agreed to take part completed, and the Parent and Child Interview, that only selected cohort
members with resident natural or adopted children completed. The Core Interview also
included:
■ the assessment of all BCS70 cohort members’ grasp of literacy and numeracy.
■ a number of exercises to assess the presence of symptoms associated with dyslexia.
■ a standard Computer Assisted Personal Interview (CAPI) and Computer Assisted Self
Interview (CASI) to update the record of cohort members’ lives and to observe their current
situation in respect of education, housing, health, work and family life.
The Parent and Child Interview contained:
■ an additional CAPI section in the personal interview where cohort members answered
questions about the health, care and education experiences of each of their resident natural
or adopted children aged 16 years, 11 months or less.
■ a paper-based self-completion questionnaire, which required cohort members to answer
questions covering parenting styles and the development of each eligible child.
■ the assessment of the cognitive skills of their children between age 3 and 16 years,
11 months.
■ resident natural or adopted children aged between 10 years and 16 years, 11 months inclusive
also completed an additional questionnaire about their activities at home and school, their
attitudes, self-esteem and educational aspirations.
The following chapters set out in detail the steps taken in the design of the NRDC-funded
components of the 34-year-old BCS70 follow-up survey. The account includes the different
piloting stages, the analysis of the data collected and the conclusions leading to final design
decisions. Chapter 1 outlines the standard design protocol for a cohort study follow-up survey
that was employed. Chapter 2 sets out the main design features of the 1970 cohort study and
the different components of the 34-year-old follow-up. Chapter 3 describes the design of the

Research Report10
adult literacy and numeracy assessments, for which two modes of questioning were used:
multiple-choice and open response (interview) mode. The account of the dyslexia
assessments follows in chapter 4. Chapter 5 describes the child assessments and parent
data. Chapter 6 provides an overview and some conclusions.
Each chapter aims to be informative about the work undertaken as an aid to interpretation of
results, particularly for research and policy users of the data, and to supply the key
information needed for others to devise their own instruments for the assessment of basic
skills. In this sense, the report’s major function is as a source book for future users of this
new round of cohort studies basic skills data.
Despite the tight timetable and administrative constraints on the wide range of assessments
to be used in the survey, the goals set for them have been achieved. We now have a battery of
reliable instruments that we know can be effectively administered in people’s homes by
appropriately trained interviewers. The assessments have validity in tapping the core
dimensions of literacy and numeracy at the requisite levels with which the survey is
concerned. We can also assess the presence of dyslexia as a factor in poor reading and on
adult functioning more generally. Reliable children’s assessments of basic skills and broader
cognitive measures spanning a wide age-range are available. Well developed questionnaires
to tap family functioning and child development can be employed to unpack further the family
factors involved in children’s cognitive development and basic skills acquisition.
The prime purposes of the report are to demonstrate ‘fitness for purpose’ of the instruments
to be used in the research undertaken to support the Skills for Life strategy and to supply the
details of design that will be of help in interpreting the research results. The report also
serves in the nature of a source book enabling others to replicate the approach to assessment
design on new samples of adults or children1. Overall, the development work represents a
substantial contribution to the knowledge base on which the success of Skills for Life
ultimately depends.
1. Permission must be sought from nferNelson to use any of the scales from the BAS II detailed.

Measuring basic skills for longitudinal study 11
1 Background to the assessment
1.1 Skills for Life
The British 1958 and 1970 birth cohort studies are longitudinal studies of the British
population followed up from birth through adult life. The National Child Development Study
(NCDS) started with all the 17,000+ births in a single week in 1958 and the 1970 British
Cohort Study (BCS70) started with all 17,000+ births in a single week in 1970. Evidence from
the studies on the extent of, and correlates of, basic skills difficulties in the population
reinforced television-based literacy campaigns of the 1980s2 (continuing on from the very
influential On the Move series which began in 1975), and was a major source of evidence
underpinning the work of the Basic Skills Agency through the 1990s. The Moser Committee,
in their report A Fresh Start, similarly relied heavily on cohort studies evidence in making the
case for major new government initiatives on adult basic skills3. The picture painted of a
population with significant numbers lacking basic functional literacy – up to 20 per cent – and
perhaps twice this proportion unable to function effectively with numeracy, signalled a
national problem that became a top government priority to solve. Impetus was added by
international comparison of basic skills performance through the Organisation for Economic
Cooperation and Development (OECD)’s International Adult Literacy Survey (IALS), suggesting
that Britain was near the bottom of the functional literacy and numeracy league table – 22 per
cent poor literacy compared with 7 per cent in Sweden4. This implied that one in five British
adults had the literacy and numeracy skills that were not much above those expected of an
11-year-old.
The consequence of the literacy and numeracy gap had also been spelt out in the cohort
studies work. Those with functional literacy and numeracy problems were much more likely
to be unemployed or characterised by various kinds of disengagement and poor well-being.
Moreover, their problems typically reflected a stunted educational career related to poor
family circumstances and lack of parental interest in and support for educational progress.
The education system had clearly failed such children who had entered adult life without the
basic competencies and qualifications demanded for effective functioning in a modern
industrialised society. The general conclusions drawn from the cohort studies evidence were:
■ Britain’s economic competitiveness was damaged in comparison with other countries through
its high level of basic skills difficulties;
■ basic skills difficulties were a major factor in adult social exclusion – another key government
concern; and
■ major efforts across the education system were required to ensure that subsequent
generations left education with full basic skills competence.
The Moser Committee prescriptions for improvement concerned the first two of these
challenges. The committee set targets for curtailing the problem among adults, with
reductions by 2010 to half the numbers in the poor literacy and poor numeracy categories, so
2. On the BBC: ‘Switch onto English’, 1984–5, ‘Write Now’, 1985–6, ‘Spelling it Out’, 1987–8, ‘Stepping Up’ and ‘Step Up to
WordPower and NumberPower’, 1989. For Granada/ITV: World in Action documentary ‘Starting at the Bottom’, 1987.
3. Moser Report (1999). A Fresh Start: Improving Literacy and Numeracy. DfEE publication, ref CMBS1.
4. For the report on the survey of adults aged 16–65 in Great Britain, carried out as part of the International Adult Literacy
Survey (IALS) see: Carey, S, Low, S and Hansbro, J (1997). Adult Literacy in Britain. London: The Stationery Office.

Research Report12
that by this date over 90 per cent of the population would be competent in both.
Taking up the challenge, the Department for Education and Skills (DfES) commissioned
research on the savings to the taxpayer of reducing Britain’s basic skills deficit. Again, using
cohort study data, the Institute of Fiscal Studies in collaboration with the Centre for Economic
Performance at the London School of Economics and the Wider Benefits of Learning research
centre at the Institute of Education, University of London estimated that the gain to the
taxpayer would be as much as £2.54 billion if the Moser numeracy target was achieved and
£0.44 billion for the achievement of the literacy target5. This analysis provided a major plank
of the evidence base in support of the Department’s submission to the consolidated spending
review at the time. The outcome was the release of the funding that led to the launch of the
top priority government programme, Skills for Life6.
1.2 The case for new assessments
Despite the extensive use made of the cohort study evidence to support new policies, it had to
be acknowledged that the collection of basics skills performance data in the cohort studies, at
age 21 in the case of BCS70 (1991) and at age 37 in NCDS (1995), was limited to 10 per cent
samples – reflecting the funding available at the time. This limited the scope of analysis quite
significantly with respect to:
■ charting the career pathways of particular groups with basic skills difficulties;
■ investigating the functioning of people with poor skills in different kinds of occupational and
social contexts; and
■ mapping geographical variation.
Apart from analysis limitations, each of the two basic skills assessments had been to a
certain extent ad hoc in conception and use with different test instruments devised
respectively by Cambridge Training and Development Ltd (BCS70 – age 21) and the National
Foundation for Educational Research (NCDS – age 37). Each attempted to map test scores
onto the City and Guilds ‘Wordpower’ and ‘Numberpower’ standards in use at the time (see
chapter 3), but this had only been partially successful. There was therefore a case for the
development of a new test that would make good these deficiencies; i.e. could be
‘benchmarked’ against new national standards and would reflect more faithfully the new core
curriculum for adult basic skills. It should also maintain a degree of comparability with the
earlier sub-sample basic skills assessments.
Accordingly, when the National Research and Development Centre for Adult Literacy and
Numeracy (NRDC) was established in the Institute of Education, University of London (as part
of Skills for Life), a top priority was to use the funding available to carry out a comprehensive
assessment of cohort members’ basic skills in at least one of the cohorts. The availability of
NRDC funding coincided with funding made available by the Economic and Social Research
Council (ESRC) for the planned interview follow-up at age 34 in BCS70 and a telephone
interview survey at age 46 in NCDS. Accordingly, through this it was possible to build in a
basic skills assessment for the whole BCS70 cohort at only a marginal cost to NRDC.
5. Bynner, J, McIntosh, S, Vignoles, A, Derden, L, Reed, H, Van Reenen, J (2001). Improving Adult Basic Skills: benefits to the
individual and society. DfEE Research Report RR251. London: HMSO.
6. DfEE (2001). Skills for Life: The national strategy for improving adult literacy and numeracy skills. Report ref: SFLLN.

Measuring basic skills for longitudinal study 13
The BCS70 follow-up survey also offered other data collection opportunities of major
relevance to the Skills for Life strategy:
■ subjective appraisal of difficulties;
■ writing assessment;
■ dyslexia assessment; and
■ assessment of cohort members’ children.
Until the adoption of objective assessment through specially designed tests in the BCS70 age-
21 survey, previous data on basic skills difficulties had been collected by asking cohort
members directly about them. This was the method used in the 1981 NCDS survey at age 23,
analysis of which was influential in the 1987 World in Action documentary Starting at the
Bottom7. The method was subsequently repeated in the NCDS age-33 and age-42 surveys and
used alongside the objective assessment in the age-37 survey. Subjective assessments were
also included in the BCS70 age-21 and age-30 surveys. Such assessments, which correlate
only weakly with objective measures, are particularly useful in gauging motivation to sign up
for remedial courses. Accordingly, it was also decided to use subjective appraisals in an
improved form for the new BCS70 follow-up.
Samples of cohort members’ writing were collected in the BCS70 age-21 and NCDS age-37
surveys. These required extensive coding and have not been used much in subsequent
research. The new opportunities the NRDC funding offered led to the decision to include a
similar collection of writing samples in the new survey.
Throughout their childhoods, BCS70 cohort members had received regular assessments of
their cognitive skills development, including reading and mathematics. At age 10, they had
also taken a number of sub-tests from the Bangor Dyslexia Test8, specially designed to
measure the reading disorder dyslexia in children (see chapter 4). It was decided to capitalise
on this earlier experience by investigating continuities in dyslexia symptoms and their
consequences from childhood to adulthood by including an assessment of adult dyslexia in
the follow-up survey.
Finally in the follow-up at age 33 in NCDS, one third of cohort members and all their eligible
children took part in a sub-study that included assessments of the children’s cognitive
development using an English adaptation of American tests9. Through funding that became
available to NRDC by a grant from the European Social Fund (ESF), it was possible to include
a similar, though trimmed down, assessment of cohort members’ children in the BCS70
follow-up. This would have the advantage of enabling intergenerational continuities and
discontinuities in basic skills acquisition from parents to children to be investigated. It also
offered opportunities for cross-cohort comparison at comparable ages to identify any changes
in the processes of literacy and numeracy acquisition across the 12 years separating the
births of the two cohorts. For the new surveys, however, it was necessary to increase the
7. Mary Hamilton discussed findings reported in Hamilton, M (1987) Literacy, Numeracy and Adults. London: ALBSU (Adult
Literacy and Basic Skills Unit, now The Basic Skills Agency).
8. Miles, TR, (1982/1997) The Bangor Dyslexia Test. Wisbech, Cambs: Learning Development Aids.
9. Funded through a special grant by the US National Institute for Child Health and Development. Some examples of research
using this data: Verropoulou, G, Joshi, H and Wiggins, R D (2002) ‘Migration, Family Structure and Children’s Well-being: a
Multilevel Analysis of the Second Generation of the 1958 Birth Cohort Study’, Children and Society, vol 16, pp 219–231.
McCulloch, A and Joshi, H (2002). ‘Child Development and Family Resources: an exploration of evidence from the second
generation of the 1958 Birth Cohort’, Journal of Population Economics, vol 15, pp 283–304. McCulloch, A and Joshi, H (2001).
‘Neighbourhood and family influences on the cognitive ability of children in the British National Child Development Study’,
Social Science and Medicine, 53,5, pp 579–591.

Research Report14
sample of cohort members from one third to one half, reflecting the delayed parenting, and
consequently smaller number of children eligible for assessment, in the more recent 1970
cohort10.
1.3 Instrument design
The standard design protocol for a cohort study follow-up survey comprises piloting some or
all parts of the instrumentation on general population samples. The piloting is followed by a
comprehensive ‘dress rehearsal’ pilot survey for testing the whole data collection package on
a representative sample of cohort members before putting the main survey into the field.
Because of the need to develop a new adult literacy and numeracy assessment and assess
the feasibility of the dyslexia assessment, in this case the piloting included a more substantial
developmental stage. A large-scale pilot survey was used, encompassing 177 respondents to
generate enough data for item analysis. The results supplied the basis for finalising the test
design within the context of the preferred survey method, Computer Assisted Personal
Interview (CAPI).
For the child assessments, following an extensive review of alternative standard instruments
for use with children ranging from age 3 through (potentially) to 16, piloting was used (on a
smaller sample) principally to test timings and feasibility in the different field settings in
which the assessment was to be administered. (As in the previous BCS70 adult follow-up at
age 30, all data collection was to take place in cohort members’ homes.) Apart from the
assessment, the cohort member parent (including the cohort member father whenever
possible) supplied much information about each individual child and family life more
generally. The mode of data collection included, written (supplied on paper), and
computer–administered self-completion questionnaires. Children of 10 years and over also
completed a paper self-completion questionnaire about their lives.
The dress rehearsal survey brought all of the different assessment components together with
the cohort member interview. The interview was used to update the picture of the cohort
members’ current situation in relation to employment, family, education, health, social
participation and attitudes and to fill the gap in job and other histories between the present
and the previous follow-up at age 30. It also supplied the opportunity to collect cohort
members’ own assessments of their basic skills difficulties and, at the end of the interview, to
collect samples of their writing.
1.4 Structure of the report
The following chapters set out in detail the steps taken in the design of the NRDC-funded
components of the 34-year-old BCS70 follow-up survey. The account includes the different
piloting stages, the analysis of the data collected and the conclusions leading to final design
decisions. This work was carried out in close collaboration with our colleagues in the National
Centre for Social Research11 who were contracted to undertake the surveys and whose
10. The age at first birth for women in the UK rose from 25.7 in 1991 to 27.1 in 2000. For further details, see Smallwood, S
(2002). ‘New estimates of trends in births by birth order in England and Wales’ Population Trends, 108, pp 32–48.
11. NatCen is the largest independent social research institute in Britain. They have designed, carried out and analysed
research studies in the fields of social and public policy for more than 30 years. For further details, refer to www.natcen.ac.uk
NatCen have carried out a number of the previous surveys of NCDS, BCS70 and MCS (see chapter 2).

Measuring basic skills for longitudinal study 15
professionalism and experience was absolutely vital to the success of the design process.
Interviewer feedback on the difficulties they faced in delivering such complex survey
instruments in the field was also critically important.
Chapter 2 sets out in more detail the main design features of the 1970 cohort study and the
components of the 34 year-old follow-up. Chapter 3 describes the design of the adult literacy
and numeracy assessments, for which two modes of questioning were used: multiple-choice
and open response (interview) mode. The account of the dyslexia assessments follows in
chapter 4. Chapter 5 describes the child assessments and parent data.
Each chapter attempts to be both informative about the work undertaken as an aid to
interpretation, particularly for research and policy users of the data, and to supply the key
information needed for others to devise their own instruments for the assessment of basic
skills. In this sense, the report’s major function is as a source book for future users of this
new round of cohort studies basic skills data.
Research Report16
2 Cohort studies design overview
2.1 Introduction
Britain’s nationwide birth cohort studies follow the same group of people from birth into and
through adulthood giving a picture of whole generations. By following up people from birth, it
is possible to find out how present situations relate to past circumstances and predict future
functioning. Cohort studies are one of the richest resources for the study of human
development, covering all aspects of life and are widely used by government and in academic
research, nationally and internationally.
There are four such surveys in Britain:
■ National Survey of Health and Development (NSHD) which began in 1946.
■ National Child Development Study (NCDS) which began in 1958.
■ 1970 British Cohort Study (BCS70) which began in 1970.
■ Millennium Cohort Study (MCS) which began in 2000.
The first three of those studies are based on all births in Great Britain in one week in 1946,
1958 and 1970, whereas the MCS is based on births over 12 months in selected areas within
the United Kingdom. NCDS, BCS70 and MCS are all managed by the Centre for Longitudinal
Studies (CLS) at the Institute of Education, University of London. NSHD is based in the
Department of Epidemiology and Community Health at University College, London.
2.2 BCS70 in detail
BCS70 began when data were collected about all the babies born in England, Scotland and
Wales12 in one week of April 1970. As shown in figure 2.1, cohort members have since been
followed up five times, at ages 5, 10, 16, 26 and 30, to collect data about their health,
educational, social and economic circumstances. (A representative 10 per cent sample were
also interviewed at age 21). The most recent (sixth) follow up was carried out in 2004 when
cohort members were aged 33 or 34. It is estimated that the final sample will be close to
10,000.
12. Data were collected about children born in Northern Ireland, but these children were not subsequently followed up.

Measuring basic skills for longitudinal study 17
2.3 Development of the 2004 survey
Development work to establish robust survey instruments, with special emphasis on the new
literacy and numeracy assessments, began in 2002. The first design of the adult assessments
was piloted on 177 members of the general public in their 30s in July 2003 (The Basic Skills
Pilot). The child assessments were similarly piloted in September-October 2003 on 127
children from 60 households (The Child Assessment Pilot). After revisions to the design of
some assessments, all survey instruments were piloted in a ‘dress rehearsal’ of the final
survey design on 64 BCS70 cohort members and 40 of their children in November 2003 (The
dress rehearsal). The main fieldwork for the 2004 survey began in February 2004. All possible
interviews were completed by June 2005.
2.3.1 The Basic Skills Pilot
The sample was recruited from the general population, with interviewers aiming to interview
equal numbers of men and women aged between 29 and 39, as BCS70 cohort members
would be 34 when interviewed. No formal socio-economic criteria were given, but
interviewers were initially instructed to recruit from a diverse range of housing types. 16
interviewers were briefed by the research team on either 22 or 23 July 2003. The fieldwork
took place from 24 July 2003 – 6 August 2003. The interviewer de-briefing was on 7 or 8
August 2003.
Interviewers approached potential respondents on the doorstep, or by ‘snowballing’ from
respondents and other contacts, i.e. asking those who had taken part in the study if they knew
of anyone else who might be willing to participate. Those who agreed to take part were given
a letter explaining the study. In most cases, an appointment was made for a later time,
although in some cases respondents were interviewed immediately contact was made.
Everyone who completed the interview was given a £10 gift voucher as a token of
appreciation.
The sample was originally to be boosted by up to 20 respondents recruited from students
attending adult basic skills courses at colleges within London. This was to ensure that there
Figure 2.1. BCS70 follow-up studies from 1970–2004
CHILDREN
BBS CHES CHES YOUTHSCAN BCS70 BCS70 BCS70
1970 1975 1980 1986 1991 1996 1990/2000 2004
BIRTH AGE 5 AGE 10 AGE 16 AGE 21 AGE 26 AGE 30 AGE 34
PARENTS PARENTS PARENTS PARENTS
SCHOOL SCHOOL
TESTS TESTS TESTS TESTS
MEDICAL MEDICAL MEDICAL MEDICAL
SUBJECT SUBJECT SUBJECT SUBJECT SUBJECT
16,135 13,135 14,875 11,628 9,003POSTAL
11,261 ?
Basic Skills Assessment
(10% sample n=1623

Research Report18
would be sufficient respondents with poor literacy skills to effectively pilot the easier part of
the literacy multiple-choice assessment (a group estimated to make up between 5 per cent
and 10 per cent of the target population). Numerous efforts were made to recruit adult
learners13 – however, the scheduling of the pilot during the summer holidays meant that such
a group could not be contacted and recruited in time.
Instead, the interviewers were asked to target respondents who might be more likely than
average to have poor basic skills. Since this could not be done explicitly without the risk of
causing offence, the following tactics were recommended:
■ Concentrating recruitment in low income areas, where individuals with low basic skills might
be expected to be more likely to be found;
■ Encouraging respondents whose reluctance to take part seemed to be linked to the content of
the interview; and
■ Using ‘snowballing’ techniques – respondents who had qualified for the easier literacy
questions and had seemed to enjoy the interview were asked to suggest friends who might be
interested in taking part.
In total, 14 interviewers achieved 177 interviews across England and Scotland14. The sample
was:
■ 58 per cent women (102), 42 per cent men (75);
■ 94 per cent White British;
■ aged between 25 and 45, with 89 per cent falling within the desired 29 to 39 age range; and
■ 66 per cent of men and 57 per cent of women had first left full-time education at 16.
2.3.2 The Parent and Child Pilot
The sample was once again recruited from the general population, with some interviewers
returning to households who had participated in the Basic Skills Pilot. For ‘new’ respondents,
the same procedures were followed as detailed above. Every adult who took part in the
interview was again given a £10 gift voucher as a token of appreciation; every child was given
a ‘goody bag’. Interviewers were briefed by the research team on 22 September 2003. The
fieldwork took place from 27 September 2003–12 October 2003. The interviewer de-briefing
was on 20 October.
Once the interviewer had collected the basic demographics of all household members in the
CAPI, for each eligible child the parent (figure) was asked a number of questions about their
health and education on the CAPI and filled out a self-completion paper questionnaire for
each eligible child. Each child in the household between age 3 and 16 years, 11 months who
agreed to take part completed a number of assessments. In total, information was collected
on 127 children from 60 households. 99 children completed at least one of the three
assessments. There were two versions of the assessments: the BAS II Early Years
assessments for children aged 3–5 years, 11 months, the BAS II School Age assessments for
children between ages 6 and 16 years, 11 months15.
13. Organisations contacted for that purpose include the Tower Hamlets College (Judith Hinman) and the University of London,
Institute of Education (Irene Schwab).
14. Two interviewers were briefed but did not return complete interviews. No interviews took place in Wales.
15. Elliot, C D, (1983, 1996). British Ability Scales II: Core Scale 2. Berkshire: The NFER-NELSON Publishing Company Ltd.

Measuring basic skills for longitudinal study 19
■ 32 per cent (n=32) of children completed the Early Years assessment.
■ 68 per cent (n=67) of children completed the School Age assessment.
2.3.3 The dress rehearsal
Briefings were held on 20, 21 and 24 November. Ten interviewers completed interviews from
25 November–7 December 2003. The de-briefing of interviewers took place on 10–11
December.
A representative sample of 140 BCS70 cohort members was issued to NatCen. Of these:
■ 81 per cent had been interviewed in 1999/2000.
■ 19 per cent had been interviewed in 1986.
Overall, interviews with 64 cohort members and 40 of their children were completed. Of these
children:
■ 35 per cent (n=14) completed the BAS II Early Years assessments.
■ 65 per cent (n=26) completed the BAS II School Age assessments.
2.3.4 Main fieldwork
The issued sample for the main fieldwork from the CLS database to NatCen was 13,197
cohort members. All of these cohort members met the following criteria:
■ living in Great Britain and outlying islands;
■ interviewed in 1986 or later (i.e. since they were 16); and
■ contact details confirmed since 1996.
In total, 85 per cent of the sample had been interviewed by NatCen interviewers in 1999/2000.
Of the remaining 15 per cent, 9 per cent had participated in the 1996 postal survey and 6 per
cent were last interviewed in 1986. Cohort members who have withdrawn permanently from
the study were excluded, as were a very few who were difficult or unpleasant when last
interviewed.
2.4 Coverage
The 2004 survey has two main parts, the Core Interview, which every cohort member who
agreed to take part completed, and the Parent and Child Interview that only selected cohort
members with resident natural or adopted children completed.
The Core Interview involved a personal interview and an adult assessment:
■ Personal Interview: a standard Computer Assisted Personal Interview (CAPI) and Computer
Assisted Self Interview (CASI) were used to update the cohort members’ lives and to observe
their current situation in respect to education, housing, health, work and family life. The
estimated average time for completion of the CAPI and CASI was 50 minutes.
■ Adult Assessments: these assessment tools measured a cohort member’s literacy and
numeracy skills and the presence of some symptoms associated with dyslexia (the term
‘dyslexia’, however, was not used with cohort members). The estimated average time for
completion of this section was 40 minutes. Special instruments were designed for this

Research Report20
assessment, comprising:
• test items from the National Survey of Adult Basic Skills Needs16, carried out to assess
the general public’s basic skills problems;
• test items used in the previous 1991 BCS70 basic skills survey17; and
• test items adapted from the Dyslexia Adult Screening Test18.
The Parent and Child Interview contained an additional CAPI section in the personal interview,
paper based self-completion questionnaires and the assessment of their children’s cognitive
skills19.
■ CAPI interview module: cohort members answered questions about the health, care and
education experiences of each of their resident natural or adopted children, who lived in the
same household, aged 16 years, 11 months or less. The estimated average time for
completion of this section was 10 minutes per child, though time would vary according to the
age of a child.
■ Parent self-completion paper questionnaire: cohort members answered questions covering
parenting styles and the development of children aged 0–16, 11 months. There was a
questionnaire to complete for each of their resident natural or adopted children. The
estimated average time for completion of a questionnaire was 10 minutes.
■ Child self-completion paper questionnaire: resident natural or adopted children aged
between 10 years and 16 years, 11 months inclusive completed a questionnaire about their
activities at home and school, their attitudes, self-esteem and educational aspirations. The
estimated average time for completion was 15 minutes.
■ Child assessments: resident natural or adopted children aged between 3 and 16 years,
11 months had their cognitive skills assessed. The assessments were selected from the
battery of assessment tools that make up the British Ability Scales, or BAS II20. The estimated
average time for completion was 20 minutes.
A technical report containing a more detailed description of the content of each questionnaire
included in the 2004 survey will be published after the main fieldwork has been completed.
16. Williams, J, Clemens, S, Oleinikova, K and Tarvin, K (2003). The Skills for Life survey: A national needs and impact survey
of literacy, numeracy and ICT skills. DfES Research Report 490. Department for Education and Skills. Crown copyright.
17. These items concerning the use of functional literacy and numeracy were developed by the Cambridge Training and
Development Agency. For full details of all assessment items, see Ekinsmyth, C and Bynner, J (1994). The Basic Skills of Young
Adults. London: The Basic Skills Agency.
18. Fawcett, A. J and Nicolson, R. I. (1998). The Dyslexia Adult Screening Test (DAST). London: The Psychological Corporation.
19. All cohort members and eligible children participated in the assessments unless they were prevented from doing so by
learning difficulties or communication difficulties to do with their sight, hearing or speech. The assessments were not carried
out if the cohort member or their child refused, or it was stopped if they became distressed. There were stopping rules specific
to most of the assessments, but interviewers were instructed to stop the exercise if the cohort member or child showed any
signs of becoming distressed.
20. Elliot, C D (1983, 1996). British Ability Scales II: Core Scale 2. Berkshire: The NFER-NELSON Publishing Company Ltd.

Measuring basic skills for longitudinal study 21
3 Basic skills
3.1 Measurement of basic skills in the 2004 survey
Three ways of measuring basic skills were adopted in the 2004 survey. Cohort members
answered questions on self-reported difficulties in the Core Interview before attempting
multiple-choice and open-response literacy and numeracy assessment items.
These three separate measures of basic skills and results from the pilot studies carried out
during the development of the final survey instruments are discussed in the order presented
to BCS70 cohort members in the main interview: self reported difficulties, multiple-choice
literacy and numeracy assessment items, and open-response literacy and numeracy
assessment items.
3.2 Self-reported difficulties
Self-reported difficulties with basic skills have a long history in cohort data, first being asked
about in 1981 when NCDS cohort members were age 23. NCDS cohort members have
subsequently answered questions on difficulties they had with reading, writing and basic
number work at ages 33, 37 and 42, BCS70 cohort members when aged 21 and 30. These
questions provided one of the first real insights into the literacy and numeracy difficulties
experienced by adults in Britain (ALBSU, 1987)21. As noted in the previous chapter, such
questions also have particular value in identifying likely response to new provision offered
under the Skills for Life programme. If people do not perceive a difficulty, then clearly the
incentive to join classes to improve their skills is missing.
The questions expanded between ages 23 and 33 in NCDS, with this wider coverage being
similarly adopted at age 21 in BCS70 and at age 37 in NCDS, although there was a slight
alteration to the writing/spelling question (see table 3.2b). In the last round of data collection
in 2000, when NCDS cohort members were age 42 and BCS70 age 30, the initial general
questions that asked if a cohort member had a skills difficulty were withdrawn. Cohort
members were asked a more specific question about the nature of the problems they had
with reading, writing or basic maths/numbers/arithmetic, not if they had difficulties per se.
Table 3.1 shows just how remarkably consistent the percentage of cohort members reporting
reading, writing/spelling or basic number and arithmetic problems has been over time: 3–4
per cent reading, 3–5 per cent numbers and between 4–12 per cent for writing and/or
spelling. The variation for writing/spelling is primarily dependent on whether spelling
difficulties were reported separately from writing difficulties22. Tables 3.2a, 3.2b and 3.2c
indicate which questions were asked at which sweep of data collection. ‘★’ indicates the
question was asked of all respondents, ‘◆ indicates the question was filtered i.e. only asked if
the response was ‘yes’ to the first question.
21. Hamilton, M (1987). Literacy, Numeracy and Adults. London: ALBSU (Adult Literacy and Basic Skills Unit, now The Basic
Skills Agency).
22. ALBSU, 1987; Ekinsmyth and Bynner, 1994; Bynner and Parsons, 1997.

Research Report22
Table 3.1. Per cent self-reported difficulties in NCDS and BCS70 at different ages
AGE OF COHORT MEMBER 23 33 37 42 21 30
Reading difficulties 4% 4% 3% 3% 3% 3%
Writing difficulties 4% 6% 4%
Writing and/or Spelling difficulties 9% 9% 12% 9%
Number-work difficulties 5% 3% 4% 4%
Change calculation and/or problems
with days/dates/calendars 5% 5%
(Change calculation problems) (2%) (2%)
(Days/dates/calendars problems) (3%) (3%)
Any difficulty (inc. spelling) 13% 11% 15% 12%
Any difficulty 8% 10% 9%
N(100%) = 12537 11407 1714 11419 1623 11261
3.2.1 Selecting the questions to pilot
When preparations for the 2004 pilot study began, the value of repeating the same self-
reported questions for the benefit of longitudinal consistency, or dropping the filter question
in an attempt to capture more specific difficulties cohort members might be experiencing,
were weighed up, along with interviewee burden. For example, in the 2000 survey, if a cohort
member had reported they have no difficulties to the question, ‘When you buy things in shops
with a five or ten pound note, can you usually tell if you are given the right change?’, they
would not be asked any further questions. By dropping the filter on this question, cohort
members would now be asked if they experienced difficulties with other types of number or
maths calculations. After much consideration, the filter was dropped for the pilot study, and
all but one of the basic skills questions included in 1999/2000 were asked in 2004. In total,
this amounted to three questions on reading difficulties, four questions on writing difficulties
and six on number and maths difficulties23. The questions selected are indicated with a ‘●’ in
tables 3.2a, 3.2b and 3.2c.
23. The question ‘If you need to, can you usually work out what dates go with days on a calendar?’ was not included. Questions
selected concentrated on money, numbers and mathematical calculations.
BCS70NCDS

Measuring basic skills for longitudinal study 23
Table 3.2a. Reading questions
GENERAL INTRODUCTION. As you probably know,
thousands of adults have difficulties with reading or writing
at one time or another. It would help us if you could answer
some questions about your experience
of reading and writing. ★ ★ ★ ★
Since leaving school have you had any problems with
reading? ★ ★ ★ ★
If respondent answered ‘yes’ they were asked if their
difficulties were due to sight problems or difficulties with
reading. If ‘difficulties with reading’, additional
questions were asked.
a) Can you read and understand what is written in a
magazine or newspaper? [IF YES] Can you read this
easily, or is it with difficulty? ◆ ◆ ★ ◆ ★ ● ●
b) Can you usually read and understand what is written in a
letter sent to you? [IF YES] Can you read
this easily, or is it with difficulty? OR ◆ ◆
b) Can you usually read and understand what is written in
an official typed letter sent to you? [IF YES]
Can you read this easily, or is it with difficulty? ◆
c) If you have to, can you usually read and understand any
paperwork or forms you would have to deal with in a job?
[IF YES] Can you read this easily, or is it with
difficulty? ◆ ◆ ◆ ◆ ◆ ● ●
d) If you have to, can you read aloud to a child from a
children’s storybook? [IF YES] Can you read this
easily, or is it with difficulty? ◆ ◆ ◆ ◆ ◆ ● ●
*DR = Dress rehearsal.
key: ★ = ask all; ◆ = filtered; ● = ask all in 2004
23 33 37 42 21 30 29-39 33
Pilot
2003/4
DR*BCS70NCDS
AGE

Research Report24
Table 3.2b. Writing questions
Since leaving school have you had any problems with
writing or spelling? OR ★ ★ ★
Since leaving school have you had any problems with
writing or spelling? [IF YES] Is this just with writing, just
with spelling, or do you have problems with
both? ★
If respondent answered ‘yes’, they were asked if their
difficulties were due to sight problems, problem holding
pen/pencil, using keyboard, both, difficulties with writing
generally. If ‘difficulties with writing
generally’, additional questions were asked. ◆ ◆ ◆
a) If you need to, can you write a letter to a friend to thank
them for a gift or invite them to visit? [IF YES]
Can you read this easily, or is it with difficulty? ◆ ◆ ★ ◆ ★ ● ●
b) Could you write to an employer to apply for a job? [IF
YES] Can you read this easily, or is it with
difficulty? ◆ ◆ ◆
c) Could you fill in a form, from the council for example, or
for a hospital appointment? [IF YES] Can
you read this easily, or is it with difficulty? ◆ ◆ ◆
d) Could you write a letter of complaint about something if
you wanted to? [IF YES] Can you read
this easily, or is it with difficulty? ◆ ◆
e) When you try to write something, what is it you find
difficult? Do you find it difficult to …
spell words correctly [yes / no] ◆ ◆ ◆ ◆ ◆ ● ●
make your handwriting easy to read [yes / no] ◆ ◆ ◆ ◆ ◆ ● ●
put down in words what you want to say (never try to
write anything) [yes / no] ◆ ◆ ◆ ◆ ◆ ● ●
*DR = Dress rehearsal.
key: ★ = ask all; ◆ = filtered; ● = ask all in 2004
23 33 37 42 21 30 29-39 33
Pilot
2003/4
DR*BCS70NCDS
AGE

Measuring basic skills for longitudinal study 25
Table 3.2c. Maths, numbers and arithmetic questions
Since leaving school have you had any problems with
number work or basic maths? OR ★
Since leaving school have you had any problems with
numbers or simple arithmetic? ★ ★ ★
If respondent answered ‘yes’, additional questions
were asked.
a) When you buy things in shops with a five or ten pound
note, can you usually tell if you are given the right change?
[IF YES] Can you read this easily, or is
it with difficulty? ◆ ◆ ★ ◆ ★ ● ●
b) If you need to, can you keep household accounts of what
you have spent or saved or what to put by for bills when
they come? [IF YES] Can you read this
easily, or is it with difficulty? ◆ ◆ ◆
c) What is it you find difficult with numbers and simple
arithmetic? Do you find it difficult to……
recognise and understand numbers when you see them ◆ ◆ ◆ ◆ ◆ ● ●
add up ◆ ◆ ◆ ◆ ◆ ● ●
take away ◆ ◆ ◆ ◆ ◆ ● ●
multiply ◆ ◆ ◆ ◆ ◆ ● ●
divide ◆ ◆ ◆ ◆ ◆ ● ●
d) If you need to, can you usually work out what dates go
with which day on a calendar? [IF YES] Can you
read this easily, or is it with difficulty? ◆ ◆ ★ ◆ ★
*DR = Dress rehearsal.
key: ★ = ask all; ◆ = filtered; ● = ask all in 2004
3.2.2 Feedback from the Basic Skills Pilot
All questions that asked about skills difficulties in the pilot study were of a simple ‘yes’ or ‘no’
format. However, the feedback from interviewers involved in the pilot study indicated that
respondents often wanted an additional intermediate response option, such as ‘sometimes’ or
‘it depends’. Taking this on board, additional response options were introduced to some
questions for the dress rehearsal.
23 33 37 42 21 30 29-39 33
Pilot
2003/4
DR*BCS70NCDS
AGE

Research Report26
3.2.3 Results from the Basic Skills Pilot and dress rehearsal
The results from the pilot study and dress rehearsal are shown in tables 3.3a, 3.3b and 3.3c
below compared, where possible, with the results for the same questions in the most recent
NCDS and BCS70 surveys.
Table 3.3a. Per cent reporting difficulties to the individual reading questions
2004
READING NCDS age 42 BCS70 age 30 Pilot DR
Can you usually read and understand 3% 3% 18% 5%
what is written in a magazine or
newspaper?
[in DR: with difficulty, no] 3%/2%
Can you read aloud to a child from a 8% 0%
children's storybook?
[in DR: with difficulty, no] 0%/0%
Can you usually read and understand 14% 5%
any paperwork or forms you would
have to deal with in a job?
[in DR: with difficulty, no] 2%/3%
n(100%) 11,419 11,261 177 64
DR = Dress rehearsal.
Table 3.3b. Per cent reporting difficulties to the individual writing questions
2004
WRITING NCDS age 42 BCS70 age 30 Pilot DR
Can you write a letter to a friend to thank 6% 4% 7% 2%
them for a gift or to invite them to visit?
[in DR: with difficulty, no] 2%/0%
When you try to write something do you 37% 14%
find it difficult to spell some words
correctly?
Do you find it difficult to make your 24% 19%
handwriting easy to read?
Do you find it difficult to put down in 33% 13%
words what you want to say?
n(100%) 11,419 11,261 177 64
DR = Dress rehearsal.

Measuring basic skills for longitudinal study 27
Table 3.3c. Per cent reporting difficulties to the individual number questions
2004
MATHS, NUMBERS AND ARITHMATIC NCDS age 42 BCS70 age 30 Pilot DR
When you buy things in shops with a five 2% 2% 6% 4%
or ten pound note, can you usually tell
if you have the right change?
[in DR: with difficulty, no] 2%/2%
When you have to do things with 10% 3%
numbers do you find it difficult to
recognise numbers when you see them?
Do you ever have difficulty adding up? 14% 23%
[in DR: always, sometimes] 3%/20%
Do you ever have difficulty with 17% 22%
subtraction – that is taking one
number away from another?
[in DR: always, sometimes] 3%/19%
Do you ever have difficulty with 19% 25%
multiplication?
[in DR: always, sometimes] 3%/22%
Do you ever have difficulty with division? 24% 30%
[in DR: always, sometimes] 3%/27%
n(100%) 11,419 11,261 177 64
DR = Dress rehearsal.
For the three questions previously asked to cohort members, we can see that the percentages
who reported difficulties in previous sweeps were very similar to the percentages who
reported difficulties in the dress rehearsal. Interestingly, the percentages from responses
given by the general population sample used in the Basic Skills Pilot were higher. This might
suggest that:
■ levels of self-reported or indeed assessed difficulties in the adult population of Britain are in
fact higher than the estimates provided by cohort data over the years24;
■ the location of the Basic Skills Pilot in areas with socio-economic characteristics associated
with cohort members with poor basic skills was a well chosen strategy as a higher than the
expected percentage of people reported difficulties with one or more of the basic skills; and/or
■ the ‘snowballing’ technique employed by interviewers to try and reach people who had poor
basic skills was productive.
For the questions not previously asked to all cohort members in previous sweeps, many of the
Basic Skills Pilot and dress rehearsal population samples reported difficulties with at least
one aspect of reading, writing or numberwork. This was highest at 37 per cent for spelling
(pilot sample), and 30 per cent for division (dress rehearsal). Interestingly, a higher
percentage of the general population sample used in the Basic Skills Pilot consistently
reported specific reading and writing difficulties, but a higher percentage of cohort members
in the dress rehearsal pilot reported difficulties with the mathematical calculations of
addition, subtraction, multiplication and division. Figure 2.1 shows the percentages reporting
the specific number of reading, writing or numberwork difficulties. It can be seen that broadly
24. Although both the NCDS and BCS70 cohort members have remained remarkably representative of the original 17,000 plus
cohort members, attrition has occurred and it is most notable among those with fewer qualifications and at the lower end of
the socio-economic strata. For further details, see Shepherd, P (1993). ‘Analysis of Response Bias’ in Ferri, E (ed.) Life at 33;
the fifth Follow-up of the National Child Development Study. London: National Children’s Bureau and City University, and
Shepherd, P (1997). ‘Survey and Response’ in Bynner, J, Ferri, E and Shepherd, P (eds.) Twenty-something in the 1990s:
getting on, getting by, getting nowhere. Aldershot: Ashgate Publishing Ltd.

Research Report28
the same pattern emerged in both pilot surveys with difficulties with numbers showing up
most frequently, followed by difficulties with writing and then reading.
This will make for interesting analysis opportunities when the data are made available in early
2005. The complete list of questions asked on basic skills difficulties is included in tables
A3.1a, A3.1b, A3.1c in the basic skills appendix.
Figure 3.1: number of reading, writing or number work difficulties reported in the Basic
Skills Pilot and dress rehearsal
READING
WRITING
NUMBERS
Dress rehearsal
pe
rce
nta
ge
0 diffs 1 diff 2 diffs 3 diffs
number of self-reported difficulties
4 diffs 5 diffs 6 diffs
0
20
40
60
80
100
READING
WRITING
NUMBERS
Basic Skills Pilot
pe
rce
nta
ge
0 diffs 1 diff 2 diffs 3 diffs 4 diffs 5 diffs 6 diffs
0
20
40
60
80
100
number of self-reported difficulties

Measuring basic skills for longitudinal study 29
3.3 Literacy and numeracy assessment items
A review of available assessment instruments that had been used to assess adult reading,
writing and numeracy in English in a UK setting was carried out by Greg Brooks and
colleagues25 for NRDC. The principal aims of this review were to identify the best instrument
for different research purposes:
■ progress in response to teaching; and
■ investigation of the origins and consequences of basic skills difficulties.
The latter helped in the choice of assessment instruments for use in the 2004 cohort survey.
The two best candidate instruments that emerged were:
■ tests previously used in the 1958 and 1970 cohort studies;
■ the Skills for Life Survey (also known as the National Survey of Adult Basic Skills Needs and
as the Adult Basic Skills Baseline Survey)26.
The baseline survey was devised by the Centre for the Development and Evaluation of Lifelong
Learning (CDELL) at the University of Nottingham, for the Department for Education and
Skills (DfES). Following much consultation with colleagues at CDELL27 and in the Institute of
Education, a new assessment tool for piloting was designed from these two sources. By
retaining some tasks that cohort members completed in the earlier surveys, and importing
new tasks from the baseline survey, the new assessment tool would aim to:
■ enhance longitudinal analysis by measuring individual improvement and deterioration over
time;
■ extend the scope of the assessment by being comparable with the current national Skills for
Life Survey; and
■ maintain continuity with the earlier basic skills surveys.
3.3.1 Previous assessment of basic skills in BCS70 and NCDS
These previous assessments were administered as part of larger paper-based surveys, and
as such took no more than 30 minutes of total interview time. In both BCS70 and NCDS
surveys, each of the functional literacy and numeracy assessment tasks consisted of giving
cohort members a visual stimulus and then asking a number of questions about it. Questions
were set at levels of difficulty in accordance with the City and Guilds WordPower and
NumberPower standards at the time: foundation level, level 1, level 2 and level 3 (literacy
only) and were ‘open response’ in format.
3.3.2 The Skills for Life Survey literacy and numeracy assessments
The Baseline Survey was carried out by BMRB Social Research28 on behalf of the DfES in
2002. The aim of the survey was to produce a national profile of adult literacy and numeracy
competence using computer-based multiple-choice items. The numeracy items are based on
25. Brooks, G, Heath, K and Pollard, A (2005). Assessing adult literacy and numeracy: a review of Research Instruments.
London: NRDC.
26. Williams, J, Clemens, S, Oleinikova, K and Tarvin, K (2003). The Skills for Life survey: A national needs and impact survey
of literacy, numeracy and ICT skills. DfES Research Report 490.
27. Special thanks to Peter Burke, John Gillespie and Bob Rainbow, consultants at CDELL.

Research Report30
the Adult Numeracy Core Curriculum for England, the literacy items on the National Adult
Literacy Standards29.
The items are set at five levels of difficulty: entry level 1, entry level 2, entry level 3, level 1
and level 2, the most difficult. Figure 3.2 gives a comparison of the old and new standards.
The assessment was carried out in the style of adaptive testing. With this approach,
algorithms route the individual respondent to items at an appropriate level for that person,
based on their previous response(s). Each respondent who completed the literacy assessment
answered between 17 and 20 items from a total of 70 items. Similarly, each respondent who
completed the numeracy assessment answered 19 from a total of 48 numeracy items. Each of
the literacy and numeracy tests was designed to take 20 to 25 minutes (on average) to
complete.
The assessment items were presented to respondents on a laptop computer. The interviewer
typically sat alongside the respondent so both could see the screen. After going through some
introduction screens with the interviewer on how to do the assessment, the respondent would
read the question and corresponding information on the screen for each question, then select
from (in most cases) four alternative answers. The interviewer would input this choice into the
laptop: the next question was then selected automatically according to the algorithm and
displayed.
Figure 3.2. Comparison of previous and new standards
Previous standards New standards(before 2000)
Source: The Adult Literacy Core Curriculum Trainers’ Pack (2001). Module 1, Unit 2, OHT8, page 36.
Department for Education and Skills / The Basic Skills Agency.
L = Level EL = Entry level
28. Key players: Joel Williams, Sam Clemens, Karin Oleinikova and Karen Tarvin.
29. At the time when the survey was designed, the Adult Basic Skills Core Skills Literacy Curriculum was not available and the
CDELL team had therefore to select and adapt the QCA Key Skills criteria and ‘Standards for Adult Literacy’ when creating the
survey.
L2
L1
EL3
EL2
EL1
L2
L1
Entry level
(= Foundation level)

Measuring basic skills for longitudinal study 31
3.3.3 Research and design considerations
The two assessment tools identified as the most appropriate for use in the 2004 survey
presented many research questions and design challenges before preparations for piloting
could begin. The main issues were as follows.
■ Multiple-choice or open-response question format:
– One method of question or a combination of both?
– Would changing the question format from multiple-choice or open-response alter the
task difficulty, making it easier, more difficult?
■ Adaptive testing or answer all approach:
– Assessing the need for overall percentage pass/fail rates against adaptive testing and
‘spiky profiling’ (detailed below).
■ Paper based or computer assisted:
– The Blaise computer programme used by NatCen has different strengths and weaknesses
compared to the programme used by BMRB. Some of the images and questions used in
the Baseline survey would need to be altered before they could be Blaise compatible.
– Would changing the presentation of a question alter the task difficulty?
– Computer-aided testing sets limits on questions being asked and has ‘corrections’ to
answers supplied by respondents built in to the computer programme. Although similar
rules can be adopted for paper-based versions, the much greater degree of control the
interviewer (and respondent) has over the testing situation with the paper-based test,
means that there is less assurance that the rules are being strictly applied.
A combined approach was decided upon. This ensured that the proven strengths of the two
chosen assessments were retained. All questions used would be presented in their original
format and medium, i.e. questions from the Baseline Survey would be multiple-choice in
format and presented on the computer; questions from the previous cohort assessment
would be open-response and paper-based. A simple method of adaptive testing that involved
two tiers would be adopted for the pilot study. Essentially, all respondents answered an initial
set of questions. Depending on the number of correct answers a respondent gave to these
initial questions, they either progressed to:
■ a set of harder questions – the ‘upper tier’; or
■ a set of easier questions – the ‘lower tier’.
It was hoped that this approach would permit an overall score based on all respondents to be
calculated, along with allowing a ‘spiky profile’ to be built for those with the poorest grasp of
the basic skills (those on the lower tier). Such profiles reflect a respondent’s ability through
practice to show a high level of competence in one domain of the skill, while performing very
badly in other domains. For example, individual experiences mean most people develop
particularly competent numeracy skills in some application areas, while needing help in
others. By giving respondents who struggled with the initial set of questions an additional set
of easier questions, we have an opportunity to really see just what the men and women
assessed with the poorest skills are capable of, rather than just knowing what they cannot do.
We also needed to provide a distribution of cohort members across test score ‘levels’, in line
with the Baseline Survey.
3.3.4 The Basic Skills Pilot: assessment design
The multiple-choice questions and images were presented on a computer screen; the open-
ended questions were presented in paper format (showcards). To ensure the respondent was

Research Report32
familiar with the multiple-choice procedure, the interviewer went through the rules of the
assessment and a practice question before the start of the literacy and the numeracy
assessment. The order of the assessment was:
■ one practice multiple-choice literacy question;
■ multiple-choice literacy questions;
■ open-response literacy questions;
■ one practice multiple-choice numeracy question;
■ multiple-choice numeracy questions; and
■ open-response numeracy questions.
3.3.5 Aims of the Basic Skills Pilot
The main objective of the basic skills pilot was to gain the information required to design an
assessment tool based on the best combination of multiple-choice questions that, in
conjunction with the open-response questions, would take an average of 30 minutes to
administer. Timing was crucial. While considerations for the selection of specific multiple-
choice and open-response questions will be discussed in detail later on in this report, the
development of the assessment following ‘time taken’ information from the basic skills pilot
is now described.
The CAPI programme included a number of ‘time stamps’ that recorded when particular
questions were reached during the interview. The overall mean and median times taken to
complete the literacy and numeracy assessments are given in table 3.430. As we can see,
respondents took on average between 32 minutes, 30 seconds – 44 minutes, 42 seconds to
complete both the literacy and numeracy assessments, dependent upon if progress was along
the ‘lower’ or ‘upper’ tiers. To reduce the average time to the allocated 30 minutes of survey
time, a minimum of 2 minutes, 30 seconds – 14 minutes, 42 seconds needed to be saved.
More questions were piloted than we would hope to include in the final assessment, so ‘time
taken’ was recorded for every multiple-choice question. This way, time taken, question
difficulty and curriculum coverage could all help inform question selection. As the open-
response questions were far fewer and integral to the aims of the overall assessment, the
time saving revisions to the assessment for the dress rehearsal were made within the
multiple-choice section of the assessment.
Feedback from interviewers indicated that respondents who felt they should have been able to
answer a question – generally those with more education – tended to persist until they
achieved a satisfactory answer, no matter how long that took. Less able – or less confident –
respondents clearly guessed responses to questions that they felt they had no likelihood of
answering correctly. This may have been one, though not the only, reason why items in the
upper tier in the numeracy assessment took longer on average than those in the lower tier. If
the level of difficulty was pitched too high, response time would be more likely to have been
polarised in this way.
Given the restrictions, which do not permit details of the original baseline questions to be
published, the value of a detailed description of which questions were the most difficult or
30. Because these tend to record ‘real time’, they take no account of anomalies – for example breaks in the interview – and so
outliers have been excluded in calculating these. All time calculations were helpfully provided by the NatCen research team.

Measuring basic skills for longitudinal study 33
took the longest, etc.) has obvious limitations31. However, the longer time taken for the fewer
numeracy questions indicates that, not unexpectedly, the sample as a whole found the
numeracy multiple-choice questions harder than those assessing literacy skills.
After the rigorous selection criteria had been applied to all multiple-choice questions
included in the Basic Skills Pilot, the estimated average time for completion of the 20
selected literacy multiple-choice questions based on results from the Basic Skills Pilot was
9:31 minutes (upper tier); 8:52 minutes (lower tier). The estimated average time for
completion of the 17 selected numeracy multiple-choice questions, again based on results
from the Basic Skill Pilot, was 13:06 minutes32. As shown in table 3.4, these estimates were
very accurate and the average time taken to complete all parts of the literacy and numeracy
assessments in the dress rehearsal was 29 minutes, 22 seconds. No further amendments
were necessary. The design of the assessment used in the dress rehearsal was taken forward
to the main fieldwork.
Table 3.4. Average time taken for literacy and numeracy assessments
Basic Skills Pilot Dress rehearsal
minutes : seconds minutes : seconds
Literacy multiple-choice* 13:18 9:28
Literacy open-response 3:47 4:21
Combined literacy time 17:05 13:49
upper tier lower tier
Numeracy multiple-choice 17 : 50 9 :47 11:57
Numeracy open-response 4 : 38 4 :38 3:36
Combined numeracy time 27 : 37 15 :25 15:33
Combined total time
(literacy + numeracy) 44 : 42 32 :30 29:22
* As so few respondents progressed along the lower tier in the literacy assessment in both the Basic Skills Pilot (n=10) and the
dress rehearsal (n=6), separate timings were not calculated.
3.4 Multiple-choice literacy and numeracy assessment items
Once the design issues detailed above had been resolved, attention turned to the selection of
questions to be included in the assessment. The literacy and numeracy assessments,
multiple-choice and open-response questions, could take no more than 30 minutes of survey
time in total. More questions were piloted than we would use in the final assessment to
facilitate selection of the questions that would provide as comprehensive coverage as possible
of the Adult Literacy and Numeracy Core Curricula for England within the time constraints.
They would also supply, for comparison, assessment of basic skills levels in Scotland and
Wales. A lot of time was spent on the selection of the questions for this initial ‘cut’. 44 literacy
and 26 numeracy questions were selected.
Detailed information was available to aid selection of the ‘open-response’ questions (as
31. A table showing percentage of respondents incorrectly answering each multiple-choice item in the literacy and numeracy
assessment, together with the average time taken by respondents to complete each question is provided in table A3.2a and 3.2b
in the basic skills appendix.
32. The ‘upper’ and ‘lower’ tier of the numeracy assessment was dropped after the pilot. Full details are included later in the
report.

Research Report34
discussed in section 3.5), but for the multiple-choice questions, only pass/fail rates for the
overall sample (n=2,849)33 were available. However, due to the nature of adaptive testing, the
reported pass/fail rate for an individual question only related to the number of respondents
who had attempted that question, i.e. item response rates were calculated for particular
levels rather than for the test as a whole. For our purposes, however, overall failure rates
were needed. Two simple rules, based on assumptions with obvious limitations, were applied:
■ if a respondent had not attempted a question because they had been routed to a more difficult
question, it was assumed they would have passed the question; and
■ if a respondent had not attempted a question because they had been routed to an easier
question, it was assumed they would have failed the question.
By applying these rules, radically different pass/fail rates were sometimes calculated for a
question. The literacy assessment is used for illustration purposes. From the sample data
provided by BMRB:
■ 7 per cent (199) respondents entered the assessment at entry level 2 or entry level 3; and
■ 37 per cent (1,051) respondents entered at level 1;
■ 56 per cent (1,599) respondents entered at level 2.
The assumptions of adaptive testing imply that the respondents who entered the assessment
at level 1 or level 2 would answer the entry level 2 and entry level 3 questions correctly.
Failure rates for entry level 2 and entry level 3 questions based on the whole sample of 2849
would be much lower than failure rates based on the 199 respondents who entered the
assessment at entry level 2 and entry level 3. For example:
■ if 94 of 199 respondents answered incorrectly, the failure rate is 47 per cent; and
■ if 94 of 2,849 respondents answered incorrectly, the failure rate is 4 per cent.
Similar rules were applied, depending on the ‘layer’ or ‘step’ of the literacy and numeracy
algorithm. After recalculating failure rates for all individual questions in this crude way, we
were able to eliminate questions that were ‘too easy’ or ‘too difficult’. As for questions
previously used in the cohort studies assessment, questions failed by less than 1 per cent and
more than 50 per cent were the first to be omitted.
As indicated, some of the selected questions needed to be adapted to run successfully on the
computer programme Blaise. The original questions were designed to be read and answered
by the respondent with no intervention by the interviewer, except that the latter entered the
chosen response using a mouse. The images, layout and format of the original screens were
preserved as far as possible. In most cases, the two programs resembled each other closely,
while in some, particularly questions presented in ‘drag-and-drop’ format and/or with
‘multiple answers’, the Blaise version differed from the original. Figure 3.3 provides more
details.
33. When the data from the Baseline Survey was first examined (November 2002), data was available for 2,849 respondents.
The final sample size was 8,730 respondents, but the literacy test was taken by 7,874 of them and the numeracy test was taken
by 8,040.

Measuring basic skills for longitudinal study 35
Figure 3.3. Example of a drag-and-drop multiple-choice question
Drag-and-drop format
In the original format, the respondent had to tell the interviewer the letter that matches
his/her answer (A, B, C or D) and the interviewer had to drag and drop the appropriate image
in the empty space at the top left hand side of the text using the mouse. In the BCS70
assessment, the cohort member had to key in ‘A’, ‘B’, ‘C’ or ‘D’.
TODAY’S WEATHERToday will be a very bright and hot sunny day
Which image would you put in the box to show what the weather will be like today?
A B C D
3.4.1 Design of the ‘multiple-choice’ assessment
Figures 3.4a and 3.4b show the simple algorithm that directed respondents through the two
‘tiers’ or ‘levels’ of the multiple-choice questions in both the literacy and numeracy
assessments. The number of correct responses to the initial set of screening questions (entry
level 3) directed respondents along either the upper tier (level 1 and level 2 questions) or
along the easier lower tier (entry level 2 and then a few more entry level 3 questions). If a
respondent had four or more correct answers, they progressed along the upper tier. Between
zero and three correct answers sent them along the lower tier. Overall, respondents on the
upper tier had 25 literacy or 18 numeracy questions; respondents on the ‘lower’ tier had 26
literacy or 14 numeracy questions. Administration details are given in figure 3.5.

Research Report36
Figure 3.4a. Design of the (pilot) literacy multiple-choice assessment
UPPER TIER
Screening questions
LOWER TIER L = Level EL = Entry level
Figure 3.4b. Design of the (pilot) numeracy multiple-choice assessment
UPPER TIER
Screening questions
LOWER TIER L = Level EL = Entry level
Figure 3.5. Administration of the multiple-choice assessment
For this part of the assessment, the interviewer and respondent sat side-by-side, so
both could see the screen. Each question consisted of a visual image and some text.
Once interviewers had taken the respondent through the practice question, they
could not give any guidance or feedback to the respondent. The respondent read the
text/question on the screen, then selected from (in most cases) four alternative
answers: A, B, C and D*. The respondent then told the interviewer their choice and
the interviewer input this choice into the laptop. In Blaise, response options must be
entered as 1, 2, 3 and so on. Green coloured stickers were labelled and placed on
the appropriate keys (A=1, B=2, C=3, D=4, E=5). Once an answer was entered, the
next item appeared on the screen automatically. A respondent could not go back to a
previous question and change their answer once it had been entered. Interviewers
could only reiterate which response option the respondent had selected for an
individual questions, and offer neutral encouragement, such as ‘yes’, ‘okay’, ‘thank
you’ etc. after each answer.
*There were five alternative answers for one of the questions and three alternative answers for two of the questions.
L2 9 items
EL3 6 items
EL3 7 items
L1 9 items
EL2 13 items
4-7 correct
0-3 correct
L2 5 items
EL3 2 items
EL3 6 items
L1 7 items
EL2 6 items
4-6 correct
0-3 correct

Measuring basic skills for longitudinal study 37
3.4.2 The Basic Skills Pilot: feedback and results34
Other than the time taken to complete the assessments, as discussed earlier, other objectives
to achieve from the Basic Skills Pilot were:
■ two tiers: to see if the two tiers proved effective. The aim was to be able to calculate an
overall score, while at the same time gaining more detailed knowledge – a ‘spiky profile’ – of
those with the poorest grasp of literacy and numeracy;
■ question format and sequence: to see if changes made to specific questions made them
difficult to understand and how the placement of ‘repeated images’ affected respondents;
■ instructions: were respondents clear about what they had to do?; and
■ other difficulties: to see what administrative or other difficulties arose for interviewers and
respondents.
Two tiers: did the two tiers prove effective?
Of the 177 respondents in the Basic Skills Pilot, 6 per cent (n=10) progressed along the lower
tier of the multiple-choice part of the literacy assessment. This figure is in line with previous
studies, and suggests the screening questions were able to identify accurately the small
group of adults with the most severe literacy difficulties. However, 34 per cent (n=60) of
respondents progressed along the lower tier of the multiple-choice part of the numeracy
assessment. Bearing in mind the relatively small sample size and consequent high sampling
error, this figure is higher than expected from previous studies, where no more than 1 in 4
cohort members were identified with very limited numerical skills, and this suggests that the
screening questions were either too difficult or maybe too specific, i.e. they were not broad
enough to capture a range of number skills. Thus, more respondents were penalised (sent to
the lower tier) for not having the skills being assessed by the specific screening questions
selected, whereas many of them might have been able to do higher level tasks.
Calculation of overall total scores
In addition to providing the opportunity for a detailed examination of the adults in BCS70 with
the poorest literacy and numeracy skills, the final literacy and numeracy assessments also
needed to provide a total score that could be calculated for all cohort members. For analytic
purposes, it is vital to be able to have a single measure that gives the distribution of the
spread of literacy and numeracy scores across a truly representative adult population. As
detailed earlier, in order to do this, we have to assume that respondents progressing along
the lower tier would not be able to answer the multi-choice questions on the upper tier (level
1 and level 2).
Any correct answer was given ‘1’ point, an incorrect answer ‘0’ points. For the numeracy
questions with more than one correct answer, ‘1’ point was only awarded if all parts of the
questions had been correctly answered. Respondents on the lower tier were awarded ‘0’
points for each of the questions on the upper tier. The maximum literacy score available was
25, the maximum numeracy score available was 18. By using this approach, respondent
scores for those who progressed along the lower tier of the multiple-choice part of the
assessment were highly skewed at the lower end: the maximum score they could attain was
3. Unlike with literacy, where no more than 6 per cent of respondents progressed along the
lower tier, 1 in 3 of all respondents went along the lower tier of the numeracy assessment.
Figures 3.6a and 3.6b give the distribution of respondents by total score attained in the
34. This section draws on the detailed report of the Basic Skills Pilot produced by the NatCen research team.

Research Report38
literacy and numeracy assessments. The literacy assessment clearly produced a good spread
of scores with, as we might expect, a bias towards high performance. This reflects the
relatively low incidence in the population of very poor reading skills.
For the numeracy assessment, the picture was rather different. The pilot results showed that
an overall score could not successfully be interpreted from results of the two-tiered
numeracy assessment. A third of respondents had difficulty with the initial set of questions
and progressed along the easier lower tier of the assessment. As such, the scores formed
more of a bimodal distribution with little or no continuity in performance from the lower to the
upper tier. Even though the distribution of scores obtained from earlier studies suggested that
a high number of low performers was to be expected (1 in 4), as reflected in a flatter more
even distribution of respondents from low to high scores, the ‘two-tier’ design would still
result in a distortion of true performance. This is because the true distribution of scores for
the population as a whole would not be adequately reflected by the assessment because the
poor performers were effectively excluded from tasks that they might have been able to do,
suggesting they were a different population. As an overall score of performance measured on
a continuous scale is an essential requirement of the basic skills assessment, the design
strategy for the numeracy assessment needed to be revised.
Figure 3.6a. Total literacy score from multiple-choice questions
(all respondents – if assumed lower tier get upper tier wrong)
Figure 3.6b. Total numeracy score from multiple-choice questions
(all respondents – if assumed lower tier get upper tier wrong)
y p p q
pe
rce
nta
ge
numeracy score: (n=177)
0
5
10
15
20
2 3 4 5 6 7 8 9 10 11 12 13 14 15 16 17 1810
pe
rce
nta
ge
0 1 2 3 4 5 6 7 8 9 10 11 12 13 14 15 16 17 18 19 20 21 22 23 24
literacy score: (n=177)
0
5
10
15
20
25

Measuring basic skills for longitudinal study 39
Question format and sequence
Each screen contained three different elements:
■ an image, with a combination of text, pictures and graphic prompts, e.g. a box to indicate a
missing word;
■ the question being asked;
■ the list of response options.
While the responses were always at the bottom of the screen, the questions were sometimes
above or below the images. Interviewers reported the inconsistent screen layout meant many
respondents struggled to grasp what was expected of them in this section.
Clear instructions
Example question: At the start of the literacy and numeracy multiple-choice sections, the
interviewer demonstrated to the respondent what they had to do by taking them through an
example question35. Interviewers felt that the examples, particularly the one used at the start
of the literacy assessment, were not well chosen.
‘Don’t know’ or ‘Pass’ option: the Baseline Survey made the ‘don’t know/can’t guess’ option
explicit, but the full interviewer instructions had not been available before the pilot briefings.
The pilot protocols did not include clear instructions about how to register an inability to
reach a response (not quite the same as ‘don’t know’) and interviewers felt it was clear that
many respondents simply guessed at questions they felt unable to answer, or struggled on for
far longer than necessary before asking for interviewer assistance.
Other administration points
Order of the assessment: the order of the assessment components and corresponding
administration changes meant a lot of shifting of position of computer, interviewer or
respondent. For the introduction and multiple-choice questions, both respondent and
interviewer needed to see the computer. For the open-response questions, the respondent
could not see the screen as the answers were on the screen. In general, interviewers found
the procedure unnecessarily clumsy, whilst in some households it proved particularly difficult
to find appropriate places to sit.
CASI: all interviewers raised why this part of the interview was not self-administered through
CASI, with the respondents entering the responses themselves36. In the main BCS70
fieldwork, this mode of administration might seem particularly incongruous as cohort
members would have just completed a standard CASI. In 1999/2000, when cohort members
were last interviewed, 6 per cent asked for assistance when completing the CASI (5.6 per cent
from the interviewer, 0.4 per cent from a family member).
Mistakes in original screens: the original screens contained some spelling mistakes and
other errors. These were corrected in later versions of the program.
35. These questions were selected from the battery of questions in the Baseline Survey not selected for piloting. The two
questions were set at entry level 3.
36. Indeed, a couple of interviewers offered this option to respondents; it made their role – expressly forbidden to do anything
other than enter responses and offer non-directional encouragement – easier to comprehend. Some interviewers found their
passive role hard to sustain when respondents seemed completely lost. They were frustrated by the lack of advice in the
protocol on how to move forward if a respondent became stuck on a question for a long time.

Research Report40
3.4.3 Design of the final multiple-choice assessment
Revisions to the administration, basic design and question layout of the multiple-choice
assessment were implemented following feedback from interviewers and further consultation
with our colleagues at CDELL.
CASI: the first change was that the assessment would be completed as a CASI. In most
households, the flow of the interview meant cohort members would complete the
assessments just after they had answered a set of questions on their views, opinions and
other personal matters in CASI format. As long as they understood what was being asked of
them, i.e. the introduction screens were clear, there was no reason for keeping to the way the
assessment had been conducted for the Baseline Survey. In the Baseline Survey, questions
were answered by using the mouse, but cohort members only had to press a key to record
their answer. However, if a cohort member did not want to press the keys themselves, the
interviewer would enter their answers for them within the same restrictions employed for the
pilot study, i.e. they could provide no help or feedback, only neutral encouragement.
Instructions: the introduction to the multiple-choice questions was changed to be the same as
that used in the Baseline Survey. This consisted of three examples of questions and a number
of other information screens that the interviewer read out and went through with the
respondent. Apart from improving the instructions to respondents, consistency with the
protocols of the Baseline Survey was maintained.
Sequence: the change in the order of the components of the overall assessment improved the
flow of the assessment, cutting down on the number of times the interviewer, respondent or
computer needed to shift position. The order of the assessment was now:
■ introduction to multiple-choice questions as used in Baseline Survey (with minor
amendments);
■ multiple-choice literacy questions;
■ multiple-choice numeracy questions;
■ open-response literacy questions; and
■ open-response numeracy questions.
Layout: the layout of each question on the screen was standardised as follows:
■ the question appeared at the top of the screen;
■ an image, with a combination of text, pictures and graphic prompts, e.g. a box to indicate a
missing word, in the middle of the screen; and
■ the list of response options at the bottom of the screen.
A ‘don’t know/not sure’ (pass) key was introduced. This was explained to respondents during
the introduction screens. As with the other keyboard keys, respondents would use (A=1, B=2,
C=3, D=4, E=5), a (blue) coloured sticker was placed on the relevant key they had to press,
although it was not labelled (‘don’t know’ = 9). A big red sticker was placed on the ENTER key.

Measuring basic skills for longitudinal study 41
3.4.4 Selecting multiple-choice questions for the final assessment
Two of the three criteria that had been applied to the selection of the open-response
questions were applied to the multiple-choice questions (see tables A3.2a and A3.2b in the
basic skills appendix for full details37). These were:
■ ‘not too easy or too difficult’: if less than 1 per cent or more than 50 per cent of respondents
gave an incorrect answer to an individual question, the question was excluded from the
selection process; and
■ ‘free from gender bias’: in the earlier basic skills surveys, a gender bias was evident for some
items with women tending to do marginally better than men on most reading items and
substantially worse on some of the numeracy items, of which calculating areas of a room and
working out percentages were the most notable examples. Accordingly, a male-female bias
was calculated for each question by subtracting the failure rate of men from the failure rate of
women. Items with a 10 per cent or higher difference were excluded.
At this stage of development it was also critical to consider:
■ ‘the national curricula’: ensure coverage of as many aspects of the national literacy and
numeracy curricula as possible, taking into account the aspects already covered by the open-
response questions; and
■ ‘time taken’: the time taken to complete an individual question was also a critical factor.
3.4.5 Literacy multiple-choice assessment changes
The two-tier literacy assessment was retained, with some modifications. A total of 20
multiple-choice literacy questions made up the final assessment. Figure 3.7 shows the
number of entry level 3 screening questions was increased to ten. Respondents failing to
answer at least six of these questions correctly went on to answer ten entry level 2 questions
on the lower tier. Respondents who answered between six and ten screening questions
correctly proceeded to the upper tier, and answered five level 1 and five level 2 questions.
Figure 3.7. Final literacy multiple-choice assessment
UPPER TIER
Screening Questions
LOWER TIER L = Level EL = Entry level
3.4.6 Numeracy multiple-choice assessment changes
A high proportion of men and women in the general population have number difficulties38.
Adults with the poorest grasp of literacy (as defined by this assessment) essentially have
limited reading skills, whereas the difficulties for adults with the poorest grasp of number
skills are more varied. Some adults will be comfortable using numbers in a specific context or
environment, very much dependent upon their individual experiences. Outside this context or
environment, their number skills could flounder. For example, although a person could easily
calculate the correct number of bits of wood needed to lay a floor in a room of a certain size,
37. It was not possible to apply the ‘good discriminator’ criterion to the pilot data, given the limited sample size.
38. Parsons, S, and Bynner, J (1999). Literacy, Leaving School and Jobs: the effect of poor basic skills on employment in
different age groups. London: The Basic Skills Agency.
L2 (5 questions)
EL3 (10 questions)
L1 (5 questions)
EL2 (10 questions)
6-10 correct
0-5 correct

Research Report42
they could not work out the cost of spreading a £500 holiday over six monthly instalments.
Unlike literacy, this ‘context-specific use’ can vary enormously. The widespread and diverse
nature of difficulties associated with numeracy in the general population suggest that
creating a ‘spiky profile’ of number skills at the population level would have equal, if not
more, value than restricting this examination to the one in four or one in three with the
poorest grasp of numeracy. The next stage of development for the BCS70 numeracy
assessment was therefore concentrated on the design of an assessment that required all
respondents to attempt all questions. The decisions were based on results of the pilot study.
The aim was to include 20 questions in the final assessment, as for literacy, but time
restrictions limited the final number to 17 as numeracy questions generally took longer to
answer in the pilot study. Two options for how to administer the numeracy assessment were
considered:
i) Start the assessment with the easiest questions, progressively increasing question difficulty.
ii) ‘Mix up’ questions by difficulty but administer them by curriculum topic, i.e. all questions
set at different levels that related to ‘money calculations’ would follow each other, before any
questions on ‘whole numbers and time’.
Option ‘i’ is the more traditional approach, but option ‘ii’ was preferred for its potential of
capturing more of the aspects of numeracy an individual respondent can and cannot do. As
there could only be a maximum of 17 multiple-choice questions, not all aspects of the
curriculum could be covered by the questions selected at each level. Respondents may have
difficulty with the particular questions set at entry level 3, but because of their own particular
experiences be able to answer questions set at level 1 or level 2. For example, a respondent
may be very competent at questions to do with calculating money and be able to answer a
question set at level 2, but not be able to answer a question on calculating proportions, even
though this question was an ‘easier’ entry level 3 question.
There is the potential in option ‘ii’ for a respondent to become disheartened earlier on in the
assessment as harder questions appear earlier, but it is likely that they will be encouraged to
continue by the appearance of an easier question that they are confident of attempting. In
addition, the revised assessment started and ended with an entry level 3 question, as detailed
in figure 3.8.
Figure 3.8. Sequence of difficulty of questions in final numeracy assessment
L = Level EL = Entry level
For the numeracy assessment, as all respondents attempted all questions, the aim was to
select (at least) 4 questions from each of the 4 levels of difficulty, entry level 2, entry level 3,
level 1 and level 2.
START EL3 > L1 > EL3
> L1 > EL2 > L1
> L2 > EL2 > L1
> L2 > EL2 > EL2
> EL3 > L1 > L2
> EL2 > EL3 END
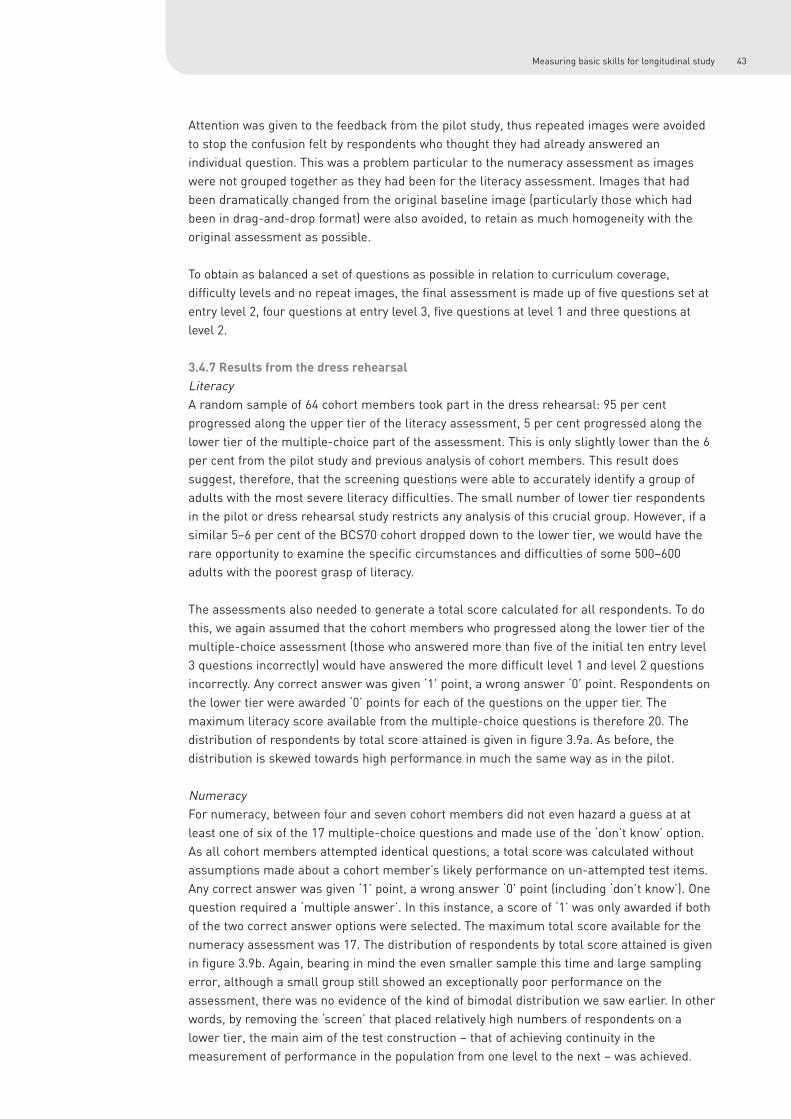
Measuring basic skills for longitudinal study 43
Attention was given to the feedback from the pilot study, thus repeated images were avoided
to stop the confusion felt by respondents who thought they had already answered an
individual question. This was a problem particular to the numeracy assessment as images
were not grouped together as they had been for the literacy assessment. Images that had
been dramatically changed from the original baseline image (particularly those which had
been in drag-and-drop format) were also avoided, to retain as much homogeneity with the
original assessment as possible.
To obtain as balanced a set of questions as possible in relation to curriculum coverage,
difficulty levels and no repeat images, the final assessment is made up of five questions set at
entry level 2, four questions at entry level 3, five questions at level 1 and three questions at
level 2.
3.4.7 Results from the dress rehearsal
Literacy
A random sample of 64 cohort members took part in the dress rehearsal: 95 per cent
progressed along the upper tier of the literacy assessment, 5 per cent progressed along the
lower tier of the multiple-choice part of the assessment. This is only slightly lower than the 6
per cent from the pilot study and previous analysis of cohort members. This result does
suggest, therefore, that the screening questions were able to accurately identify a group of
adults with the most severe literacy difficulties. The small number of lower tier respondents
in the pilot or dress rehearsal study restricts any analysis of this crucial group. However, if a
similar 5–6 per cent of the BCS70 cohort dropped down to the lower tier, we would have the
rare opportunity to examine the specific circumstances and difficulties of some 500–600
adults with the poorest grasp of literacy.
The assessments also needed to generate a total score calculated for all respondents. To do
this, we again assumed that the cohort members who progressed along the lower tier of the
multiple-choice assessment (those who answered more than five of the initial ten entry level
3 questions incorrectly) would have answered the more difficult level 1 and level 2 questions
incorrectly. Any correct answer was given ‘1’ point, a wrong answer ‘0’ point. Respondents on
the lower tier were awarded ‘0’ points for each of the questions on the upper tier. The
maximum literacy score available from the multiple-choice questions is therefore 20. The
distribution of respondents by total score attained is given in figure 3.9a. As before, the
distribution is skewed towards high performance in much the same way as in the pilot.
Numeracy
For numeracy, between four and seven cohort members did not even hazard a guess at at
least one of six of the 17 multiple-choice questions and made use of the ‘don’t know’ option.
As all cohort members attempted identical questions, a total score was calculated without
assumptions made about a cohort member’s likely performance on un-attempted test items.
Any correct answer was given ‘1’ point, a wrong answer ‘0’ point (including ‘don’t know’). One
question required a ‘multiple answer’. In this instance, a score of ‘1’ was only awarded if both
of the two correct answer options were selected. The maximum total score available for the
numeracy assessment was 17. The distribution of respondents by total score attained is given
in figure 3.9b. Again, bearing in mind the even smaller sample this time and large sampling
error, although a small group still showed an exceptionally poor performance on the
assessment, there was no evidence of the kind of bimodal distribution we saw earlier. In other
words, by removing the ‘screen’ that placed relatively high numbers of respondents on a
lower tier, the main aim of the test construction – that of achieving continuity in the
measurement of performance in the population from one level to the next – was achieved.

Research Report44
Figure 3.9a. Total literacy score from multiple-choice questions
Figure 3.9b. Total numeracy score from multiple-choice questions
3.5 Open-response literacy and numeracy assessment items
In 1991, when age 21, a representative 10 per cent sample of BCS70 had their functional
literacy and numeracy assessed. These assessments were administered as part of a much
larger paper-based survey, and as such could take no more than 30 minutes of a 90-minute
interview. Each of the functional literacy and numeracy assessment tasks consisted of giving
cohort members a visual stimulus and then asking a number of questions about it. Questions
were set at levels of difficulty in accordance with City and Guilds WordPower/NumberPower
standards at the time: foundation level, level 1, level 2 and level 3 (literacy only) and were
‘open-response’ in format. Inclusion of some of these questions in the new 2004 basic skills
assessment tool enhances longitudinal analysis and measures change, improvement and
deterioration over time.
The findings from this and a similar NCDS study carried out in 1995 have been highly
influential39. The information has helped establish that one in five adults in Britain have
difficulties with at least one of these basic skills. That is, ‘they cannot read fluently, write
easily or perform basic maths calculations at the level expected of an 11 year-old’40. In fact,
y p p q
pe
rce
nta
ge
total score
0
5
10
15
20
10 2 3 4 5 6 7 8 9 10 11 12 13 14 15 16 17
pe
rce
nta
ge
10 2 3 4 5 6 7 8 9 10 11 12 13 14 15 16 17 18 19 20
total score
0
5
10
15
20
25
39. Ekinsmyth and Bynner, 1994; Bynner and Parsons, 1997.
40. Skills for Life, 2001.

Measuring basic skills for longitudinal study 45
problems with numbers are experienced by as many as one in two adults41, the figure adopted
by the Moser Committee.
3.5.1 Selecting the open-response questions
Using the assessment data supplied by the 1,621 cohort members who completed the
assessments in the 1991 survey, three criteria were applied to the questions for selection into
the final assessment42.
Not too easy or too difficult: if less than 1 per cent or more than 50 per cent of cohort
members gave an incorrect answer to an individual question, the question was excluded from
the selection process.
Free from ‘gender bias’: a male-female bias was calculated for each question. The failure rate
of women was subtracted from the failure rate of men. Items with more than 10 per cent
difference were excluded. The reasoning behind this selection was that because of the few
items involved we needed to focus this component of the assessment on discriminating
between levels uncontaminated by such factors as gender. Such a restriction did not apply in
the case of the multiple-choice items.
A ‘good discriminator’: assessment scores were previously grouped into four skills groups:
very poor, poor, average, good. A simple discrimination index was calculated for each
question. The failure rates of cohort members with ‘good’ assessment scores were
subtracted from failure rates of cohort members who achieved ‘very poor’ assessment
scores. The bigger the difference, the better the item was at discriminating. As far as
possible, we wanted items with a minimum 20 per cent discrimination score, but this would
not always be possible for the easier items, which were failed by relatively few cohort
members.
For each question, tables 3.5a and 3.5b give the original level of difficulty, the actual
percentage of cohort members who incorrectly answered the question together with the re-
graded level of difficulty based on this percentage43, and the associated gender bias and
discrimination score. As the overall assessment needed to cover as many aspects of the
national curriculum as possible, the aspect of the curriculum that each question covered was
also a very important factor. The questions selected needed to complement the selection of
the multiple-choice questions. After much consideration, seven literacy and seven numeracy
open-response questions were selected from the previous cohort assessments. These are
highlighted in bold in the tables.
41. See Bynner and Parsons, 1997.
42. A similar exercise was carried out on the data supplied by the 1,714 cohort members who took part in the 1995 NCDS
survey. When the skills assessment is repeated in a later NCDS survey, much of the groundwork on the selection of the open-
response questions will have been done. The seven literacy and six numeracy questions selected from the 1991 BCS70 survey
just need to be replaced with the selected questions from the 1995 NCDS survey.
43. Questions were re-graded in line with the percentage of cohort members who had failed the individual questions at the
different levels of difficulty in the 1991 survey. For literacy, questions were graded as foundation level questions with 0–5per
cent failure rate; level 1 with 6–20 per cent failure rate; level 2 with 21–40 per cent failure rate; level 3 with 41–50 per cent
failure rate. For numeracy, questions were graded as foundation level questions with 0–16 per cent failure rate; level 1 with
17–35 per cent failure rate; level 2 with 36–50 per cent failure rate. Questions with more than 50 per cent failure rate were
immediately excluded. This is indicated by ‘X’ in the tables.

Research Report46
Ta
ble
3.5
aB
CS
70
litera
cy
qu
es
tion
s: p
er ce
nt g
ivin
g in
corre
ct re
sp
on
se
by
litera
cy
lev
el
Ne
w le
ve
lA
llM
en
Wo
me
nV
ery
Po
or
Av
era
ge
Go
od
Dis
c
Me
n-
po
or
Ind
ex
Wo
me
n
%%
%%
%%
%%
%
FO
UN
DA
TIO
N L
EV
EL
1. A
ne
ws
pa
pe
r ad
ve
rt for a
Co
nce
rt: a) W
he
re is
the
con
cert b
ein
g h
eld
?1
55
51
91
15
11
80
b) W
ho
will b
e p
lay
ing
at th
e co
nce
rt?F
11
18
21
08
0
2. R
ea
din
g a
ma
p: a
) Wh
ich
is th
e q
uic
ke
st ro
ute
from
Ob
an
to D
un
de
e?
F5
37
33
63
13
2-4
b) Is
Ed
inb
urg
h e
as
t or w
es
t of G
las
go
w?
17
68
25
13
62
23
-2
LE
VE
L 1
1. C
on
su
lting
Ye
llow
Pa
ge
s: a
) Co
uld
you
give
me
the
ad
dre
ss
of C
as
pe
r's re
sta
ura
nt?
F5
55
28
12
20
28
0
b) W
ha
t is th
e p
ho
ne
nu
mb
er o
f Bo
bb
y B
row
n's
res
tau
ran
t?F
22
21
12
20
11
0
2. R
ea
din
g a
n a
dve
rtise
me
nt: a
) Wh
at is
the
ag
e lim
it for a
pp
lying
, if you
are
NO
T
a q
ua
lified
en
gin
ee
r?1
91
08
23
14
12
32
02
b) If yo
u w
an
t mo
re in
form
atio
n, w
ha
t do
you
ha
ve to
do
if you
ma
ke
a p
ho
ne
ca
ll?2
17
20
16
65
36
17
26
34
3. R
ea
din
g g
rap
hs
:
a) W
ha
t % o
f the
po
ll did
La
bo
ur g
et 3
we
ek
s b
efo
re th
e b
y-e
lec
tion
?1
10
91
24
32
18
24
1-3
b) W
hy
do
the
gra
ph
s lo
ok
so
diffe
ren
t ev
en
tho
ug
h th
ey
sh
ow
the
sa
me
res
ults
?2
24
22
26
79
51
22
67
3-4
c) W
hy
wo
uld
the
La
bo
ur p
arty
pre
fer to
us
e g
rap
h B
?2
21
18
23
72
40
21
56
7-5
LE
VE
L 2
1. R
ea
din
g a
ma
nu
al: a
) Wh
at d
o th
e in
itials
RF
sta
nd
for?
22
42
12
77
95
22
64
75
-6
b) W
ha
t is th
e fa
cto
ry se
tting
for th
e R
F c
ha
nn
el?
22
21
82
57
75
02
03
74
-7
c) W
he
re w
ou
ld yo
u lo
ok
to fin
d o
ut a
bo
ut th
e S
TIL
L V
-LO
CK
ad
justm
en
t scre
w?
X5
34
75
78
98
16
92
66
3-1
0
2. R
ea
din
g a
pa
ssa
ge
: Wh
at a
re th
e m
ain
po
ints
of th
e a
rgu
me
nt in
favo
ur o
f
hu
ntin
g? C
M n
ee
de
d to
ma
ke
4 m
ain
po
ints
to g
et a
co
rrect a
nsw
er.*
X
77
74
80
98
92
82
65
33
-6
3. R
ea
din
g a
Firs
t Aid
bo
ok
: a) W
ha
t are
the
thin
gs yo
u c
ou
ld d
o if yo
u fo
un
d
so
me
on
e w
ho
wa
s s
uffe
ring
from
hyp
oth
erm
ia? C
M n
ee
de
d to
ma
ke
5 m
ain
po
ints
to g
et a
co
rrect a
nsw
er.*
X
48
48
49
84
69
53
31
53
-1
b) S
om
eo
ne
lost b
od
y he
at a
nd
be
ca
me
hyp
oth
erm
ic: w
ha
t is th
e b
est w
ay to
re-w
arm
the
m?
33
73
83
78
06
75
01
16
91
LE
VE
L 3
1. R
ea
din
g a
pa
ssa
ge
: Wh
at w
as th
e g
rea
test c
au
se
of J
on
ath
an
's d
isco
mfo
rt?X
77
77
78
92
87
83
67
25
-1
n =
1
,62
17
46
87
51
32
26
44
83
74
4
* F
or th
e p
urp
ose
s o
f qu
estio
n s
ele
ctio
n, a
co
ho
rt me
mb
er n
ee
de
d to
ha
ve g
iven
all m
ain
po
ints
to b
e a
wa
rde
d a
‘co
rrect’ a
nsw
er.
Dis
c In
de
x =
Dis
crim
ina
tion
s In
de
x

Measuring basic skills for longitudinal study 47
Ta
ble
3.5
bB
CS
70
nu
me
rac
y q
ue
sti
on
s:
pe
r ce
nt
giv
ing
in
corr
ec
t re
sp
on
se
by
nu
me
rac
y l
ev
el
Ne
w l
ev
el
All
Me
nW
om
en
Ve
ryP
oo
rA
ve
rag
eG
oo
dD
isc
M
en
-p
oo
rIn
de
xW
om
en
%%
%%
%%
%%
%
FO
UN
DA
TIO
N L
EV
EL
1.
Ca
lcu
lati
on
of
ch
an
ge
: Yo
u b
uy
two
ite
ms a
t a
sh
op
an
d t
he
to
tal
co
me
s t
o
£1
7.8
9.
Wh
at
is t
he
ch
an
ge
fro
m £
20
?F
15
14
16
34
15
74
30
-2
2.
Pro
gra
mm
ing
a v
ide
o r
eco
rde
r:
a)
In 2
4 h
ou
r c
loc
k t
ime
, w
ha
t ti
me
do
yo
u p
rog
ram
th
e v
ide
o t
o s
tart
re
cord
ing
?F
13
10
16
35
11
52
33
-5
b)
In 2
4 h
ou
r cl
ock
tim
e,
wh
at
tim
e d
o y
ou
pro
gra
m t
he
vid
eo
to
fin
ish
re
cord
ing
?F
16
11
20
39
13
74
35
-9
c)
Wil
l a
4 h
ou
r ta
pe
be
en
ou
gh
?F
12
91
52
51
29
42
1-6
LE
VE
L 1
1.
Ca
lcu
lati
on
of
coin
s:
ho
w m
an
y c
oin
s w
ou
ld y
ou
giv
e a
lto
ge
the
r?2
40
39
41
64
46
37
16
48
-2
2.
Ca
lcu
lati
on
of
an
are
a o
f a
sh
ap
e:
wh
at
is t
he
are
a o
f th
is s
ha
pe
?X
67
59
74
97
87
63
27
70
-15
3.
Re
ad
ing
a t
ab
le:
ho
w m
an
y su
bje
cts
ha
d m
ore
en
tra
nts
wit
h m
ath
em
ati
cs
A l
eve
l in
19
79
th
an
in
19
73
?2
42
40
45
83
50
30
97
4-5
4.
Bu
yin
g a
ca
r: a
) W
ha
t is
th
e d
ep
os
it?
12
31
92
76
22
27
16
1-8
LE
VE
L 2
1.
Bu
yin
g a
ca
r: b
) If
yo
u p
ay
mo
nth
ly i
nsta
lme
nts
, h
ow
mu
ch
do
yo
u h
ave
to
pa
y
ea
ch
mo
nth
?X
75
73
76
98
91
79
38
60
-3
2.
Arr
an
gin
g h
oli
da
ys
: a
) W
he
n c
ou
ld y
ou
go
?1
26
21
31
62
31
92
60
-10
b)
Wh
at
wo
uld
be
th
e t
ota
l re
turn
co
st
for
bo
th t
o g
o i
n y
ou
r c
ar?
25
04
45
48
86
13
61
77
1-1
0
3.
Ca
lcu
lati
ng
pri
ce
s:
a)
Wh
at
is t
he
dif
fere
nce
in
pri
ce
be
twe
en
th
e t
wo
ja
ck
ets
aft
er
the
re
du
cti
on
s?
X8
98
69
21
00
99
96
66
34
-6
b.
Wh
ich
is c
he
ap
er?
24
23
64
67
64
63
61
06
6-1
1
4.
Re
ad
ing
a t
ab
le:
Wh
at
% o
f th
e t
ota
l n
um
be
r o
f stu
de
nts
did
en
gin
ee
rin
g
an
d t
ech
no
log
y in
19
73
?2
48
36
58
90
68
30
78
3-2
2
n =
1,6
21
74
68
75
43
53
47
38
94
52
Dis
c I
nd
ex =
Dis
cri
min
ati
on
s I
nd
ex

Research Report48
3.5.2 Amendments to questions for the Basic Skills Pilot
Although, in essence, the questions remained the same, amendments were made to six
literacy and two numeracy questions before piloting. (See basic skills appendix for the
showcards and corresponding questions used in the 2004 survey.)
■ L1a and L1b: a new page from yellow pages was selected. The page used in 1991 was taken
from the 1990/01 Yellow Pages for the Coventry area. Since that time, the area telephone
dialling code had changed and much of the information was out of date. A similar page from
the 2003/04 Yellow Pages for the Coventry area was again selected.
■ L2a and L2b: a new map was selected. In 1991, the map was of a part of Scotland, primarily
selected as the survey was only carried out in England and Wales44. To not favour those living
in Scotland, a map of part of Ireland was selected.
■ L3b and L3c: additional alternatives to what constituted a correct answer were included. The
correct answer to these questions required the interviewer to understand some fairly complex
bar charts.
■ N2a and N3a: new images and prices for the items on the two showcards were selected. The
previous images were very old fashioned and the prices unrealistic.
3.5.3 Results from the Basic Skills Pilot
The open-response questions were to be attempted by all respondents taking part in the pilot
study (n=177). The open-response literacy questions followed the multiple-choice literacy
questions, similarly for the open-response numeracy questions. The open-response literacy
questions took an average time of 3:47 minutes to complete; the open-response numeracy
questions 4:38 minutes.
Interviewers and respondents found the transition to the open-response questions from the
multiple-choice questions was managed without any complication. However, the change from
multiple-choice to open-response to multiple-choice to open-response required quite a lot of
re-positioning by the interviewer, the respondent, and/or the position of the computer screen.
Additional feedback from interviewers on specific questions is detailed in table A3.3 in the
basic skills appendix.
3.5.4 Amendments to questions for the dress rehearsal
In response to the interviewer feedback, additional amendments to the map and alternatives
to what constituted a correct answer for the two ‘bar chart’ questions took place in time for
the dress rehearsal. Some minor revisions to the wording used for other questions also took
place, but suggestions that were felt to fundamentally alter the difficulty of a question were
not put in place.
The order of the questions in the basic skills assessment was altered. The open-response
literacy and numeracy questions now came after all the multiple-choice literacy and
numeracy questions had been completed. This would reduce the time spent shifting seats and
position of the computer and any associated awkwardness.
Question N1c was dropped. This was to provide the best set of questions for covering the
national curriculum within the overall time constraints of the survey.
44. The survey was funded by the Basic Skills Agency, whose remit only includes England and Wales.
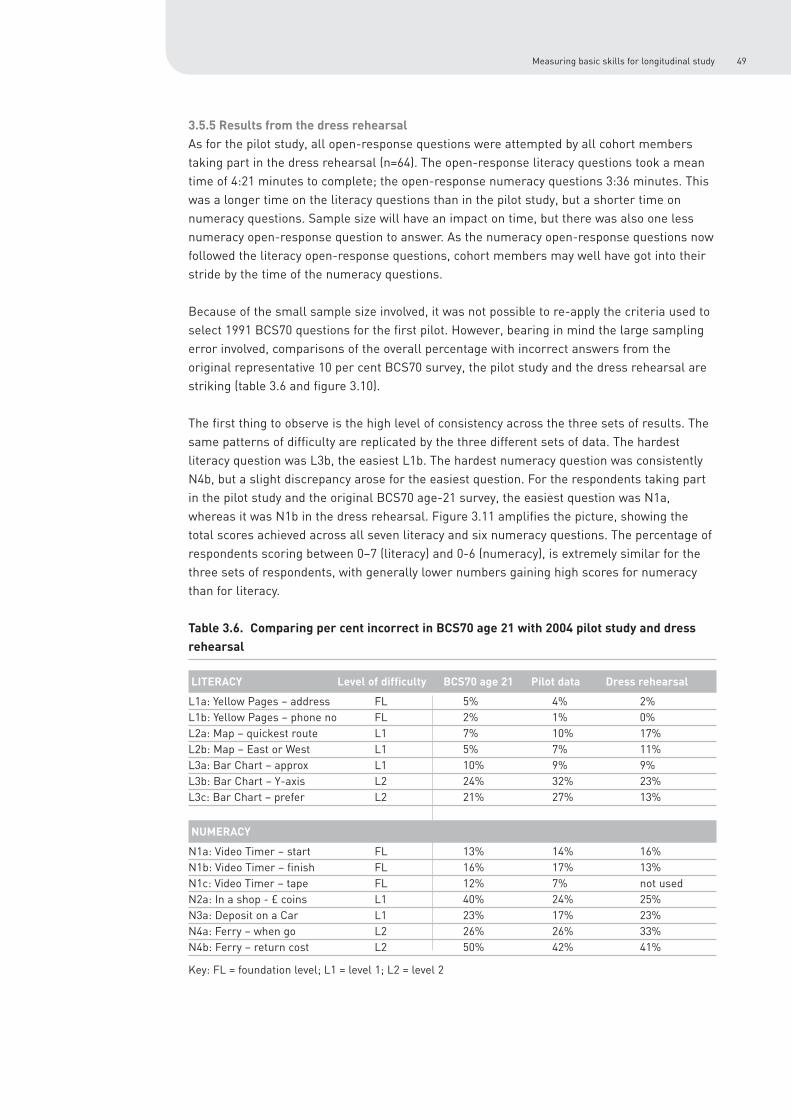
Measuring basic skills for longitudinal study 49
3.5.5 Results from the dress rehearsal
As for the pilot study, all open-response questions were attempted by all cohort members
taking part in the dress rehearsal (n=64). The open-response literacy questions took a mean
time of 4:21 minutes to complete; the open-response numeracy questions 3:36 minutes. This
was a longer time on the literacy questions than in the pilot study, but a shorter time on
numeracy questions. Sample size will have an impact on time, but there was also one less
numeracy open-response question to answer. As the numeracy open-response questions now
followed the literacy open-response questions, cohort members may well have got into their
stride by the time of the numeracy questions.
Because of the small sample size involved, it was not possible to re-apply the criteria used to
select 1991 BCS70 questions for the first pilot. However, bearing in mind the large sampling
error involved, comparisons of the overall percentage with incorrect answers from the
original representative 10 per cent BCS70 survey, the pilot study and the dress rehearsal are
striking (table 3.6 and figure 3.10).
The first thing to observe is the high level of consistency across the three sets of results. The
same patterns of difficulty are replicated by the three different sets of data. The hardest
literacy question was L3b, the easiest L1b. The hardest numeracy question was consistently
N4b, but a slight discrepancy arose for the easiest question. For the respondents taking part
in the pilot study and the original BCS70 age-21 survey, the easiest question was N1a,
whereas it was N1b in the dress rehearsal. Figure 3.11 amplifies the picture, showing the
total scores achieved across all seven literacy and six numeracy questions. The percentage of
respondents scoring between 0–7 (literacy) and 0-6 (numeracy), is extremely similar for the
three sets of respondents, with generally lower numbers gaining high scores for numeracy
than for literacy.
Table 3.6. Comparing per cent incorrect in BCS70 age 21 with 2004 pilot study and dress
rehearsal
LITERACY Level of difficulty BCS70 age 21 Pilot data Dress rehearsal
L1a: Yellow Pages – address FL 5% 4% 2%
L1b: Yellow Pages – phone no FL 2% 1% 0%
L2a: Map – quickest route L1 7% 10% 17%
L2b: Map – East or West L1 5% 7% 11%
L3a: Bar Chart – approx L1 10% 9% 9%
L3b: Bar Chart – Y-axis L2 24% 32% 23%
L3c: Bar Chart – prefer L2 21% 27% 13%
NUMERACY
N1a: Video Timer – start FL 13% 14% 16%
N1b: Video Timer – finish FL 16% 17% 13%
N1c: Video Timer – tape FL 12% 7% not used
N2a: In a shop - £ coins L1 40% 24% 25%
N3a: Deposit on a Car L1 23% 17% 23%
N4a: Ferry – when go L2 26% 26% 33%
N4b: Ferry – return cost L2 50% 42% 41%
Key: FL = foundation level; L1 = level 1; L2 = level 2

Research Report50
Figure 3.10: comparing per cent incorrect in BCS70 age 21 with per cent incorrect in 2004
Basic Skills Pilot and dress rehearsal
Note: numeracy question N1c was not included in the dress rehearsal
BCS70 AGE 21
PILOT STUDY
DRESS REHEARSAL
Numeracy questions
pe
rce
nta
ge
N1a N1b N1c N2a N3a N4a N4b0
10
20
30
40
50
individual numeracy questions
BCS70 AGE 21
PILOT STUDY
DRESS REHEARSAL
Literacy questions
pe
rce
nta
ge
L1a L1b L2a L2b L3a L3b L3c
individual literacy questions
0
10
20
30
40
50

Measuring basic skills for longitudinal study 51
Figure 3.11: comparing total scores by cohort members for questions in BCS70 age 21 with
2004 Basic Skills Pilot and dress rehearsal
BCS70 AGE 21
PILOT STUDY
DRESS REHEARSAL
Numeracy: per cent of respondents/cohort members with different numbers of questions correct
pe
rce
nta
ge
0 1 2 3 4 5 6
total numeracy score for 6 questions
0
10
20
30
40
50
60
BCS70 AGE 21
PILOT STUDY
DRESS REHEARSAL
Literacy: per cent of respondents/cohort members with different numbers of questions correctp
erc
en
tag
e
0 1 2 3 4 5 6 7
total literacy score for 7 questions
0
10
20
30
40
50
60

Research Report52
3.6 Converting overall performance in literacy and numeracy assessments into levels
It is anticipated that most analysts using the new BCS70 assessment data will wish to work
with total scores reflecting cohort members’ performance relative to that of the whole
population across the whole performance range. This assumes a reasonably high level of
reliability of the scores, to ensure that differences are not brought about by high levels of
measurement error. The reliability estimates for both literacy and numeracy surpassed the
levels generally considered acceptable for survey analysis purposes, exceeding 0.8 (alpha
coefficient) in both cases.45
However, an important element of the survey was also to be able to compare the BCS70
performances with those obtained in the National Baseline Survey in terms of the nationally
agreed levels. We cannot guarantee the same standards of reliability for this comparison
because of the relatively small number of items available to assess performance at each level
and the complexity, in scaling terms, of the adaptive testing approach. As we discuss below,
there were also problems in mapping precisely determination of levels from one survey to the
other. Hence, only a limited comparison could be undertaken and caution is needed in
interpreting the results.
By converting performance – the number of correct answers in both the multiple-choice and
open-response parts of the assessment – into levels, we were able to classify respondents by
their achieved level. There are many ways of doing this, and a number were tried out. Much
attention was given to the levels of the open-response questions. As discussed previously, in
figure 3.2, the levels of the open-response assessment items do not directly correspond with
the levels of the multiple-choice questions. To re-cap:
■ open-response foundation level questions fall across multiple-choice entry level 2 and entry
level 3.
■ open-response level 1 questions across multiple-choice entry level 3 and level 1.
■ open-response level 2 questions across multiple-choice level 1 and level 2.
Were the levels of the open-response items therefore to be downgraded or upgraded? The
dress rehearsal results suggest the open-response assessment items worked better if they
were downgraded. However, the number of cohort members taking part in the dress
rehearsal was small (n=64), so this decision will need to be looked at again following analysis
of results from all BCS70 cohort members in early 2005. Given these considerations, the
distribution of cohort members by levels, as shown in figure 3.12a and 3.12b, was restricted to
performance in the multiple-choice part of the assessment; it is based on the principle that to
pass a level at least half of the questions at a given level needed to be answered correctly
(see below).
3.6.1 For literacy
■ Below entry level 2: between 0 – 5 entry level 2 questions correctly.
■ Entry level 2: between 6 – 10 entry level 2 and 0 – 5 entry level 3 questions correctly.
■ Entry level 3: between 6 – 10 entry level 3 and 0 – 2 level 1 questions correctly.
■ Level 1: between 3 – 5 level 1 and 0 – 2 level 2 questions correctly.
■ Level 2: between 3 – 5 level 1 and 3 level 2 questions correctly.
45. Full details are reported in ’Measuring Basic Skills in Longitudinal Study’ (in preparation for the journal Literacy and
Numeracy Studies).

Measuring basic skills for longitudinal study 53
3.6.2 For numeracy
■ Below entry level 2: between 0 – 3 entry level 2 questions correctly.
■ Entry level 2: between 4 – 5 entry level 2 and 0 – 2 entry level 3 questions correctly.
■ Entry level 3: between 3 – 4 entry level 3 and 0 – 3 level 1 questions correctly.
■ Level 1: between 4 – 5 level 1 and 0 – 2 level 2 questions correctly.
■ Level 2: 3 level 2 questions correctly.
As shown in figures 3.12a and 3.12b, comparisons with the results of the National Baseline
Survey are remarkably consistent, despite such differences in sample size46. The distribution
of respondents by numeracy levels is particularly striking. For literacy, an identical
percentage was placed at entry level 3 or lower (13 per cent), although the spread of cohort
members in the dress rehearsal placed more of them at the ‘bottom’ (entry level 2 and below)
or ‘top’ (level 2 and above) end of the levels classification.
Figure 3.12a. ‘Profiles of competence’ based on national standards for adult literacy:
comparison of BCS70 dress rehearsal with National Baseline Survey results
Figure 3.12b. ‘Profiles of competence’ based on national standards for adult numeracy:
comparison of BCS70 dress rehearsal with National Baseline Survey results
BCS70 DRESS REHEARSAL
BASELINE SURVEY
pe
rce
nta
ge
entry level 2 or below entry level 3 level 2 or abovelevel 1
numeracy performance
10
20
30
40
50
60
BCS70 DRESS REHEARSAL
BASELINE SURVEY
pe
rce
nta
ge
entry level 2 or below entry level 3 level 2 or abovelevel 1
literacy performance
0
10
20
30
40
50
60
46. The Skills for Life survey report: A national needs and impact survey of literacy, numeracy and ICT skills, DfES Research
Brief RB490. N=7,874 respondents completed the literacy assessment; N=8040 respondents completed the numeracy
assessment.

Research Report54
3.7 Coverage of the National Curriculum
3.7.1 Literacy
The adult literacy core curriculum covers ‘Speaking and Listening’, ‘Reading’ and ‘Writing’.
The items in the Baseline Survey cover aspects of reading and writing only 47. There are three
main aspects of reading and writing covered by the adult literacy core curriculum. These are:
Reading
■ Reading Comprehension (RC).
■ Grammar and Punctuation (GP-R).
■ Vocabulary, Word Recognition, Phonics (VWRP).
Writing
■ Writing Composition (WC).
■ Grammar and Punctuation (GP-W).
■ Spelling and Handwriting (SH).
The aspect of the curriculum each item covers is taken from the detailed description provided
for the items in the Baseline Survey. As with this survey, item selection heavily concentrated
on the many aspects of ‘Reading Comprehension’. However, ‘Writing Composition’, ‘Grammar
and Punctuation’ and ‘Spelling and Handwriting’ are also covered by items on both the lower
and upper tiers (see table A3.2a in the basic skills appendix). A sample of handwriting,
obtained from each cohort member at the end of the interview, provides a more complete
picture of their literacy.
3.7.2 Numeracy
Seven aspects of number skill from the numeracy curriculum were assessed by the items in
the original Baseline Survey. These were:
■ Basic Money (BM).
■ Whole Numbers and Time (NT).
■ Measures and Proportion (MP).
■ Weights and Scales (WS)..
■ Length and Scaling (LS).
■ Charts and Data (CD).
■ Money Calculations (MC).
Other than ‘Basic Money’, at least one question at each level of difficulty was available for
selection for each aspect of number skill assessed. Questions on ‘Basic Money’ ranged in
difficulty from entry level 1 up to entry level 3. Although the Baseline Survey included
questions set at entry level 1, very few adults had difficulty with these questions. Within the
design constraints of the cohort assessment, questions set at this level of difficulty were not
included.
47. The work undertaken by colleagues at CDELL for the Baseline Survey pre-dated the National Adult Literacy Core
Curriculum document. The National Standards for Adult Literacy (QCA 2000) were used instead. Each question was designed
to meet a specific criterion or criteria for reading and/or writing. Level 1 and level 2 questions were based on multiple-choice
items used in the national key skills tests. However, some questions needed re-formatting for computer-based use.

Measuring basic skills for longitudinal study 55
Figure 3.13 shows that, with the inclusion of the six open-response questions, the seven
different aspects of the curriculum are covered by at least three questions. If this was not
always possible, the easier alternative was selected. ie, if the level 1 question was not suitable
for selection, the entry level 3 rather than level 2 question was selected.
Figure 3.13. Aspects of the curriculum covered by the numeracy multiple-choice questions
Multiple-choice Open response
Whole Numbers and Time (NT) EL3 L1 FL
Measures and Proportion (MP) EL3 L1 L2
Weights and Scales (WS) EL2 L1 L2
Length and Scaling (LS) EL2 L1 L2
Charts and Data (CD) EL2 L1 L2
Money Calculations (MC) EL2 EL3 L1 L2 L2
Basic Money (BM) EL2 EL3 L1
FL = foundation level L = level EL = Entry level
Handwriting
Collecting samples of handwriting has a long history in cohort study research. Back in 1969,
when NCDS cohort members were aged 11, they were given 30 minutes to write a short essay
on ‘Imagine that you are now 25 years old. Write about the life you are leading, your interests,
your home life and your work at the age of 25’. In 1980, when BCS70 cohort members were
aged 10, they each copied out the sentence ‘The quick brown fox jumps over the lazy dog’. As
adults, a sample of handwriting was collected from the 10 per cent of cohort members who
took part in the basic skills assessments. In 1991, when aged 21, BCS70 cohort members
were asked to write down how they had found the skills assessment. In 1995, when aged 37,
NCDS cohort members were asked to complete a job application form as part of the literacy
assessment.
As all BCS70 cohort members taking part in 2004 attempted the multiple-choice and open-
response literacy assessment questions, it was essential to collect a sample of handwriting to
complete the picture of their literacy. Cohort members in the main fieldwork were asked to
write a couple of sentences on what they have liked or disliked about being a part of BCS70
over the last 34 years48. A sample of handwriting was obtained, revealing competence in
spelling, grammar and punctuation together with skills in layout and presentation of writing.
Methods of coding such writing data in terms of such dimensions have been developed in the
previous surveys and will be applied to the new data. This will supply data for comparison not
only from childhood to adulthood, but in the case of the sub-sample studies, within adulthood
as well.
Importantly, the writing task will also enable us to gain from cohort members insights into
what it has been like to be part of national longitudinal survey from the day they were born,
including any thoughts they have about the assessment elements of it. Analysis of cohort
members’ positive and negative experiences of being part of BCS70 is also an important
source of information for the development of the cohorts studies programme in its own right.
48. This exercise was not piloted, but was adopted once the writing/copying task from the DAST battery of exercises was
dropped. See chapter 4.

Research Report56
4 Dyslexia
4.1 Measuring symptoms of dyslexia
The final part of the adult assessment was to measure the prevalence of some of the
symptoms associated with dyslexia. The word ‘dyslexia’ is Greek in origin and means
‘difficulty with words’. Though the precise origins and meaning of the syndrome has attracted
controversy49, it is generally believed that dyslexia usually arises from a difference in the brain
area that processes language-based information and affects the underlying skills that are
needed for learning to read, write and spell. Environmental factors also impact upon dyslexia,
with symptoms found in people from all socio-economic and education groups, from those
who cannot read to those with higher education awards50. It is estimated that around 4 per
cent of the population is severely dyslexic, with a further 6 per cent having mild to moderate
problems51.
BCS70 cohort members had symptoms of dyslexia assessed when they were 10 years old,
when three short individual measures from The Bangor Dyslexia Test52 were administered, in
conjunction with other cognitive assessments, on more than 12,000 cohort members. Analysis
of the data has estimated between 2–4 per cent of the cohort members were dyslexic to some
degree53. By re-assessing the cohort members at age 34, we will have a unique opportunity
to:
■ obtain a true estimate of the spread of dyslexic symptoms in a representative adult
population;
■ see what, if any, symptoms are lost or acquired over time;
■ see which symptoms are most persistent;
■ look at the relationship between dyslexia, literacy and numeracy scores; and
■ compare past experiences and adult outcomes for ‘dyslexic’ adults with their non-dyslexic
peers.
4.2 The Dyslexia Adult Screening Test (DAST)
After much advice and consultation, the Dyslexia Adult Screening Test (DAST)54 was the
preferred instrument for use in the 2004 survey. Although the DAST does not measure
precisely the same symptoms associated with dyslexia as were measured by The Bangor
Dyslexia Test at age 10, its use was supported by Professor Tim Miles, who devised the
49. Rice, M and Brooks, G (2004). Developmental Dyslexia in Adults: a Research Review. London: NRDC.
50. This information is extracted from the websites detailed. For further information, refer to the British Dyslexia Association
(www.bda-dyslexia.org.uk), the Bangor Dyslexia Unit (www.dyslexia.bangor.ac.uk) and the Dyslexia Institute (www.dyslexia-
inst.org.uk ).
51. These estimates are primarily obtained from school populations, but as dyslexia has neurological origins, the occurrence in
adults will essentially be the same.
52. The Bangor Dyslexia Test contains ten items. The three selected measures were: The Left-Right Test (involving naming body
parts), and the Months Forward and Months Reversed tests (sequential recall of months of the year). See Miles, T R
(1982/1997). The Bangor Dyslexia Test. Wisbech, Cambs: Learning Development Aids.
53. Miles, T R and Haslum, M N (1986). ‘Dyslexia: Anomaly or normal variation?’ Annals of Dyslexia, 36, pp 103–117. Miles, T R,
Wheeler, T J and Haslum, M N (2003). ‘The Existence of Dyslexia without Severe Literacy Problems’. Annals of Dyslexia, vol 53,
pp 340–349.
54. Fawcett, A. J. and Nicolson, R. I. (1998). The Dyslexia Adult Screening Test (DAST). London: The Psychological Corporation.

Measuring basic skills for longitudinal study 57
Bangor test, as offering good continuity with the earlier assessment55. The DAST is based on
the Dyslexia Screening Test (DST), a battery of 11 tests used to identify children ‘at risk’ of
dyslexia56. These tests were modified to support adult screening and led to the publication of
DAST in 1998. DAST comprises a battery of 11 tests, of which three are educational
attainment measures and eight are diagnostic measures directed at identifying dyslexia
symptoms. These are listed in figure 4.1. See the DAST manual for full details. There are
some similarities between some of these measures and those used in the 1992 US National
Adult Literacy Survey (NAAL), which offers another basis for comparison.57
Figure 4.1. DAST attainment and diagnostic measures
The three attainment measures:
One-Minute Reading: reading aloud as many as possible of 120 words in the time limit
Two-Minute Spelling: a written spelling exercise – a maximum of 40 words
One-Minute Writing: transcription of a short passage.
The eight diagnostic measures:
Rapid Naming: time taken to name a page full of outline drawings
Postural Stability: ability to balance after a push in the back
Phonemic Segmentation (including Spoonerisms): ability to split words into their constituent sounds
Backwards Digit Span: ability to use working memory
Nonsense Passage Reading: ability to read ‘made up’ or ‘nonsense’ words that the reader has never
seen before
Nonverbal Reasoning: a rough measure of fluid intelligence
Verbal and Semantic Fluency: indication of strengths accompanying weaknesses. i.e. good semantic
fluency may go with poor verbal fluency.
4.3 Selecting the DAST exercises
After lengthy consultation with a leading expert on the use of/design of the DAST, Angela
Fawcett58, six of the DAST exercises were piloted. Time restrictions would limit the final
assessment to four DAST exercises but, as each exercise had specific rules and
administration points, it was important to pilot more than we would ultimately use. We
wanted the best set of exercises to capture the different and diverse experiences of dyslexia in
our population, but also the exercises that could best be reliably administered by interviewers
in cohort members’ own homes. In summary, the first three exercises measure the fluency of
literacy skills (attainment), and the second three exercises the underlying phonological skills
(diagnostic). These aspects are known to be impaired in adults with dyslexic symptoms, and
fluency can show up problems in even high-achieving dyslexics59.
55. At the 6th BDA International Conference, Allyson G Harrison and Eva Nichols presented A Validation Of The Dyslexia Adult
Screening Test (DAST) In A Post Secondary Population in Canada. The DAST was administered to 116 students with Specific
Learning Disabilities (SLD) and 122 volunteer control subjects. The DAST correctly identified 74 per cent of the students with a
SLD at-risk for dyslexia. However, the DAST misidentified 26 per cent of SLD students as not being at risk for dyslexia, and 16
per cent of the control group as being at risk for dyslexia, even though almost all control group students reported no history of
any learning or reading problems. Despite this, the DAST does have a higher than acceptable false positive rate. Suggestions
were offered for recalculation of the data and a clustering of the subtests to maximize differentiation between subject groups.
56. For further details, see Fawcett, A J, Nicolson, R I and Dean, P (1996). ‘Impaired performance of children with dyslexia on a
range of cerebellar tasks’. Annals of Dyslexia, 46, pp 259–283.
57. See http://nces.ed.gov/naal
58. Dr. Angela Fawcett, Department of Psychology, University of Sheffield, Sheffield S10 2TP.
59. Miles, T R and Miles, E (1999). Dyslexia: A Hundred Years On. 2nd edition. Buckingham: Open University Press.

Research Report58
The six DAST exercises selected for piloting were:
■ One-Minute Reading: demanded a speedy as well as accurate performance. Respondents
read aloud as many words as they could in one minute. There was a maximum of 120 words.
The words started easy and increased in difficulty;
■ Two-Minute Spelling: assessed speed as well as accuracy of spelling, also involves speed of
writing. There was a maximum of 32 words (40 if early errors were made). Again, the words
started easy and increased in difficulty;
■ One-Minute Writing: assessed the speed and accuracy of transcription of a short passage;
■ Phonemic Segmentation: assessed ability to split words into their constituent sounds;
■ Spoonerisms: a more complex measure of segmentation ability, which involved a higher
memory load; and
■ Nonsense Passage Reading: ability to read ‘made up’ or ‘nonsense’ words that the reader has
never seen before. Thought to be the task most sensitive to dyslexia.
DAST provided a complete change of direction for respondents and interviewers alike. Once
interviewers had practised administering the DAST exercises to both familiarise themselves
with the words and the specific requirements of each exercise, for example the fast pace
respondents needed to read the words in the One-Minute Reading exercise, or the best way to
sit to observe the One-Minute Spelling exercise, the feedback from interviewers after the pilot
study was, overall, very positive. The majority reported that respondents really enjoyed these
exercises, and the interview ended on a high note. Some interviewers remarked that it gave
all respondents a chance to do well at something, and that it finished the interview on a
positive note, away from possible anxieties raised by the literacy and numeracy assessments.
After much consideration and consultation with Angela Fawcett and examination of the pilot
results, the One-Minute Writing and the Phonemic Segmentation exercises were dropped and
the Two-Minute Spelling exercise was reduced to one minute60. The four exercises selected
were felt to be the best combination of exercises, given time restrictions. Reading and
Spelling were particularly strong candidates for selection, given their obvious relationship
with basic literacy skills. Spoonerisms were preferred to the Phonemic Segmentation
exercise as they captured a more complex skill, were quick to administer and were found
great fun by the vast majority of respondents. Although the most demanding of the exercises
for both respondents and interviewers alike, the Nonsense Passage Reading exercise was
included as it seemed particularly good at identifying difficulties among adults who had
performed well on the other DAST exercises.
In addition to the DAST exercises, the Adult Dyslexia Checklist, or the Vinegrad Checklist61
was included as part of the short interview included in the pilot study. This short
questionnaire can be used to screen relatively large adult populations, for example a group of
students involved in the first year of further or higher education. Figure 4.2 details the 20
simple ‘yes-no’ questions that make up the Vinegrad Checklist. Based on total scores from
completion of the Vinegrad Checklist, two groups of adults ‘non-dyslexics’ (0–7) and
‘dyslexics’ (8 plus) can be defined. A score of 8 or more ‘yes’ responses’ is expected in around
11 per cent of a given sample/population. As an additional tool for selecting the ‘best’
60. Alternate words (as they appeared in the list) were chosen. Cohort members had to spell a total of 16 words, with four
additional ‘easier’ words.
61. Although this originated in the Dyslexia Institute, it was later revised by Michael Vinegrad and since became known as the
Vinegrad Checklist. Vinegrad, M (1994) “A Revised Adult Dyslexia Checklist”. Educare, 48, pp 21–23.

Measuring basic skills for longitudinal study 59
exercises from DAST, respondents’ scores in the DAST exercises included in the pilot study
were compared against their score on the Vinegrad Checklist.
Figure 4.2. Vinegrad Checklist
1. Do you find difficulty telling left from right?
2. Is map-reading or finding your way to a strange place confusing?
3. Do you dislike reading aloud?
4. Do you take longer than you should to read a page of a book?
5. Do you find it difficult to remember the sense of what you have read?
6. Do you dislike reading long books?
7. Is your spelling poor?
8. Is your writing difficult to read?
9. Do you get confused if you have to speak in public?
10. Do you find it difficult to take messages on the telephone and pass them on correctly?
11. When you say a long word, do you sometimes find it difficult to get all the sounds in the right order?
12. Do you find it difficult to do sums in your head without using your fingers or paper?
13. When using the telephone, do you tend to get the numbers mixed up when you dial?
14. Do you find it difficult to say the months of the year forwards in a fluent manner?
15. Do you find it difficult to say the months of the year backwards?
16. Do you mix up dates and times and miss appointments?
17. When writing cheques, do you frequently find yourself making mistakes?
18. Do you find forms difficult and confusing?
19. Do you mix up bus numbers like 95 and 59?
20. Did you find it hard to learn your multiplication tables at school?
4.4 Adapting the DAST materials and interviewer instructions
A lot a work went into the design of the DAST materials at each stage of development.
Protocols: the exact protocols and instructions as they appeared in the DAST manual were
used for each of the DAST exercises. Interviewers read these verbatim to respondents at the
start of each exercise.
Paper and computer use: the DAST exercises are a paper-based instrument, but interviewers
used the computer to administer various parts of the exercises, particularly in the Basic Skills
Pilot Study, when it was essential that interviewers recorded how long each exercise took to
complete. The instructions the interviewers read out to the respondents were also on the
CAPI screen in the pilot. Interviewer feedback following the pilot clearly indicated the DAST
should be entirely administered on paper. This was mainly due to the additional demands
placed on the interviewer during these exercises. For example, interviewers had to maintain
rapport with the respondent while evaluating their performance, operate an electronic timer
and enter information into the computer. With this in mind, only brief instructions for the
interviewer remained in CAPI for the dress rehearsal, and for the main fieldwork interviewers
only had to press the ENTER key at the start and end of the DAST exercises. This was to
record the time taken to complete the whole DAST section. All interviewer instructions for
carrying out each of the DAST exercises were now included in the booklet. More details of the
difficulties met by interviewers are provided in table A4.1 in the dyslexia appendix.

Research Report60
Recording respondent scores: as only six of the original 11 DAST exercises were used, the
original DAST score sheet used for recording respondents’ scores and times needed much
revision. The amount of specific scoring that interviewers had to do in a respondent’s home
was also reduced to minimise interviewer burden and risk a respondent feeling
uncomfortable and the interviewer being viewed as an assessor or teacher. These feelings
were particularly likely to occur if the respondent felt they had performed poorly.
Two interviewer DAST booklets and one respondent DAST booklet were designed for the basic
skills pilot. The two interviewer booklets were needed to pilot different ways of laying out how
interviewers recorded the scores for the One-Minute Reading and the Nonsense Passage
Reading exercises62. After some experimentation, the following symbols were agreed:
Version A – ‘/’ for correct, ‘O’ for an error, ‘—’ for pass (and ‘s’ for semi-correct for the
Nonsense Passage Reading).
Version B – ‘C’, ‘E’ and ‘P’ were printed by each word, so that the interviewer need only circle
or strike through the appropriate mark. Examples of alternative DAST interviewer grids are
given in figure 4.3.
Figure 4.3. The two examples of marking the DAST One-Minute Reading test (also used for
the Nonsense Passage Reading exercise)
Correct = / Error = O Pass = —
Version A
pat ■■ bridge ■■ concert ■■ magnitude ■■fog ■■ freight ■■ village ■■ formation ■■king ■■ evil ■■ payment ■■ Insurance ■■oil ■■ poet ■■ express ■■ Principal ■■
Version B
Correct = C Error = E Pass = P
pat C E P bridge C E P
fog C E P freight C E P
king C E P evil C E P
oil C E P poet C E P
Interviewers expressed an overwhelming preference for version B of the interviewer booklet
at the basic skills pilot de-briefs, however neither design was convenient for left-handers63.
The four DAST exercises selected after the pilot study resulted in no further need for a
separate DAST booklet for cohort members. In the dress rehearsal, cohort members were
62. The original protocols used a simple grid and suggested the scorer write ‘C’ for correct, ‘E’ for error and ‘P’ for pass by
each word or item. ‘C’ and ‘E’ were rejected as being too similar, with the potential for coding mistakes to occur when
responses were counted and/or entered, particularly if the codes were counted after the interview or by a different person.
Obvious symbols, such as ‘ü’ for correct were considered unacceptable, as was the option of only marking errors and passes,
which might let respondents infer how well or badly they were doing.
63. A revised booklet was provided for left-handed interviewers in the dress rehearsal, but those involved did not feel it
benefited them and was thus not included in the materials for the main fieldwork. However, some left-handed interviewers
struggled in the early stages of fieldwork and an updated version for left-handers was subsequently designed.

Measuring basic skills for longitudinal study 61
given a sheet of paper to complete the One-Minute Spelling exercise. Interviewers would
attach this to the interviewer DAST booklet for easy identification. For the main fieldwork,
with the inclusion of the free writing exercise, additional pages were included in the DAST
booklet for cohort members to write their thoughts and complete the One-Minute Spelling
exercise.
One-Minute Reading exercise: interviewers reported that some respondents took the speed
element very seriously and several read out the words extremely fast, which caused problems
for the interviewers. In order to keep pace, most interviewers stopped recording correct
readings and noted errors and passes only. (Correct responses were then marked post-
interview.) They felt that they managed do this without the respondents being aware, not least
because the latter were focused on reading the list. In light of this, instructions to
interviewers were adapted successfully for the dress rehearsal and kept for the main
fieldwork.
Nonsense Passage Reading exercise: to calculate an accurate score for the Nonsense
Passage Reading exercise, time taken had to be considered. In the basic skills pilot study,
interviewers had been asked to record this time in seconds. A relatively high numbers of
errors were recorded for this, most likely as a result of the timer displaying time in minutes
and seconds, thus the interviewers had a small calculation to perform. In response to the
difficulties encountered, interviewers in the dress rehearsal and main fieldwork were not
required to convert remaining minute(s) and seconds at the end of the exercise to seconds.
They just had to record what was on the timer, for example, 1 minute 25 seconds not 85
seconds.
Interviewers were asked to code semi-correct readings of nonsense words, and it was unclear
after the pilot study whether this required too subjective a judgment or whether interviewers
were able to apply standardised rules. After a lot of consideration, interviewers were asked to
code semi-correct readings of nonsense words in the dress rehearsal and main fieldwork. If
data quality is in doubt, ‘semi-correct’ and ‘incorrect’ response categories can be collapsed
together.
Timing the exercises: three of the exercises were timed and interviewers were supplied with
simple electronic timers that counted down. When (if) the interviewer stopped the timer early,
i.e. if the respondent completed the task early, the interviewer just had to write the seconds
left on the timer down in the booklet.
Stopping rules: discontinuation instructions were given for most exercises. These referred to
respondent distress, or consecutive errors or passes. In practice, interviewers felt that each
exercise should be discontinued only if the respondent showed distress or refused to go on.
To stop respondents who remained happy to continue with the exercise despite making errors
created more problems than it solved.
Interviewer difficulties: two of the 16 interviewers participating in the pilot study found that
their own dyslexic symptoms made administering the DAST exercises difficult. Each of them
found ways of coping but, in the main stage of fieldwork, the research team offered all
interviewers the opportunity of talking over any concerns they had felt after they had been
briefed to do the survey and if necessary withdrawing from working on it.
Briefings: a lot of time was spent improving the briefing and written instructions given to

Research Report62
interviewers involved in the main fieldwork on how to carry out the DAST exercises. As in the
pilot and dress rehearsal briefings, a combination of training and practical exercises was
used. In the pilot and dress rehearsal briefings, members of the research team performed the
One-Minute Reading and Nonsense Passage Reading exercises ‘live’, but as the members of
the research team knew the exercises very well by the time of the pilot and dress rehearsal
briefings, the performances were somewhat ‘staged’. In the main fieldwork briefings,
interviewers listened to recordings of the exercises being read and gained practice at marking
the responses in the DAST booklet. The recordings used were examples of the exercises being
read by some of our colleagues for the first time thus the mistakes and hesitations were
‘real’64. This ensured that all interviewers received the same practices and the ‘realness’ of
the exercises remained as fresh for the last briefing as it had been for the first. Although the
sound quality varied across briefing venues, the research team gained a much clearer view of
an interviewer’s grasp of the required task and their initial performance. This was particularly
important for the few relatively inexperienced interviewers involved with the survey.
Early feedback received during main fieldwork briefings from interviewers who had been
involved in the basic skills pilot and/or dress rehearsal has been very positive. The briefings
have been very engaging and the interviewers have felt very prepared by the end of a long,
complex but fun briefing. All interviewers were asked to practise administering the DAST
exercises on friends and family before their first interview, but the majority view has been that
‘different’ and potentially difficult tasks for interviewers to carry out have been presented very
clearly.
4.5 DAST exercises and results from the Basic Skills Pilot and dress rehearsal
4.5.1 Time taken to administer the DAST exercises
In the basic skills pilot study, the ‘time’ for each DAST exercise was recorded by interviewers
in their booklets. This ‘time’ included time taken to explain the exercise, the exercise itself,
and the time taken by interviewers to answer relevant questions for each exercise in the
interviewer booklet. Time was recorded in exact minutes only. In addition to this, interviewers
had to press the ‘enter’ key on the computer at the end of each exercise to produce a ‘time’ in
CAPI. However, the range of time was very wide, as some interviewers forgot to press the
enter key, thus the information was considerably less precise than ‘real’ CAPI time stamps. In
the dress rehearsal, the timings of the individual dyslexia exercises were not recorded, thus
only overall time taken to administer the four exercises could be calculated.
Table 4.1 shows the mean (average) time for all six DAST exercises was 17:42 minutes, nearly
eight minutes too long. Using the pilot data as a guide, the average time it would take a
cohort member to complete the four selected DAST exercises would be 11:36 minutes. This
was still too long. After further consultation with Angela Fawcett, the Spelling exercise was
reduced by half, which suggested that the four DAST exercises would take approximately 9:39
minutes. Other administrative changes introduced would ease the demands placed on the
interviewers and hopefully reduce the average time further. The actual mean time was 10:06
minutes65. As this was just six seconds above the allocated amount of survey time, no further
‘cuts’ were necessary.
64. Many thanks to colleagues in NRDC and the Centre for Longitudinal Studies (CLS), custodians of the cohort studies, for
their time and willingness for their attempts to be used as part of the briefing process.

Measuring basic skills for longitudinal study 63
Table 4.1. Average time taken to complete the DAST exercises
Pilot study Dress rehearsal
Average time Average time
Estimated Actual
One-Minute Reading 3 : 36 mins One-Minute Reading 3 : 36 mins
Two-Minute Spelling 3 : 54 mins One-Minute Spelling 1 : 57 mins
One-Minute Copying 2 : 54 mins
Phonemic Segmentation 3: 12 mins
Spoonerisms 1: 48 mins Spoonerisms 1 : 48 mins
Nonsense Passage 2: 18 mins Nonsense Passage 2 : 18 mins
Total Time 17: 42 mins 9 : 39 mins 10:06 mins
4.5.2 One-Minute Reading exercise
An adult experiencing some of the symptoms associated with dyslexia, who may be regarded
as successful, can still have greater problems when reading under time constraints. The
exercise comprised a list of 120 words, graded in difficulty, which the respondent had to read
aloud as fast and as accurately as they could in one minute.
A practice list of six words is used in DAST, but this was not felt to be necessary to use on
cohort members66. Cohort members are trained respondents, and as such are very used to
following interviewer instructions and being assessed.
There were two lists of 120 words – form A or B. Form B was only to be used if there was a
disruption during the reading aloud of words on form A. Form B was not used in the pilot
study and was dropped for the dress rehearsal and main stage. If the exercise was
interrupted, a second attempt was not permitted. This brought the One-Minute Reading
exercise in line with the other three selected DAST exercises.
Each of the 120 words could be read ‘correctly’, ’incorrectly’ or ‘passed’ (either the
respondent did not attempt to read the word and said ‘pass’, or they inadvertently missed it
out). One point was awarded for each word read correctly. If all the words were read aloud in
less than one minute (even if a respondent had passed on one or two words), an additional
point was awarded for each second left on the timer. For example, if a respondent finished in
57 seconds, three points would be awarded.
Results
Table 4.2 shows the average number of words read correctly in one minute was 90 in the pilot
study, 98 in the dress rehearsal. The 19 per cent of respondents in the pilot study with a score
of 8 plus on the Vinegrad Checklist (dyslexics) read fewer words than their counterparts with
a score between 0–7 (non-dyslexics)67. Figure 4.4 shows the range of the scores achieved by
participants in both development studies. Although the average score achieved by BCS70
cohort members in the dress rehearsal was higher, the distribution of the scores was
markedly similar across the two sets of data. It is also notable that the mean score was
65. In the dress rehearsal, the overall time to administer all four DAST exercises was calculated from the end of the previous
(numeracy open-ended) section of the CAPI questionnaire to the end time of the last (nonsense reading) DAST exercise. Time
calculations were provided by the NatCen research team.
66. As the practice words would not be used on cohort members, it was important to pilot the way we would actually administer
the exercise on the general public sample used in the pilot study.
67. 164 respondents completed the Vinegrad Checklist.

Research Report64
higher for the non-dyslexic group (94) compared with the dyslexic group (73), as identified by
the Vinegrad Checklist. This may be taken as evidence to support the test’s validity. Further
details of the results are provided in table A4.2 in the dyslexia appendix.
Table 4.2. Results of the One-Minute Reading exercise
N Score range Mean Median sd
Pilot Study: All 167 21–126 90 92 19.4
Non-dyslexics* 125 46–124 94 94 15.0
Dyslexics† 30 21–112 73 70 23.3
Dress rehearsal: All 64 39–130 98 100 20.3
sd = standard deviation
*Non-dyslexics = a score of 0–7 on the Vinegrad Checklist,
†Dyslexics = a score of 8–20 on the Vinegrad Checklist.
Figure 4.4. Distribution of scores in the One-Minute Reading exercise
4.5.3 Two-Minute/One-Minute Spelling exercise
Time pressures can increase spelling errors amongst us all, but this is particularly so for
adults experiencing dyslexic symptoms. Dyslexic adults often have poor spelling, with their
grasp of spelling usually worse than their reading skills68. The original exercise consisted of
32 words, increasing in difficulty. If a respondent spelt two out of the first four words
incorrectly, the interviewer read out eight additional easier words, making a total of 40 words.
For the dress rehearsal and main stage survey, the exercise was reduced to one minute and
comprised 16 words, with four additional easier words, making a total of 20 words.
Words could be spelt correctly, incorrectly or passed (the respondent does not attempt to
spell the word and/or says ‘pass’). One point was awarded for each correct spelling. An
additional eight (basic skills pilot study) or four (dress rehearsal) points were added to the
final score if the respondent had not made early errors and had not moved on to try the
additional easier spellings.
The six practice words were again not used. In the DAST, the quality of handwriting was also
recorded (good, average or poor), but as this very subjective measure did not contribute to a
PILOT STUDY
DRESS REHEARSAL
pe
rce
nta
ge
0-20 21-40 41-60 61-80 81-100 101-120 121-140
One-Minute Reading scores
0
10
20
30
40
50
68. Miles, T R and Miles, E (1999). Dyslexia: A Hundred Years On. 2nd edition. Buckingham: Open University Press.

Measuring basic skills for longitudinal study 65
respondent’s score, interviewers were not asked to do this.
Interviewers read out one word at a time, starting to dictate the next word when the
respondent had finished writing the previous word. At the end of the exercise, the interviewer
recorded which hand the respondent wrote with and checked that they could read what the
respondent had written down. If not, they asked the respondent how they had spelt a
particular word, and wrote this down next to the word in question. This was very important. If
the interviewer was not clear how a word was spelt, a coder entering the information into a
dataset at a later date would probably not know either, and the information would be lost.
Interviewers raised initial concerns about doing this, but once they were reminded of the old
adage of never being able to read a doctor’s handwriting, they were comfortable with this
procedure. Importantly, they did not feedback any difficulties in doing this after the basic
skills pilot study.
Results
The average number of words spelt correctly in the pilot study was 30. The identified dyslexics
spelt significantly fewer words correctly than the non-dyslexics in the allocated time: 24 to 33.
For easy comparison with the dress rehearsal, respondent scores from the pilot study were
rescaled to have the same score range as the dress rehearsal: 0–20. As such, table 4.3 shows
the average number of words spelt correctly in the rescaled pilot study was 15, in the dress
rehearsal 16. Figure 4.5 shows the range of the scores achieved by participants in both
development studies. The range of scores achieved by respondents in the pilot study was
more spread than those achieved by BCS70 cohort members in the dress rehearsal. Further
details of these results are provided in table A4.3 in the dyslexia appendix. Again, evidence in
support of the validity of the measure comes from the Vinegrad classification. In the pilot
study dyslexics obtained a substantially lower mean score than non-dyslexics, 22 compared
with 32.
Table 4.3. Results of the Two/One-Minute Spelling exercise
N Score range Mean Median sd
Pilot study: All 166 3–40 30 32 8.12
Non-dyslexics* 124 8–40 32 33 6.57
Dyslexics† 29 3–37 22 24 9.99
Rescaled pilot scores: All 166 1–20 15 16 4.08
Dress rehearsal: All 62 8–20 16 17 3.37
sd = standard deviation
*Non-dyslexics = a score of 0–7 on the Vinegrad Checklist,
†Dyslexics = a score of 8–20 on the Vinegrad Checklist.

Research Report66
Figure 4.5. Distribution of Two/One-Minute Spelling scores
4.5.4 One-Minute Writing exercise
Another difficulty for some adults experiencing symptoms of dyslexia is a slow speed of
writing, together with loss of accuracy when under time pressure. This can mean that they
will struggle to complete their work in an allotted time, posing particular problems in an
examination situation or a specific work-related task. This aspect of dyslexia was assessed by
respondents copying a short passage of 50 words in one minute.
The practice for this exercise was again dispensed with. After reading the passage, the
respondent was instructed to copy all words and punctuation in the passage, to write fast but
legibly and not to write in capitals. If at the end of the exercise, the writing was illegible to the
interviewer (with this due to a fast writing pace), the interviewer asked the respondent to try
again and to try and make their writing clearer. Only one repeat attempt was allowed.
The basic score was the number of words a respondent completed in one minute. If the
passage was copied in less than a minute, one point was added for every two seconds under
the minute69. A maximum of ten points could be added for a quick time. For example, if a
respondent completed the exercise in 52 seconds, four points were added to their score; if the
exercise is completed in 40 seconds or less, ten points were added to the total score.
In this exercise, there were a number of ways that points were deducted. For mistakes
(omitted words or words with spelling mistakes), one point was deducted for every two errors,
rounding down for an ‘odd’ number of errors. For example, two points would be deducted for
four or five errors. Up to three points could be deducted for poor handwriting, with three
points being deducted for writing that was barely legible. Punctuation, including full stops,
commas, spaces between words, was also assessed with two points deducted for poor
punctuation.
Given the complexity and subjectivity of the scoring for this exercise, interviewers were not
asked to ‘score’ a respondent’s handwriting, only to carry out the exercise and collect a
sample of their writing. Interviewers would not have the time or training to be able to carry
out the scoring required in a reliable and consistent way. It was hoped to code this writing up
post-fieldwork, but time restrictions for survey development did not make this practical.
Therefore, no results are available.
PILOT STUDY
DRESS REHEARSAL
pe
rce
nta
ge
2 4 6 8 10 12 181614 20
Two/One-Minute Reading scores
0
5
10
15
20
25
30
35
69. If the exercise was completed in an ‘odd’ number of seconds ie, 51 or 53 seconds, the time was rounded down.

Measuring basic skills for longitudinal study 67
The exercise was relatively simple for respondents, although interviewers reported some of
them seemed unhappy writing ‘joined up’, preferring to print. As respondents had been
instructed to copy precisely, some respondents tried to keep to the line breaks of the original
passage, although this was not necessary. Coding the passage would require additional expert
coding and incur relatively high costs. As cohort members taking part in the main fieldwork
would provide a sample of their handwriting in a ‘free’ writing exercise, any additional
benefits of completing a timed copying exercise could not feasibly be incorporated within the
time and financial restrictions of the main survey.
4.5.5 Phonemic Segmentation and Spoonerisms exercise
There is solid evidence that children with dyslexic symptoms are slow, developmentally, to
detect rhymes, and that this is one of the reasons behind their struggles when learning to
read. This type of phonological difficulty may persist into adulthood, and ‘phonemic
segmentation’ ability – the ability to split words into their constituent sounds – is a sensitive
index of these skills. As stated, Spoonerisms are a more complex measure of segmentation
ability.
Unlike the previous three exercises, the Phonemic Segmentation, and to a certain extent, the
Spoonerism exercise is not a timed exercise. However, the time taken to administer each
exercise was recorded. As both exercises are not so usual or commonplace as the timed
reading, spelling and writing exercises, the interviewers went through the practice examples
included in the DAST instructions to help respondents fully grasp what was required of them.
Once the practices were over, respondents attempted 12 Phonemic Segmentations and three
Spoonerisms.
An extract from the instructions for the Phonemic Segmentation exercise is as follows:
“…Now, I want you to think about how a word is made up of different sounds. Listen to
me say ‘eyelid’. That’s made up of two parts, ‘eye’ and ‘lid’…………… You can also break
words into sounds. Can you say ‘panda’ without the ‘da’?”
As with all the exercises, only general neutral encouragement was given, but consistency in
words used (‘good’, ‘yes’, etc.) and tone of voice was vital. In this exercise, instructions and
the specific word could be repeated once if the subject had clearly misunderstood the
question, evident by their response to the first word/question. The Phonemic Segmentation
exercise was stopped or discontinued if the respondent got the first four ‘words’ wrong, or
otherwise, if they made three consecutive errors.
Whether respondents completed the Phonemic Segmentation exercise or stopped early, the
interviewer administered the Spoonerisms exercise. They explained that it is an exercise to
play around with the sounds of words. Essentially, the interviewer read out two words and the
respondents had to swap round the sounds at the beginning of each word:
“…….. So, if I say ‘Car Park’ you would say ‘Par Cark’, and so on…….’”
The Spoonerisms used in the exercise were the names of three famous people.
For both the Phonemic Segmentations and Spoonerisms exercise, responses were given one
point for a correct answer; 0 points for an incorrect response or a pass. A timer was used to
record the time taken to complete the Spoonerisms exercise, but there was no time limit as

Research Report68
such. Interviewers needed to record the time taken, as one point was deducted from a
respondent’s score for a time of 50 seconds or more. However, this was only if one or more
Spoonerisms were answered correctly. A time of 50 seconds plus indicates the respondent
experienced considerable difficulty.
Results
In the DAST, scores from these two exercises can be combined, but the pilot scores were kept
separate to help the selection of exercises. These are displayed in tables 4.4a and 4.4b. As
with previous exercises, a high average score was achieved indicating that most respondents
did not have any difficulty with the tasks. For the Phonemic Segmentation exercise,
respondents had an average score of 10, but the scores between the dyslexics and non-
dyslexics (as defined by the Vinegrad Checklist) were not significantly different.
For the Spoonerisms exercise, the possible range was only 0 – 3. As such, average scores do
not reveal as much as for other exercises. The highest number of respondents managed all
three of the Spoonerisms correctly in the pilot, but only two correctly in the dress rehearsal
(indicated by the median). This was the only exercise where the respondents in the pilot study
performed better than the sample of BCS70 cohort members in the dress rehearsal. The
distribution of these scores is displayed in Figure 4.6. One hypothesis for the lower average
score for cohort members in the dress rehearsal is that it was possibly harder to do the
Spoonerisms exercise ‘straight off’ without having first done the Phonemic Segmentation
exercise. The identified sample of dyslexics in the pilot study found the Spoonerisms harder
than the non-dyslexics, another piece of validating evidence. Again, more detailed results are
given in table A4.4 in the dyslexia appendix.
Table 4.4a. Results of the Phonemic Segmentation exercise
N Score range Mean Median sd
Pilot study: all 175 3–12 10 11 2.04
Non-dyslexics* 132 3–12 10 11 1.89
Dyslexics† 30 3–12 9 9 2.53
sd = standard deviation
*Non-dyslexics = a score of 0–7 on the Vinegrad Checklist,
†Dyslexics = a score of 8–20 on the Vinegrad Checklist.
Table 4.4b. Results of the Spoonerisms exercise
N Score range Mean Median sd
Pilot study: all 175 0–3 2 3 1.02
Non-dyslexics* 132 0–3 3 3 0.79
Dyslexics† 30 0–3 2 2 1.30
Dress rehearsal: all 63 0–3 2 2 1.23
sd = standard deviation
*Non-dyslexics = a score of 0–7 on the Vinegrad Checklist,
†Dyslexics = a score of 8–20 on the Vinegrad Checklist.

Measuring basic skills for longitudinal study 69
Figure 4.6. Distribution of Spoonerism scores
4.5.6 Nonsense Passage Reading exercise
Adults with symptoms of dyslexia find reading words that they have never seen before
especially difficult. This can be readily explored by creating a passage of text containing ‘made
up’ or ‘nonsense’ words. A well-known example of such is the poem ‘Jabberwocky’, from Alice
through the Looking Glass.
As for the Phonemic Segmentation and Spoonerisms exercises, the short practice for this
exercise was retained. Respondents were encouraged to attempt each word, but could ‘pass’
if they felt unable to attempt one of the words. After the practice, any mistakes were
highlighted and correct answers were given. Respondents then moved to the main exercise.
As for the Spoonerisms, the timer was used, being set to three minutes. Although some
respondents might be awarded extra points for a quick time, it was more a strategy for
bringing the exercise to a close for the respondents who were really struggling but would not
admit defeat.
As in the practice, respondents could ‘pass’ on a word, but were discouraged from not even
trying to read the nonsense words. The exercise was stopped if the respondent made five
consecutive mistakes, gave up, or was still going after three minutes. Scoring was more
complex than for the other exercises; the number of words read and whether or not they were
nonsense words were both taken into account, together with how long the respondent took. In
summary, one point was given for each of the 59 normal words read correctly; two points for
a correct (plausible) reading of each of the ‘nonsense’ words; one point for a ‘close try’. After
the difficulties encountered in the pilot study, a ‘close try’ was quantified as a pronunciation
which had one sound or syllable different, one sound or syllable omitted, or one sound or
syllable added. For example:
■ ‘rinsomely’ is correctly broken down to have three syllables – ‘rin-some-ly’;
■ a semi-correct, close try could be ‘rinG-some-ly’ or ‘rEn-some-ly’; and
■ an incorrect attempt could be ‘rinG-ER-some-ly’ or ‘rinG-ER-some-ER-ly.
Results
Difficulties recording time taken to complete this task were encountered by interviewers in
the Basic Skills Pilot. Following amendments made after their feedback, ‘time taken’ was
successfully recorded in the dress rehearsal. A score that included ‘time’ for the nonsense
reading passage results in the dress rehearsal was calculated, but to enable comparison with
PILOT STUDY
DRESS REHEARSAL
pe
rce
nta
ge
0 31 2
Spoonerism score
0
10
20
30
40
50
60
70
80

Research Report70
pilot study figures, a total score without time penalties or bonuses was also calculated.
Table 4.5 shows a near identical high average score was attained by participants in the pilot
study and dress rehearsal. Those identified in the pilot study as dyslexic read fewer words
correctly than non-dyslexics. The difference in scores provides more evidence of the validity of
the test. The range of scores is displayed in figure 4.7, with further details provided in table
A4.5 in the dyslexia appendix.
Table 4.5. Results of the Nonsense Passage Reading exercise
N Score range Mean Median sd
Pilot study: all 166 14–89 82 86 9.05
Non-dyslexics* 126 14–89 83 86 8.39
Dyslexics† 29 52–89 76 76 10.10
Dress rehearsal: all
(exc. Time)‡ 61 36–89 82 85 8.49
Dress rehearsal: all
(inc. Time)‡ 61 28–99 80 81 16.68
*Non-dyslexics = a score of 0–7 on the Vinegrad Checklist,
†Dyslexics = a score of 8-20 on the Vinegrad Checklist.
‡ ‘exc. time’ = excluding time; ‘inc. time’ = including time.
Figure 4.7. Distribution of scores for the Nonsense Passage Reading exercise
PILOT STUDY
DRESS REHEARSAL
pe
rce
nta
ge
5 10 15 20 25 30 35 40 45 50 55 60 65 70 75 80 85 90
Nonsense Passage Reading scores
0
10
20
30
40
50
60

Measuring basic skills for longitudinal study 71
5 Parent and Child Interview
An additional purpose of the 2004 survey was to gather information on a representative
sample of cohort members and their resident natural or adopted children, and assess the
children’s cognitive skills. This part of the survey was the Parent and Child Interview and
largely replicated a similar intergenerational study, the Mother and Child Survey, which was
carried out in 1991 on a representative sample of the NCDS cohort, when they were aged 33.
All components within the Parent and Child Interview were funded through NRDC from a
grant awarded by the European Social Fund (ESF).
As described in chapter 2, the child assessments were piloted in September-October 2003 on
127 children from 60 households (the Child Assessment Pilot). After revisions to the design of
some assessments, they were included in the ‘dress rehearsal’ for the final survey. This took
place on 64 BCS70 cohort members and 40 of their children in November 2003 (the dress
rehearsal).
5.1 Assessing the cognitive skills of children: which assessment?
In 1991, children between age four and 16 of one third of all NCDS cohort members
completed nine age-specific child assessments adapted from US versions and administered
by general survey NatCen interviewers in the cohort members’ homes70. This was an add-on
to the main NCDS age 33 follow-up survey and involved a random sample of one in three of
the cohort members who had agreed to take part in the main interview. Parents – almost
exclusively mothers (i.e. the cohort member or their female partner) – supplied additional
information about each child and about the family as a whole. Following the model adopted in
the comparable US survey of mothers and children – the National Longitudinal Study of Youth
(NLSY), fieldwork was preceded by a week’s training, including practice interviews. The survey
was successful, with over 95 per cent of the selected cohort members who had taken part in
the main interview agreeing to take part.
As noted in chapter 1, the comparable age of the BCS70 cohort to that of the NCDS cohort
offered the opportunity for cohort comparisons of cognitive development (with age of cohort
member controlled) across the 12 years separating the two cohorts’ births. This identified the
first of a number of requirements for the BCS70 children assessment:
■ comparable cognitive development measure to those used in the NCDS age 33 survey;
■ continuity from and comparability to the assessment of cohort members’ own cognitive
development and educational performance when they were children and to the measures of
their adult literacy and numeracy;
■ applicability across the full anticipated age range expected for the cohort members’ children.
(This and other attributes of the children could only be effectively established by the interview
when arranging the main interview.); and
■ could be administered within the 20 minutes available for each child’s assessment in the
70. For the complete range of assessments, see The NCDS Sweep V User Guide (1993), available from the Economic and Social
Research Council (ESRC) Data Archive. To complete the cognitive assessments, children had to have a Peabody Picture
Vocabulary Test (PPVT) age of at least 4, equivalent to 3 years 11 months and 16 days. For further details see Dunn, L. M. and
Dunn, L. M. (1981). Peabody Picture Vocabulary Test - Revised. Circle Pines, MN: American Guidance Service.

Research Report72
survey. (This was partly on the grounds of survey cost and partly on the grounds of minimising
‘interview burden’.)
These requirements both mapped onto and extended those applying to the NCDS child
assessments – most notably the need for continuity and comparability with adult basic skills
assessments. In addition, there had been some criticism of the Peabody and other US tests
adopted in the earlier survey on the grounds of datedness. At a general level of comparison,
e.g. based on rank ordering children, this would not matter too much but was not optimum
for the detailed investigation of cognitive skills related to adult literacy and numeracy that
was a prime purpose of the BCS70 survey. After much consultation, the following assessment
instruments were subjected to detailed scrutiny:
■ The Stanford-Binet Intelligence Scale, suitable for ages 2–18 years: individually administered
measure of mental abilities based on a series of varied tasks.This edition was first published
USA, Houghton Mifflin, 196071.
■ The Wechsler Pre-school and Primary Scale of Intelligence; suitable for ages 0–5 years, and
the Revised Wechsler Intelligence Test for Children; suitable for children aged 6–16 years, 6
months: developed to meet the demands for a short and reliable measure of intelligence in
clinical, psycho-educational and research settings and individually administered, this
yieldsields three traditional verbal, performance and IQ scores. Linked to Wechsler
Intelligence Scale for Children (WISC III) and Wechsler Abbreviated Scale of Intelligence (WASI
III). Four sub-tests – Vocabulary, Block Design, Similarities and Matrix Reasoning. Contains
British amendments to the administration and scoring criteria sections. This was first
published USA, 197472.
■ The British Ability Scales II (BAS II): comprising several subscales suitable for children aged 2
years, 6 months–17 years, 11 months73.
■ The Snijders-Oomen Non-verbal Intelligence Scales: suitable for children aged 2 years, 6
months–7 years old and for children aged 5 years, 6 months–17 years old74.
■ The Peabody Individual Achievement Test (PIAT): Maths, Reading Recognition, and Reading
Comprehension Subscales, and the Peabody Picture Vocabulary Test – Revised (PPVT-R)75.
■ The Bracken Test: ages 2 years, 6 months–7 years, 11 months: measure of children’s basic
concept acquisition and receptive language skills. Used to measure comprehension of 308
foundational and functionally relevant educational concepts in 11 subjects or concept
categories: colours, letters, numbers/counting, sizes, comparisons, shapes,
direction/position, self-/social awareness, texture/material, quantity, and time/sequence. Test
is individually administered and concepts presented orally within the context of complete
sentences and visually in a multi-choice format76.
71. Terman, L M and Merrill, M A (l96l). Stanford-Binet Intelligence Scale, 3rd edition. IL, USA: The Riverside Publishing Co.
72. Wechsler, D (1999). Wechsler Abbreviated Scale of Intelligence (WASI). UK: Psychological Corporation Wechsler, D (1976).
Wechsler Intelligence Scale for Children – Revised (WISC-R). NFER-Nelson, 2nd (British) edition.
73. Elliot, C D (1983, 1996). British Ability Scales II: Core Scale 2. Berkshire: The NFER-NELSON Publishing Company Ltd.
Elliot, C D, Smith, P and McCulloch, K (1996). British Ability Scales II: Administration and Scoring Manual. Berkshire: The
NFER-NELSON Publishing Company Ltd. Elliot, CD, Smith, P and McCulloch, K (1997). British Ability Scales II: Technical
Manual. London: The NFER-NELSON Publishing Company Ltd.
74. Snijders, J T and Snijders-Oomen, N (c 1987). Snijders-Oomen Non-Verbal Intelligence Scale. Netherlands: Wolters-
Noordhoff. Ages 2.6 – 7 years. Snijders, J Th, Tellegen, P J and Laros J A (1989, 1996). Snijders-Oomen Non-Verbal
Intelligence Scale (SON-R). Netherlands: Wolters-Noordhoff (Manual) and Swets and Zeitlinger.Ages: 5.6 years to 17 years.
These tests were not found appropriate, as there was no specific literacy and numeracy element.
75. Dunn, L.M., & Dunn, L.M. (1981). Peabody Picture Vocabulary Test-Revised. Circle Pines, MN: AGS Publishing. Dunn, L.M.,
& Dunn, L.M. (1997). Peabody Picture Vocabulary Test-Third Edition. Circle Pines, MN: AGS Publishing. Dunn, L. M and
Markwardt, J C (1970). Peabody Individual Achievement Test Manual. Circle Pines, MN: American Guidance Service.
76. Bracken, B A (1998). Bracken Basic Concept Scale – Revised (BBCS-R). London The Psychological Corporation.

Measuring basic skills for longitudinal study 73
The BAS II was found the most appropriate to meet the survey’s purposes and was adopted.
The main reasons were:
■ Using the BAS II would offer intergenerational comparison opportunities as BCS70 cohort
members were assessed using aspects of the BAS in 1980, when aged 10.
■ MCS cohort members were assessed with an individual BAS II scale when three years old.
■ BAS II contains modules designed to capture a measure of a child’s literacy and numeracy
development. By using such subscales, the extent to which education and skills problems and
attainments are repeated across the generations within families and the big influences on
them could be investigated, in line with the NRDC basic skills enquiry.
■ BAS II was among the few major tests available that offered assessment of children aged
3–16 years old. Each assessment was age adaptable.
■ Appropriate BAS II scales were estimated to take 20 minutes (on average) to complete. This
was in line with the project requirements to minimise burden on the children and the overall
time the interviewer had to spend in the household.
5.2 Introduction to the British Ability Scales II
The British Ability Scales Second Edition (BAS II) is a battery of individually administered tests
of cognitive abilities and educational achievement, published by the NFER-NELSON Publishing
Company Ltd. The initial research that eventually led to the publication of the original BAS in
1979 started in 1965, and has been developed fairly continuously since. A revised version, the
BAS-R was published in 1983. The battery of individual scales that make up the BAS II,
published in 1997, therefore has more than 30 years of development behind them.
The BAS was initially developed to provide professionals (in a number of different clinical
settings) who assessed children with a wide range of learning and developmental needs, with a
tool that gave information at a finer, yet also broader, level of detail than could be attained
from an IQ score. As such, various theoretical perspectives have been drawn on and
accommodated within the development of BAS II. However, educational application remains
the principal goal of BAS II, primarily to evaluate children who demonstrate learning
difficulties.
The battery of individual scales that make up the BAS II objectively, reliably and economically
measure a child’s strengths and weaknesses, providing a comprehensive assessment of their
current intellectual functioning and basic educational progress. Generalisation is the key
feature upon which all tests are based. Much of human behaviour is not specific to a particular
setting and more lasting and general characteristics of a child can therefore be interpreted
from an achieved score in an individual test77. For example, vocabulary testing is an index of
general language skills.
The BAS II consists of two elements: the cognitive element and the achievement element. It is
suitable for use with children and adolescents aged from 2 years, 6 months (2:6) to 17 years,
11 months (17:11), and is organised into two age-specific batteries: the Early Years Battery for
pre-school children and the School Years Battery for children of school age.
77. When administered in clinical settings, additional information about a child’s abilities, school performance and behaviour is
also drawn on when interpreting the scores.

Research Report74
The Early Years Battery is composed entirely of cognitive scales and is used in general for
children under 6:0 years old (but can be used for children from 6:0 to 7:11 years old who will
have difficulty with the School Age Battery). Several of the subscales can be used from age
2:6 upwards; others start from age 3:0, 3:6 or 4:0. These scales use appealing artwork and
manipulable objects to assess reasoning, perception and memory, together with an
understanding of basic quantitative concepts.
The School Years Battery comprises both cognitive and achievement scales which have been
normed from 5:0 to 17:11 years (though some of the scales will prove demanding for 5- and
6-year-olds). The cognitive scales have been designed to assess reasoning, perception,
processing speed and memory, using verbal, numerical and figural materials. The
achievement element comprises scales measuring word reading, spelling and number skills.
5.3 Selection of particular subscales
In line with the NRDC enquiry, it was necessary to use subscales that supplied a measure
(direct or indirect) of a child’s literacy and numeracy. An additional requirement was that the
scales should take no more than 20 minutes of interview time (on average). After consultation
with experts from the London Institute of Education and NFER-Nelson, the Naming
Vocabulary, Early Number Concepts and Copying78 subscales were selected from the Early
Years Battery for children aged 3:0–5:11. For children aged 6:0 – 16:11, the achievement
element of the School Years Battery was selected, i.e. Word Reading, Spelling and Number
Skills subscales. The abilities measured by these scales are detailed in figure 5.1. A general
problem to bear in mind with the selected assessments is their datedness. As the BAS II was
last revised in 1997, some of the images/pictures included in the Early Years Battery are
showing their age. A picture of a telephone looks particularly outmoded. Some of the children
in the survey will have only ever seen a mobile phone, not a push button landline. Perhaps of
more concern is the inability of such an assessment to keep pace with the (evolving) national
curriculum. This was particularly apparent for the Number Skills scale of the School Years
Battery (see section 5.9.4). However, a definite plus of using the BAS II scales is that these
tests have been widely used and scores have been standardised on large populations. This
means that the results obtained in the BCS70 follow-up survey can be benchmarked, and if
necessary standardised, against the BAS II test norms.
78. Copying skills are a strong predictor of literacy and numeracy competence in adult life (see Bynner and Steedman, 1994;
Parsons and Bynner, 1998).

Measuring basic skills for longitudinal study 75
Figure 5.1. Selected BAS II subscales
Ages 3:0 – 5:11 years (Early Years Battery)
Scale Abilities measured
Naming vocabulary Expressive language; knowledge of names
Early number concepts Knowledge of, and problem-solving using pre-numerical and numerical
concepts
Copying Visual-perceptual matching and fine-motor coordination in copying line
drawings
Ages 6:0 – 16:11 years (School Years Battery)
Scale Abilities measured
Number skills Recognition of printed numbers and performance of arithmetic operations
Spelling Knowledge and recall of spellings
Word reading Recognition (decoding) of printed words
5.4 Adapting BAS II for interviewer administration
The standard BAS II is designed to be administered, scored and interpreted by people with a
relevant psychology background, with formal training in the individual administration and
interpretation of cognitive test batteries for children and adolescents of the age range covered
by this test. The goal of the BAS II is to obtain an accurate score by administering a sufficient
number of items appropriate for the child’s level of developmental ability. Items that are
moderately difficult for the child provide the most information about his/her ability; little is
learned from administering items that prove extremely easy or extremely difficult. Children of
different ages therefore usually start and stop at different points on each scale. These starting
and stopping points are flexible rather than fixed, in response to a child’s performance. The
administration of each scale is therefore not straightforward. To minimise the number of
decisions interviewers had to make in response to a child’s performance, the ‘rules’ of each
selected scale were programmed into CAPI. The interviewers coded a child’s answer as
(usually) correct or incorrect and then the CAPI directed the interviewer to the next question
suited to the child’s level of ability. In this way, the interviewer could concentrate on a child’s
performance, which made the experience present less like a ‘test’ to the child, while being
assured that the standard BAS II instructions were followed.
5.5 Interviewer materials
As only three scales from the Early Years and School Age Batteries were administered with
the aid of CAPI, standard BAS II stimuli and interviewer recording booklets had to be revised:
For young children, new stimulus booklets (also called easels) used for the Naming
Vocabulary, Early Number Concepts and Copying scale were produced. Additional material
included sets of green tiles for the Early Number Concepts scale and specially produced
answer booklets for the Copying scale.
For older children, specially produced answer booklets for all three scales administered were
used.

Research Report76
5.6 Sample size
Unlike the adult assessment, which as a newly designed instrument needed to be piloted on a
large number of respondents for reliability, the BAS II is an established assessment tool. The
main aim of the Child Assessment Pilot was to see how interviewers fared administering the
possibly complex set of assessments to children in their own homes. The scores achieved
from children taking part in both the Child Assessment Pilot and the dress rehearsal are
included in the report, but, because of the small numbers involved for any given age, this is
more to illustrate the type of data to be expected in the main survey than as results of interest
in their own right.
5.7 General interviewer feedback
The most overwhelming problem encountered by interviewers were routing problems within
the CAPI programme which generally meant a child had to struggle on for longer as the
program had not always stopped at the appropriate point. These programming points were
amended for the dress rehearsal, where no problems were reported. As with adults, more of
the children found the scales assessing their number skills the most difficult or unappealing.
The Early Number Concepts and Number Skills scales took by far the longest time to
complete.
Some interviewers reported feeling uncomfortable when the CAPI programme went back to
earlier items if the child’s performance was poor. When that happened, the child, particularly
an older child, seemed uneasy or realised that they had performed badly. Briefings were
revised accordingly and to ease a child’s potential discomfort, interviewers could explain that
the original set of questions was meant for much older children and encourage the child to
continue. Given that many able children (and adults) find working with ‘numbers’ difficult
and/or stressful, interviewers were advised to be particularly encouraging and reassuring
during the Early Number Concepts and Number Skills assessment, and to praise their efforts,
irrespective of their performance. Finally, interviewers were instructed to stop the exercise if
the child was clearly distressed or asked to stop before the CAPI ended the exercise.
5.8 Administering BAS II: the Early Years Battery
The order of administration for all children was initially Naming Vocabulary, Copying and
Early Number Concepts. However, whilst children readily engaged with the Naming
Vocabulary task, the Early Number Concepts and Copying tasks were not so appealing.
Following feedback from the pilot study, the Copying task was replaced with a simpler version
and was completed last in the dress rehearsal and main fieldwork in a bid to end the
assessment on a more positive note for the children. The final order of administration was:
■ Naming Vocabulary;
■ Early Number Concepts; and
■ Copying.
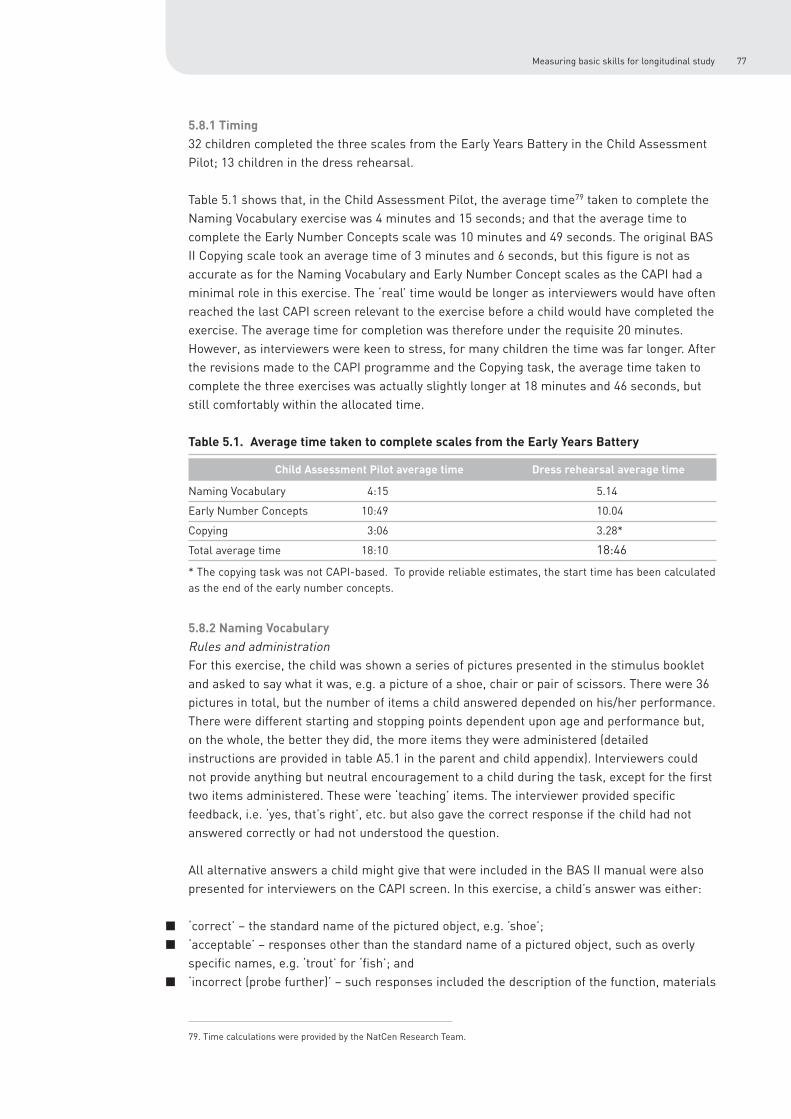
Measuring basic skills for longitudinal study 77
5.8.1 Timing
32 children completed the three scales from the Early Years Battery in the Child Assessment
Pilot; 13 children in the dress rehearsal.
Table 5.1 shows that, in the Child Assessment Pilot, the average time79 taken to complete the
Naming Vocabulary exercise was 4 minutes and 15 seconds; and that the average time to
complete the Early Number Concepts scale was 10 minutes and 49 seconds. The original BAS
II Copying scale took an average time of 3 minutes and 6 seconds, but this figure is not as
accurate as for the Naming Vocabulary and Early Number Concept scales as the CAPI had a
minimal role in this exercise. The ‘real’ time would be longer as interviewers would have often
reached the last CAPI screen relevant to the exercise before a child would have completed the
exercise. The average time for completion was therefore under the requisite 20 minutes.
However, as interviewers were keen to stress, for many children the time was far longer. After
the revisions made to the CAPI programme and the Copying task, the average time taken to
complete the three exercises was actually slightly longer at 18 minutes and 46 seconds, but
still comfortably within the allocated time.
Table 5.1. Average time taken to complete scales from the Early Years Battery
Child Assessment Pilot average time Dress rehearsal average time
Naming Vocabulary 4:15 5.14
Early Number Concepts 10:49 10.04
Copying 3:06 3.28*
Total average time 18:10 18:46
* The copying task was not CAPI-based. To provide reliable estimates, the start time has been calculated
as the end of the early number concepts.
5.8.2 Naming Vocabulary
Rules and administration
For this exercise, the child was shown a series of pictures presented in the stimulus booklet
and asked to say what it was, e.g. a picture of a shoe, chair or pair of scissors. There were 36
pictures in total, but the number of items a child answered depended on his/her performance.
There were different starting and stopping points dependent upon age and performance but,
on the whole, the better they did, the more items they were administered (detailed
instructions are provided in table A5.1 in the parent and child appendix). Interviewers could
not provide anything but neutral encouragement to a child during the task, except for the first
two items administered. These were ‘teaching’ items. The interviewer provided specific
feedback, i.e. ‘yes, that’s right’, etc. but also gave the correct response if the child had not
answered correctly or had not understood the question.
All alternative answers a child might give that were included in the BAS II manual were also
presented for interviewers on the CAPI screen. In this exercise, a child’s answer was either:
■ ‘correct’ – the standard name of the pictured object, e.g. ’shoe’;
■ ‘acceptable’ – responses other than the standard name of a pictured object, such as overly
specific names, e.g. ‘trout’ for ‘fish’; and
■ ‘incorrect (probe further)’ – such responses included the description of the function, materials
79. Time calculations were provided by the NatCen Research Team.

Research Report78
or parts of the object pictured (e.g. ‘put on your foot’ for ‘shoe’), too general responses (e.g.
‘animal’ for ‘horse’) and names of related objects (e.g. ‘stool’ instead of ‘chair’); and
■ ‘Incorrect (other)’ – responses that were just plain wrong, e.g. ‘tree’ for ‘shoe’. Interviewers
had to write the child’s response into the CAPI verbatim.
Feedback and modifications
In general, feedback from the Child Assessment Pilot was very positive. Interviewers reported
that the exercise was generally simple to administer and that children enjoyed it. It was
necessary for interviewers to be very quick when coding the child’s answers, as they
responded very quickly. An example of a BAS II image and the CAPI screen is given in figure
5.2. No significant modifications other than a few CAPI amendments were made for the dress
rehearsal and main fieldwork. More detailed interviewer feedback is provided in table A5.2 in
the parent and child appendix.
Figure 5.2: BAS II Naming Vocabulary Image and CAPI screen 80
80. ©nferNelson. This example from the BAS II Naming Vocabulary Scale has been reproduced with the kind permission of
nferNelson.

Measuring basic skills for longitudinal study 79
Results
Although the number of children in each survey is small, by grouping the ability scores (as
derived from their raw scores) the distribution of the children is shown in figure 5.3. Despite
the small numbers, the distribution of scores from the Child Assessment Pilot and dress
rehearsal are remarkably similar. They also demonstrate exactly the kind of spread of scores
required for the main survey.
Figure 5.3. Early Years Battery–Naming Vocabulary ability scores
5.8.3 Early Number Concepts
Rules and administration
For this exercise, the child answered questions about number, size, or other numerical
concepts. Stimuli used for the exercises included ten green plastic tiles and a series of
pictures presented in the same easel as for the Naming Vocabulary scale. There were 30
questions in total, but there was no standard number of items for a child to try and answer. As
for Naming Vocabulary, there were different starting and stopping points dependent upon age
and performance (see table A5.3 in the parent and child appendix for details). A number of
questions were asked for each of the pictures. For example, three questions went with the
‘ladybirds’ displayed in figure 5.4. The interviewer would indicate the yellow ladybirds, point to
one in particular, and then ask the child to point to all of the red ladybirds that had the same
number of spots as the particular yellow one, i.e. two, four or six spots. Interviewers could not
provide anything but neutral encouragement to a child during the task, except for the
designated teaching items where the interviewer provided specific feedback, e.g., ‘yes, that’s
right’, etc, but they also gave the correct response if the child had not answered correctly or
had not understood the question. For this exercise, interviewers had to code a child’s answer
as 1 ’correct’, and 2 ‘incorrect’ on the CAPI screen. (The exception to this was item 3, as
detailed in table A5.4 in the parent and child appendix.)
PILOT STUDY
DRESS REHEARSAL
pe
rce
nta
ge
<75 <100 <125 125+
Naming Vocabulary ability score
0
10
20
30
40
50
60

Research Report80
Figure 5.4. BAS II Early Number Concepts image and CAPI screen81
Feedback and modifications
There was an overall feeling that children were not as engaged with this exercise as they had
been for the Naming Vocabulary, and that the children might have tried harder if the tests had
been more attractive. For the exercises which involved the green tiles, there was often not
enough space in a cohort member’s home to lay out the tiles. Many interviewers found it best
to sit on the floor with the child.
Younger children often lost interest or got tired quite soon. Some of the illustrations were
particularly unappealing to younger children who seemed to lose interest and wander away
from the task at hand. However, older children (five plus) battled on, which indicated the
particular questions depicted stages of cognitive development. Given the particularly negative
feedback on this scale, interviewers were asked to be particularly encouraging, though at the
same time without giving specific feedback (other than on teaching items), and to praise the
child after the exercise had finished, irrespective of his/her performance.
Results
The distribution of ability scores (as derived from their raw scores) from the Child
Assessment Pilot and dress rehearsal are shown in figure 5.5. Unlike for the Naming
Vocabulary scale, the distributions were rather different, more flattened and with a lower
81. ©nferNelson. This example from the BAS II Early Number Concepts Scale has been reproduced with the kind permission of
nferNelson.

Measuring basic skills for longitudinal study 81
mean value for the sores in the pilot than in the dress rehearsal. The wider spread of scores
for the much larger pilot sample inspires confidence that a similar wide range of
performances will be obtainable in the main survey.
Figure 5.5. Early Years Battery: Early Number Concepts ability scores
5.8.4 Copying
Rules and administration
For this BAS II exercise, the child was asked to copy several drawings of increasing difficulty
on a piece of paper82. There were 20 drawings in total but, again, there was no standard
number of drawings that a child was expected to copy. This scale was not intended for
children below 3:6 years old, but children aged 3:0 – 3:5 were included in the Child
Assessment Pilot.
Coding children’s drawings is a fairly subjective task; one that placed too many demands on
the interviewers. As such, despite different starting and stopping rules dependent on age and
performance, all children started at item 1 (see table A5.5 in the parent and child appendix for
details). Interviewers were instructed to administer the assessment until the child clearly
failed five consecutive items or until the child got tired. In this way, the interviewer would not
have to mark the children’s responses and the children would do as many items as they
comfortably could. The ultimate stopping point was item 15 for children aged 3:0 – 4:11 and
item 20 for children aged 5:0 – 5:11. Thus, the role of the CAPI was minimal in this exercise83.
Feedback and modifications
Feedback from the pilot study was relatively discouraging. Some interviewers felt quite
strongly that this task was too difficult for the youngest children (this is not surprising, as the
normal starting age was 3:6). As children soon became tired of the task, as they often had to
copy too many items, concentration wavered. Interviewers also found they had to rely on their
own judgement to stop the exercise after reading the often obvious negative body language of
a child. Interestingly, interviewers found some children were unfamiliar with the word
‘copying’ – they seemed to want to ‘pick-up’ or ‘drag’ the image they had to copy, very much
like on a computer screen with a mouse.
PILOT STUDY
DRESS REHEARSAL
y p p q
pe
rce
nta
ge
<75 <100 <125 <150 <175 175+
Early Number Concepts ability score
0
10
20
30
40
50
82. The section in the booklet for younger children to copy images in consisted of ten pages with two rectangular boxes on each
page, one below the other. These were the exact size of the boxes in the standard BAS II material (13.7 cm x 10.7 cm).
Additional pages with un-numbered boxes were included at the back of the booklet. However, many of the children did not copy
the images in the centre of the box, deciding to draw all over the page instead!
83. This produced problems when trying to estimate the average time children took to complete this exercise.

Research Report82
By dropping the BAS II Copying task, we would lose the opportunity to standardise the BCS70
scores using the BAS II test norms. However, the value of using an easily manageable test,
performance on which could also be compared directly with the performance of the cohort
members when they were aged 5, outweighed this consideration. Accordingly, it was decided
to replace for the dress rehearsal the BAS II Copying Scale with the Copying Designs task that
had been used previously in BCS7084. These drawings were much simpler than the BAS II
drawing. The test required the child to copy eight drawings twice on two consecutive pages of
a specially produced booklet. Figure 5.6 shows a completed booklet from the dress rehearsal
(the designs that the child had to copy are in the left hand column of each page).
The instructions for this simplified task appeared on the CAPI; the interviewers were directed
to point to each design in turn and ask the child ‘see if you can make one just like this – here’,
at the same time pointing to the space beside the design. Therefore the word ‘copy’, which
was found ambiguous, was avoided.
Feedback from the dress rehearsal indicated that the new Copying Designs task was much
simpler than the one from the BAS II. Interviewers indicated that both they and parents felt
the set of drawings were appropriate for children age 3.0 – 5.11 years. A few children could
not be persuaded to make two attempts, and some were tired before they reached the end of
the exercise; however, the task worked well in general and was retained for the main stage.
As there were no discontinuation rules, interviewers were asked to encourage the child to
attempt all eight designs, but should stop if the child was distressed or if he/she stopped
attempting to copy.
Scoring the Copying Designs task
The child is asked to make two copies of each shape. No time limit is given. For each drawing,
a score of 0 or 1 is allocated. As not all children complete two copies, a score of 1 is allocated
if at least one good copy is made of a given design. The total score is the sum of the scores
for the individual drawings. The test is used to assess the child’s ability to reproduce shapes,
and the neatness of the drawing is therefore irrelevant. For all of the drawings, the following
principles apply:
■ the drawings must have the right general shape and look like what they are supposed to be;
■ they should be approximately symmetrical;
■ angles should not be rotated;
■ the drawings should not be rotated, i.e. the point of a triangle should be uppermost;
■ angles must be approximately opposite each other (except for the triangle);
■ slight bowing or irregularity of lines is allowed;
■ as long as the other criteria are met, neatness is not important;
■ lines should meet approximately but, as long as other criteria are met, small gaps in
junctions are acceptable; and
■ slight crossing and overlapping of lines is permitted.
84. Osborn, AF, Butler, NR and Morris, AC (1984). The Social Life of Britain’s Five Year Olds: A report of the Child Health and
Education Study. London: Routledge and Kegan Paul.

Measuring basic skills for longitudinal study 83
Figure 5.6. Example of a completed Copying Designs booklet
First page Second page
5.9 Administering BAS II: the School Age Battery
For the exercises in the School Age Battery for older children, no teaching items were
included and no interviewer feedback, other than neutral encouragement, was allowed.
The order in which the three scales were administered was: Word Reading, Spelling and
Number Skills. 66 children took part in the Child Assessment Pilot and 26 children completed
the revised scales in the ‘dress rehearsal’ for the main fieldwork.
Timing
In The Child Assessment Pilot, the average time taken85 to complete the Word Reading
exercise was four minutes; the Spelling scale was five minutes and 38 seconds and the
Number Skills scale nine minutes and 38 seconds. As for the Early Years Battery, table 5.2
shows the selected scales were completed in less than 20 minutes on average. After the
revisions made to the CAPI programme and the Spelling scale, the average time increased to
20 minutes and 19 seconds. However, as the sample size was much smaller, the figures are
less robust.
Table 5.2. Average time taken to complete scales from the School Age Battery
Child Assessment Pilot average time Dress rehearsal average time
Word Reading 4:00 4:04
Spelling 5:38 4:50
Number Skills 9:38 11:25
Total average time 19:16 20:19
85. Time calculations were provided by the NatCen Research Team.

Research Report84
5.9.2 Word Reading
Rules and administration
In this exercise, the child read aloud a series of words presented on a card. The child had to
correctly pronounce words within locally accepted standards, with emphasis on the correct
syllable or syllables. There were 90 words on the card, arranged in 9 blocks of 10 words each,
but there was no standard number a child had to answer – the total number read out by the
child depended on his/her performance. On the whole, the better they did, the more words
they read (see table A5.6 in the parent and child appendix for full details of starting and
stopping points).
Instead of using a separate show card, the list of words to be read was included in the
specially designed booklet. The format of the words to be read, i.e., font type, font size,
setting, etc. was as close to the standard BAS II format as possible, as shown in figure 5.7.
Figure 5.7. BAS II Word Reading List 86
86. ©nferNelson. This example from the BAS II Early Number Concepts Scale has been reproduced with the kind permission of
nferNelson.

Measuring basic skills for longitudinal study 85
For the interviewers, the CAPI screen showed each of the words the child was to read out in
turn. As in the original BAS II interviewer booklet, the screen included a phonetic
pronunciation of the word. The symbol ‘/’ and ‘//’ within words was used to indicate individual
phonemes and syllables, respectively, with the accented syllables in bold. For example:
Interviewers had the option to code the word as 1 ‘correct’ or 2 ‘incorrect’. As stated, words read
with a regional accent or any type of speech impediment, e.g. a lisp, was coded as correct.
Whether the child understood the word or had seen it before did not matter in terms of coding
a correct or incorrect pronunciation. However, the word was to be coded as correct only if the
child read the word fluently, i.e. it was not just broken down into separate
syllables/constituent parts.
Feedback and modifications
Other than some minor CAPI programme routing problems, interviewer feedback from the
pilot study suggested that there were no major problems with the administration of this scale.
Their biggest concern was that some children read very quickly and interviewers needed to
control the child’s speed in order to be able to mark their answers.
To help combat this, interviewers were encouraged to familiarise themselves with the correct
pronunciation of each word before interviewing children. It was suggested that they used a
ruler or a piece of paper to underline rows being read, especially for younger children.
Results
As for the scales from the Early Years Battery, to compare scores for children of different
ages, the raw score achieved by each child was converted into a BAS II ability score. As shown
in figure 5.8, in contrast to results attained for scales in the Early Years Battery, the children
recruited from the general population to the Child Assessment Pilot study had a marginally
higher mean score than the cohort members’ children involved in the dress rehearsal.
However, the range of scores was comparable, which supported the decision to use the test in
the main survey.
Figure 5.8. Ability scores in the School Age Word Reading scale
PILOT STUDY
DRESS REHEARSAL
pe
rce
nta
ge
<90 <120 <150 <180 181+
Word Reading ability score
5
10
15
20
25
30
35
40
cup light chaos
k/uh/p l/iy/t k/ay//os
Research Report86
5.9.3 Spelling
Rules and administration
In this exercise, the child wrote down words that were dictated by the interviewer. There were
75 words in total, arranged in eight blocks of ten words and one block of five words; the
interviewer administered full blocks to the child. Once again, there was no standard number
of blocks for a child to complete – the number of items the child had to answer depended on
his/her performance (see table A5.7 in the parent and child appendix for details). The
interviewer read the word, then a sentence with the word in it (slightly stressing the target
word) and then the word alone for a second time. For example:
“On…[pause]…I lie on the grass…[pause]…on”.
“Was…[pause]…It was my birthday on Saturday…[pause]…was”.
The words to be written by the child appeared on the CAPI one at a time, and there were two
coding options for the interviewer, 1 ‘correct’ and 2 ‘incorrect’. The spelling sheet for children
to write on in the Child Assessment Pilot was very similar to the standard BAS II spelling
sheet. It was spread over two pages, with spaces (boxes) numbered from 1–75 where children
had to write the corresponding word to facilitate scoring afterwards. This meant that only the
youngest children (aged 6.0–6.11) would start at the top of the sheet, with word 1 in box 1.
Feedback and modifications
Interviewers reported that children who performed poorly and had been directed back to easier
words seemed uncomfortable about it as it was obvious they were trying easier words as they
had to go back to write in boxes higher up the page. Most interviewers also found it very
difficult to assess the children’s spelling right after they had finished writing each word, as
children either sat in a way that ‘hid’ the page on which they were writing or their handwriting
was illegible. This made the assessment longer as interviewers had to ask the child how they
had spelt a word to route the CAPI programme correctly.
After further consultation within the research team, it was decided not to use the BAS II
exercise in its standard format. Although, by changing the test, the opportunity would be lost to
standardise the BCS70 scores in terms of the BAS II test norms, changing the test was
considered preferable to using it in its original format. After reviewing the spelling exercise in
the Dyslexia Screening Test (DST), the child version of the DAST86, as a possible alternative, it
was finally decided to modify the BAS II exercise so that all children within a defined age band
received a fixed number of words. The first step involved reducing the total number of words in
the revised assessment by half: the first five words within each block of ten were selected;
three words from the final block of five. In order to minimise stress and to avoid
disappointment if too many words were failed, a stopping rule of five failures in a row was
applied. After attempting to spell a word, a child read out their answer to the interviewer who
then entered ‘correct or ‘incorrect’ into the CAPI and could apply stopping rules when/if
necessary. Figure 5.9 displays the revised spelling exercise. The number and range of words
children within different age ranges attempted to spell were:
■ children aged 6:0–6:11 would be asked to spell 15 words: words 1–15;
■ children aged 7:0–8:11 would be asked to spell 20 words: words 6–25;
87. This DST spelling exercise was age adaptable, easier to administer and did not involve complicated routing. Although it
would potentially provide interesting comparisons with results from the DAST spelling exercise completed by BCS70 cohort
members, the main purpose here was not to identify dyslexia symptoms, but to assess spelling performance. As such, it was
decided not to use this approach.

Measuring basic skills for longitudinal study 87
■ children aged 9:0–10:11 would be asked to spell 20 words: words 11–30; and
■ children aged 11:0–16:11 would be asked to spell 28 words: words 11–38.
Children in the last age band (11:0 – 16:11) began from an earlier starting point than the one
suggested by BAS II. The main reason for this was that as the latter age band is relatively wide a
wider range of skills would potentially be presented by the children. Even if the first few words
were too easy for many of the children, getting them right would only boost their confidence.
Figure 5.9. Revised BAS Spelling exercise88
1. On…I lie on the grass…on.
2. And…I like apples and oranges…and.
3. The…The grass is green…the.
4. Up…We climb up the stairs…up.
5. Go…I go to the park with my dog…go.
6. Was…It was my birthday on Saturday…was.
7. Home…We stay at home to watch television…home.
8. Old…How old is your brother?…old.
9. Do…I like to do my homework…do.
10. Play…We play games at school…play.
11. Are…What are you doing?…are.
12. Well…I hope she gets well soon…well.
13. New…I bought a new book…new.
14. Work…We work at school…work.
15. Bird…A bird sings in the tree…bird.
16. Friend…My friend is called Sally…friend.
17. Know…I know the way to your house…know.
18. Catch…My dog can catch a ball…catch.
19. Leave…We leave the car on the street at night…leave.
20. Flight…The flight took three hours…flight.
21. Laughing…We were laughing in class…laughing.
22. Obtain…You obtain stamps at the post office…obtain.
23. Search…Doctors search for a cure…search.
24. Although…The group agreed, although one member had objected…although.
25. Fault…I thought it was her fault…fault.
26. Technical…I looked at the technical manual…technical.
27. Ceiling…Our ceiling is painted white…ceiling.
28. Occasion…I saw the mayor on one occasion…occasion.
29. Excellent…The teacher said my work was excellent…excellent.
30. Magician…I saw a magician at the circus…magician.
31. Procedure…They followed the correct procedure…procedure.
32. Parallel…The two lines are parallel…parallel.
33. Sincerely…I was speaking sincerely…sincerely.
34. Conceited…My brother is conceited…conceited.
35. Convenient…It is convenient for me to leave now…convenient.
36. Committee…She was interviewed by the committee…committee.
37. Hypochondriac…A person who worries about his health is a hypochondriac…hypochondriac.
38. Disseminates…A teacher disseminates ideas…disseminates.
88. ©nferNelson. Words taken from the BAS II Spelling exercise were reproduced with the kind permission of nferNelson.

Research Report88
Feedback from the dress rehearsal was quite positive. Interviewers thought that
administering the modified exercise was much improved from the previous stage, as children
did not have to go back to earlier boxes of the table in order to write words in specific
numbered boxes. Also, the modified exercise did not seem to continue for too long, therefore
the children did not get unnecessarily stressed. The revised exercise was retained without
further modifications for the main stage. Interviewers were told to accept a child’s
spontaneous correction, but a child could not go back and correct an earlier spelling89.
Interviewers were instructed to familiarise themselves with the correct pronunciation of each
word before they did any interviews, giving particular attention to regional accents.
Interviewers needed to read the child’s answers in order to code them, so if children sat in a
way which hid what they were writing, or the writing was illegible, the interviewer needed to
ask the child how they had spelt each word after they had finished writing.
Results
As the assessment was altered for the dress rehearsal, the scores from the two pilots could
not be compared. Standard BAS II ability scores could not be calculated, thus to allow
comparison of results of children at different ages who were given different numbers of words
to spell, the scores were rescaled to have the same range of 0–10. The distribution is
displayed in figure 5.10. This shows more the kind of distribution we expect with adult
literacy, i.e. a skewed distribution towards high performances with a longish tail of very poor
performers. The overall wide spread of scores again supported the use of the test.
Figure 5.10. Rescaled School Age Spelling scores
5.9.4 Number skills
Rules and administration
In this exercise, the child performed various number-based tasks, such as pointing to orally
presented numbers, naming visually presented numbers and written calculations. There were
46 items in total, arranged in six blocks (A to F); the first four blocks consisted of eight items
each, and the last two blocks had seven items each. As with the other BAS II scales, the
number of blocks a child attempted depended on the child’s performance (see table A5.8 in
the parent and child appendix for details and the different starting and stopping points for
children of different ages).
DRESS REHEARSAL
pe
rce
nta
ge
1 3 4 5 6 7 8 9 102
Rescaled Spelling score
0
5
10
15
20
25
30
35
40
89. If the child insisted on doing this, the interviewers should nevertheless not change their CAPI entry, as this would affect the
routing.

Measuring basic skills for longitudinal study 89
The numerical tasks were presented in the specially designed answer booklet. The format
(font type, font size, setting, etc.) of the numbers/words used was as close as possible to the
standard BAS II format, but blocks A, B, C and D were each presented on a separate page,
whereas in the standard BAS II version, blocks A and B were on the same page, as were
blocks C and D. The CAPI screen showed the question and the correct answer for each
question. Interviewers had the option to code the child’s answer as 1 ‘correct’ or 2 ‘incorrect’.
Feedback and modifications
Several problems with the CAPI routing were highlighted by interviewers. This led to a
general feeling that the assessment went on too long. Many interviewers asked whether they
could stop the children early if they were getting frustrated or tired (having clearly reached
their limit). Many children also struggled to fit all of their working out into the space provided
in the booklet. Interviewers reported several problems with the mathematical symbols. Some
children were not familiar with the way some of the sums were written, and they wanted to
have them written out in a different way. For example, younger children often learn to do
sums in a ‘horizontal format’, but in the BAS II they were written out in ‘vertical format’. Older
children had similar problems with the long division sign. Following the feedback, education
professionals were approached in order to clarify why children were not familiar with the
ways several of the items were written. It was found that the curriculum had changed since
the latest version of the BAS II had been produced. To fairly assess what the children actually
knew, the symbols and layout were changed, as detailed in figure 5.11.
Figure 5.11. Examples of modified BAS II formats 90
BAS II format BCS70 survey format
14 14 + 2 =
+2
17 17 – 3 =
-3
3 3 x 5 =
x5
7/84 84 ÷ 7 =
4(1.3 + 5.7) = 4 x (1.3 + 5.7) =
90. Not original BAS items.

Research Report90
Interviewers could also ask children in advance whether they recognised the way the sums
were written. If they didn’t, they either invited the child to write them as they were taught at
school, or they offered to write them instead. When interviewers saw a child was struggling,
they asked the child if they had done the sums at school; if they hadn’t, they then moved them
to the next item, and this was a more sympathetic way of legitimising their failure.
To allow space for calculations on the booklet pages, the questions were further spaced out in
the dress rehearsal and again for the main stage.
As with the Spelling exercise, interviewers highlighted that for children who failed items
appropriate for their age group, the process of turning back to earlier questions felt clumsy
as the children realised that earlier questions were easier. However, the diversity of the
number/maths skills contained within each of the six individual blocks (A to F) made it very
complex to select items for simpler administration, as undertaken for the revised Spelling
scale. Figure 5.12 provides some examples of diversity of BAS II questions from each block.
As such, although the amendments to the Number Skills scale made the burden on
interviewer and child less, this exercise remained the longest of the three exercises to
complete in the dress rehearsal, especially for children whose performance was poor.
Figure 5.12: examples of diversity of BAS II Number Skills questions from each block91
91. ©nferNelson. Examples from the BAS II Number Skills exercise were reproduced with the kind permission of nferNelson.
A
2 + 3 = 4 - 1 =
B
2 x 4 =38
+57
C
12 x 3 =
96 ÷ 3 =
D
Write as a percentage:
E
Write as a decimal:
Estimate the answer to the following calculation,to the nearest whole number. Do not work outthe exact sum.
351.892 ÷ 69.871 is approximately _____
103 ÷ 22 =
F
The price of a chair is £160. If you get a discount of 12 1/2 %, how much would you pay? £__________
34 = ____ %
25 =2
23 -
13 =
12 x
23 =
77x15
45.01+57.89
13.9x 1.2

Measuring basic skills for longitudinal study 91
Results
As for results from the Word Reading scale, the children in the general population sample
who participated in the Child Assessment Pilot study had a higher average score on the
Number Skills scale than the cohort members children involved in the dress rehearsal (See
figure 5.13). Again, however, the spread of scores is substantial in both pilot surveys, which
adds confidence in the use of the test.
Figure 5.13. Ability scores in the School Age Number Skills scale
5.10 Overview of other components of the Parent and Child Interview
The Parent and Child Interview had numerous components. Apart from assessing the
cognitive skills of cohort members’ children, for the cohort members involved in the Parent
and Child Interview, there was an additional set of interview questions to answer about each
of their children, and a paper-based self-completion questionnaire to fill in for each child. In
addition to this, each eligible child aged 10 and above was also asked to complete a paper-
based self-completion questionnaire. These additional components went through the same
rigorous piloting procedures as the adult and child assessments.
5.10.1 Additional interviewer (CAPI) questions
These questions concentrated on the health, current or previous childcare arrangements and
education experiences of each of the cohort member’s children. These were expected to last
10 minutes per child, shorter if the child had not yet started school.
General health of child
■ Long-standing illness disability or infirmity – whether they had any, what it was, when it
started.
■ Whether the long-standing illness, disability or infirmity limited childhood activities – play,
games, sport.
■ Registered disabled?
■ Number of accidents, details of the most severe accident, age accident happened.
■ Number of hospital admissions, details of the most severe accident, age accident happened.
Immunisations.
■ Details of specific health problems: asthma, eczema, hayfever, diabetes,
convulsions/seizures, cancer, sight, hearing, speech problems, congenital abnormalities,
PILOT STUDY
DRESS REHEARSAL
pe
rce
nta
ge
<75 <100 <125 <150 150+
Number Skills ability score
10
15
20
25
30
35
40

Research Report92
kidney or bladder disease, bone/joint problems, cerebral palsy, ADHD, Autism, dyslexia,
anxiety or aggression, eating disorders, any other problems.
Health behaviour of mother
■ Smoking, drinking and Cannabis practices when pregnant.
■ Whether mother breastfed child and for how long.
Family disruption
■ Experience of separation from parent before child age 7: where child was, for how long and at
what age.
■ Experience of Local Authority Care: where child was, for how long and at what age.
Education
■ Age child started school, type of school.
■ Type of early years education or childcare child currently has or had before starting school.
■ Name and address of current school.
■ How parent/cohort member selected school – was it first choice, did they visit the school,
reasons sent child to this school.
■ How parent/cohort member views teaching in this school.
■ How satisfied parent/cohort member is with child’s progress in school.
■ If parent/cohort member attends parents evening, reads school reports.
■ Whether parent/cohort member is involved with activities in child’s school.
■ If child has extra/private lessons or classes and if so, what subject.
■ If child has any Special Education Needs (SEN), the type of SEN and if they have received a
Statement of Needs.
■ What parent/cohort member thinks child will do when they reach 16, how likely it is the child
will go to university.
5.10.2 Paper self-completions
The parent paper self-completion questionnaires covered parenting styles and the
development of children. One was completed for each of the cohort member’s resident
natural or adopted children. In addition to this, any of these children aged between 10 years
and 16 years, 11 months inclusive were asked to complete a questionnaire about their
activities at home and school, attitudes, self-esteem and educational aspirations.
5.10.3 Parent self-completions
There were four different questionnaires as questions were necessarily specific to reflect the
age of a child. Some minor routing was also necessary within the questionnaires about the
younger children, as a child’s development during the first few years is very rapid. The
questionnaires were also in different colours to help ensure the interviewers always gave the
parent the appropriate questionnaire.
■ 0–11 months (pink).
■ 1–2 years 11 months (blue).
■ 3–5 years 11 months (green).
■ 6–16 years 11 months (lilac).
All questionnaires included questions on the child’s behaviour, the relationship between the
parent (cohort member) and child, the parenting style of the cohort member in relation to
rules and discipline, and reading and learning activities. In addition to these, if a child was

Measuring basic skills for longitudinal study 93
under 3 years, parents answered questions on the child’s cognitive development. This was not
included for children aged 3 and over as these children completed the assessments (detailed
earlier in this chapter).
Although questions selected were established questions that had been previously used in
either cohort or other survey questionnaires, it was still necessary to pilot the questionnaires
to find out:
■ how long the parent/cohort member took to complete each questionnaire;
■ whether parents/cohort members knew how to answer the questions – were the instructions
easy to follow, did the questions make sense?
■ if the parent/cohort member enjoyed completing the questionnaire; and
■ if the questions complemented each other.
Interviewer feedback and modifications
The overall feedback from the pilot was that parents generally enjoyed the reflective process
of filling out the questionnaires. It allowed them time to contemplate their relationship with
their children and, in some instances, how different their children were from each other. Most
households reported that they had learnt something about their own family as a result of
completing the questionnaires. The overall view from parents was that the majority of
questions were straightforward to answer, and the routing was simple to follow.
Very few questions were dropped following feedback from parents and further consultation
within the research team, but some were not asked for certain age groups as they were not
appropriate. This was usually because a question was asking about a behaviour that was
deemed ‘too young’ or ‘too old’ for a child within a particular age band. For example, parents
were not asked ‘How often have you taken away your child’s pocket money or allowance?’ if
their child was under age 3. Very minimal changes to question wording were undertaken
between the pilot and the dress rehearsal as the questions were established questions.
However, the layout of the questions and corresponding answer categories in the booklets
was improved.
Content of the final parent self-completion questionnaires
■ Cognitive development: these questions were used in the similar NCDS Mother and Child
Survey in 1991. There are 15 questions for parents to answer. Questions are age-specific, but
there is a lot of overlap between the different age groups which are split into 3 month
intervals, i.e. 0–3 months, 4–6 months, 7–9 months, etc. up to 21 months. From 22 months to
35 months, the 15 questions are the same. Response options are ‘yes’, ‘no’, ‘not sure’.
Examples of questions:
– age 0–3 months: “Have your child’s eyes ever followed a moving object?”
– age 0–3 months and 7–9 months: “Has your child ever seemed to enjoy looking in the
mirror at him or herself?”; and
– age 19–21 months: “Has your child ever run?”
■ Behaviour: these questions were taken from two sources. Parents of children up to age 3
92. Fullard, W, McDevitt, S, and Carey, W (1968) first developed The Carey Temperament Scales (1968). Arizona: Behavioral-
Development Initiatives.

Research Report94
were asked 20 questions from The Carey Temperament Scales92; parents of children between
age 3 and 16 years, 11 months were asked to complete the Strengths and Difficulties
Questionnaire93. This contains 26 questions, with an additional seven questions for parents
who feel their child has some level of emotional, concentration or behaviour difficulty.
The Carey Temperament Scales
The scales are appropriate for children up to age 3. There are three different scales
depending on the age of the child. The scales contain between 76 and 97 questions. There are
six response options ranging from ‘almost never’ to ‘almost always’, including ‘don’t know/not
applicable’.
– Early Infant Temperament Scale (0–3 months): 76 questions;
– Revised Infant Temperament Scale (4–11 months): 95 questions; and
– Toddler Temperament Scale (1 year–2 years, 11 months): 97 questions.
Within each scale, nine aspects of a child’s behaviour are measured by between 8 to 13
questions. Some questions from the Revised Infant Temperament Scale were included in the
second sweep of the MCS in 2003–04, and measured adaptability, mood, approach and
rhythmicity. The same questions were used in this survey to maintain some consistency
between cohorts, with additional questions selected to make 20 in total. The same four
aspects of behaviour were covered by these questions; five questions related to each aspect.
The questions were selected to be as similar as possible for the three age groups.
Examples of questions:
– age 0–3 months: “Your child objects (cries/frets) if someone other than the mother or
main caregiver gives care.”; and
– age 4–11 months and 1 year–2 years, 11 months: “Your child’s initial reaction to a new
babysitter is rejection (crying/clinging to mother or main caregiver).”
Strengths and difficulties questionnaire
This set of 26 questions (25 basic questions and one impact question) is appropriate for
children between age 3 and 16 years. There are two versions, although only two questions
differ between them. One version is for children between age 3 and 3 years, 11 months, the
other for children age 4 and over. The questions that differ are detailed below. The response
options are ‘not true’, ‘somewhat true’, and ‘certainly true’.
Examples of questions:
– age 3 years–3 years, 11 months: “Often argumentative with adults”, “Spiteful to others”;
and
– age 4 years–16 years, 11 months: “Often lied or cheated”, “Stole from home, school or
elsewhere.”
Relationship between parent and child: the Child-Parent Relationship Scale (Pianta: Short
93. Goodman, R (1997). ‘The Strengths and Difficulties Questionnaire: A Research Note’. Journal of Child Psychology and
Psychiatry, 38, pp 581–586.
94. It was adapted from the Student-Teacher Relationship Scale (STRS, Pianta, 1992). The Child-Parent Relationship Scale
(CPRS: Short Form) is a 15-item self-administered rating scale, with responses on a five-point Likert scale. It is the shortened
version of the 30-item CPRS. Items were derived from attachment theory and the attachment Q-set (Waters and Dean, 1985) as
well as a review of the literature on mother-child interactions.

Measuring basic skills for longitudinal study 95
Form) measures the parent’s report of the child’s relationship with the said parent94. These
questions were used in the second sweep of the MCS in 2003–2004, though some were
adapted by the research team to be more age specific. Some questions were appropriate for
all children. Parents answered between 10–13 questions. There were five response options
ranging from ‘definitely does not apply’ to ‘definitely applies’.
Examples of questions:
– age 0 months–16 years, 11 months (i.e. all children): “Dealing with my child drains my
energy”, “My child will seek comfort from me”; and
– age 6 years–16 years, 11 months: “My child shares his or her feelings with me.”
■ Parenting style (discipline): these questions were included in MCS, second sweep. Some were
adapted by the research team to be more age-specific. Parents answered between five and
ten questions, depending on the age of their child. As previously, some questions were
appropriate for all children, some were age-specific. Parents have to think back over the last
three months and select one of the six response options ranging from ‘never’ to ‘always’,
including ‘not applicable’.
Examples of questions:
– age 0 months–16 years, 11 months (i.e. all children): “How often have you ignored your
child?”, “How often have you shouted at your child?”; and
– age 3 years–16 years, 11 months: “How often have you had to take away TV privileges or
other treats?”
■ Reading and learning: most of these questions were asked in the NCDS Mother and Child
Survey in 1991. These questions covered parents reading to or with their child, how many
books a child had (or shared with their siblings), and what building blocks to learning had a
parent helped their child with (numbers, the alphabet, colours, shapes and sizes). A few
additional questions regarding homework were asked for children age 6 years and older.
Child self-completion
This questionnaire was for children aged 10 years and older. It was originally designed as a
CASI but was revised to a paper self-completion for the dress rehearsal and main fieldwork.
The questionnaire essentially asked about their activities at school and home, their attitudes,
self-esteem and educational aspirations95, but some questions were not presented to children
aged between 10–11 years, 11 months, as they were not appropriate96. These questions came
at the end of the questionnaire on a perforated page that interviewers tore out before handing
the questionnaire over to the child if they were between 10–11 years, 11 months. Children age
12 years and older answered all questions. Verbal parental consent was gained before the
child was asked if they would complete the questionnaire.
95. Questions were taken and developed from a variety of sources. These included: British Household Panel Study (BHPS),
Department for Education and Skills (DfES), Department of Health (DOH), Education Maintenance Allowance Study (EMA),
National Child Development Study (NCDS), Scottish School Leavers Study (SSLS), You and Your School (NfER study), Youth
Lifestyles Survey (YLS).
96. A primary concern was not to offend or upset the cohort member or their child in any way. Questions on alcohol, tobacco,
drug use, stealing and bullying were not put to younger children.

Research Report96
Interviewer feedback and modifications
Forty children between ages 10 and 16 completed the CASI in the pilot study. There were no
difficulties getting parental consent, although some parents had wanted to see a transcript of
the questionnaire before giving their consent. In the dress rehearsal and main fieldwork.
Interviewers had a ‘spare’ copy of the child self–completion questionnaire to show parents
wary of the questions it contained. However, parents could not see the questionnaire once it
had been completed by their child.
Some children had difficulty understanding what some of the questions were getting at,
particularly the younger ones. This was particularly so for questions capturing self-esteem.
The younger ones took the longest to complete the questionnaire, and there was a general
feeling that the questionnaire took too long. It took an average of 15 minutes, 5 minutes too
long, but at least one child took 35 minutes.
Many questions were dropped, replaced or refined for the dress rehearsal. The initial 58
questions (with an additional 14 routed questions) were reduced to 25 questions (with an
additional 19 routed questions) in the dress rehearsal. For the main fieldwork, additional
amendments left no routing instructions as such to follow. Children age 10–11 years 11
months had 30 questions to answer, children age 12–16 years 11 months had 37 questions to
answer. To give the interviewer more flexibility and allow different activities to be conducted in
parallel, the revised child self-completion was produced in both a CASI and paper version for
the dress rehearsal. Interviewers were asked to use the paper version, with the CASI being on
their computer as a back up, to be used to interest children reluctant to use ‘pen and paper‘.
No interviewers used the CASI and it was dropped altogether for the main fieldwork. The
additional seven questions for older children were on a perforated page at the back of the
questionnaire, which the interviewer removed before handing the questionnaire over to the
younger children.
Content of the final child self-completion questionnaire
The origins of the questions included in the questionnaire are indicated in parentheses, (for
details see footnote 95, page 95).
Home life – this section included questions on:
■ time spent watching TV, DVDs and Videos (BHPS);
■ time spent playing computer games (DfES);
■ how often the child read a book for pleasure (DfES);
■ how often they went to youth clubs, sports clubs/lessons, scouts/guides parties/nightclubs
(BHPS and ESRC 14–19 Initiative);
■ who they like to spend their free time with (BHPS);
■ amount of spending/pocket money (EMA);
■ if parents ask where they are going when go out on their own (EMA);
■ how often they help around the house (EMA);
■ how often they talk to their mum (or dad) about what they do at school (EMA);
■ how often they talk to their mum (or dad) about other things – friends, going out, etc. and
(EMA).
School life – this section included questions on:
■ how they feel about teachers at school (You and Your School);

Measuring basic skills for longitudinal study 97
■ how they feel about time spent at school (You and Your School);
■ how important it is to get good marks for school work and/or exams (You and Your School);
■ what they want to do when they reach 16 (DfES and NCDS);
■ how likely it is that they will go to university (SSLS); and
■ if they truant (DfES and EMA).
Self-esteem - this section consisted of 12 questions taken from the Harter Scale97. The
questions covered both self-esteem and scholastic achievement and had been answered by
children age 8 years and above in the NCDS Mother and Child Survey in 1991. As the
questions were now part of the self-completion questionnaire, the wording of some questions
was altered after consultation with Susan Harter. In addition, the research team spent a lot of
time making the instructions and layout of the questions as clear as possible. The child was
taken through an example by the interviewer to make sure they were clear what they had to
do. They could also ask the interviewer for guidance at any time.
Example of final question layout:
Some young people never worry OR Some young people worry about
about whether they can do the whether they can do the school work
school work given to them given to them
Tick one box
Really true Sort of true Really true Sort of true
for me for me for me for me
Recreation- this section was only for children between age 12 and 16 years and 11 months.
Questions in this section included:
■ smoking and drinking alcohol (DOH);
■ use of cannabis and glue/solvent abuse (DOH);
■ theft from shops (YLS); and
■ bullying – ever been bullied or ever bullied someone else (DfES and EMA).
97. Harter, S (1984). “The perceived competence scale for children”. Child Development, vol 53, pp 87–97.

Research Report98
6 Summary and conclusions
The work that is the subject matter of this report took place against the background of a
major new initiative in Britain, both to understand and to tackle the problem of poor basic
skills in a substantial minority of the population. As was pointed out in chapter 1, concerns
were driven by the growing body of evidence that basic skills difficulties were a major
impediment to successful functioning in modern society. This culminatied in the work of the
Moser Committee and the ongoing policy development that flowed from it, Skills for Life.
Although the prime driver of this development was especially the damage to economic
competitiveness caused by basic skills deficits, there was also a social dimension in the
acknowledgement that poor basic skills was one of the factors in the growing marginalisation
and social exclusion of some sections of the adult population. Such problems tended to be
repeated across the generations.
The Moser Committee also saw the need for the continuing collection of evidence both to
identify what worked in terms of improved teaching of basic skills to adults and better
methods of assessment to monitor the effectiveness of new practice. There was also the need
to model further the socio-economic consequences of poor basic skills and for further
investigation of the likely long-term economic and social returns to investment in basic skills
acquisition throughout the education system from pre-school through primary to secondary
school and beyond. The 1958 and 1970 cohort studies were an important source of evidence
that needed expanding and updating because of the relatively small sub-samples from which
the original basic skills data were collected. The Skills for Life strategy, and the research
programme that NRDC set up to support it, offered the opportunity to extend measurement to
the whole of one of the birth cohorts, the 1970 cohort, at the age of 34, for which funding was
already available for a follow-up.
6.1 Aims of the assessments
6.1.1 Literacy and Numeracy
Work by Greg Brooks and colleagues concluded that no one instrument would satisfy all
measurement requirements in the NRDC programme. There was a need for fine-tuned tests
to assess micro improvements among learners in responses to teaching. However, for the
purpose of describing and explaining processes in the population at large, much ‘broader
brush’ instruments were needed along the lines of those in the earlier studies. These tests
should measure adult literacy and numeracy at the levels established by Qualifications
Curriculum Authority (QCA) for the new adult basic skills curriculum and qualifications
framework. For this reason, the literacy and numeracy tests needed to be able to map onto
the national ‘baseline’ basic skills needs assessment that was carried out in 2002–2003 on a
large representative sample of the British population, while at the same time maintaining
continuity with the earlier measures.
6.1.2 Dyslexia
The new survey offered the opportunity for further extension of measurement. At age 10, the
cohort had undertaken a dyslexia assessment. In view of the controversial role of dyslexia,
especially whether there were special curricular needs for adult dyslexics, it was decided to
include a dyslexia assessment in the new survey.

Measuring basic skills for longitudinal study 99
6.1.3 Intergenerational comparisons
As BCS70 cohort members would be 34 at the time of the new survey, the other major task of
the design was to mirror the intergenerational study that was used with a sub-sample of the 33-
year-old follow-up in the older 1958 NCDS cohort study and assess a sample of cohort
members’ children. The selected tests needed to offer comparability with those used in the
NCDS survey while also providing intergenerational continuity with the assessments the cohort
members had undertaken during childhood and as adults.
Designing new measurements and selecting from existing ones for particular purposes needed
to meet certain standards to ensure maximum utility for analysis. These included:
■ validity, i.e. that the test met the particular research requirement specified for it;
■ reliability, i.e. consistency in measurement across time and across test administrators; in this
case, survey interviewers; and
■ feasibility, in the sense that, with adequate training, the administration could be handled in the
context of a 90-minute interview taking place in cohort members’ homes.
This last requirement is particularly important in the context of a cohort study. Although the
assessment data might be expected to enrich hugely the large and complex information
resource that constitutes BCS70, this must not be bought at the expense of cohort members’
willingness to continue to participate in the study. Thus, undue complexity and potential
respondent burden had to be kept to a minimum.
We summarise briefly below the operations undertaken to meet these design aims. We also give
an appraisal of the extent to which the aims were achieved.
6.2 Operations
The average time available for the Core BCS70 interview was 1 hour and 30 minutes, of which
40 minutes were given over to the adult assessments: 30 minutes for the literacy and numeracy
assessments, and 10 minutes for the dyslexia exercises. The new literacy and numeracy
assessments were designed from items previously used to assess BCS70 cohort members and
items from the Baseline Survey98. Symptoms associated with dyslexia were measured from
exercises from the Dyslexia Adult Screening Test (DAST)99.
In the intergenerational Parent and Child Interview, cohort members had an additional 20
minutes of interviewer and self-completion questions. An additional 20 minutes were available
to assess the cognitive skills of cohort members’ children with a number of scales selected
from the British Ability Scales, BAS II100. Eligible children (age 10+) also had a 10-minute self-
completion questionnaire.
Once the extensive research and literature reviews had been completed and the assessment
tools had been selected, the standard design protocol for a cohort study follow-up survey was
put into practice (see chapter 1). This encompassed a substantial developmental stage as a new
98. Williams, J, Clemens, S, Oleinikova, K and Tarvin, K (2003). The Skills for Life survey: A National Needs and Impact Survey
of Literacy, Numeracy and ICT Skills. Department for Education and Skills Research Report 490. Crown copyright.
99. Fawcett, A. J. and Nicolson, R. I. (1998). The Manual of Dyslexia Adult Screening Test (DAST). London: The Psychological
Corporation.
100. Elliot, C D (1983, 1996). British Ability Scales II: Core Scale 2. Berkshire: The NFER-NELSON Publishing Company Ltd.

Research Report100
adult literacy and numeracy assessment was developed and the feasibility of the dyslexia and
child assessments needed to be assessed.
Three ways of measuring basic skills were adopted in the 2004 survey. Cohort members
answered questions on self-reported difficulties before attempting multiple-choice and open-
response literacy and numeracy assessment items. Development work to establish robust
survey instruments, with special emphasis on the new literacy and numeracy assessments,
began in 2002.
6.2.1 Self-reported difficulties
As reported in chapter 3, in previous surveys, only cohort members who reported difficulties
to an initial general question were asked about more specific difficulties. In 2004, all bar one
of the basic skills questions included in the 1999/2000 survey of BCS70 cohort members
were, for the first time, put to all BCS70 cohort members.
Results from the pilot and dress rehearsal were encouraging. For the questions previously
asked to cohort members, the percentages of cohort members who reported difficulties in
previous sweeps were very similar to the percentages reporting difficulties in the dress
rehearsal. For the questions not previously asked to all cohort members in previous sweeps,
many of the respondents in the Basic Skills Pilot and dress rehearsal reported difficulties
with at least one aspect of reading, writing or number work.
6.2.2 The adult assessments
The new literacy and numeracy assessment was designed from the two identified best
candidate instruments:
■ tests previously used in the 1958 and 1970 cohort studies: paper-based, open-response
questions; and
■ the Skills for Life Survey (also known as the National Survey of Adult Basic Skills Needs and
as the Adult Basic Skills Baseline Survey): computer-based, multiple-choice questions.
Some tasks that cohort members completed in the earlier surveys were retained and new
tasks were imported from the national baseline needs survey. The basic skills pilot was used
to gain the information required to design an assessment instrument based on the best
combination of multiple-choice questions that, in conjunction with the open-response
questions, would take an average of 30 minutes to administer.
A rigorous selection criterion was applied to the open-response questions that 10 per cent of
the cohort had answered when age 21. Seven literacy and six numeracy questions were
selected. Although, in essence, the questions remained the same, amendments were made to
bring some questions up to date. Comparisons of the overall percentage incorrect figures
from the original representative 10 per cent BCS70 survey, the basic skills pilot study and the
dress rehearsal, itself made up of BCS70 cohort members, revealed a high level of
consistency. The same patterns of difficulty were replicated by the three different sets of data,
and the percentage of respondents scoring between 0–7 for literacy and 0–6 for numeracy
was strikingly similar for the three sets of respondents, with generally lower numbers gaining
high scores for numeracy than for literacy.
More multiple-choice questions were piloted than were used in the final assessment to
facilitate selection of the questions that would provide as comprehensive coverage as possible

Measuring basic skills for longitudinal study 101
of the Adult Literacy and Numeracy Core Curricula for England within the time constraints. A
simple method of adaptive testing that involved two tiers was adopted for the pilot study.
Essentially, all respondents answered an initial set of questions. Depending on the number of
correct answers a respondent gave to these initial questions, they either progressed to:
■ a set of harder questions – the ‘upper tier’; or
■ a set of easier questions – the ‘lower tier’.
This approach would permit an overall score based on all respondents to be calculated, along
with allowing a ‘spiky profile’ to be built for those with the poorest grasp of the basic skills
(those on the lower tier).
The literacy assessment produced a good spread of scores with, as we might expect, a bias
towards high performance. This reflects the relatively low incidence in the population of very
poor reading skills. The two-tiered assessment was retained. The screening questions were
able to accurately identify a group of adults with the most severe literacy difficulties, between
5 per cent-6 per cent, translating in BCS70 terms into a substantial sample of 500–600 BCS70
adults with a very poor grasp of literacy.
Pilot results for the numeracy assessment showed that an overall score could not
successfully be interpreted from results of the two-tiered numeracy assessment. The basic
design of the numeracy assessment was therefore revised. Given the wide spread and diverse
nature of difficulties associated with numeracy in the general population, the revised
assessment aimed to create a ‘spiky profile’ of number skills at the population level rather
than restricting this examination to the 1 in 4 or 1 in 3 with the poorest grasp of numeracy.
Results from the revised numeracy assessment used in the dress rehearsal were
encouraging. By removing the ‘screen’ that placed relatively high numbers of respondents on
a lower tier, more continuity in the measurement of performance from one level to the next
was achieved. Further encouragement for the validity of the design of the literacy and
numeracy multiple-choice part of the assessment was obtained from the distribution of
cohort members’ performance across levels. This closely reflected the distribution of the
population obtained in the National Survey of Adult Basic Skills Needs.
6.2.3 Dyslexia
The final part of the adult assessment was to measure the prevalence of some of the
symptoms associated with dyslexia using DAST, though time restrictions would limit the final
assessment to four exercises (see chapter 4). The Reading and Spelling exercises were
particularly strong candidates for selection, given their obvious relationship with basic literacy
skills. The other two selected exercises were Spoonerisms and a Nonsense Reading exercise.
Evidence in support of the validity of the measures comes from the Vinegrad Checklist101. This
short questionnaire consists of 20 ‘yes-no’ questions and can identify two groups of adults:
‘non-dyslexics’ (a score between 0–7) and ‘dyslexics’ (a score of 8 plus). Respondents with a
score of 8 plus on the Vinegrad Checklist (dyslexic) performed consistently worse than
respondents with a score between 0–7 (non-dyslexic) in all the DAST exercises. Using the pilot
101. Although this originated in the Dyslexia Institute, it was later revised by Michael Vinegrad and since became known as the
Vinegrad Checklist. Vinegrad, M (1994). ‘A Revised Adult Dyslexia Checklist’. Educare, vol 48, pp 21–23.

Research Report102
data as a guide, the average time it would take a cohort member to complete the four
selected DAST exercises was still too long. After further consultation, the spelling exercise
was reduced by half, bringing the estimated average time to under the required 10 minutes.
6.2.4 The child assessments
The battery of individual scales that make up the BAS II objectively, reliably and economically
measure a child’s strengths and weaknesses, providing a comprehensive assessment of their
current intellectual functioning and basic educational progress. Each individual scale selected
had its own rules of administration, which were programmed into the computer to minimise
burden and error on the part of the interviewer. After encountering minor programming
errors in the Parent and Child Pilot, this innovation has proved to be very successful in the
BAS II scales retained for the main fieldwork. After piloting, the Spelling exercise for school-
age children was revised following interviewer feedback, which does restrict comparison with
standardised scores. However, the step was necessary to reduce burden on the children. The
BAS II Copying scale administered to younger children was replaced with a similar, simpler,
alternative that BCS70 cohort members themselves had completed at age 5. Again,
comparisons with standardised BAS II norms have been lost, but very interesting
intergenerational comparisons between parent and child have been gained.
Although based on small numbers of children, the spread of their scores in each of the
individual exercises, although different in each exercise, resembled the spread of scores
required for the main survey.
6.3 Overall appraisal
Despite the tight time and administrative constraints on the wide range of assessments to be
used in the survey, we believe that overall the goals set for them have been achieved. We now
have a battery of reliable instruments that we know can be effectively administered in
people’s homes by appropriately trained interviewers. The assessments have validity in
tapping the core dimensions of literacy and numeracy at the requisite levels with which the
survey is concerned. They can also be used to assess the presence of dyslexia as a factor in
poor reading. Reliable children’s assessments of basic skills and broader cognitive measures
spanning a wide age range are also available. Well developed questionnaires to tap family
functioning and child development can be employed to unpack further the family factors
involved in children’s cognitive development and basic skills acquisition.
The prime purposes of the report have been to demonstrate ‘fitness for purpose’ in the
research to be undertaken to support the Skills for Life strategy and supply the details of
design that will be of help in interpreting the research results. The report also serves as a
source book enabling others to replicate the approach to assessment design on new samples
of adults or children102. Overall, the development work has provided the basis for a
substantial contribution to the knowledge base on which the success of Skills for Life
ultimately depends.
102. Permission must be sought from nferNelson to use any of the scales from the BAS II detailed.

Measuring basic skills for longitudinal study 103
References
Bracken, B A (1998). Bracken Basic Concept Scale – Revised (BBCS-R). London: The
Psychological Corporation.
Brooks, G, Giles, K, Harman, J, Kendall, S, Rees, F and Whittaker, S (2001). National
Foundation for Social Research: Assembling the Fragments – A Review of Research on
Adult Basic Skills. DfEE Research Report 220. Department for Education and Employment.
Brooks, G, Heath, K and Pollard, A (2005). Assessing Adult Literacy and Numeracy: a Review
of Research Instruments. London: National Research and Development Centre for Adult
Literacy and Numeracy.
Bynner, J and Steedman, J (1995). Difficulties with Basic Skills. London: The Basic Skills
Agency.
Bynner, J and Parsons, S (1997). It doesn’t get any better. London: The Basic Skills Agency.
Bynner, J, McIntosh, S, Vignoles, A, Derden, L, Reed, H and Van Reenen, J (2001). Improving
Adult Basic Skills: benefits to the individual and society. DfEE Research Report
RR251.London: HMSO.
Carey, S, Low, S and Hansbro, J (1997). Adult Literacy in Britain. London: The Stationery
Office.
DfEE (2001). Skills for Life: The National Strategy for Improving Adult Literacy and
Numeracy Skills. Report ref: SFLLN.
DfES/BSA (2001).The Adult Literacy Core Curriculum (Trainers’ Pack). London: Department
for Education and Skills/The Basic Skills Agency.
Dunn, L.M., & Dunn, L.M. (1981). Peabody Picture Vocabulary Test-Revised. Circle Pines, MN:
AGS Publishing
Dunn, L.M., & Dunn, L.M. (1997). Peabody Picture Vocabulary Test-Third Edition. Circle
Pines, MN: AGS Publishing
Dunn, L. M and Markwardt, J C (1970). Peabody Individual Achievement Test Manual. Circle
Pines, MN: American Guidance Service.
Economic and Social Research Council (1993). National Child Development Study Sweep V
User Guide. Available from the ESRC Data Archive.
Ekinsmyth, C and Bynner, J (1994). The Basic Skills of Young Adults. London: The Basic
Skills Agency.
Elliot, C D (1983, 1996). British Ability Scales II: Core Scale 2. Berkshire: The NFER-NELSON
Publishing Company Ltd.

Research Report104
Elliot, C. D, Smith, P and McCulloch, K (1996). British Ability Scales II: Administration and
Scoring Manual. Berkshire: The NFER-NELSON Publishing Company Ltd.
Elliot, C D, Smith, P and McCulloch, K (1997). British Ability Scales II: Technical Manual.
London: The NFER-NELSON Publishing Company Ltd.
Fawcett, A J and Nicolson, R I (1996). The Dyslexia Screening Test (DST). London: The
Psychological Corporation.
Fawcett, A J, Nicolson, R I and Dean, P (1996). “Impaired Performance of Children with
Dyslexia on a Range of Cerebellar Tasks” in Annals of Dyslexia, vol 46, pp 259–283.
Fawcett, A. J. and Nicolson, R. I. (1998). The Dyslexia Adult Screening Test (DAST). London:
The Psychological Association.
Fullard, W, McDevitt, S and Carey, W (1968).The Carey Temperament Scales. They are
published by Behavioral-Development Initiatives, 14636 North 55th Street, Scottsdale, AZ
85254.
Fuller, E, Lessof, C, Simmonds, N and Foudouli, V (forthcoming). 1970 British Cohort Study,
2004 surveys: technical report. London: NatCent
Goodman, R (1997). “The Strengths and Difficulties Questionnaire: A Research Note” in
Journal of Child Psychology and Psychiatry, vol 38, pp 581–586.
Hamilton, M (1987). Literacy, Numeracy and Adults. London: ALBSU (Adult Literacy and
Basic Skills Unit, now The Basic Skills Agency).
Harter, S (1984). “The Perceived Competence Scale for Children” in Child Development vol 53,
pp 87–97.
Kaufman, A S (1994). Intelligence Testing with the WISC-III. New York: Wiley.
McCulloch, A, and Joshi, H (2001). “Neighbourhood and Family Influences on the Cognitive
Ability of Children in the British National Child Development Study” in Social Science and
Medicine, vol 53.5, pp 579–591.
McCulloch, A, and Joshi, H (2002). “Child Development and Family Resources: as Exploration
of Evidence from the Second Generation of the 1958 Birth Cohort” in Journal of Population
Economics, Vol 15, pp 283–304.
Miles, TR (1982, 1997). The Bangor Dyslexia Test. Wisbech, Cambs: Learning Development
Aids.
Miles, T R, and Haslum, M N (1986). “Dyslexia: Anomaly or Normal Variation?” in Annals of
Dyslexia, vol 36, pp 103–117.
Miles, T R and Miles, E (1999). Dyslexia: A hundred Years On. 2nd Edition. Buckingham: Open
University Press.

Measuring basic skills for longitudinal study 105
Miles, T. R, Wheeler, T J and Haslum, M N (2003). “The Existence of Dyslexia Without Severe
Literacy Problems” in Annals of Dyslexia, vol 53, pp 340–354.
Moser Report (1999). A Fresh Start: Improving Literacy and Numeracy. DfEE publication ref
CMBS1. London: HMSO.
National Centre for Social Research, (2003). 1970 British Cohort Study: Report on the Pilot of
Basic Skills Assessments for the 2004 Surveys. Unpublished report.
National Centre for Social Research, (2004). 1970 British Cohort Study, 2004 surveys: Project
Instructions. Unpublished report.
Osborn, A F, Butler, N R and Morris, A C (1984). The Social Life of Britain’s Five Year Olds: A
report of the Child Health and Education Study. London: Routledge and Kegan Paul.
Osborn, A F and Milbank, J E (1987). The Effects of Early Education: A Report from the Child
Health and Education Study of Children in Britain Born 5 – 11 April 1970. Oxford: Clarendon
Press.
Parsons, S and Bynner, J (1998). Influences on Adult Basic Skills. London: The Basic Skills
Agency.
Parsons, S, and Bynner, J (1999). Literacy, Leaving School and Jobs: the effect of poor basic
skills on employment in different age groups. London: The Basic Skills Agency.
Rice, M and Brooks, G (2004). Developmental dyslexia in adults: a research review. London:
National Research and Development Centre for Adult Literacy and Numeracy.
Rust, J (1995). Wechsler Individual Achievement Test – UK (WIAT-UK). London: The
Psychological Corporation.
Rutter, M, Tizard , J and Whitmore, K (1970). Education, Health and Behaviour. London:
Longman.
Shepherd, P (1993). “Analysis of Response Bias” in Ferri, E (ed) Life at 33; the Fifth Follow-up
of the National Child Development Study. London: National Children’s Bureau and City
University.
Shepherd, P (1997). “Survey and Response” in Bynner, J, Ferri, E and Shepherd, P (eds).
Twenty-something in the 1990s: Getting on, Getting by, Getting Nowhere. Aldershot:
Ashgate Publishing Ltd.
Smallwood, S (2002). “New Estimates of Trends in Births by Birth Order in England and
Wales” in Population Trends, vol 108, pp 32–48.
Snijders, J T and Snijders-Oomen, N (c. 1987). Snijders-Oomen Non-Verbal Intelligence
Scale. Netherlands: Wolters-Noordhoff.

Research Report106
Snijders, J T, Tellegen, P J and Laros J A (1989, 1996). Snijders-Oomen Non-Verbal
Intelligence Scale (SON-R). Netherlands: Wolters-Noordhoff (Manual) and Swets and
Zeitlinger.
Tellegen, P J, Winkel, M, Wijnberg-Williams, B J and Laros J A (1998). Snijders-Oomen Non-
Verbal Intelligence Scale. Netherlands: Swets and Zeitlinger.
Terman, L M and Merrill, M A (1961). Stanford-Binet Intelligence Scale. 3rd edition. IL, USA:
The Riverside Publishing Co.
Verropoulou, G, Joshi, H and Wiggins, R D (2002). “Migration, Family Structure and Children’s
Well-being: A Multilevel Analysis of the Second Generation of the 1958 Birth Cohort Study” in
Children and Society, Vol 16, pp 219–231.
Vinegrad, M (1994). “A Revised Adult Dyslexia Checklist” in Educare, No. 48, pp 21–23.
Wechsler, D (1976). Wechsler Intelligence Scale for Children – Revised (WISC-R). 2nd
(British) edition. London: NFER-Nelson.
Wechsler, D (1992). Wechsler Intelligence Scale for Children (WISC-III). 4th edition. London:
The Psychological Corporation.
Wechsler, D (1999). Wechsler Abbreviated Scale of Intelligence (WASI). London: The
Psychological Corporation.
Weiss, L G, Prifitera, A and Roid, G (1993). “The WISC-III and the Fairness of Predicting
Achievement across Ethnic and Gender Groups” in Journal of Psychoeducational
Assessment WISC-III Monograph, pp 35–42.
Williams, J, Clemens, S, Oleinikova, K and Tarvin, K (2003). The Skills for Life Survey: A
National Needs and Impact Survey of Literacy, Numeracy and ICT Skills. Department for
Education and Skills Research Report 490. Crown copyright.

Measuring basic skills for longitudinal study 107
Appendices
BASIC SKILLS APPENDIX
Table A3.1a. General Reading Practice Questions in 2004 Survey
Table A3.1b. Questions on Self-Reported Difficulties in 2004 Survey
Table A3.1c. Questions on skills courses and improvement of skills in 2004 Survey
Table A3.2a. Selection of items for the literacy multiple-choice assessment
Table A3.2b. Selection of items for the numeracy multiple-choice assessment
All open-response questions and corresponding showcards in 2004 survey.
Table A3.3. Open-response literacy and numeracy questions: additional Issues raised by
interviewers at the Interviewer de-briefing following the Basic Skills Pilot
DYSLEXIA APPENDIX
Table A4.1. Why DAST needed to be completely administered on paper
Table A4.2. Further details of scores in the One-Minute Reading exercise
Table A4.3. Further details of scores in the Two/One-Minute Spelling exercise
Table A4.4. Further details of scores in the Phonemic Segmentation and Spoonerism exercise
Table A4.5. Further details of scores in the Nonsense Passage Reading exercise
PARENT & CHILD APPENDIX
Table A5.1. Naming vocabulary: starting and stopping points for children of different ages.
Table A5.2. Naming vocabulary - additional interviewer comments
Table A5.3. Early Number Concepts: starting and stopping points for children of different ages
Table A5.4. Early Number Concepts - additional interviewer comments
Table A5.5. Specific administration rules for Item 3
Table A5.6. Copying Designs- starting and stopping points for children of different ages
Table A5.7. Word Reading - starting and stopping points for children of different ages
Table A5.8. Spelling - starting and stopping points for children of different ages
Table A5.9. Revised Spelling - starting and stopping points for children of different ages
Table A5.10. Number Skills - starting and stopping points for children of different ages

Research Report108
BASIC SKILLS APPENDIX
Self-reported difficulties
The self-reported basic skills questions were part of the main CAPI interview, and as such
had to compete for space given the time restrictions. After the dress rehearsal, the main
interview was still too long and questions had to be cut. To best accommodate these needs,
all the questions on basic skills difficulties were still asked but the format was changed to
that of a multi-code. This meant that the additional response options introduced to some
questions for the dress rehearsal were removed and cohort members just had to answer ‘yes’
or ‘no’ to each aspect of skills difficulty questioned by the interviewer. This reduced time as
the interviewer would not need to repeat introductions to similar questions and to a certain
extent interviewer and cohort member burdens were also reduced as the number of
questions on basic skills appeared to be less.
A similar format was adopted for asking if a cohort member had been on a course to help
improve their reading, writing, maths or number skills, or if they wanted to improve any of
these skills. Two additional questions on general reading practices completed this set of
questions. All the questions on basic skills included in the 2004 BCS70 survey are detailed in
tables A3.1a, A3.1b and A3.1c below. It should be noted that the questions on reading and
writing difficulties are only put to cohort members who do not report sight difficulties.
Table A3.1a. General Reading Practice questions in 2004 survey
About how often, if at all, would you say you read magazines or newspapers for enjoyment?
1. …every day
2. most days (4 or 5 days each week)
3. at least once a week
4. at least once a month
5. less often than that or
6. never?
About how often, if at all, would you say you read books for enjoyment?
1. …every day
2. “most days (4 or 5 days each week)
3. at least once a week
4. at least once a month
5. less often than that or
6. never?

Measuring basic skills for longitudinal study 109
Table A3.1b. Questions on self-reported difficulties in 2004 survey
How about reading? Do you ever have any difficulties with any of these?
1. Understanding what is written in a magazine or newspaper
2. Reading aloud from a child’s storybook
3. Reading or understanding paperwork or forms
4. None of these
How about writing and spelling? Do you ever have any difficulties with any of these?
1. Writing a letter to a friend to thank them for something
2. Spelling words correctly
3. Making your handwriting easy to read
4. Putting down in words what you want to say
5. None of these
How about maths and number skills? Do you ever have any difficulties with any of these?
1. Telling the right change from a £5 or £10 note
2. Recognising numbers
3. Addition
4. Subtraction
5. Multiplication
6. Division
7. None of these
Table A3.1c. Questions on skills courses and improvement of skills in 2004 survey
Have you ever been on a course to help improve any of these?
1. Reading skills
2. Writing skills
3. Maths or numberwork skills
4. None of these
Would you like to improve any of these skills?
1. Reading skills
2. Writing skills
3. Maths or numberwork skills
4. None of these

Research Report110
Multiple-choice questions
Table A3.2a. Selection of items for the literacy multiple-choice assessment
Item Level Description Aspect % % Men
number of curriculum Time incorrect* – Women
3 EL2 Weather forecast details RC 0.44 50
4 EL2 Weather forecast details SH 0.25 80
Examp1 EL2 Weather forecast details V, WR, P #
14 EL2 Job Advert RC 0.27 20
15 EL2 Job Advert RC 0.30 30
16 EL2 Job Advert RC 0.16 10
17a EL2 Absence note to school WC 30
17b EL2 Absence note to school WC0.49
◆ 30
17c EL2 Absence note to school WC 20
17d EL2 Absence note to school WC 30
48a EL2 Completing a sentence GP 30
48b EL2 Completing a sentence GP0.55
20
48c EL2 Completing a sentence GP 30
48d EL2 Completing a sentence GP 0
5 EL3 Property to Let RC 0.40 22 -15
6 EL3 Property to Let SH 0.18 6 +4
7 EL3 Property to Let SH 0.19 17 +8
8 EL3 Property to Let RC 0.29 16 -2
21 EL3 RSPCA leaflet RC 0.39 40
22 EL3 RSPCA leaflet RC 0.18 20
23 EL3 RSPCA leaflet RC 0.17 20
24 EL3 RSPCA leaflet SH 0.22 39 +9
25 EL3 RSPCA leaflet SH 0.15 1 +1
26 EL3 How TV was invented WC 0.44 24 -4
50 EL3 Stop Thief! Smoking leaflet RC 1.05 70
51 EL3 Stop Thief! Smoking leaflet RC 0.18 50
52 EL3 Stop Thief! Smoking leaflet RC 0.20 20
27 L1 Fire in the home: information GP 0.36 10 -2
28 L1 Fire in the home: information GP 0.23 19 0
29 L1 Fire in the home: information GP 0.17 8 +4
30 L1 Fire in the home: information RC 0.37 32 +9
31 L1 Fire in the home: information RC 0.30 10 +2
58 L1 Driving and Drugs leaflet RC 0.54 19 -6
59 L1 Driving and Drugs leaflet RC 0.20 7 +1
60 L1 Driving and Drugs leaflet SH 0.16 21 -1
61 L1 Driving and Drugs leaflet RC 0.18 10 +5
42 L2 Film reviews RC 0.36 20 +2
43 L2 Film reviews RC 0.27 44 +3
44a L2 Completing a draft letter GP 37 +3
44b L2 Completing a draft letter GP1.07
71 +5
44c L2 Completing a draft letter GP 97 -7
44d L2 Completing a draft letter GP 59 +11
45 L2 Spoken English WC 0.38 18 +10
64 L2 Train timetable RC 0.56 34 +7
65 L2 Train timetable RC 0.56 27 -4
*Percentages in BOLD indicate questions included on the lower tier, which only 10 respondents completed. As such
percentages could not be used as indicators of real failure rates and ‘gender bias’, % men incorrect - % women incorrect, could
not reliably be calculated.
#examp1 was the practice screen used in the basic skills pilot. Time taken was recorded. Information on pass/failure was not
available.
◆Time for all four items was grouped. This had been a single item in the Baseline Survey, but was changed to 4 separate items
as ‘drop down’ screens could not be accommodated within the Blaise CAPI programme.

Measuring basic skills for longitudinal study 111
As detailed in table A3.2a, after considering all selection criteria, just one selected item
(where information available) had a gender bias higher than 10 per cent. The items were
included as they were provided the ‘best balance’ for the overall assessment within the time
restrictions. Selected Items are highlighted.
Table A3.2b. Selection of items for the numeracy multiple-choice assessment
Item Level Description Aspect % % Men
number of curriculum Time incorrect* – Women
13 EL2 2 jars of jam BM 0.25 14 -10
24 EL2 Shelf brackets NT 0.19 7 -5
33 EL2 Not sugars MP 0.33 44 +11
53 EL2 Path length LS 0.28 58 -21
63 EL2 Calls on Saturdays CD 0.18 35 -3
73 EL2 Coins adding up to? MC 0.24 14 -3
14 EL3 Cost of ‘this lot’ BM 0.37 31 -9
25 EL3 Robot wars NT 0.19 11 0
26 EL3 Screws in packets NT 0.37 21 +3
34 EL3 Weight of Kit-Kat MP 0.42 54 0
44 EL3 Correct weights WS 1.08 28 -1
54 EL3 Correct units LS 1.25 2
64 EL3 True statements for
days of the week CD 1.20 50 -2
74 EL3 Family allowance MC 0.39 14 -3
27 L1 Bowls NT 0.20 1 -1
28 L1 48 screws NT 0.33 17 +5
35 L1 Bleach for work surfaces MP 0.51 34 0
45 L1 Losing weight WS 0.39 8 -10
55 L1 Gaps for TV LS 0.55 27 -19
65 L1 Weekend calls CD 1.03 30 +6
75 L1 Investment rates MC 0.42 25 -13
37 L2 Bleach whites MP 0.33 19 +2
47 L2 Weight of chicken WS 0.54 18 0
56 L2 Gap for fridge freezer LS 1.39 47 -8
66 L2 True statements for %s and
means CD 1.51 25 -17
76 L2 Part-time job MC 2.18 40 0
As detailed in table A3.2b, after considering all selection criteria, two of the selected items, 53
and 55, have a gender bias higher than 10 per cent. The items were included as they were
provided the ‘best balance’ for the overall assessment. Selected Items are highlighted.
Open-response questions
Open-response questions and corresponding showcards in 2004 survey
Questions and/or showcards updated for the 2004 survey are indicated with an *. For the
original showcards and questions see Ekinsmyth, C. & Bynner, J. (1994) The Basic Skills of
Young Adults. London: The Basic Skills Agency. Although not shown, all showcards were
produced in colour and were A4 in size.
For most of these questions, the interviewer showed the cohort member a visual stimulus on
a showcard, for example, a map or a page from the Yellow Pages. Interviewer instructions
were shown on the screen along with the question. The cohort member kept the showcard to

Research Report112
refer to while the interviewer asked them one, two or three questions about it. The correct
answer for each question appeared on the screen. When the cohort member gave their
answer, the interviewer entered ‘correct answer’ (1), ‘incorrect answer’ (2) into the computer.
Two questions had an additional category ‘interviewer unsure of CM answer’ (3). Responses in
this category were coded as ‘correct answer’ (1), ‘incorrect answer’ (2) by the research team
when fieldwork had been completed.
LIteracy questions
Showcard BS1* and Questions L1a*, L1b*
INTERVIEWER INTRODUCTORY SCRIPT: I would like you to do some more reading. There is
nothing to write. Look at the page then I’m going to ask you a couple of questions. You can
look at the page any time. It isn’t a test of memory.
L1a: What is the address for the Golden Dragon?
1 ’11 Euston Place, Leamington Spa’ OR ‘11 Euston Place’’
2 Different answer
L1b: What is the phone number for Harrington’s on the Hill?
1 ’01926 852074’’
2 Different answer

Measuring basic skills for longitudinal study 113
BS1
Showcard BS2* and Questions L2a,* L2b*
INTERVIEWER INTRODUCTORY SCRIPT: This time you have a map to look at. Again there is
nothing to write. Have a look at it and I shall ask you a couple of questions.
L2a: Please tell me the quickest route from Cork to Durrow?
1 ’ The best route follows the N8 all the way’’ or ‘Along the N8’
2 Different answer
L2b: Is Tipperary East or West of Wexford?
1 ‘West’ or ‘West of Wexford’
2 Different answer
BS2

Research Report114
Showcard BS3 and Questions L3a, L3b*, L3c*
INTERVIEWER INTRODUCTORY SCRIPT: Please have a look at the graphs, which both show
the results of the same by-election poll. Again there is no writing involved, simply answer my
questions when you are ready.
L3a: Using graph B, what percentage of the poll did Labour get three weeks before
the by-election?
1 ’ 35%’
2 Different answer
L3b: Both graphs show the same results. Why do they look so different?
1 ‘The vertical (Y) axis is different – the scales are differently spaced’ OR ‘the scales
start and finish on different numbers’ OR ‘the scale is wider on graph A/narrower
on graph B’
2 Different answer
3 Interviewer cannot code (cohort member’s response was written in verbatim)
L3c: Why would the Labour Party prefer to use graph B rather than graph A in an
article about their chances of winning the by-election?
1 ‘Labour looks further ahead in B’ OR ‘the difference between the two parties
seems/looks smaller in A/bigger in B’ OR ‘Labour’s support seems to be growing
faster in B/slower in A’
2 Different answer
3 Interviewer cannot code (cohort member’s response was written in verbatim)
BS3

Measuring basic skills for longitudinal study 115
Numeracy questions
Questions N1a, N1b (no showcard)
INTERVIEWER INTRODUCTORY SCRIPT: The next questions are to do with time. You can write
anything down if you want to.
N1a: You want to video a concert which is being shown tonight at a quarter to twelve
and finishes at twenty past three in the morning. Using the 24 hour clock, what time
would you program the video to begin recording?
1 ‘23.45’
2 ‘Different answer’ (answer is incorrect if CM mentions P.M.)
N1b: (You want to video a concert which is being shown tonight at a quarter to
twelve and finishes at twenty past three in the morning). And when would you
program it to finish, again using the 24 hour clock?
1 ‘03.20’ OR ‘3:20’
2 ‘Different answer’ (answer is incorrect if CM mentions A.M.)
Showcard BS4 * and Question N2a
N2a: You are in a shop and are going to buy four items. You need to add them up and
make sure that you have enough money. You have a pocketful of pound coins and no
other change. How many coins will you hand over to the shop keeper?
1 ‘14 pound coins’ OR ’14 without mentioning pounds’’
2 ‘Different answer’
BS4

Research Report116
Showcard BS5 * and Question N3a
N3a: You have decided to buy a car on Hire Purchase. The car costs £4,900. You
must pay a 10% deposit. What is the deposit?
1 ‘Deposit is £490’
2 ‘Different answer’
BS5

Measuring basic skills for longitudinal study 117
Showcard BS6* and Questions N4a and N4b
INTERVIEWER INTRODUCTORY SCRIPT: This time we would like you to use some charts. You
and a friend have decided to go on holiday to Ireland, and you are going to sail from Holyhead.
You have to go in August but want the cheapest fare possible for that month.
N4a: When could you go?
1 ‘19–22 August’ OR ‘26–29 August’ (either or both dates are acceptable),
2 ‘Different answer’
N4b: What would be the total return cost for you both to go in your car?
1 ‘£230’
2 ‘Different answer’
BS6

Research Report118
Table A3.3. Open-response literacy and numeracy questions: additional issues raised by
interviewers at the interviewer de-briefing following the Basic Skills Pilot
Interviewers were concerned with the content and presentation of some questions as they
contained complex information. Interviewers needed to read them carefully and repeat the
questions. Further details included:
■ L2a and L2b: some respondents and interviewers found the place names on the Map hard to
pick out. Although ‘Kildare’ was written on the map, the town is not marked with the
appropriate symbol ■ (i.e. it is off the top edge of the map).
■ L3b and L3c: the correct response was not clearly defined. Interviewers felt the guidelines
provided were somewhat ambiguous.
– L3b: the correct answer was defined as “Differently scaled Y axis on each bar chart (or
similar answer)”. Mention of the y axis was seen as over-technical. Many respondents
had difficulty with this question, and initial answers were not always sufficiently specific.
They came up with various answers which the interviewers then had to interpret as
‘correct’ or ‘incorrect’, something few of them felt confident to do in all cases.
– L3c: the correct answer was defined as “Their support seems to be growing faster in bar
chart B, OR it looks as if they are further ahead than the Conservatives in bar chart B (or
similar answer).” This was felt to be unhelpfully broad.
■ N1a to N1c were not based on a showcard, and respondents needed the question read out to
them several times as they could not remember it.
– N1b: interviewers asked for extra clarification of what counts as an acceptable answer.
Some were unclear of the correct way of expressing time using the 24 hour clock.
■ N2a: the structure of the question seemed to encourage respondents to focus on the amount
of money needed to buy the goods, and to ignore the actual question (“How many pound coins
were needed …”). As such, interviewers felt many respondents gave an incorrect answer due
to poor question format.
■ N3a: there is a lot of extraneous information in the question and on the showcard, which
originally informed subsequent linked questions in 1991, but were not asked in 2004.
■ N4a and N4b: the showcard contains a lot of information, and distracted respondents from the
questions being asked.
– N4a would be clearer if the wording was changed to “On what dates could you go?” Two
possible responses may be confusing to some respondents.
– N4b should be re-worded to include the words “on those dates”.

Measuring basic skills for longitudinal study 119
DYSLEXIA APPENDIX
The following set of tables provides more detailed feedback by interviewers administering the
DAST exercises in the Basic Skills Pilot and the scoring particular to each DAST exercise.
Table A4.1. Why DAST needed to be completely administered on paper
The preference for paper-based administration was rooted in the physical demands of the
different exercises. For most of the exercises the interviewer had to:
■ operate an electronic timer;
■ read something out or evaluate the what the respondent was saying; and
■ monitor the respondent’s progress or code responses on paper.
Managing each of these and maintaining rapport with the respondent was sufficiently
challenging without having to enter information into the computer as well. There was also the
way the interviewer and respondent sat in relation to each other to consider. The interviewer
needed to overlook what the respondent wrote down in the spelling task, and this
arrangement did not always allow the interviewer to keep the laptop within reach.
Table A4.2. Further details of scores in the One-Minute Reading exercise
Pilot study
■ 167 of the 177 respondents had complete information recorded for the One-Minute Reading
task.
■ Five respondents managed to read all 120 words in less than 1 minute (range between 54–59
seconds).
■ Seven respondents performed below two standard deviations (sd) from the mean. These
respondents read between 21–48 words correctly in 1 minute.
■ The exercise was not stopped early (due to errors or distress) for any respondents.
Dress rehearsal
■ All 64 cohort members had complete information recorded for the One-Minute Reading task.
■ Nine cohort members managed to read all 120 words, six in less than 1 minute (range
between 50–59 seconds).
■ Three cohort members performed below two standard deviations (sd) from the mean. These
respondents read between 39–58 words correctly in 1 minute.
■ The exercise was stopped early (due to error or distress) for 1 cohort member.

Research Report120
Table A4.3. Further details of scores in the Two/One-Minute Spelling exercise
Pilot study
■ 174 respondents had information recorded for the Two-Minute Spelling task, but some
interviewer recording or coding errors reduced the sample to 166.
■ Of these, 29 (17 per cent) finished the task before the two minutes were up.
■ Of these, 27 attempted all 32 words, two completed 31 words and 1 pass.
■ Ten respondents performed below 2 standard deviations (sd) from the mean, spelling between
3–13 words correctly in two minutes.
■ The exercise was not stopped early (due to errors or distress) for any respondent.
Dress rehearsal
■ 62 cohort members had information recorded for the One-Minute Spelling task.
■ Of these, 27 (44 per cent) finished the task before the minute was up.
■ Of these, 23 attempted all 16 words, two completed 15 words with 1 pass.
■ Four cohort members performed below two standard deviations (sd) from the mean, spelling
8 – 9 words correctly in one minute.
■ The exercise was not stopped early (due to errors or distress) for any cohort members.
Table A4.4. Further details of scores in the Phonemic Segmentation and Spoonerism
exercise
Pilot study
■ 175 respondents had complete information recorded for both exercises.
■ In the Phonemic Segmentation exercise five respondents performed below two standard
deviations (sd) from the mean, managing between three–five words correctly.
■ Two-thirds of respondents scored three in the Spoonerisms exercise.
Dress rehearsal
■ 63 cohort members had complete information for the Spoonerisms exercise.
■ Six of these did not attempt all three of the Spoonerisms.
■ Under half of cohort members scored three in the Spoonerisms exercise.

Measuring basic skills for longitudinal study 121
Table A4.5. Further details of scores in the Nonsense Reading Passage exercise.
Pilot study
■ 166 respondents had complete and accurate information recorded for the Nonsense Reading
Passage. i.e. number of normal words, correct or semi correct nonsense words read out. The
maximum score from reading all words is 89.
■ Five respondents read for the full three minutes.
■ One respondent made five consecutive errors and the task was stopped.
■ Seven respondents performed below two standard deviations from the mean, managing to
read between 14–63 words correctly.
Dress rehearsal
■ 61 cohort members respondents had complete and accurate information recorded for the
Nonsense Reading Passage.
■ No-one read for the full three minutes,
■ One cohort member made five consecutive errors and the task was stopped early.
■ Three cohort members performed below two standard deviations from the mean, managing to
read between 36–65 words correctly.

Research Report122
PARENT & CHILD APPENDIX
The following set of tables provides summaries of the administration rules for each of the
BAS II scales piloted. They show the ‘starting’ and ‘stopping’ points for children of different
ages, which are dependent on their performance. All of these ‘rules’ were programmed into
the computer to minimise the decisions interviewers had to make on the spot.
Table A5.1. Naming Vocabulary – starting and stopping points for children of different ages.
■ Children aged 3:0–4:5 start at item number 1.
– When they reach item 16, there are two options:
(a) If they have failed three or more items, the exercise is stopped.
(b) If they have failed fewer than three items, they continue to item 30. At that point,
there are two options again:
(a) If they have failed three or more items in total, the exercise is stopped.
(b) If they have failed fewer than three items in total, they continue to item 36.
– The exercise is stopped at any point where the child has made five consecutive errors.
■ Children aged 4:6–5:11 start at item number 12.
– When they reach item 30, there are two options:
(a) If they have failed three or more items, they then go back to item 1
(b) If they have failed fewer than three items, they continue to item 36.
– If at any point the child makes five consecutive errors, there are two options:
(a) If at least three items have been passed on the scale, the exercise is stopped.
(b) If fewer than three items have been passed on the scale, then the child goes back to
Item 1.
Table A5.2 Naming Vocabulary – additional interviewer comments
Interviewers generally commented on the poor quality of the paper used for the stimulus
booklet; some children wanted to turn the pages themselves in their eagerness, and the
pages often stuck to each other.
Feedback from both pilots had indicated that some of the images used in the stimulus booklet
were not very appropriate, as they pictured objects that many children of this age would rarely
see nowadays1, or they pictured objects in a different way than most children would have
seen2. For standardisation purposes, interviewers were not asked to further probe on such
items. Moreover, some items were considered to be problematic, as children often
commented on the way pictures looked3. Interviewers were directed to further probe on such
items, and were given specific instructions on how to deal with children’s comments. The
importance of teaching items was also highlighted.
1. An example of such items is a very traditional picture of a telephone (item no 9).
2. An example of such items is a picture of a chain (item no 23) which could be mistaken for a bracelet.

Measuring basic skills for longitudinal study 123
Table A5.3. Early Number Concepts – starting and stopping points for children of different
ages
■ Children aged 3:0–3:5 start at item number 1.
– When they reach item 8, there are two options:
(a) If they have failed three or more items, the exercise is stopped
(b) If they have failed fewer than three items, they continue to item 17. At that point,
there are two options again:
(a) If they have failed three or more items in total, the exercise is stopped
(b) If they have failed fewer than three items in total, they continue to item 24. At that
point, there are two options again:
(a) If they have failed three or more items in total, the exercise is stopped
(b) If they have failed fewer than three items in total, they continue to item 30.
– In addition, the exercise is stopped at any point where the child has made five consecutive
errors.
■ Children aged 3:6–4:5 also start at item number 1.
– When they reach item 17, there are two options:
(a) If they have failed three or more items, the exercise is stopped
(b) If they have failed fewer than three items, they continue to item 24. At that point,
there are two options again:
(a) If they have failed three or more items in total, the exercise is stopped
(b) If they have failed fewer than three items in total, they continue to item 30.
– In addition, the exercise is stopped at any point where the child has made five consecutive
errors.
■ Children aged 4:5–5:11 start at item number 4.
– When they reach item 24, there are two options:
(a) If they have failed three or more items, they then go back to item 1
(b) If they have failed fewer than three items, they continue to item 30
– If the child makes five consecutive errors, there are two options:
(a) If at least three items have been passed on the scale, the exercise is stopped.
(b) If fewer than three items have been passed on the scale, then the child goes back to
item 1.

Research Report124
Table A5.4. Specific Administration rules for item 3
For item 3, the child is asked to count out loud a row of ten green tiles while simultaneously
pointing to them. A score of 0 to 3 points is given for reciting numbers in correct sequence,
and a score of 0 to 3 points is given for pointing to the squares in one-to-one correspondence
with reciting. Thus, the total item score ranges from 0 to 6 points. Points are awarded as
follows:
Child recites to number 1–3 4–6 7–9 10
Child recites and points to number 1–3 4–6 7–9 10
Score 0 1 2 3
For example, if the child says ‘one, two, three, four, five, six, seven, nine, twelve, two’ and
points to the first four squares in one-to-one correspondence with saying their numbers, he /
she receives a total of 3 points, made up as follows: for recitation only, the child receives 2
points for reciting correctly up to seven; for coordinated recitation and pointing to the first
four squares the child receives 1 point.
If the score on the first attempt is less than a perfect score of 6, a second attempt is given.
The final item score is the better of the two scores for reciting plus the better of the scores
for pointing in correspondence with reciting.
Table A5.5. Copying Designs – starting and stopping points for children of different ages
There are different starting and stopping points for children of different ages.
■ Children aged 3:6–4:11 start at item number 1.
– When they reach item 12, there are two options:
(a) The exercise is stopped if they have not earned maximum scores* on most items.
(b) If only one or two items apparently have less than maximum scores, they continue to
item 15. At that point, there are two options again:
(a) The exercise is stopped if they have not earned maximum scores on most items.
(b) If only one or two items apparently have less than maximum scores, they continue to
item 20.
– The exercise is also stopped at any point where the child has clearly failed 5 consecutive
items.
■ Children aged 5:0–5:11 start at item number 5.
– When they reach item 15, there are two options:
(a) If fewer than three apparent passes have been made on all items, children are
directed to item 1.
(b) If only one or two items apparently have less than maximum scores, they continue to
item 20.
– If the child makes five consecutive apparent failures, there are two options:
(a) If at least three apparent passes have been made on all items given, then the exercise
is stopped.
(b) If fewer than three apparent passes have been made on all items given, then the child
is directed back to item 1.
*Item responses may earn from 0 to 3 points in final scoring. The administrator can refer to the scoring rules specific for each
item in order to judge whether the exercise should be continued or terminated.

Measuring basic skills for longitudinal study 125
Table A5.6. Word Reading – starting and stopping points for children of different ages
The different starting and stopping points for children of different ages.
■ Children aged 5:0–7:11 start at Item 1. If they fail eight or more words in a block of ten words,
then the exercise is stopped.
■ Children aged 8:0–10:11 start at Item 21. If they fail eight or more words in a block of ten
words, there are two options:
(a) If they have passed at least three items on the scale, the exercise is stopped.
(b) If they have passed less than three items on the scale, they go back to Item 1.
■ Children aged 11:0–13:11 start at Item 41. If they fail eight or more words in a block of ten
words, there are two options:
(a) f they have passed at least three items on the scale, the exercise is stopped.
(b) If they have passed less than three items on the scale, they go back to Item 21. They can
be directed as far back as item 1 if they still haven’t passed at least three items on the
scale.
■ Children aged 14:0–17:11 start at Item 51. If they fail eight or more words in a block of ten
words, there are two options:
(a) If they have passed at least three items on the scale, the exercise is stopped.
(b) If they have passed less than three items on the scale, they go back to Item 41. They can
be directed as far back as item 1 if they still haven’t passed at least three items on the
scale.
Table A5.7. Spelling – starting and stopping points for children of different ages
The different starting and stopping points for children of different ages
■ Children aged 5:0–6:11 start at Items 1 and 2.
■ Children aged 7:0–8:11 start at Items 11 and 12.
■ Children aged 9:0–10:11 start at Items 21 and 22.
■ Children aged 11:0–17:11 start at Items 31 and 32.
The interviewer administers the first two items specified for the child’s age.
■ If the child passes both items, the interviewer administers the first two items of each next
block, until the child fails an item. At that point, the interviewer administers all items in the
previous block.
■ If the child fails one or both of the first two items, the interviewer administers the first two
items in each previous block, until the child passes both of them. At that point, the
interviewer administers all items in that block.
■ The interviewer has to administer entire blocks of items in order to establish the basal (a
block with at least eight passes) and the ceiling (a block with two or fewer passes).
■ If a child of the earliest age band (6:0–7:11) fails either or both of items 1 and 2, the
interviewer continues with Item 3. Also, if a child passes the first two items of all blocks up to
Items 61 and 62, the interviewer continues with Item 63 (not 71 and 72).

Research Report126
Table A5.8. Number Skills – starting and stopping points for children of different ages
Number Skills: different starting and stopping points for children of different ages
■ Children aged 5:0–7:11 start at Block A (Items 1–8)
■ Children aged 8:0–9:11 start at Block B (Items 9–16)
■ Children aged 10:0–11:11 start at Block C (Items 17–24)
■ Children aged 12:0–17:11 start at Block D (Items 25–32)
The child begins at the starting block for his / her age and attempts all the items in that
block. If the child passes fewer than five items, the interviewer administers the next easier
block, until five or more items in a block are passed or until Block A (the easiest block) is
completed. Blocks are then administered in a forward sequence until three or fewer items in
a block are passed or until Block F (the most difficult block) is completed.

NRDC
Institute of Education
University of London
20 Bedford Way
London WC1H 0AL
Telephone: +44 (0)20 7612 6476
Fax: +44 (0)20 7612 6671
email: info@ nrdc.org.uk
website: www.nrdc.org.uk
NRDC is a consortium of partners
led by the Institute of Education,
University of London with:
• Lancaster University
• The University of Nottingham
• The University of Sheffield
• East London Pathfinder
• Liverpool Lifelong Learning
Partnership
• Basic Skills Agency
• Learning and Skills
Development Agency
• LLU+, London South
Bank University
• National Institute of
Adult Continuing Education
• King’s College London
• University of Leeds
Funded by the
Department for
Education and Skills as
part of Skills for Life:
the national strategy for
improving adult
literacy and numeracy
skills.
This report is funded by the Department for Education and Skills as part
of Skills for Life: the national strategy for improving adult literacy and
numeracy skills. The views expressed are those of the author(s) and do
not necessarily reflect those of the Department.
www.nrdc.org.uk