Embed Size (px)
Citation preview
36
CHAPTER III
RESEARCH METHOD
This chapter discusses about sources of data, research design,
research setting, population and sample of research, variables and
indicators of research, methods of data collection, and methods of data
analysis.
A. Research Design
This research is quantitative because the result of the
students’ achievement of pre-test and post-test will be explained
by number, which are evaluated and also interpreted by statistic
procedure. In this case refers to use T-test.
Research method used here is quasi-experiment, a part of
experimental research that do not use control group or it can
called by one group pretest-posttest design1. In this research the
researcher only use one group as experimental group and to get
the value of independent variable is from pre-test score, so post-
test score will be the dependent variable after the researcher
giving the treatment. This research design will be described as
follow:
1 William R. Shadish and Thomas D. Cook, Experimental and
Quasi-Experimental Designs for Generalized Causal Inference, (USA:
Houghton Mifflin Company, 2002), p. 108
E 01 X 02

37
Where,
E : Experimental group/class
X : Treatment
01 : Pre-test
02 : Post-test
B. Research Setting
1. Time of the research
This research will be conducted from February 1st to
February 23rd
2016 counted since the proposal was submitted
until the end of research.
2. Place of the research
This research will be conducted at MA At-Tawaazun,
located in Jl. Nuri no. 56, kel. Widuri, kab.Pemalang.
C. Subject of The Research
1. Population
Population is all of the research of subject.2The
population in this research is all students of grade eleventh
MA At-Tawaazun in academic year of 2015/2016. But it is a
new school, so the number of the entire students is 22
students.
2Suharsimi Arikunto, Prosedur Penelitian Suatu Pendekatan
Praktik, p. 173
38
2. Sample and Sampling
Sample is some of chosen population using certain
procedure and has same characteristic so that can be expected
to represent its population.3 Sampling is the process done to
choose and take sample correctly from population so that it
can be used as valid representative to the population.
Based on the situation and condition of that school,
the researcher decides to take boring sampling or total
sampling. Boring/total sampling is the sample that represents
its population, and it usually taken because the population has
the small number less than 100.4
D. Variable of Research
According to Fred D. Kerlinger as cited by Arikunto, that
all experiments have one fundamental idea behind them; to test
the effect of one or more independent variables on a dependent
variable (it is possible to have more than one dependent variable
in experiments)5, and also quasi experimental.
This research use two variables, independent and
dependent variables. According to Robert as cited by Noor,
3Nana Sudjana and Ibrahim, Penelitian dan Penilaian Pendidikan,
(Bandung: Sinar Baru Bandung: 1989), p. 85.
4Juliansyah Noor, Metodologi Penelitian Skripsi, Tesis, Disertasi,
dan Karya Ilmiah. edisi pertama, (Jakarta: Kencana Prenada Media Group:
2011), p.156
5Suharsimi Arikunto, Prosedur Penelitian Suatu Pendekatan
Praktik, P.159
39
independent variable is a cause that predicted by some of changes
in dependent variable. And dependent variable is main factor that
will be explained, predicted, and influenced by other factors.6
E. Technique of Data Collection
1. Test
Test is any procedure for measuring ability,
knowledge, or performance.7 In order to discover by questions
or practical activities, what someone knows, or what someone
or something can do or is like.
In tests, researchers have at their disposal a powerful
method of data collection, an impressive array of tests for
gathering data of a numerical rather than verbal kind.8 The
data was collected by giving written test. Written test was
conducted twice, there are pre-test and post-test.
This technique is applied by researcher to know the
students’ achievements that have done in learning English,
especially in teaching narrative text on the reading class.
6Juliansyah Noor, Metodologi Penelitian Skripsi, Tesis, Disertasi,
dan Karya Ilmiah. edisi pertama, p. 48-49
7Jack C. Richard. Longman Dictionary of Language Teaching and
Applied Linguistic 2nd edition, p. 546
8Louis Cohen, Lawrence Manion and Keith Morrison, Research
Method in Education. Fifth Ed, (London: Routledge Falmer: 2005), p.317.
40
2. Documentation
Another data is needed to help the researcher run the
research. In addition to do that, data will be collected through
documentation of the students' previous examination score
from the school. It will be used to validate the sample. And
documentation of students’ written test recording is used to
evaluate students’ reading skill.
F. Method of Data Analysis
1. First Phase (Try-out Test)
Try out test is necessary since the result will be used
to make sure that the measuring instrument has such
characteristics as validity and reliability. The instrument to be
tried out was the composition test. The result of test was used
to find out the validity and reliability.
a. Validity
Heaton states that validity is the extent to which
it measures what is supposed to measure and nothing
else.9 The result was consulted to critical score for r-
product moment. If the obtained coefficient of correlation
was higher than the critical score for r-product moment, it
meant that a paragraph was valid at 5% alpha level
9J. B. Heaton, Writing English Language Test, p. 153.
41
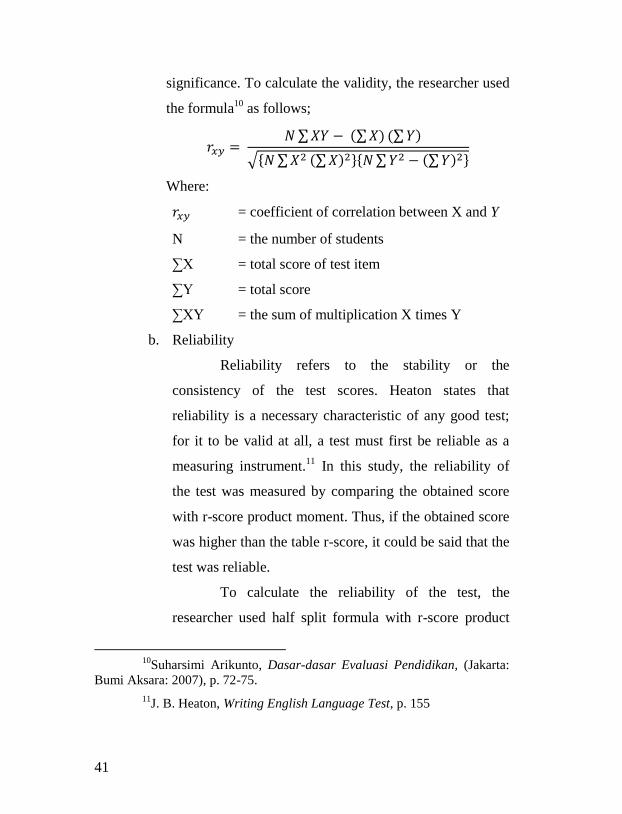
significance. To calculate the validity, the researcher used
the formula10
as follows;
∑ (∑ (∑
√{ ∑ (∑ }{ ∑ (∑ }
Where:
= coefficient of correlation between X and Y
N = the number of students
∑X = total score of test item
∑Y = total score
∑XY = the sum of multiplication X times Y
b. Reliability
Reliability refers to the stability or the
consistency of the test scores. Heaton states that
reliability is a necessary characteristic of any good test;
for it to be valid at all, a test must first be reliable as a
measuring instrument.11
In this study, the reliability of
the test was measured by comparing the obtained score
with r-score product moment. Thus, if the obtained score
was higher than the table r-score, it could be said that the
test was reliable.
To calculate the reliability of the test, the
researcher used half split formula with r-score product
10
Suharsimi Arikunto, Dasar-dasar Evaluasi Pendidikan, (Jakarta:
Bumi Aksara: 2007), p. 72-75.
11J. B. Heaton, Writing English Language Test, p. 155
42
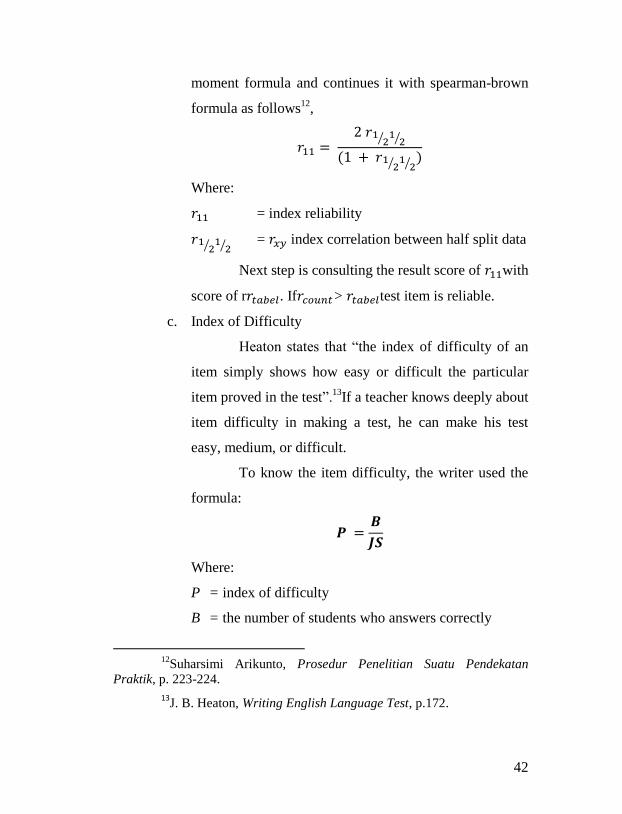
moment formula and continues it with spearman-brown
formula as follows12
,
⁄
⁄
( ⁄
⁄
Where:
= index reliability
⁄
⁄ = index correlation between half split data
Next step is consulting the result score of with
score of r . If > test item is reliable.
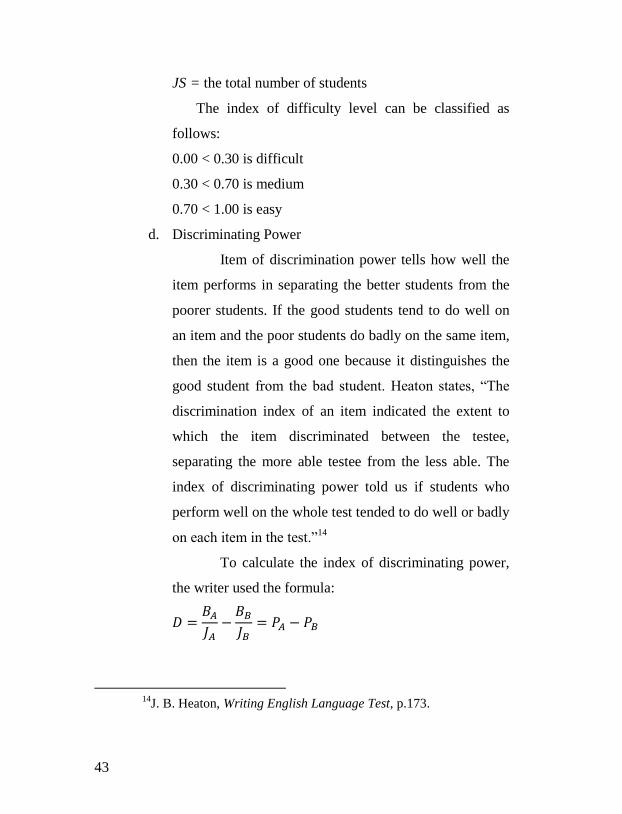
c. Index of Difficulty
Heaton states that “the index of difficulty of an
item simply shows how easy or difficult the particular
item proved in the test”.13
If a teacher knows deeply about
item difficulty in making a test, he can make his test
easy, medium, or difficult.
To know the item difficulty, the writer used the
formula:
Where:
P = index of difficulty
B = the number of students who answers correctly
12
Suharsimi Arikunto, Prosedur Penelitian Suatu Pendekatan
Praktik, p. 223-224.
13J. B. Heaton, Writing English Language Test, p.172.
43
JS = the total number of students
The index of difficulty level can be classified as
follows:
0.00 < 0.30 is difficult
0.30 < 0.70 is medium
0.70 < 1.00 is easy
d. Discriminating Power
Item of discrimination power tells how well the
item performs in separating the better students from the
poorer students. If the good students tend to do well on
an item and the poor students do badly on the same item,
then the item is a good one because it distinguishes the
good student from the bad student. Heaton states, “The
discrimination index of an item indicated the extent to
which the item discriminated between the testee,
separating the more able testee from the less able. The
index of discriminating power told us if students who
perform well on the whole test tended to do well or badly
on each item in the test.”14
To calculate the index of discriminating power,
the writer used the formula:
14
J. B. Heaton, Writing English Language Test, p.173.

44
Where:
= Number of all students in the upper group
= Number of all students in the lower group
= Number of students in the upper group who
answered the item correctly
= Number of students in the lower group who
answered the item correctly
= The proportion of the upper group who
answered the item correctly
= The proportion of the lower group who
answered the item correctly
The criteria of determining the index of discriminating
are below:
D = 0.00 – 0.20: Poor
D = 0.21 – 0.40: Satisfactory
D = 0.41 – 0.70: Good
D = 0.71 – 1.00: Excellent
2. Second Phase
a. Normality test
The researcher did normality test in this research
to know the normality distribution of class or not. The
normality test with Liliefors is done to find out
distribution data. The steps of normality test use Liliefors
test:
45
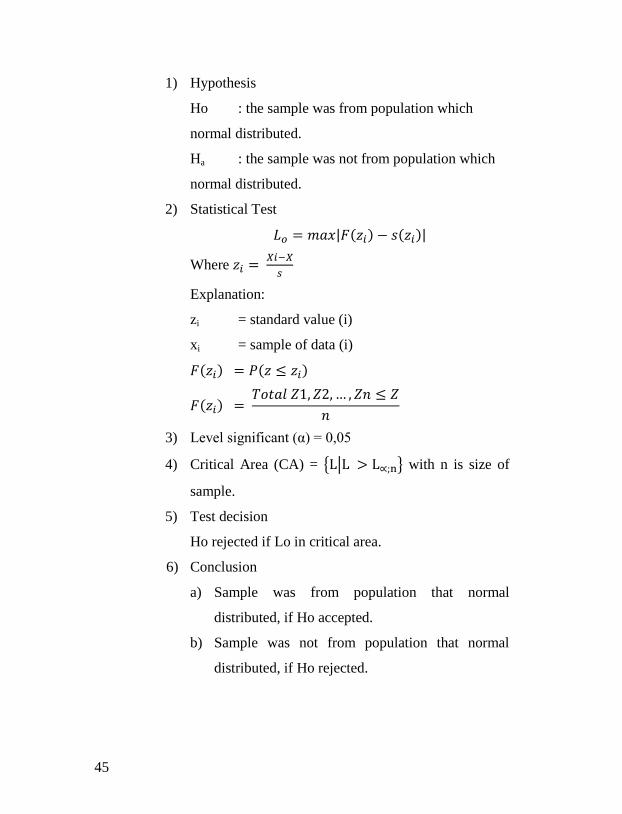
1) Hypothesis
Ho : the sample was from population which
normal distributed.
Ha : the sample was not from population which
normal distributed.
2) Statistical Test
| ( ( |
Where
Explanation:
zi = standard value (i)
xi = sample of data (i)
( (
(
3) Level significant (α) = 0,05
4) Critical Area (CA) = { | } with n is size of
sample.
5) Test decision
Ho rejected if Lo in critical area.
6) Conclusion
a) Sample was from population that normal
distributed, if Ho accepted.
b) Sample was not from population that normal
distributed, if Ho rejected.
46
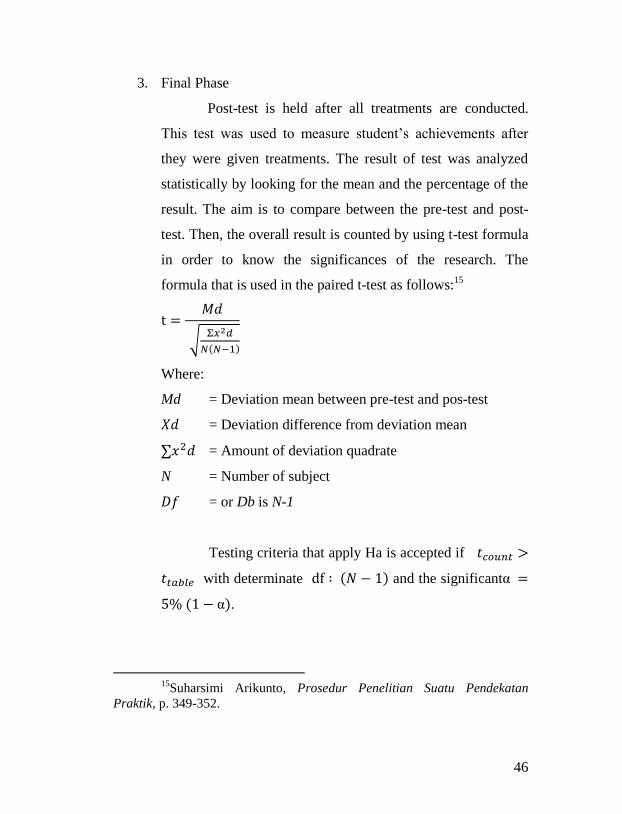
3. Final Phase
Post-test is held after all treatments are conducted.
This test was used to measure student’s achievements after
they were given treatments. The result of test was analyzed
statistically by looking for the mean and the percentage of the
result. The aim is to compare between the pre-test and post-
test. Then, the overall result is counted by using t-test formula
in order to know the significances of the research. The
formula that is used in the paired t-test as follows:15
√
(
Where:
Md = Deviation mean between pre-test and pos-test
= Deviation difference from deviation mean
∑ = Amount of deviation quadrate
N = Number of subject
= or Db is N-1
Testing criteria that apply Ha is accepted if
with determinate ( and the significantα
( α .
15
Suharsimi Arikunto, Prosedur Penelitian Suatu Pendekatan
Praktik, p. 349-352.