Embed Size (px)
Citation preview
Pergamon Cement and Concrete Research, Vol. 25. No. 4, pp. 790-802.1995
1995 Ekevier Science Ltd
Printed in the USA. All rights reserved
OOOS-8846/95 %9.50+.00
0008-8846(95)00069-O
WATER PERMEABILITY AND CHLORIDE ION DIFFUSION IN PORTLAND CEMENT MORTARS:
RELATIONSHIP TO SAND CONTENT AND CRITICAL PORE DIAMETER
Pavla Halamickova’ and Rachel J. Detwiler* Department of Civil Engineering
University of Toronto Toronto, Ontario M5S lA4
Canada
Dale P. Bentz3 and Edward J. Garbocz? National Institute of Standards and Technology
Gaithersburg, Maryland 20899 U.S.A.
(Refereed)
(Received June 24, 1994; in final form January 6. 1995)
ABSTRACT The pore structure of hydrated cement in mortar and concrete is quite different from that of neat cement paste. The porous transition zones formed at the aggregate-paste interfaces affect the pore size distribution. The effect of the sand content on the development of pore structure, the permeability to water, and the diffusivity of chloride ions was studied on portland cement mortars. Mortars of two water-to-cement ratios and three sand volume fractions were cast together with pastes and tested at degrees of hydration ranging from 45 to 70%. An electrically-accelerated concentration cell test was used to determine the coefficient of chloride ion diffusion while a high pressure permeability cell was employed to assess liquid permeability. The coefficient of chloride ion diffusion varied linearly with the critical pore radius as determined by mercury intrusion porosimetry while permeability was found to follow a power-law relationship vs. this critical radius. The data set provides an opportunity to directly examine the application of the Katz-Thompson relationship to cement-based materials.
‘Currently at Yolles Partnership Inc., Toronto, Ontario M5A 1s 1, Canada
* Currently at Construction Technology Laboratories,
‘Building Materials Division, Building and Fire Administration, U.S. Department of Commerce
Skokie, Illinois 60077, U.S.A.
Research Laboratory, Technology
790

Vol. 25, No. 4 WATER PERMEABILITY. CHLORIDE DIFFUSION, MORTARS, PORE STRUCTURE 791
Introduction
The effect of concrete’s porosity on its resistance to degradation is quite complex. In determining the rate of ingress of an aggressive medium into concrete, the distribution of the pores in the cement paste portion of this composite has to be considered, especially their size and connectivity. In concrete and mortar this pore structure is affected by the presence of the aggregate. Using mercury intrusion porosimetry (MIP), Winslow and Liu (1) showed that the pore structure of paste developed in the presence of aggregate is quite different from that of neat cement paste. The aggregate-paste interface, or “transition zone”, has a definite effect on the pore size distribution due to its considerably higher porosity and the larger pores that it contains. The effects of the transition zones on the transport properties should depend on the aggregate content. When the transition zones are isolated by a less porous bulk paste, the rate of transport should be significantly lower than if the transition zones overlap, which would create a continuous path of low resistance to penetration. This interconnection has been referred to as “percolation”. As evidence of such percolation, Winslow et al. (2) observed that the MIP results for mortars depend on the sand content, with the intrusion curves for sand contents higher than some critical value showing a disproportionate increase in the volume of larger pores. It is the goal of the present research to assess the effects of these changes in pore structure on transport properties such as ionic diffusion and water permeability and to establish relationships amongst these transport coefficients and the critical pore sizes as measured by MIP.
Exuerimental Procedure
Portland cement meeting the requirements of ASTM Type I was used for all specimens (3). The sand chosen for the mortar specimens was ASTM Cl09 Ottawa sand. All samples were tested at room temperature (25 “C). Two water/cement (w/c) ratios of 0.40 and 0.50 by mass were chosen for all cement paste and mortar mixes. The sand volume fraction (percentage of total mix volume) was 0, 35, 45, or 55 percent. Entrapped air contents were allowed to vary (1 to 1.2 % for pastes and 7 to 9 % for mortars). Vacuum consolidation was not used in order to simulate field conditions for the mixing and placement of mortar and concrete. The mixtures were cast into 100 x 200 mm cylinders and rotated for the first 20 to 24 hours to minimize segregation and bleeding. Following rotation, the samples were demolded and either stored in saturated lime water or prepared for testing, depending on the degree of hydration required.
Degree of Hydration
While the permeability and diffusivity tests were being conducted, companion specimens were stored continuously in lime water. Small (approximately 2 grams for paste and 4 grams for mortar) samples were taken daily for the first three days and thereafter every second or third day. They were placed in iso-propyl alcohol to stop hydration by removal of the free water. Later they were removed from the alcohol and placed in dried and weighed porcelain crucibles and dried at 105 “C for 24 hours. They were then transferred to a desiccator for 30 minutes, after which they were weighed. They were then placed in a 1050 “C furnace for three hours. They were cooled in a desiccator and weighed again. The degree of hydration was determined by the nonevaporable water content. For the mortar specimens the correction used by Bellander (4) was employed.
Pore Structure
In the present work, the pore structures of the cement paste and mortar at different degrees of hydration were measured by mercury intrusion porosimetry (MIP). Each type of mix was
192 P. Halamickova et al. Vol. 25. No. 4
measured in duplicate at five different degrees of hydration between 45 and 70 percent. Hearn and Hooton (5) showed that using crushed samples can introduce an external porosity peak and suggested the use of small, saw cut prisms as an alternative. Specimens for MIP were cut from the cylinder cured in water at the time corresponding to the estimated degree of hydration, and then stored in isopropyl alcohol to remove the free water. The solvent was replaced after the first three days and storage in solvent was continued for several weeks. One month before the MIP measurements, the samples were removed from the isopropyl alcohol and dried to a constant mass in a vacuum oven at 55 “C.
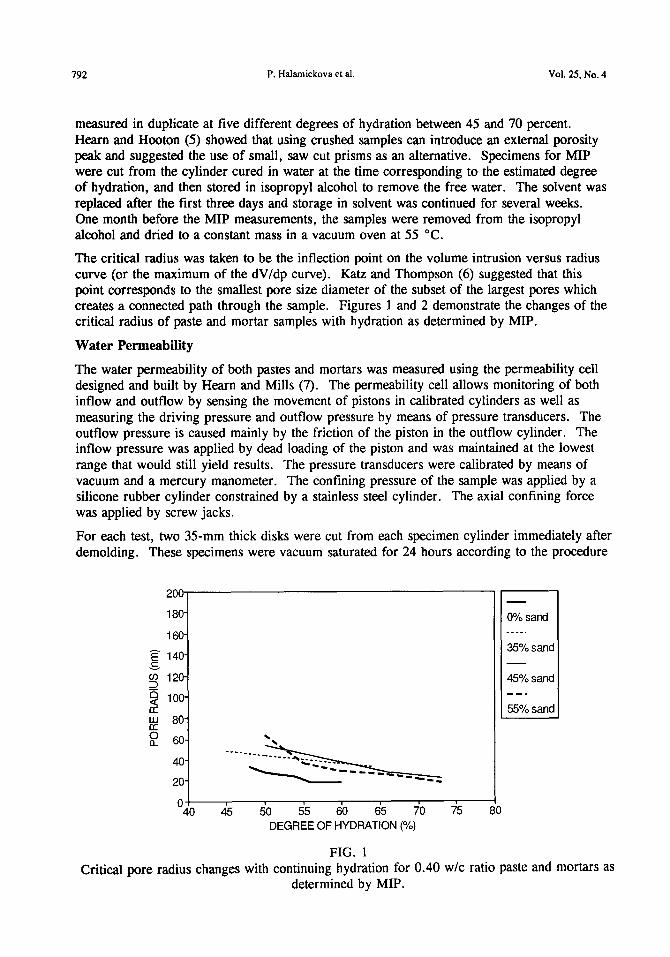
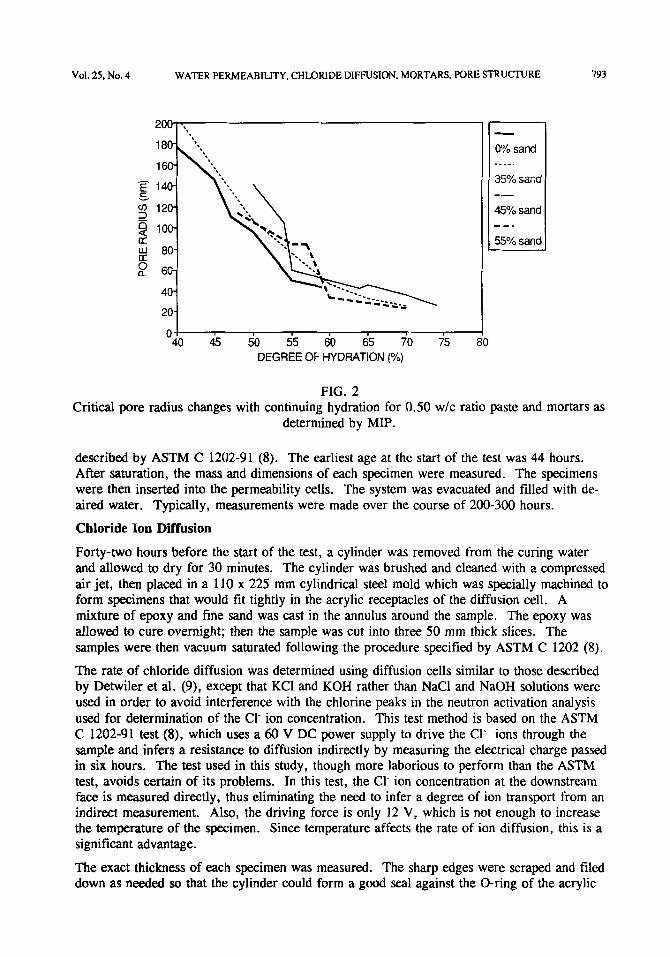
The critical radius was taken to be the inflection point on the volume intrusion versus radius curve (or the maximum of the dV/dp curve). Katz and Thompson (6) suggested that this point corresponds to the smallest pore size diameter of the subset of the largest pores which creates a connected path through the sample. Figures 1 and 2 demonstrate the changes of the critical radius of paste and mortar samples with hydration as determined by MIP.
Water Permeability
The water permeability of both pastes and mortars was measured using the permeability cell designed and built by Hearn and Mills (7). The permeability cell allows monitoring of both inflow and outflow by sensing the movement of pistons in calibrated cylinders as well as measuring the driving pressure and outflow pressure by means of pressure transducers. The outflow pressure is caused mainly by the friction of the piston in the outflow cylinder. The inflow pressure was applied by dead loading of the piston and was maintained at the lowest range that would still yield results. The pressure transducers were calibrated by means of vacuum and a mercury manometer. The confining pressure of the sample was applied by a silicone rubber cylinder constrained by a stainless steel cylinder. The axial confining force was applied by screw jacks.
For each test, two 35-mm thick disks were cut from each specimen cylinder immediately after demolding. These specimens were vacuum saturated for 24 hours according to the procedure
L””
180
160
E 140-
“3 120-
9 loo-
5 80-
! 6O- ---_.
40-
20-
o! 40 45 50 55 60 65 70 75 ;
DEGREE OF HYDRATION (%)
0% sand ____.
35% sand
45% sand __.
55% sand
FIG. 1 Critical pore radius changes with continuing hydration for 0.40 w/c ratio paste and mortars as
determined by MIP.
Vol. 25, No. 4 WATER PERMEABILITY, CHLORIDE DIFFUSION, MORTARS, PORE STRUCTURE 193
0% sand --__.
35% sand -
45% sand -_.
55% sand
o! 40 45 50 55 60 65 70 75 ;
DEGREE OF HYDRATION (%)
FIG. 2 Critical pore radius changes with continuing hydration for 0.50 w/c ratio paste and mortars as
determined by MIP.
described by ASTM C 1202-91 (8). The earliest age at the start of the test was 44 hours. After saturation, the mass and dimensions of each specimen were measured. The specimens were then inserted into the permeability cells. The system was evacuated and filled with de- aired water. Typically, measurements were made over the course of 200-300 hours.
Chloride loo Diffusion
Forty-two hours before the start of the test, a cylinder was removed from the curing water and allowed to dry for 30 minutes. The cylinder was brushed and cleaned with a compressed air jet, then placed in a 110 x 225 mm cylindrical steel mold which was specially machined to form specimens that would fit tightly in the acrylic receptacles of the diffusion cell. A mixture of epoxy and fine sand was cast in the annulus around the sample. The epoxy was allowed to cure overnight; then the sample was cut into three 50 mm thick slices. The samples were then vacuum saturated following the procedure specified by ASTM C 1202 (8).
The rate of chloride diffusion was determined using diffusion cells similar to those described by Detwiler et al. (9), except that KC1 and KOH rather than NaCl and NaOH solutions were used in order to avoid interference with the chlorine peaks in the neutron activation analysis used for determination of the Cl- ion concentration. This test method is based on the ASTM C 1202-91 test (8), which uses a 60 V DC power supply to drive the Cl ions through the sample and infers a resistance to diffusion indirectly by measuring the electrical charge passed in six hours. The test used in this study, though more laborious to perform than the ASTM test, avoids certain of its problems. In this test, the Cl ion concentration at the downstream face is measured directly, thus eliminating the need to infer a degree of ion transport from an indirect measurement. Also, the driving force is only 12 V, which is not enough to increase the temperature of the specimen. Since temperature affects the rate of ion diffusion, this is a significant advantage.
The exact thickness of each specimen was measured. The sharp edges were scraped and filed down as needed so that the cylinder could form a good seal against the O-ring of the acrylic
794 P. Halamickova el al. Vol. 25, No. 4
receptacle of the diffusion cell. The edges of the cylinder were coated with a high vacuum grease to improve the seal. Stainless steel wire mesh electrodes were placed so as to cover the exposed concrete surfaces. A receptacle was force fitted over the electrode onto each end of the cylinder and the whole assemblage bolted together. The cathodic compartment was filled with 3% KC1 solution and the anodic compartment with 0.3 M KOH solution. The volume of solution in each side was 260 ml. The stainless steel electrodes were then connected to a 12 & 0.1 V DC power supply.
Samples of the KOH solution were taken for chloride content analysis daily or twice daily depending on the expected rate of ion transport. The KC1 concentration was also monitored on one sample from each set. It was observed that the Cl- concentration decreased very rapidly during the first 30 - 40 hours in the upstream side, while later the decrease was slower. To approximate constant concentration of the upstream KC1 solution, it was decided to change this solution every 24 hours for one sample in each set. The test had to be stopped when rust occurred in the downstream (KOH) part of the cell. Neutron activation analysis (NAA) was used to determine the chloride content of the liquid samples (10). With this method, concentrations as low as five ppm could be determined.
Determination of the Coefficient of Chloride Ion Diffusion
The coefficient of diffusion can be calculated from a modified version of Fick’s second law:
(1)
where D = diffusion coefficient (m*/s) c = concentration of ions (moles/liter) as a function of distance, x, and time, t z = charge of 1 mole of ions E = electric field (volts/m) F = Faraday’s constant (23060 cal/(mol-eV)) R = gas constant (1.987 cal/(mol K)) T = temperature (K)
For the given experimental setup, the following conditions apply: boundary condition: c = c,, x = 0, t > 0 initial condition: c = 0, x > 0, t = 0 infinite-point condition: c = 0, x = infinite, t = large number
The exact analytical solution for Eq. (1) is:
c 1 -=- 2[ e%rfc(x+aDt) +erfc(x-aDt) ] CO 2m 2m
where
(2)
For the chloride diffusivity test the following constants apply: z= 1; T = 298 K; E = 12/x Vm-‘, where x is the thickness of the sample in meters.

Vol. 25, No. 4 WATER PERMEABImY, CHLORIDE DIFFUSION, MORTARS, PORE STRUCI’URE 795
The coefficient of diffusion was determined based on measurements of the time delay, t,, until the first significant increase in chloride concentration was detected in the KOH solution. The ratio c/c, is a small number where c is the first reliably detected (error < 2%) Cl- concentration in the downstream compartment. A value of c/c, = 0.005 was used in all cases.
The expression in square brackets in Eq. (2) does not depend on the concentration but only on the time t,. It supports the measurements of the Cl downstream concentration where the sudden increase in Cl concentration was observed to be at nearly the same time regardless of whether the upstream Cl concentration was constant. Only after this period was the difference between these two cases manifested in the different slopes of the downstream Cl- concentration curves.
Measurements of the upstream Cl concentration indicate that the greatest ingress of Cl- ions into the sample takes place in the first 24 to 48 hours of the test and then slowly decreases. The change in Cl- concentration did not affect the time delay t,, which was used to determine the diffusion coefficient, but it does affect the rate of the Cl‘ concentration increase at the downstream face after the time delay. To be able to determine the coefficient of diffusion using the slope of the concentration curve after the time delay it is necessary to keep the upstream Cl- concentration constant. Not all samples were measured with constant KC1 concentration; thus, only one method was used to determine the diffusivity of the samples.
Results and Discussion
The calculated chloride diffusion coefficients for the mixes are shown in Tables 1 and 2 for
TABLE 1 Chloride Diffusion Coefficients for 0.4 w/c Ratio Mixes
degree of hydration at start and en
D Average D (m2/s x IO-“) (m2/s x IO-“)
164 1:72 1.69 1.71 1.02 1.09 1.09 1.16 0.76 0.74 0.72 2 23 2:31 2.33 2.45 1.72 1.62 1.52
2.13** 5.73**
2.8 0.78 0.85
of test
(1.79**) (4.27**)
2.8 0.82
ILll”btiOtl G (m2/s x lo-“) (%)
2.18 2.1
1.16 5.2
3.9
4. 1 ** result excluded from average due to high variability.
196 P. Halamickova et al. Vol. 25, No. 4
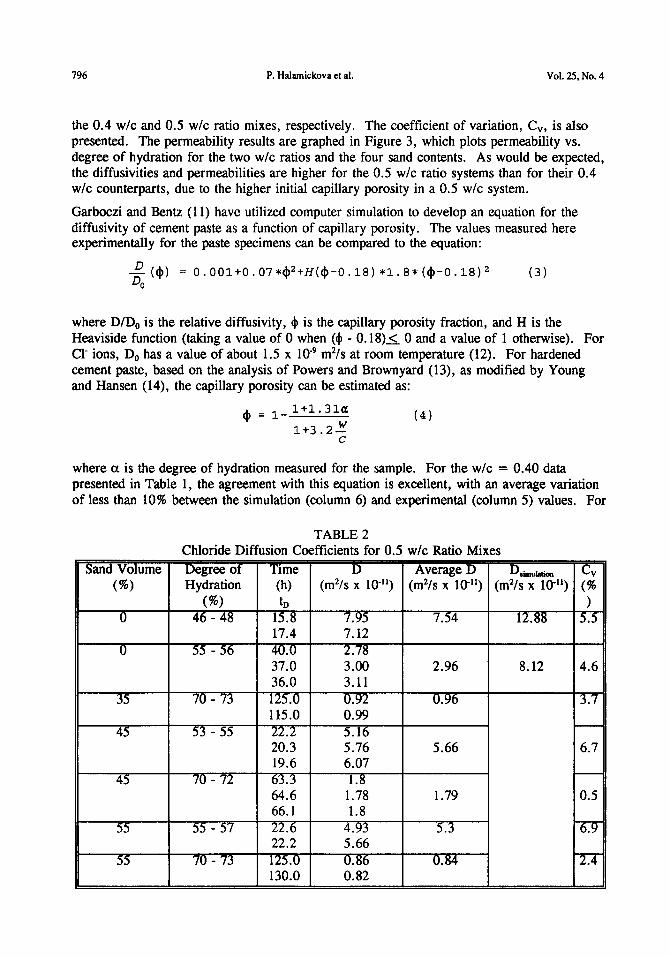
the 0.4 w/c and 0.5 w/c ratio mixes, respectively. The coefficient of variation, Cv, is also presented. The permeability results are graphed in Figure 3, which plots permeability vs. degree of hydration for the two w/c ratios and the four sand contents. As would be expected, the diffusivities and permeabilities are higher for the 0.5 w/c ratio systems than for their 0.4 w/c counterparts, due to the higher initial capillary porosity in a 0.5 w/c system.
Garboczi and Bentz (11) have utilized computer simulation to develop an equation for the diffusivity of cement paste as a function of capillary porosity. The values measured here experimentally for the paste specimens can be compared to the equation:
+@) = ~.~~l+0.07*~~+H(~-0.18~*l.8*~~-~.18~z (3) 0
where D/D0 is the relative diffusivity, 4 is the capillary porosity fraction, and H is the Heaviside function (taking a value of 0 when ($ - 0.18)~ 0 and a value of 1 otherwise). For Cl- ions, D, has a value of about 1.5 x 10m9 m*/s at room temperature (12). For hardened cement paste, based on the analysis of Powers and Brownyard (13), as modified by Young and Hansen (14), the capillary porosity can be estimated as:
t#l = l- 1+1.31a (4)
1+3.2$
where CL is the degree of hydration measured for the sample. For the w/c = 0.40 data presented in Table 1, the agreement with this equation is excellent, with an average variation of less than 10% between the simulation (column 6) and experimental (column 5) values. For
TABLE 2 Chloride Diffusion Coefficients for 0.5 w/c Ratio Mixes
Average D (m*/s x 10-r’)
7.54
2.96
0.96
5.66
1.79
5.3
0.84
lialulatial
(m*/s x 10-r’) (4a’ 7 )

Vol. 25, No. 4 WATER PERMEAJULlTY, CHLORIDE DIFFUSION, MORTARS, PORE STRUCTURE 197
the w/c = 0.50 data, the simulation values are on the average a factor of two times greater than the values measured experimentally, an acceptable agreement.
The analysis presented here does not include the effects of binding of the chloride ions by reaction with or adsorption by the phases present in the cement paste. Computer simulation studies have shown that the binding capacity of a paste can be important in slowing down the ingress of chloride ions into a cement paste specimen (15). Although binding cannot be ignored, it should not be a factor in comparing pastes to mortar specimens at a constant w/c ratio as the binding per unit volume paste should be constant.
Introducing inert sand particles into the cement paste resulted in higher diffusivities and permeabilities even though the sand particles are relatively impenetrable compared with cement paste. This is in agreement with the general observation that the permeability of concrete is one to two orders of magnitude higher than that of neat cement paste (16). The difference seems to be more pronounced as hydration proceeds. This suggests that the differences between the transport coefficients of the paste and mortar are due to the different pore structure developed in the presence of sand particles. The coefficient of variation of the calculated diffusion coefficients was less than 10%. Only two samples yield significantly different results, which could be caused by such defects as a large air bubble inside the sample. These two samples were excluded from the final analysis.
The permeability results provide some indication that interfacial zone percolation is occurring between 35 and 45% sand for the 0.4 w/c ratio systems. For these systems, statistical analysis indicates that at the 95% confidence level, the differences between the 0% sand and all other sand contents are significant, differences between the 35% sand and the 45-55% sand contents are generally significant, and differences between the 45 and 55% sand contents are never significant. The results for the 0.5 w/c systems are less clear with the 35 and 55% sand contents having nearly the same permeabilities and the 45% sand system a significantly lower permeability. Part of the difficulty in comparing results at different sand contents is the variable porosity (air contents) of the various mortars and pastes.
0.5 0.6 0.7 0.5 0.6 0.7
Degree of Hydration
FIG. 3 Permeability vs. degree of hydration for 0.4 and 0.5 w/c ratio mixes.

798 P. Hahnickova et al. Vol. 25. No. 4
The critical pore radius (or maximum continuous pore radius) showed that the largest fraction of interconnected pores in mortars have greater radii than in the paste. This difference between paste and mortars was much less pronounced at 0.5 w/c ratio. However, there was a great difference between the range of the critical pore radius with continuing hydration. When hydration of the samples increased from 50% to 73 % , the critical radius decreased from 6.5 nm to 17 nm for the 0.4 w/c ratio mortars, while for the 0.5 w/c ratio mortars this decrease was from 140 nm to 20 nm.
It might be expected that there are relationships between the two transport rates measured in this study and the pore structure characteristics. Roy and Li (17) investigated the relationship between the rapid chloride permeability (total charge passed in six hours) and mean pore radius for ordinary portland cement pastes as well as for cements containing supplementary cementing materials. They observed that the chloride transport rate increased linearly with mean pore radius, which was defined as the pore radius at which 50% of the pore volume was intruded in the pore size range considered. Roy (18) pointed out that the mean pore radius and the critical pore radius had similar values in most cementitious materials. Since the critical radius represents the grouping of the largest fraction of interconnected pores influencing the transport properties, the relationship between the critical pore radius and the chloride diffusion was examined in the present work. The diffusion coefficient, determined from the accelerated concentration cell test described above, was plotted against the critical pore radius of the corresponding mix for the two w/c ratios [Fig. 41. A well correlated linear relationship between chloride diffusion and critical pore radius was observed, especially for the 0.5 w/c ratio mixes (r’ for 0.5 w/c ratio was 0.972 and r2 for both w/c ratios was 0.931).
For cement pastes with w/c between 0.23 and 1.0, Nyame and Illston (19) have previously shown that permeability can be represented by a power-law function of critical pore radius
8
1
0
1 /fi(-4.3 x 10-12) + (6.5 x 10⁻¹³) Cr
7x+ n
I I I I I 20 40 60 80 100 120
Critical Pore Radius (nm)
FIG. 4 Chloride diffusion coefficient vs. critical pore radius (Cr) for portland cement pastes and
mortars.

Vol. 25, No. 4 WATER PERMEABILITY, CHLORIDE DIFFUSION, MORTARS, PORE STRUCTURES 799
with a best-fit exponent of 3.28. Figure 5 shows a log-log plot of the results obtained in this study. Here, the best-fit line has a slope of 3.35, in excellent agreement with the results given in (19), while exhibiting a comparable amount of scatter. Usually, permeability is related to a characteristic length scale raised to the power of two (20). However, in these same equations, a term usually appears to account for the tortuosity of the porous media, which also appears in equations for diffusivity. Because the diffusivity itself has been shown to be a linear function of critical radius, one might expect that permeability would be a function of critical radius to the (2+ 1=3) third power, not that different from the calculated values of about 3.3. This hypothesis can be tested more rigorously by the application of the theory of Katz and Thompson to the data set obtained in this study.
The basic Katz-Thompson relationship (6) states that
kc3 CF
(5)
where D, is the critical pore diameter, F is the formation factor (equivalent to D,jD (1 I)), and c is a constant, taken to be 226 in the original work of Katz and Thompson (6), but which can assume other values depending on the assumptions that are made concerning pore geometry. This relationship has been applied quite successfully to predicting the permeabilities of sedimentary rocks (6). The current study is unique in that it is the first known study where formation factor, permeability, and critical pore diameter were determined for a common set of samples of cement-based materials. Recently (21,22), two attempts have been made to evaluate this relationship for cement-based materials. The first used data sets which lacked information on formation factor, and so estimated F from available MIP curves (21). The second used values of F (or DJD) measured experimentally
I
cl
1 x lo6 x Cr3.35
I I
l-
-7.6 -7.4 -7.2 -7.0 Log [Critical Radius (m)]
FIG. 5 Permeability vs. critical pore radius (Cr) for portland cement pastes and mortars.
800 P. Halamickova et al. Vol. 25, No. 4
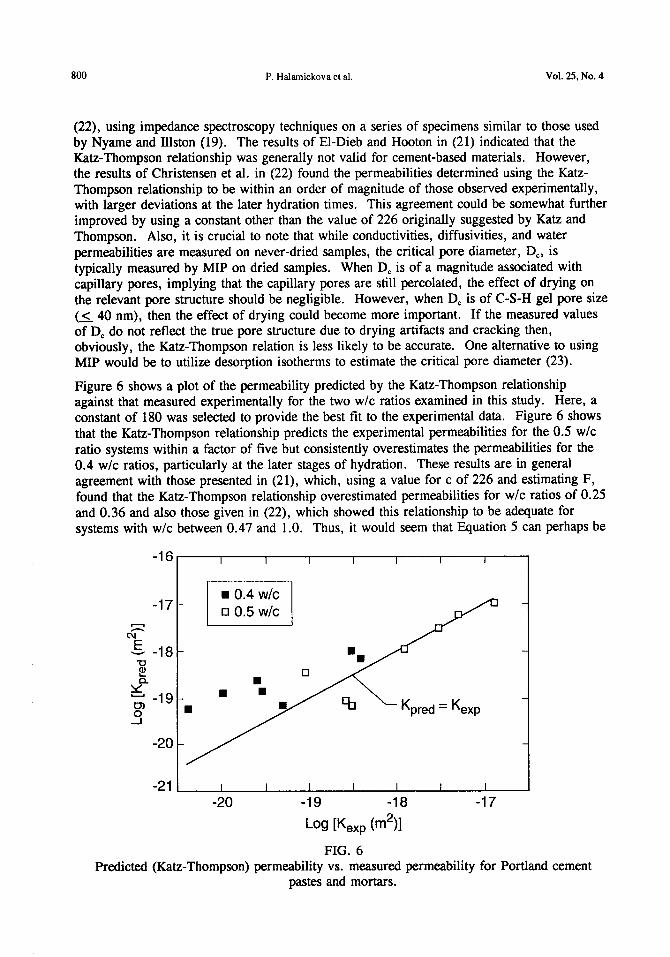
(22), using impedance spectroscopy techniques on a series of specimens similar to those used by Nyame and Illston (19). The results of El-Dieb and Hooton in (21) indicated that the Katz-Thompson relationship was generally not valid for cement-based materials. However, the results of Christensen et al. in (22) found the permeabilities determined using the Katz- Thompson relationship to be within an order of magnitude of those observed experimentally, with larger deviations at the later hydration times. This agreement could be somewhat further improved by using a constant other than the value of 226 originally suggested by Katz and Thompson. Also, it is crucial to note that while conductivities, diffusivities, and water permeabilities are measured on never-dried samples, the critical pore diameter, D,, is typically measured by MIP on dried samples. When D, is of a magnitude associated with capillary pores, implying that the capillary pores are still percolated, the effect of drying on the relevant pore structure should be negligible. However, when D, is of C-S-H gel pore size (5 40 nm), then the effect of drying could become more important. If the measured values of D, do not reflect the true pore structure due to drying artifacts and cracking then, obviously, the Katz-Thompson relation is less likely to be accurate. One alternative to using MIP would be to utilize desorption isotherms to estimate the critical pore diameter (23).
Figure 6 shows a plot of the permeability predicted by the Katz-Thompson relationship against that measured experimentally for the two w/c ratios examined in this study. Here, a constant of 180 was selected to provide the best fit to the experimental data. Figure 6 shows that the Katz-Thompson relationship predicts the experimental permeabilities for the 0.5 w/c ratio systems within a factor of five but consistently overestimates the permeabilities for the 0.4 w/c ratios, particularly at the later stages of hydration. These results are in general agreement with those presented in (21), which, using a value for c of 226 and estimating F, found that the Katz-Thompson relationship overestimated permeabilities for w/c ratios of 0.25 and 0.36 and also those given in (22), which showed this relationship to be adequate for systems with w/c between 0.47 and 1.0. Thus, it would seem that Equation 5 can perhaps be
-21 I[ -20 -19 -18 -17
Log [K,,,, O-n*)1
FIG. 6 Predicted (Katz-Thompson) permeability vs. measured permeability for Portland cement
pastes and mortars.
Vol. 25, No. 4 WATER PERMEABILITY. CHLORIDE DIFFUSION, MORTARS. PORE STRLJCI’URFLS 801
used for systems with relatively high w/c ratio systems but not for lower w/c ratios. This could be an effect of the capillary porosity percolation (24) and the changing pore structure of cement-based materials as a function of w/c and hydration as was discussed above, and the effect of drying on measurements of D, when D, is clearly of gel pore magnitude, as is the case for the latest hydration stages of the 0.4 w/c ratio systems.
The results of (24) imply that the critical degree of hydration at which the capillary pores become disconnected is 0.66 for 0.4 w/c, and 0.86 for 0.5 w/c. So for c&a,, one would predict that the paste transport is dominated by capillary pores, and for a > CL,, by C-S-H gel pores. Looking at Figure 1, it is clear that for many of the later hydration points studied, the 0.4 w/c transport will be dominated by gel pores, since a > a,. This is reflected in the small changes in D, with hydration, especially for the 0% sand data, as the gel pore sizes do not change with hydration but are determined by C-S-H morphology (23). The contribution of interfacial zone pores for the mortars changes this picture somewhat. In Figure 2, however, all of the 0.5 w/c data studied is in the asa, regime, and one sees very large changes in D, with hydration, even for the 0% sand specimens. The value of D, is clearly picking up the progressive reduction of the diameter of the still-percolated capillary pores, which are dominating transport. &cause the measurement of these capillary pore diameters is less affected by drying, one might then expect that the Katz-Thompson relation would work better for the 0.5 w/c systems than for the 0.4 w/c ones.
Conclusions
Chloride diffusion and water permeability in pastes and mortars with different sand contents were investigated using a concentration cell with a limited electrical gradient and a high pressure permeability cell. The coefficients of diffusion were calculated from a modified version of Fick’s second law. It can be concluded that: 1. The method yielded the diffusion coefficients in a relatively short period (up to 10 days)
with acceptable variability of 4 to 7%. 2. The diffusivity and permeability of both pastes and mortars decrease with increasing
degree of hydration, the rate of hydration being different for pastes and mortars. 3. Increasing the w/c ratio reduced the resistance of both pastes and mortars to Cl diffusion
and water flow. 4. For the same degree of hydration, introducing sand particles into the cement paste resulted
in higher transport coefficients. 5. A good linear relationship between the coefficient of diffusion and the critical pore radius,
as determined by MIP, was observed. A power-law relationship with an exponent of 3.3 was observed in relating permeability to this same critical pore radius. 6. The Katz-Thompson relationship appears to have limited validity for cement-based materials, providing accurate estimates of permeability at w/c=O.5 but significantly overestimating the permeability for the more hydrated w/c=O.4 systems; this suggests that the Katz-Thompson relation may work better for systems with interconnected capillary pore networks, than for systems where the gel pores dominate the transport.
References
1. Winslow, D. and Liu, D., Cement and Concrete Research, 20 (2), 227, 1990. 2. Winslow, D.N., Cohen, M.D., Bentz, D.P., Snyder, K.A., and Garboczi, E.J., Cement
and Concrete Research, 24 (3), 25, 1994. 3. Cao, Y., and Detwiler, R., “Rackscattered Electron Imaging of Cement Pastes Cured at
Elevated Temperatures”, submitted to Cement and Concrete Research.

802 P. Halamickova et al. Vol. 25, No. 4
4. Bellander, U., Accelererad Priivning av Betongs Hallfasthet. Bestamning av Hydratationsgrad. Report No. Fo 7312/P5, Swedish Cement and Concrete Research Institute, Stockholm, 1973.
5. Hearn, N. and Hooton, R.D., Cement and Concrete Research, 22 (5), 970, 1992, . 6. Katz, A.J. and Thompson, A.H., Journal of Geophysical Research, 92 (Bl), 599, 1987,
and Physical Review B, 2, 8179, 1986. 7. Hearn, N. and Mills, R.H., Cement and Concrete Research, , 2 (2/3), 257, 1991. 8. ASTM C 1202-91, “Standard Test Method for Electrical Indication of Concrete’s Ability
to Resist Chloride Ion Penetration,” American Society for Testing and Materials, 1991. 9. Detwiler, R.J., Kjellsen, K.O. and Gjorv, OX., AC1 Materials Journal, 88 (l), 19, 1991. 10. Halamickova, P., “The Influence of Sand Content on the Microstructure Development
and Transport Properties of Mortars”, M.S. Thesis, University of Toronto, 1993. 11. Garboczi, E.J. and Bentz, D.P., Journal of Materials Science, 22, 2083, 1992. 12. Weast, R.C., ed. Handbook of Chemistry and Physics, 57th edition, CRC Press,
Cleveland ( 1976). 13. Powers, T.C., and Brownyard, T.L., Journal of the American Concrete Institute, 43,
101, 249, 469, 549, 669, 845, 993 (1947). 14. Young, J.F., and Hansen, W., “Volume Relationships for C-S-H Formation Based on
Hydration Stoichiometries, ” Materials Research Society Symposium Proceedings, Vol. 85, 313, 1987.
15. Bentz, D.P. and Garboczi, E. J., “A Computer Model for the Diffusion and Binding of Chloride Ions in Portland Cement Paste, ” NISTIR 5125, U.S. Department of Commerce, February 1993.
16. Young, J.F., in AC1 SP108-1, Permeability of Concrete, ACI, Detroit (1988). 17. Roy, D.M. and Li, S., Cement and Concrete Research, ti (5), 749, 1986. 18. Roy, D.M. “Relationship Between Permeability, Porosity, Diffusion and Microstructure
of Cement Pastes, Mortar, and Concrete at Different Temperatures,” Materials Research Society Symposium Proceedings, Vol. 137, 179, 1988.
19. Nyame, B.K. and Illston, J.M., “Capillary Pore Structure and Permeability of Hardened Cement Paste,” 7th International Symposium on the Chemistry of Cement, Paris, Vol. III, VI181-V1186, 1980.
20. Garboczi, E.J., Cement and Cement Research, 20 (4), 591, 1990. 21. El-Dieb, A. and Hooton, R.D., Cement and Concrete Research, 24 (3), 443, 1994.. 22. Christensen, B.J., Mason, T.O., and Jennings, H.M., “Comparison of Measured and
Calculated Permeabilities for Hardened Cement Paste,” submitted to Cement and Concrete Research.
23. Baroghel-Bouny, V., and Chaussadent, T., Bulletin de Liaison des Laboratoires des Ponts et Chaus&es, &37, 69, 1993.
24. Bentz, D.P. and Garboczi, E.J., Cement and Concrete Research, 21 (2/3), 325, 1991.