Embed Size (px)
Citation preview

8/12/2019 00009786_92172
http://slidepdf.com/reader/full/0000978692172 1/15
Fuel properties, engine performance and emission characteristic of commonbiodiesels as a renewable and sustainable source of fuel
M.I. Arbab n, H.H. Masjuki, M. Varman, M.A. Kalam, S. Imtenan, H. Sajjad
Centre for Energy Sciences, Department of Mechanical Engineering, Faculty of Engineering, University of Malaya, 50603 Kuala Lumpur, Malaysia
a r t i c l e i n f o
Article history:
Received 15 August 2012
Received in revised form22 January 2013
Accepted 23 January 2013Available online 28 February 2013
Keywords:
Energy
Biodiesel
Fuel properties
Performance
Emission
Renewable energy
a b s t r a c t
The energy security concern has been established as an alarming issue in context of petro diplomacy now-
a-days. Global warming with rapid changes in climate, increase in price and depletion in reserve of fossil
fuel are leading scientists to work toward alternative fuel. Biodiesel could be an answer for the alternativefuel, which is renewable, biodegradable, non-toxic and less polluting. This paper is comprised of fuel
properties, engine performance and emission characteristics of commonly used different vegetable
(jatropha, palm, coconut, cottonseed, sunflower, soybean and canola/rapeseed) based biodiesel derived
from experimental results at different conditions performed worldwide. It can introduce a potential
guideline to improve engine performance and emission characteristics using different biodiesels and their
blends as well. This paper provides a comparative baseline to make an easy comparison among the
biodiesels in respect of fuel properties, engine performance and emission characteristics.
& 2013 Elsevier Ltd. All rights reserved.
Contents
1. Introduction . . . . . . . . . . . . . . . . . . . . . . . . . . . . . . . . . . . . . . . . . . . . . . . . . . . . . . . . . . . . . . . . . . . . . . . . . . . . . . . . . . . . . . . . . . . . . . . . . . . . . . 134
2. Fuel properties . . . . . . . . . . . . . . . . . . . . . . . . . . . . . . . . . . . . . . . . . . . . . . . . . . . . . . . . . . . . . . . . . . . . . . . . . . . . . . . . . . . . . . . . . . . . . . . . . . . . 134
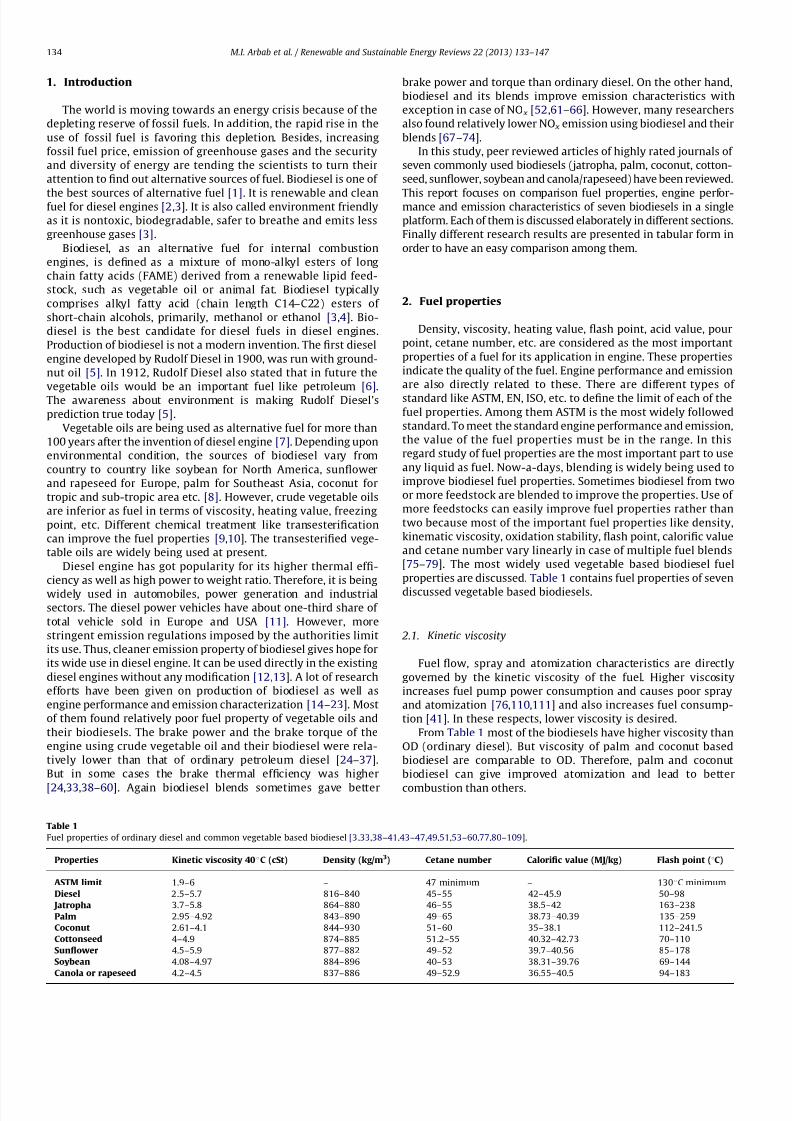
2.1. Kinetic viscosity . . . . . . . . . . . . . . . . . . . . . . . . . . . . . . . . . . . . . . . . . . . . . . . . . . . . . . . . . . . . . . . . . . . . . . . . . . . . . . . . . . . . . . . . . . . . . 134
2.2. Density . . . . . . . . . . . . . . . . . . . . . . . . . . . . . . . . . . . . . . . . . . . . . . . . . . . . . . . . . . . . . . . . . . . . . . . . . . . . . . . . . . . . . . . . . . . . . . . . . . . . 135
2.3. Cetane number. . . . . . . . . . . . . . . . . . . . . . . . . . . . . . . . . . . . . . . . . . . . . . . . . . . . . . . . . . . . . . . . . . . . . . . . . . . . . . . . . . . . . . . . . . . . . . 135
2.4. Calorific value. . . . . . . . . . . . . . . . . . . . . . . . . . . . . . . . . . . . . . . . . . . . . . . . . . . . . . . . . . . . . . . . . . . . . . . . . . . . . . . . . . . . . . . . . . . . . . . 135
2.5. Flash point . . . . . . . . . . . . . . . . . . . . . . . . . . . . . . . . . . . . . . . . . . . . . . . . . . . . . . . . . . . . . . . . . . . . . . . . . . . . . . . . . . . . . . . . . . . . . . . . . 136
3. Engine performance. . . . . . . . . . . . . . . . . . . . . . . . . . . . . . . . . . . . . . . . . . . . . . . . . . . . . . . . . . . . . . . . . . . . . . . . . . . . . . . . . . . . . . . . . . . . . . . . 137
3.1. Jatropha biodiesel. . . . . . . . . . . . . . . . . . . . . . . . . . . . . . . . . . . . . . . . . . . . . . . . . . . . . . . . . . . . . . . . . . . . . . . . . . . . . . . . . . . . . . . . . . . . 137
3.2. Palm biodiesel . . . . . . . . . . . . . . . . . . . . . . . . . . . . . . . . . . . . . . . . . . . . . . . . . . . . . . . . . . . . . . . . . . . . . . . . . . . . . . . . . . . . . . . . . . . . . . 137
3.3. Coconut biodiesel. . . . . . . . . . . . . . . . . . . . . . . . . . . . . . . . . . . . . . . . . . . . . . . . . . . . . . . . . . . . . . . . . . . . . . . . . . . . . . . . . . . . . . . . . . . . 138
3.4. Cottonseed biodiesel . . . . . . . . . . . . . . . . . . . . . . . . . . . . . . . . . . . . . . . . . . . . . . . . . . . . . . . . . . . . . . . . . . . . . . . . . . . . . . . . . . . . . . . . . 138
3.5. Sunflower biodiesel . . . . . . . . . . . . . . . . . . . . . . . . . . . . . . . . . . . . . . . . . . . . . . . . . . . . . . . . . . . . . . . . . . . . . . . . . . . . . . . . . . . . . . . . . . 138
3.6. Soybean biodiesel. . . . . . . . . . . . . . . . . . . . . . . . . . . . . . . . . . . . . . . . . . . . . . . . . . . . . . . . . . . . . . . . . . . . . . . . . . . . . . . . . . . . . . . . . . . . 138
3.7. Canola or rapeseed biodiesel. . . . . . . . . . . . . . . . . . . . . . . . . . . . . . . . . . . . . . . . . . . . . . . . . . . . . . . . . . . . . . . . . . . . . . . . . . . . . . . . . . . 139
4. Engine emission . . . . . . . . . . . . . . . . . . . . . . . . . . . . . . . . . . . . . . . . . . . . . . . . . . . . . . . . . . . . . . . . . . . . . . . . . . . . . . . . . . . . . . . . . . . . . . . . . . . 139
4.1. Jatropha biodiesel. . . . . . . . . . . . . . . . . . . . . . . . . . . . . . . . . . . . . . . . . . . . . . . . . . . . . . . . . . . . . . . . . . . . . . . . . . . . . . . . . . . . . . . . . . . . 139
4.2. Palm biodiesel . . . . . . . . . . . . . . . . . . . . . . . . . . . . . . . . . . . . . . . . . . . . . . . . . . . . . . . . . . . . . . . . . . . . . . . . . . . . . . . . . . . . . . . . . . . . . . 140
4.3. Coconut biodiesel. . . . . . . . . . . . . . . . . . . . . . . . . . . . . . . . . . . . . . . . . . . . . . . . . . . . . . . . . . . . . . . . . . . . . . . . . . . . . . . . . . . . . . . . . . . . 1404.4. Cottonseed biodiesel . . . . . . . . . . . . . . . . . . . . . . . . . . . . . . . . . . . . . . . . . . . . . . . . . . . . . . . . . . . . . . . . . . . . . . . . . . . . . . . . . . . . . . . . . 141
4.5. Sunflower biodiesel . . . . . . . . . . . . . . . . . . . . . . . . . . . . . . . . . . . . . . . . . . . . . . . . . . . . . . . . . . . . . . . . . . . . . . . . . . . . . . . . . . . . . . . . . . 141
4.6. Soybean biodiesel. . . . . . . . . . . . . . . . . . . . . . . . . . . . . . . . . . . . . . . . . . . . . . . . . . . . . . . . . . . . . . . . . . . . . . . . . . . . . . . . . . . . . . . . . . . . 142
4.7. Canola or rapeseed biodiesel. . . . . . . . . . . . . . . . . . . . . . . . . . . . . . . . . . . . . . . . . . . . . . . . . . . . . . . . . . . . . . . . . . . . . . . . . . . . . . . . . . . 142
5. Conclusion . . . . . . . . . . . . . . . . . . . . . . . . . . . . . . . . . . . . . . . . . . . . . . . . . . . . . . . . . . . . . . . . . . . . . . . . . . . . . . . . . . . . . . . . . . . . . . . . . . . . . . . 144
Acknowledgment. . . . . . . . . . . . . . . . . . . . . . . . . . . . . . . . . . . . . . . . . . . . . . . . . . . . . . . . . . . . . . . . . . . . . . . . . . . . . . . . . . . . . . . . . . . . . . . . . . . . . . 145
References . . . . . . . . . . . . . . . . . . . . . . . . . . . . . . . . . . . . . . . . . . . . . . . . . . . . . . . . . . . . . . . . . . . . . . . . . . . . . . . . . . . . . . . . . . . . . . . . . . . . . . . . . . . 145
Contents lists available at SciVerse ScienceDirect
journal homepage: www.elsevier.com/locate/rser
Renewable and Sustainable Energy Reviews
1364-0321/$- see front matter & 2013 Elsevier Ltd. All rights reserved.
http://dx.doi.org/10.1016/j.rser.2013.01.046
n Corresponding author. Tel.: þ60 1 63580809; fax: þ60 3 79675317.
E-mail address: [email protected] (M.I. Arbab).
Renewable and Sustainable Energy Reviews 22 (2013) 133–147
8/12/2019 00009786_92172
http://slidepdf.com/reader/full/0000978692172 2/15

8/12/2019 00009786_92172
http://slidepdf.com/reader/full/0000978692172 3/15
2.2. Density
Density and viscosity are directly proportional to each other.
Higher density increases energy concentration of fuel [112] and
minimizes fuel leakage. It also influences the fuel atomization
efficiency [76]. But higher density causes higher viscosity which
in return gives poor combustion and effects engine performance
and emission.
From Table 1, density of biodiesel is usually higher than OD. Butsometimes palm, coconut and canola or rapeseed biodiesel have a
density close to OD which can make them superior to others.
2.3. Cetane number
Cetane number (CN) is a prime indicator of the quality of fuel
used in compression ignition (CI) engines. It is a dimensionless
descriptor. It is related to ignition delay time, i.e., the time elapsed
between injection of the fuel and onset of ignition. A shorter
ignition delay corresponds to a higher CN and vice versa. Higher
CN is desired for CI engine fuel.
Though most of the biodiesels have higher CN than that of OD
(Table 1), among them, palm and coconut biodiesel usually have
higher CN than other biodiesels. In this respect, these two
biodiesels are better than others.
2.4. Calorific value
The calorific value of a fuel is defined as the amount of heat
released during combustion when a unit quantity of the fuel is
burnt. Higher calorific value for fuel is desired because it facil-
itates the heat release during combustion and improves engine
performance [39,92,113,114].
Table 2
Different experimental engine performance results using jatropha biodiesel compared to OD.
Engine Test condition Result Reference
Power/torque Efficiency BSFC
3-Cylinder, WC, CI
engine, D: 3.44 l,
CR:18:1, RS:
2200 rpm
Full throttle at different engine speeds Increased for 20% to 50%
blend, for 100% blend
increment of power observed
for 2000 rpm and higher speed
– Higher than OD and
increased with the blend
ratio but decreased as the
engine speed increased
[88]
1-Cylinder, 4S, WC,
DI, CR: 1:17, D:
815 cm3, RP:
8.82 kW, RS:
2000 rpm
Constant speed (1500 rpm and 2000 rpm)
at different power
– Increased by 0.2%–3.5% for
1500 rpm, increased by
0.1%–6.7% for 2000 rpm
For 1500 rpm, the average
increment 9.3%; for
2000 rpm, the average
increment 6.8%
[40]
1-Cylinder, 4S, WC,
CR: 1:17.5 D:
661.45 cm3 RP:
5.2 kW RS:
1500 rpm
Speed: 1500 rpm IA: 231 bTDC IP: 160 kg/
cm2, different brake powers, different
blends (20%, 40%, 60% and 100%)
– Efficiency decreased as
blend ratio increased
– [84]
Speed: 1500 rpm IP: 160 kg/cm2. Different
brake powers. Different IT (211–251 bTDC)
for 20% blend
– IT 23o bTDC gives highest
efficiency and higher than
OD at high load
–
1-Cylinder, 4S, WC,
RP: 8bhp RS:1500 rpm
Different brake power for different blends
(25%, 50%, 75% and 100%) at constantspeed
– 25% blend give
comparable efficiency and100% blend gives
maximum 7% decrease of
efficiency
Increases with increase of
blend ratio
[46]
1-Cylinder, AC, DI,
CR: 1:18, D:
395 cm3 RP:
5.59 kW,
RS:3600 rpm
Different speeds (3200 rpm, 2500 rpm,
1800 rpm), different torques (5 Nm,
10 Nm and 15 Nm) and different injection
timings (340, 345, 350)
– Lower than OD Higher than OD [116]
1-Cylinder, AC,
CR: 1:17.5, D:
947.87 cm3
RP: 7.4 kW,
RS: 1500 rpm
At different loads (0%, 20%, 40%, 60%, 80%
and 100%) and different blends (5%, 10%,
20%, 30% and 100%)
– Lower than OD and
decreased with increase of
blend ratio
Higher than OD and
increase with blend ratio
[117]
1-Cylinder, 4S, DI,
WC CR: 1:18.5, D:
1.007 L RP: 19
PS, RS: 2400 rpm
At different speeds (1000–2400 rpm) and
different blends (10%, 20%, 50% and 100%)
Torque decreased from 2.65 to
4.75% with the increase of
blend ratio
Lower than OD and up to
50% blend, it increased and
then remain almost
constant
Higher than OD and up to
50% blend, it decreased and
then remain almost
constant
[118]
4-Cylinder, 4S, TC,
CR: 1:18.5, D:
2609 cm3 RP:
84.5 kW, RS:
3800 rpm
Full throttle at different speeds and also
optimized injection parameters to
compensate power deterioration
Normally decreased but
optimized injection increased
than OD
Almost same as OD Always higher than OD [119]
1-Cylinder, DI,
CR: 1:16.5 RP:
5 HP, RS:
1500 rpm
At different loads (25%, 50%, 75% and
100%) and different blends (20%, 40%, 50%,
60%, 800% and 100%)
– Up to 80% blend, efficiency
was higher than OD, 20%
blend gave maximum
36.9% efficiency
Lower than OD for 20%
blend, 100% blend gave
higher OD, almost same as
OD for the other blends
[120]
1-Cylinder, 4S, WC,
NA, DI, CR:
1:17.5, D:
661 cm3 RP:
7 HP, RS:
1500 rpm
Full load, different blends (5%, 10%, 15%,
20%, 25% and 100%), different injection
pressure (180, 200, 220 and 240 bar),
different IT (22, 27 and 32 deg)
– Maximum at 220 bar,
minimum at 240 bar,
maximum at 32 deg,
minimum at 22 deg
– [121]
4S¼four stroke, WC¼water cooled, AC¼air cooled, NA¼naturally aspirated, DI¼direct injection, CR ¼compression ratio, D¼displacement volume, RP¼rated power,
RS¼rated speed, TC¼turbo charged, IT¼injection timing, deg¼degree.
M.I. Arbab et al. / Renewable and Sustainable Energy Reviews 22 (2013) 133–147 135

8/12/2019 00009786_92172
http://slidepdf.com/reader/full/0000978692172 4/15
Usually biodiesels have lower calorific value than that of OD.
But cottonseed biodiesel has got the calorific value very
close to OD and higher than other biodiesels. Jatropha,
palm and soybean biodiesel also have comparable calorific value.
So, these biodiesel can give better engine performance than other
biodiesels.
2.5. Flash point
Flash point is one of the most important properties of fuel. It
indicates the minimum ignition temperature of the fuel. Higher
flash point makes fuel safer for handling and storage and prevent
unexpected ignition of fuel during combustion.
Table 3
Different experimental engine performance results using palm biodiesel compared to OD.
Engine Test condition Result Reference
Power/torque Efficiency BSFC
6-Cylinder, 4S, WC, NA,
DI, CR: 1:15.9, D:
991 cm3 RP: 81 kW,
RS: 2600 rpm
Full load and constant speed
(1500 rpm)
Decreas ed b y 2 .5 % Decreased b y 0.48 % In creas ed b y 7 .5 % [33]
4-Cylinder, 4S, WC, NA,
IDI, CR: 1:21.47, D:
449.77 cm3 RP:
38.8 kW, RS: 4250 rpm
Full load at different speeds
and different blends (5%,
20%, 50% and 100%)
Decreased as the biodiesel
percentage increased
– Increased as the biodiesel
percentage increased
[124]
1-Cylinder, 4S, AC, NA,
DI, CR: 1:18, D: 634 cm3
RP: 5.4 kW, RS:
1800 rpm
Constant speed (1800 rpm)
with different loadings
– Average about 1%
lower for 50% blend
and 2% lower for 100%
blend
Pure PME has about 10%
increment and 50% blend of 20–
35% increased with increase of
blend ratio
[44]
4-Cylinder, 4S, NA, IDI, WC CR: 21.47:1 RP:
38.8 kW, RS: 4250 rpm
Different engine speed at fullload and different blends
(10%, 30%, 40%, 60%, 80%
and 100%)
10% blend gave almost same asOD and maximum about 7%
decreased with increase of
blend ratio
Maximum about 8%decreased with
increase of blend ratio
Maximum about 11% increasedwith increase of blend ratio
[89]
6-Cylinder, 4S, DI, WC,
NA CR: 15.9:1 RP:
81 kW, RP: 2600 rpm
Full load at different speeds 4–5% reduced – 9–10% increased [45]
1-Cylinder, 4S, WC, DI,
NA CR: 16.5:1 RP:
3.5 kW, RS: 1500 rpm
Constant speed and different
percentages of EGR (0% and
15%)
– OD at 15% EGR and
biodiesel at 0% EGR
gave almost the same
OD at 15% EGR and biodiesel at
0% EGR gave almost the same
[125]
1-Cylinder, 4S,DI, NA, AC
RP: 4.6 kW, RS:
3500 rpm CR: 22:1,
D: 347 cm3
Different loads, speeds and
blends (50% and 100%)
– – Higher than OD and increased
with increase of blend ratio
[126]
1-Cylinder, 4S, DI, NA,WC
CR: 17.5:1 RP:5.2 kW,
RS: 1500 rpm D:
662 cm3
Constant speed (1500 rpm),
different load and different
blends (25%, 50%, 75% and
100%)
– Lower than OD and
decreased with
increase of blend ratio
Higher than OD and increased
with increase of biodiesel
concentration
[127]
1-Cylinder, 4S, WC, DI,
NA D:1.007 L, CR:16.3:1
RP: 11.77 kW RS:
2200 RPM
Constant speed (2000 rpm)
and different loads (0%, 25,
50, 75 and 100%)
– Almost same as OD Average about 16% increased [42,43,122,123]
IDI¼ indirect injection.
Table 4
Different experimental engine performance results using coconut biodiesel compared to OD.
Engine Test condition Result Reference
Power/torque Efficiency BSFC
1-Cylinder, 4S, FAC, DI,
CR: 1:19.9, D: 211 cm3
Full load, constant speed (3000 rpm) and
different fuel blends
Lower than OD and
decrease withincrease of blend
ratio
Lower than OD and
decrease with increase of blend ratio
– [130]
1-Cylinder, 4S, WC, DI,
CR: 1:17.5 D: 661 cm3 RP:
5.2 kW RS: 1500 rpm
Different loads (15%, 30%, 45%, 60%, 75%, 90%
and 100%) and different blends (20%, 40%, 60%,
80% and 100%)
– Same for full load and
higher than OD for part
load
Higher than OD and
increased with increase
of blend ratio
[131]
1-Cylinder, 4S, WC, DI,
CR: 1:16.3, D: 1007 cm3
RP: 11.77 kW RS:
2200 rpm
Fixed speed (2000 rpm), different loads (0%,
25%, 50%, 75% and 100%)
– Almost same as OD Higher than OD [42,43]
1-Cylinder, 4S, AC, DI, NA,
CR: 1:18.8, D: 367 cm3
RP: 2.8 kW, RS: 3600 rpm
Full throttle at different speeds (1200–
3600 rpm)
About 5 % less p ower Alm os t same In creas ed b y 2 –7 % [129]
4-Cylinder, DI, CR: 1:19.5,
D: 1.7 L RP: 66 kW RS:
4200 rpm
Different speeds (1500, 2000 and 2300 rpm),
different BMEP (1, 2.6, 2, 4.2 bar) and different
percentages of EGR (11–32%)
– Slightly increased for 5%
blend and slightly
decreased for 20% blend
Almost same for 5%
blend and about 4%
increased for 20% blend
[128]
FAC¼forced air cooled.
M.I. Arbab et al. / Renewable and Sustainable Energy Reviews 22 (2013) 133–147 136

8/12/2019 00009786_92172
http://slidepdf.com/reader/full/0000978692172 5/15
Most of the biodiesel have got higher flash point than that of
OD. ASTM standard recommends minimum flash point of a
biofuel to be 130 1C. Therefore, it is obvious that jatropha and
palm biodiesels are better than others in this regard.
3. Engine performance
To use biodiesel as a fuel, the first consideration is itseconomic aspect. If the crude oil is not widely available, it cannot
be used as engine fuel. Engine performance is the next parameter
which indicates whether a fuel is economical or not. Brake power,
brake specific fuel consumption (BSFC) and brake thermal effi-
ciency are the performance indicators for engines. Not only fuel
properties but also fuel injection pressure and timing, air-fuel
mixture, amount of injected fuel, fuel spray pattern etc. affect
engine performances. Usually engine brake power, brake torque
and BSFC are tested against load or speed. Engine performance
parameters for different biodiesel and their blends are discussed
here.
Articles reviewed here reveal that biodiesel generally gives
lower power, torque and thermal efficiency at higher fuel con-
sumption than that of OD. Usually calorific value of biodiesel islower than OD, thus, use of pure biodiesel or its blends as fuel
reduces heat release during combustion and decreases engine
performance. However, in some cases, irregular change of power
[88,115] and efficiency [115] were observed. It may be because,
the engines were not modified for biodiesel used and the amounts
of fuel injected at different load conditions were not properly
tuned.
3.1. Jatropha biodiesel
Most of the experimental results have shown that jatrophabiodiesel and its blends yield higher thermal efficiency at higher
fuel consumption [38,40,46,83–85]. Its blends often produce more
brake power than petroleum diesel [88]. However, in some cases,
lower efficiency [38,46] was also found.
Table 2 shows different experimental results of engine perfor-
mance using jatropha biodiesel. In most of the cases, lower
calorific value of jatropha biodiesel results in lower power-
torque (2–5%) and thermal efficiency at higher BSFC (6–10%).
But complete combustion characteristic of jatropha biodiesel
sometimes give higher power-torque and thermal efficiency
(0.2–6%).
3.2. Palm biodiesel
Palm biodiesel usually gives lower power, torque and thermal
efficiency at higher fuel consumption [33,45,89]. But in some
Table 5
Different experimental engine performance results using cottonseed biodiesel compared to OD.
Engine Test condition Result Reference
Power/torque Efficiency BSFC
1-Cylinder, 4S, AC, DI, CR:
1:18, D: 406 cm3 RP: 10
HP, RS: 3600 rpm
Different speeds (1250, 1500, 1750,
2000, 2250 and 2500 rpm) and different
blends (5%, 20%, 50%, 75% and 100%)
Decrease with increase of blend ratio but
5% blend gave higher torque
– Increase with
the increase of
blend ratio
[24]
1-Cylinder, 4S, AC, DI,
CR: 1:18, D: 395 cm3
RP: 6.2 kW, RS:
3600 rpm
Different speeds (3100, 2800, 2500,
2200, 1900, 1600 and 1300 rpm) and
75% blend
Slightly lower – Slightly higher
than OD
[48]
1-Cylinder, 4S, NA, DI, CR:
1:18 D: 395 cm3 RS:
3600 rpm
Different speed and preheated biodiesel
at different temperatures (30, 60, 90 and
120 1C)
90 1C preheated gave minimum average
reduction (1.92%), 120 1C preheated gave
maximum average reduction (7.59%)
Higher than OD and
increased with the
increase of preheating
– [115]
6-Cylinder, 4S, WC, DI, TC,
CR: 1:18, D: 5958 cm3
RP: 177 kW, RS:
2600 rpm
Two different speeds (1200 and
1500 rpm), different loads (20%, 40% and
60%) and different fuel blends
– Almost same as OD Increased
with increase
of blend ratio
[49,50]
1-Cylinder, 4S, WC, DI,
CR: 1:18, D: 661 cm3
Constant speed (1500 rpm) and different
loadings
– Maximum decreased
by about 2%
Increased by
about 3–7%
[132]
Table 6
Different experimental engine performance results using sunflower biodiesel compared to OD.
Engine Test condition Result Reference
Power/torque Efficiency BSFC
4-Cylinder, 4S, DI, WC RP:55 kW RS:
4500 rpm CR:21.5:1
Full load and variable speeds Maximum about 10% lower – 2–5% higher [135]
1-Cylinder,4S CR:17.5:1 RP: 4.4 kW
RS: 1500 rpm
Constant 1500 rpm speed with different loadings (20%, 40%,
60% and 80%) and different blends (20%, 40%, 60%, 80% and
100%)
– – Almost
same as
predicted
[136]
1-Cylinder, 4S, NA, AC, DI CR: 17.5:1,
D: 0.661 L RP: 4.4 kW, RS:
1500 rpm
Constant 1500 rpm speed with different loads – 2–5%
increased
6–12%
increased
[134]
4-Cylinder, 4S, TC, IDI, CI, WC CR:
21.5:1, D: 1753 cm3 RP: 55 kW, RS:
4500 rpm
17.5% blend, 1500–3000 rpm speed and different loads
(50%, 75% and 100%)
Slightly higher Slightly
higher
Slightly
higher
[52]
6-Cylinder,4 S,TC CR: 15:1, D: 9.6 L
RP:180 kW, RS: 2200 rpm
Full load, different speed and different blends (5% and 30%) Slightly higher for 5% blend.
About 2–3% lower for 30%
blend
– Almost
same
[97]
M.I. Arbab et al. / Renewable and Sustainable Energy Reviews 22 (2013) 133–147 137

8/12/2019 00009786_92172
http://slidepdf.com/reader/full/0000978692172 6/15
cases, it gave higher thermal efficiency and lower fuel consump-
tion than petroleum diesel [44].
Table 3 contains engine performance results extracted from
different experiments at different conditions. Most of the cases
use of palm biodiesel increases the fuel consumption by 7–16%
and produces relatively lower power-torque (2–7%) and thermal
efficiency (0.5–2%). However, in some cases thermal efficiency
was almost same as OD [42,43,122,123].
3.3. Coconut biodiesel
Engine performance test using coconut biodiesel usually gives
lower brake power, brake thermal efficiency at higher fuel
consumption [42,43,128–130]. But some of the experimental
results also gave higher thermal efficiency [128,131].
Table 4 represents different experimental results of engine
performance using coconut biodiesel. It shows that, in most
of the cases coconut biodiesel gives lower power at higher BSFC
(2–7%) though the thermal efficiency is higher or almost the same
as OD. It may be because of the lower calorific value of coconut
biodiesel [52].
3.4. Cottonseed biodiesel
Cottonseed biodiesel gives poor result in engine performance
test like lower power, torque and efficiency but higher fuel
consumption [24,48–50]. However, sometimes under some spe-
cific conditions it gives higher efficiency [50,115].
Table 5 represents different experimental engine performance
results using cottonseed biodiesel. Because of lower calorific
value, most of the cases it gives lower power, torque and thermal
efficiency at higher fuel consumption (3–7%). However, preheated
fuel sometimes gives higher thermal efficiency because of good
atomization and better combustion.
3.5. Sunflower biodiesel
Sunflower based biofuel can be considered as a good alter-
native fuel regarding thermal efficiency [47,52,133] but fuel
consumption is increased [47,51,52,133]. However, power andtorque characteristics depend on blend ratio and testing condi-
tions [52,97].
Different experimental results at different conditions using
sunflower biodiesel are represented in Table 6. Sunflower biodie-
sel is inferior to OD regarding engine performance for higher fuel
consumption (2–12%) and lower power-torque generation
(2–10%). However, presence of this biodiesel in blends sometimes
increases thermal efficiency (2–5%) [134].
3.6. Soybean biodiesel
Higher fuel consumption is very common for using soybean
biodiesel [54,55,58,60]. Power and torque behavior is usually
inferior [54,55,104] though sometimes higher brake power [58]and efficiency [55] were found.
Table 7 represents different experimental results of engine
performance test at different conditions. From the tables 5–15%
blends of soybean biodiesel sometimes give higher thermal
efficiency and higher power with lower fuel consumption than
that of OD. However, in most of the cases, power decreases
and fuel consumption increases as the biodiesel concentration
increased.
Table 7
Different experimental engine performance results using soybean biodiesel compared to OD.
Engine Test condition Result Reference
Power/torque Efficiency BSFC
4-Cylinder, 4S, NA, DI,
CR: 16.8:1, D:3.14 L
RS:2400 rpm
Full load, different blends (5%, 20%,
50% and 100%)
Reduction from 2.35 to
5%
Increased with increase of blend
ratio
Increased with increase of
blend ratio
[55]
4-Cylinder, 4S, NA, DI,
D: 3.14 L RS:
2400 rpm, RP:
46 kW
Full load, different speed and
different injection pressures
Lower than OD and with
increase of injection
pressure power
decreased
– Higher than OD and with
increment of injection
pressure BSFC increased
[54]
6-Cylinder, 4S, DI, TC
D: 4.2 L, CR: 17.8:1
RS: 2400 rpm, RP:
46 kW
At full load, different speed and
different blends (5%, 10%, 15%, 20%
25% and 30%)
Increased up to 1.15% for
10% blend and for higher
blends decreased up to
4.75%
20% blend gave the maximum
4.10% increment of efficiency and
then decreased with increase of
blend ratio
10% blend gave maximum
1.73% reduction and then
increased with increase of
blend ratio
[98]
1-Cylinder, NA,
4S,WC, DI, CR:
16.5:1 D: 0.996 L
RP:11.03 kW,
RS:2000 rpm
At full load and different engine
speeds
Almost same as OD – About 10% higher than OD [104]
4-Cylinder, D:
3922 cm3 RS:
2400 rpm, RP:
46 kW
Different load and different blends
(5%, 20%, 35%, 50% and 85%)
– – Increased with the increase
of blend ratio
[60]
1-Cylinder, NA, 4S,
CR: 17:1, D: 1.84 L
Different load and different blends
(20%, 50% and 100%)
– – 15–18% higher than OD and
increased with increase of
blend ration
[137]
2-Cylinder, DI, CR:
18:1, D: 1272 cm3
RS:3000 rpm
Different speed and different blends
(25%, 50%, 75% and 100%)
Lower than OD and
decrease with the
increase of blend ratio
Higher than OD and increase with
increase of blend ratio
Higher than OD and
increase with increase of
blend ratio
[138]
6-Cylinder, 4S, DI
CR: 17.3:1 D: 2.7 L
Different percentage of EGR (38%,
43%, 49% and 54%) and different
injection timing (4 to þ4 ATDC)
– – Increased with increase of
EGR and retard of IT
[139]
4-Cylinder, DI, CR:
1:19.5 D: 1.7 L RP:
66 kW RS:
4200 rpm
Different speed (1500, 2000 and
2300 rpm), different BMEP (1, 2.6, 2,
4.2 bar) and different percentage of
EGR (11–32%)
– About 2% increased for 5% blend
About 1% decreased for 20% blend
About 1.5% decreased for 5%
blend About 3% increased
for 20% blend
[128]
M.I. Arbab et al. / Renewable and Sustainable Energy Reviews 22 (2013) 133–147 138

8/12/2019 00009786_92172
http://slidepdf.com/reader/full/0000978692172 7/15
3.7. Canola or rapeseed biodiesel
Generally lower brake power and torque at higher fuel con-
sumption is very common for canola or rapeseed based biodiesel
[54,56,57,59]. However, it often provides higher thermal effi-
ciency [53,57].
From Table 8, it is clear that use of canola or rapeseed biodiesel
increase fuel consumption up to 26% and engine output powerlowers up to 10%. However, turbocharging increased brake power
up to 16% and change in thermal efficiency varied up to 6%.
4. Engine emission
Now-a-days, people are much more concerned about environ-
ment. Besides, the governments are introducing strict emission
regulation for automobiles. For this reason; a commercial fuel has
to meet the emission standards. Thus the study of engine emis-
sion has got much more importance at present. In the modern
world, engine performance as well as emission is taken into
consideration for the fuel selection. In this respect, biodiesel is
considered as a good alternative of fossil fuel as it creates less
environmental impacts [142]. This paper also illustrates the
emission characteristic of different biodiesel and their blends.
Usually presence of additional oxygen in biodiesel gives complete
combustion of fuel and reduces CO, HC and smoke emission but
increases NO x. Sometimes irregularities were observed in case
of change of emission [40]. The unmodified fuel injection system
of the engine may be the reason of the irregularity. The fuel
injection system, specially designed for definite biodiesel mayresolve this issue.
4.1. Jatropha biodiesel
The emission characteristic for jatropha biodiesel highly
depends on engine operation condition and blend ratio. Though
some of the experimental results gave lower emission of CO, HC,
NO x and smoke [40,46,88,116], higher emission was also observed
[38,46,83,84,88,116].
Table 9 gives an overview of emission using jatropha biodiesel.
Most of the time, jatropha biodiesel and its blend reduce CO, HC
and smoke emission and increase NO x. But in some cases reduc-
tion of NO x was observed because of the lower heating value of
jatropha biodiesel.
Table 8
Different experimental engine performance results using canola or rapeseed biodiesel compared to OD.
Engine Test condition Result Reference
Power/torque Efficiency BSFC
4-Cylinder, 4S, NA,
DI, WC, D: 3.14 L,
CR :16.8:1 RS:
2400 rpm, RP:51 kW
Full load, different speed, NA and
TC
About 10% reduced for NA
condition and about 16%
increased for TC condition
compare to OD at NA
About 1–3% increased for NA
condition and about 5–6%
increased for TC condition
compare to OD at NA
About 6–8% increased for NA
condition and about 4–6%
reduced for TC condition
compare to OD at NA
[57]
4-Cylinder, 4S, TC,
DI, D:1.91 L,
CR:18.45:1 RS:
4000 rpm, RP:
77 kW
Constant speed and different load Almost same – 13–15% increased [140]
1-Cylinder, 4S, WC,
DI, CR: 1:16.3, D:
1007 cm3 RP:
11.77 kW, RS:
2200 rpm
Fixed speed (2000 rpm), different
loads (0%, 25%, 50%, 75% and 100%)
– Almost same 12–17% increased [42]
4-Cylinder, 4S, WC,
DI, NA D: 4.75 L
CR:16:1 RP: 59 kW
Different speed (1400, 1600, 1800,
2000 and 2200 rpm) and different
blends (5%, 10%, 20 and 35%)
– 10% blend gave the maximum
and about 1% higher than OD.
For 100% blend, maximum
about 1–2% reduced
10% blend gave the lowest
and lower than OD. For 100%
blend, maximum about 10–
15% increased
[100]
1-Cylinder, 4S, WC,
DI, NA D:1.007 L CR:16.3 RP:
11.77 kW, RS:
2200 rpm
Constant speed (2000 rpm) and
different loads (0%, 25, 50, 75 and100%)
– Almost same – [122]
1-Cylinder, 4S, NA,
DI, D: 0.773 L
CR:15.5:1
RP:8.6 kW RS:
2500RPM
Constant speed, constant load,
different blends (20%, 50% and
100%) and different percentages of
EGR (0%, 10% and 20%)
– Lower and decreased about 1–
2% with increase of blend ratio
and EGR percentage
Slightly higher and increased
with increase of blend ratio
and EGR percentage
[59]
4-Cylinder, 4S, NA,
DI, D: 3.14 L RP:
46 kW, RS:
2400 rpm
Full load, different speeds and
different injection pressures
Lower than OD and with
increase of injection pressure
power decreased
– Higher than OD and with
increment of injection
pressure BSFC increased
[54]
1-Cylinder, 4S, WC,
NA, CR: 20:1, D:
450 cm3 RS:
4500 rpm, RP:
8 kW
Constant speed (2000 rpm),
different loads (40%, 60% and 80%)
and 30% blend
– – 2.3–3.5% increased [141]
1-Cylinder, 4S, NA,DI, CR: 17.8:1, D:
857 cm3 RS:
2400 rpm, RP:
12.5 kW
Full load and different biodiesel 2% decreased – 26% increased [105]
M.I. Arbab et al. / Renewable and Sustainable Energy Reviews 22 (2013) 133–147 139

8/12/2019 00009786_92172
http://slidepdf.com/reader/full/0000978692172 8/15
4.2. Palm biodiesel
Lower emission was expected for palm based biodiesel and
many experimental results gave the expected emission character-
istics [33,39,44,45,89,91,124]. But in some cases higher emission
were also found [33,39,44,45,89,91,124].
Table 10 shows that in most of the cases palm biodiesel and its
blends reduce emission of CO, HC and smoke in a large scale but
increase NO x up to 70%. The reduction range of CO is up to about
87%, HC is about 46% and smoke is 70%.
4.3. Coconut biodiesel
Coconut biodiesel gives very much promising emission char-
acteristics. It usually gives lower CO, HC, smoke and NO x emission
[42,43,128–131].
Table 9
Different experimental engine emission results using jatropha biodiesel compared to OD.
Engine Test condition Emission Reference
CO HC NO x Smoke
3-Cylinder, WC,
CI engine, D:
3.44 L,
CR:18:1 RS:2200 rpm
Full throttle at different engine
speed
Higher than ordinary diesel but
reduced with increase of blend
ratio
Lower than OD but
increased with the
increase of blend
ratio
Always higher than
OD
Reduced with
the increase of
blend ratio and
engine speed
[88]
1-Cylinder, 4S,
WC,DI, CI
engine, CR:
1:17, D:
815 cm3 RP:
8.82 kW, RS:
2000 rpm
Constant speed (1500 rpm and
2000 rpm) at different power
Lower than OD at high loads;
almost the same as OD at low
load.
Lower than OD and
decreased more at
higher speed
Lower at low load and
speed higher at high
load
– [40]
1-Cylinder, 4 S,
WC, CR:
1:17.5 D:
2645.81 cm3
RP: 5.2 kW
RS: 1500 rpm
Speed: 1500 rpm IA: 23o bTDC IP:
160 kg/cm2. Different brake
powers. Different blends (20%, 40%,
60% and 100%).
– – Higher than OD and
increase with the
increase of blending
ratio
Lower than OD
only for 20%
blend
[84]
Speed: 1500 rpm IP: 160 kg/cm2.
Different brake powers. Different IA
(210–250 bTDC) for 20% blend
– – 211 bTDC gives the
lowest
231 bTDC gives
the lowest
1-Cylinder, 4S,
WC, RP:8 bhp RS:
1500 rpm
Different brake powers for different
blends (25%, 50%, 75% and 100%) atconstant speed
Higher than OD but at pick load
lower emission observed
Lower than OD and
decreased withincrease of blend
ratio
Higher than OD and
increased with blendratio
Always lower
than OD
[46]
1-Cylinder, AC,
DI, CR: 1:18
D: 395 cm3
RP: 5.59 kW
RS:3600 rpm
Different speeds (3200 rpm,
2500 rpm, 1800 rpm), different
torques (5 Nm, 10 Nm and 15 Nm)
and different injection timings
(340, 345, 350)
Lower than OD Lower than OD Higher than OD Lower than OD [116]
1-Cylinder, AC,
CR: 1:17.5 D:
947.87 cm3
RP: 7.4 kW
RS: 1500 rpm
At different loads (0%, 20%, 40%,
60%, 80% and 100%) and different
blends (5%, 10%, 20%, 30% and
100%)
Lower than OD and decrease with
increase of blend ratio
Lower than OD and
decrease with
increase of blend
ratio
Higher than OD and
increased with the
increase of blend
ratio
Lower than OD
and decrease
with increase of
blend ratio
[117]
4-Cylinder, 4S,
TC, DI D: 3.3 l
RP: 79 kW
RS: 3200 rpm
Different loads (10%, 25%, 50% and
75%) and different blending ratios
(5%, 10%, 20%, 50% and 100%) at
constant speed (2000 rpm)
Higher than OD at lower load and
increased with blending ratio. At
higher load, emission was lower
than OD and decreased with the
increase of blend ratio
Lower than OD and
decreased with the
increase of load and
blending ratio
Higher than OD and
increased with the
increase of load and
blending ratio
Lower than OD
and decreased
with the
increase of
blending ratio
[143]
1-Cylinder, 4S,DI, WC CR:
1:18.5 D:
1.007 L RP:
19 PS, RS:
2400 rpm
At different speeds (1000–2400 rpm) and different blends
(10%, 20%, 50% and 100%)
Reduced from 6.51 to 12.32%with the increase of blend ratio
Lower than OD anddecreased from 14.91
to 27.53% with the
increase of blend
ratio
Increased from 3.29to 10.75%
Reduced from36.91 to 86.06%
with the
increase of
blend ratio
[118]
4-Cylinder, 4S,
TC, CR:
1:18.5, D:
2609 cm3 RP:
84.5 kW, RS:
3800 rpm
Full throttle at different speed and
also optimized injection
parameters to compensate power
deterioration
Reduces by 10–40% but
optimized injection increased
emission
Always lower than
OD and maximum
reduction was 40%
for normal injection
Normally reduced by
5–10% but optimized
injection increased
emission
Always lower
than OD and
maximum
reduction was
80% for normal
injection
[119]
1-Cylinder, DI,
CR: 1:16.5 RP:
5 HP, RS:
1500 rpm
At different loads (25%, 50%, 75%
and 100%) and different blends
(20%, 40%, 50%, 60%, 800% and
100%)
Lower than OD Lower than OD Lower than OD – [120]
1-Cylinder, 4S,
WC, NA, DI,CR: 1:17.5 D:
661 cm3 RP:
7 HP, RS:
1500 rpm
Full load, different blends (5%, 10%,
15%, 20%, 25% and 100%), differentinjection pressures (180, 200, 220
and 240 bar), different injection
timings (22, 27 and 32 deg)
– Lower than OD,
Maximum at 240 bar,Minimum at 220 bar,
Maximum at 22 deg,
Minimum at 32 deg
Higher than OD,
Maximum at 240 bar,Minimum at 180 bar,
Maximum at 32 deg,
Minimum at 22 deg
– [121]
M.I. Arbab et al. / Renewable and Sustainable Energy Reviews 22 (2013) 133–147 140

8/12/2019 00009786_92172
http://slidepdf.com/reader/full/0000978692172 9/15
Table 11 represents emission characteristics of coconut bio-
diesel received from different experimental results. It shows that
coconut biodiesel reduces emission including NO x. The additional
oxygen of coconut biodiesel leads to complete combustion and
reduces CO, HC and smoke. Again lower calorific value leads tolower combustion temperature and reduce NO x. The maximum
reduction rate of CO is about 40%, HC is about 60%, smoke is about
40% and NO x is about 10%.
4.4. Cottonseed biodiesel
The emission behavior of cottonseed based biodiesel mainly
depends on engine operating conditions. Some of the experimental
results showed lower emission of CO, HC, NO x, CO2 and smoke
[24,48,94,115,132]. However, some conditions also showed higher
emissions [24,49,50,94,115].
Emission characteristics from different experimental results
using cottonseed biodiesel and its blends are represented in
Table 12. Most of the cases, use of cottonseed biodiesel reduce
CO, HC and smoke emission. Sometimes it reduces NO x emission
as lower calorific value leads to lower combustion temperature.
The maximum reduction range of CO, HC, smoke and NO x are 40%,
60%, 50% and 10%.
4.5. Sunflower biodiesel
The emissions of sunflower based biodiesel are also affected by
engine operating conditions and blend ratios. Many researcher
found lower emission characteristic [47,51,52,94,133] though
many experimental results showed higher emission of CO and
NO x [47,51,52,94,133].
Experimental results of sunflower biodiesel and its blends are
represented in Table 13. It gives an overview of emission
characteristics of sunflower biodiesel. The reduction of CO, HC
and smoke are approximately 65%, 60% and 25%, respectively.
Again a maximum of 115% increment of NO x emission was
observed.
Table 10
Different experimental engine emission results using palm biodiesel compared to OD.
Engine Test condition Emission Reference
CO HC NO x Smoke
6-Cylinder, 4S, WC, NA,
DI, CR: 1:15.9, D:
991 cm3 RP: 81 kW,
RS: 2600 rpm
Full load and constant speed
(1500 rpm)
Decreased by 86.89% Decreased by
14.29%
Increased by 22.13% Decreased by 67.65% [33]
4-Cylinder, 4S, WC, NA,
IDI, CR: 1:21.47, D:
449.77 cm3 RP:
38.8 kW, RS: 4250 rpm
Full load at different speeds
and different blends (5%, 20%,
50% and 100%)
Decreased as the
biodiesel percentage
increased
Decreased as the
biodiesel percentage
increased
Increased as the
biodiesel percentage
increased
Decreased as the
biodiesel percentage
increased
[124]
4-Cylinder, 4S, NA, IDI,
WC CR: 21.47:1 RP:
38.8 kW, RS: 4250 rpm
Different engine speeds at
full load and different blends
(10%, 30%, 40%, 60%, 80% and
100%)
Maximum about 60%
decreased with
increase of blend
ratio
About 35%
decreased with
increase of blend
ratio
About 70% increased as
blend ratio increased
10% blend gave almost
same
Maximum about 45%
decreased with increase
of blend ratio
[89]
6-Cylinder, 4S, DI, WC,
NA CR: 15.9:1 RP:
81 kW, RP: 2600 rpm
Full load at different speeds Maximum about 84%
decreased
Maximum about
22% decreased
Maximum about 20%
increased
Maximum about 70%
decreased
[45]
1-Cylinder, 4S, WC, DI,
NA CR: 16.5:1 RP:
3.5 kW, RS: 1500 rpm
Constant speed and different
percentages of EGR (0% and
15%)
30–45% reduced – 37–60% reduced – [125]
1-Cylinder, 4S, WC, DI,
CR: 1:16.3, D:
1007 cm
3
RP:11.77 kW, RS:
2200 rpm
Fixed speed (2000 rpm),
different loads (0%, 25%, 50%,
75% and 100%)
About 10–15%
reduced
About 35–46%
reduced
Slightly decreased at
full load
Maximum about 6%
reduced
[43]
1-Cylinder, 4S, WC, DI,
CR: 1:16.3, D:
1007 cm3 RP:
11.77 kW, RS:
2200 rpm
Fixed speed (2000 rpm),
different loads (0%, 25%, 50%,
75% and 100%)
Average about 15–
25% decreased
Average about 30%
decreased
Slightly reduced About 20–34% reduced [42]
1-Cylinder, 4S,DI, NA, AC
RP: 4.6 kW, RS:
3500 rpm CR: 22:1, D:
347 cm3
Different loads, speed and
blends (50% and 100%)
Lower than OD and
decreased with
increase of blend
ratio
26% lower 5% reduced 66.7% reduced [126]
1-Cylinder, 4S, DI, NA,
WC CR: 17.5:1, D:
662 cm3 RP: 5.2 kW,
RS: 1500 rpm
Constant speed (1500 rpm),
different loads and different
blends (25%, 50%, 75% and
100%)
Lower than OD and
maximum about 56%
decreased for 100%
blend
25% blend gave
about 30–40%
higher blends
reduced about 45%
25% blend showed
slight higher 100%
blend showed lower
25% blend gave about
20–30% higher. Higher
blends reduced about
30–45%
[127]
1-Cylinder, 4S, WC, DI,
NA D:1.007 L, CR:16.3
RP: 11.77 kW, RS:2200 rpm
Constant speed (2000 rpm)
and different loads (0%, 25,
50, 75 and 100%)
Almost same to OD Almost same to OD,
slight higher at
lower loads
24% decreased at higher
loads
Almost same to OD,
slight lower at higher
load
[122]
1-Cylinder, 4S, DI, WC
CR: 23.1:1 RP:
5.88 kW, RS: 2200 rpm
Constant speed (2000 rpm)
and different loads (0%, 25,
50, 75 and 100%)
Slightly higher than
OD
Almost same as OD About 15–20% lower Almost same [122]
1-Cylinder, 4 S, DI, WC D:
1007 cm3, CR: 16.3:1
RP: 11.77 kW,
RS:2200 rpm
Constant speed (2000 rpm)
and different loads
– About 10–20%
higher
Almost same as OD About 1–3% reduced [123]
M.I. Arbab et al. / Renewable and Sustainable Energy Reviews 22 (2013) 133–147 141

8/12/2019 00009786_92172
http://slidepdf.com/reader/full/0000978692172 10/15
4.6. Soybean biodiesel
The emission characteristics of soybean biodiesel depend on
engine operating condition. Though many tests showed lower
emission of CO, HC, NO x, CO2 and smoke [54,55,58,60,104], some
researchers reported higher emissions [54,55,58,60].
The emission characteristics of soybean biodiesel from
Table 14 show that use of soybean biodiesel and it blends reduce
emission of CO, HC and smoke by 40%, 25% and 74% respectively
and increase NO x emission up to 15%.
4.7. Canola or rapeseed biodiesel
Engine emission test results using canola or rapeseed based
biodiesel most of the cases give lower emission than that of
ordinary diesel [53,54,56,59,101,102,105]. However, for some
specific engine operating conditions, it also showed higher emis-
sion [53,54,56,59,101,102].
Table 15 shows different experimental results regarding emis-
sion characteristic of canola or rapeseed biodiesel and blends.
The average reduction of CO, HC and smoke emission using this
Table 11
Different experimental engine emission results using coconut biodiesel compared to OD.
Engine Test condition Emission Reference
CO HC NO x Smoke
1-Cylinder, 4S, FAC, DI,
CR: 1:19.9 D: 211 cm3
Full load, constant speed (3000 rpm) and
different fuel blends
Lower than OD and
decreased with the
increase of blend
ratio
Lower than OD and
decreased with the
increase of blend
ratio
– Lower than OD and
decreased with the
increase of blend
ratio
[130]
1-Cylinder, 4S, WC, DI,
CR: 1:17.5 D: 661 cm3
RP: 5.2 kW, RS:
1500 rpm
Different loads (15%, 30%, 45%, 60%, 75%,
90% and 100%) and different blends
(20%, 40%, 60%, 80% and 100%)
– Lower than OD and
20% blend gave the
lowest
Almost
similar to
OD
Lower than OD and
decreased with the
increase of blend
ratio
[131]
1-Cylinder, 4S, WC, DI,
CR: 1:16.3 D: 1007 cm3
RP: 11.77 kW, RS:
2200 rpm
Fixed speed (2000 rpm), different loads
(0%, 25%, 50%, 75% and 100%)
30–4 0% lo wer Ab out 40% lower Sli ghtly
lower
2–10% lower [42]
1-Cylinder, 4S, AC, DI,
NA, CR: 1:18.8 D:
367 cm3 RP: 2.8 kW,
RS: 3600 rpm
Full throttle at different speeds
(1200–3600 rpm)
15–20% less 50–60% less 10% less 20–40% less [129]
4-Cylinder, DI, CR: 1:19.5
D: 1.7 L RP: 66 kW, RS:
4200 rpm
Different speeds (1500, 2000 and
2300 rpm), different BMEP (1, 2.6, 2,
4.2 bar) and different percentages of EGR
(11–32%)
About 9% less About 10% less Almost
same
– [128]
1-Cylinder, 4S, WC, DI,CR: 1:16.3 D: 1007 cm3
RP: 11.77 kW, RS:
2200 rpm
Fixed speed (2000 rpm), different loads(0%, 25%, 50%, 75% and 100%) 30–4 0% lo wer Ab out 40% lower Sli ghtlylower 2–10% lower [43]
Table 12
Different experimental engine emission results using cottonseed biodiesel compared to OD.
Engine Test condition Emission Reference
CO HC NO x Smoke
1-Cylinder, 4S, AC,
DI, CR: 1:18 D:
406 cm3 RP: 10
HP, RS: 3600 rpm
Different speeds (1250, 1500,
1750, 2000, 2250 and 2500 rpm)
and different blends (5%, 20%,
50%, 75% and 100%)
Decreased as the blend ratio
increased, at lower speed,
more change was observed
at lower speed
– Only 5% blend gave
higher emission and it
decreased with the
increase of blend ratio
Lower blend (lower
than 50%) decreased
emission but increased
at higher blend
[24]
1-Cylinder, 4S, AC,
DI, CR: 1:18 D:
395 cm3 RP:
6.2 kW, RS:
3600 rpm
Different speeds (3100, 2800,
2500, 2200, 1900, 1600 and
1300 rpm) and 75% blend
About 3 7% reduced Ab out 60%
reduced
About 10% reduced About 50% reduced [48]
1-Cylinder, 4S, NA,
DI, CR: 1:18 D:
395 cm3 RS:
3600 rpm
Different speeds and preheated
biodiesel at different
temperatures (30, 60, 90 and
120 oC)
About 40% average reduction – Average increment about
25%
– [115]
6-Cylinder, 4S, WC,
DI, TC, CR: 1:18, D:
5958 cm3 RP:
177 kW, RS:
2600 rpm
Two different speeds (1200 and
1500 rpm), different loads (20%,
40% and 60%) and different fuel
blend
Lower, decreased with
increase of blend ratio
Higher,
increased
with increase
of blend ratio
Higher, increased with
increase of blend ratio
– [49,50,94]
1-Cylinder, 4S, WC,
DI, CR: 1:18, D:
661 cm3
Constant speed (1500 rpm) and
different loading
Decreased by 12–16% Decreased by
25–35%
– Decreased by 10–15% [132]
M.I. Arbab et al. / Renewable and Sustainable Energy Reviews 22 (2013) 133–147 142

8/12/2019 00009786_92172
http://slidepdf.com/reader/full/0000978692172 11/15
Table 13
Different experimental engine emission results using sunflower biodiesel compared to OD.
Engine Test condition Emission Reference
CO HC NO x Smoke
4-Cylinder, 4S, DI, WC
RP:55 kW, RS:
4500 rpm CR:21.5:1
Full load and va riab le speed Sl ight lower than OD Almost
same as OD
– – [135]
1-Cylinder, 4S CR:17.5:1RP: 4.4 kW RS:
1500 rpm
Constant 1500 rpm speed with differentloadings (20%, 40%, 60% and 80%) and
different blends (20%, 40%, 60%, 80% and
100%)
– About 10–15% lower
than
predicted
About 20% lower thanpredicted
– [136]
1-Cylinder, 4S, NA, AC,
DI CR: 17.5:1, D:
0.661 L RP: 4.4 kW,
RS: 1500 rpm
Constant 1500 rpm speed with different
loads
Reduced about 10–65% 20–60%
reduced
About 80–115%
increased
– [134]
4-Cylinder, 4S, TC, IDI,
CI, WC CR: 21.5:1, D:
1753 cm3 RP: 55 kW,
RS: 4500 rpm
17.5% blend is used, 1500–3000 rpm
speed range and different loads (50%,
75% and 100%)
At 50% load almost same
at higher load and lower
speed CO emission was
higher
– At 50% load almost
same to OD. At higher
load and speed 3–6%
increased
– [52]
6-Cylinder, 4S, CI, DI,
WC, TC CR: 18:1, D:
5958 cm3 RP:177 kW,
RS: 2600 rpm
Different loads (20%, 40% and 60%) and
different blends (10% and 20%)
– – About 4–10% increased
with increase of blend
ratio
About 10–25%
decreased with
increase of blend
ratio
[94]
6-Cylinder, 4S, TC CR:
15:1, D: 9.6 L RP:180 kW, RS:
2200 rpm
Full load, different speeds and different
blends (5% and 30%)
Lower than OD and
decreased as blend ratioand speed increased
– Slight increased with
increase of blend ratio
– [97]
Table 14
Different experimental engine emission results using soybean biodiesel compared to OD.
Engine Test condition Emission Reference
CO HC NO x Smoke
4-Cylinder, 4S, NA,DI, CR: 16.8:1,
D:3.14 L
RS:2400 rpm
Full load, different blends (5%, 20%,50% and 100%)
Decreased 3–39%with increasing of
blend ratio
– Increased 4.5–15.5%with increase of
blend ratio
Decreased withincreasing of blend
ratio Maximum
reduction 74%
[55]
4-Cylinder, 4S, NA,
DI, D: 3.14 L RS:
2400 rpm, RP:
46KW
Full load, different speeds and
different injection pressures
Lower than OD and
with increasing speed
and injection
pressure it reduced
– Higher than OD and
with increasing speed
and injection
pressure increased
Lower than OD and
with increasing speed
and injection pressure
it reduced
[54]
1-Cylinder, NA,
4S,WC, DI, CR:
16.5:1, D: 0.996 L
RP:11.03 kW,
RS:2000 rpm
At full load and different engine
speed
Average 40% reduced Average 25% reduced Average 5% reduced Average 50% reduced [104]
1-Cylinder, NA, 4S,
AC, DI D: 0.211 L
RP: 2.0KW,
RS:3600 rpm
85% of full load, different blends
(20%, 50%, 75% and 100%)
Lower than OD and
50% blend gave the
lowest
Lower than OD and
decreases with
increase of blend
ratio
Lower than OD and
decreases with
increase of blend
ratio
– [58]
4-Cylinder, D:
3922 cm3 RS:
2400 rpm, RP:
46 kW
Different loads and different blends
(5%, 20%, 35%, 50% and 85%)
Lower than OD and
reduced with increase
of blend ratio
50% blend gave the
lowest and lower
than OD, increased
for other blends
– – [60]
1-Cylinder, NA, 4 S,
CR: 17:1 D: 1.84 L
Different loads and different blends
(20%, 50% and 100%)
Lower than OD and
reduced with increase
of power
– 7–9% higher than OD
and increase with
increase of blend
ration and load
Lower than OD and
reduction rate
increased with increase
of blend ratio and load
[137]
2-Cylinder, DI, CR:
18:1, D: 1272 cm3
RS:3000 rpm
Different speeds and different
blends (25%, 50%, 75% and 100%)
– – – Decreased with
increasing of blend
ratio
[138]
6-Cylinder, 4 S, DI
CR: 17.3:1 D: 2.7 L
Different percentages of EGR (38%,
43%, 49% and 54%) and different
injection timings (4 to þ4 ATDC)
– – Decreased with
increase of EGR and
retard of IT
– [139]
4-Cylinder, DI, CR:
1:19.5, D: 1.7 L RP:
66 kW, RS:
4200 rpm
Different speeds (1500, 2000 and
2300 rpm), different BMEP (1, 2.6,
2, 4.2 bar) and different
percentages of EGR (11–32%)
Slightly higher and
increased with blend
ratio
– Slightly lower for 5%
blend About 10%
increased for 20%
blend
– [128]
M.I. Arbab et al. / Renewable and Sustainable Energy Reviews 22 (2013) 133–147 143
8/12/2019 00009786_92172
http://slidepdf.com/reader/full/0000978692172 12/15
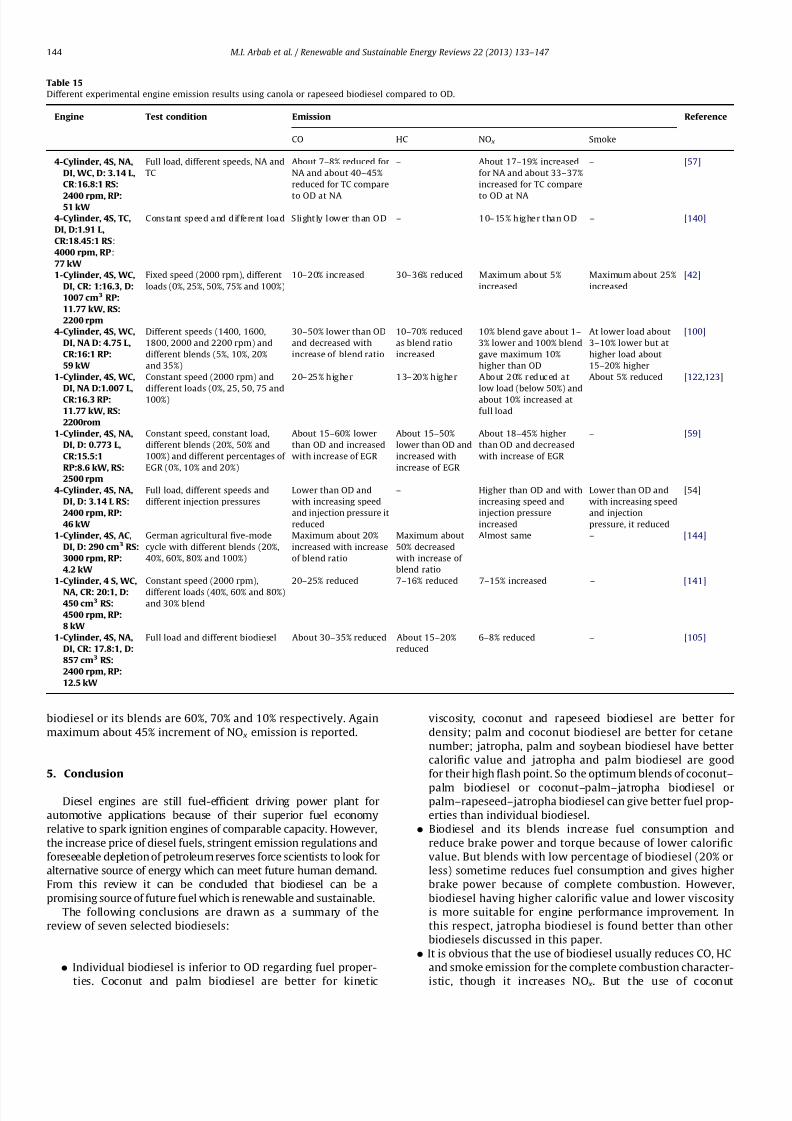
biodiesel or its blends are 60%, 70% and 10% respectively. Again
maximum about 45% increment of NO x emission is reported.
5. Conclusion
Diesel engines are still fuel-efficient driving power plant for
automotive applications because of their superior fuel economy
relative to spark ignition engines of comparable capacity. However,
the increase price of diesel fuels, stringent emission regulations and
foreseeable depletion of petroleum reserves force scientists to look for
alternative source of energy which can meet future human demand.
From this review it can be concluded that biodiesel can be a
promising source of future fuel which is renewable and sustainable.
The following conclusions are drawn as a summary of the
review of seven selected biodiesels:
Individual biodiesel is inferior to OD regarding fuel proper-
ties. Coconut and palm biodiesel are better for kinetic
viscosity, coconut and rapeseed biodiesel are better for
density; palm and coconut biodiesel are better for cetane
number; jatropha, palm and soybean biodiesel have better
calorific value and jatropha and palm biodiesel are good
for their high flash point. So the optimum blends of coconut–
palm biodiesel or coconut–palm–jatropha biodiesel orpalm–rapeseed–jatropha biodiesel can give better fuel prop-
erties than individual biodiesel.
Biodiesel and its blends increase fuel consumption and
reduce brake power and torque because of lower calorific
value. But blends with low percentage of biodiesel (20% or
less) sometime reduces fuel consumption and gives higher
brake power because of complete combustion. However,
biodiesel having higher calorific value and lower viscosity
is more suitable for engine performance improvement. In
this respect, jatropha biodiesel is found better than other
biodiesels discussed in this paper.
It is obvious that the use of biodiesel usually reduces CO, HC
and smoke emission for the complete combustion character-
istic, though it increases NO x. But the use of coconut
Table 15
Different experimental engine emission results using canola or rapeseed biodiesel compared to OD.
Engine Test condition Emission Reference
CO HC NO x Smoke
4-Cylinder, 4S, NA,
DI, WC, D: 3.14 L,
CR :16.8:1 RS:
2400 rpm, RP:51 kW
Full load, different speeds, NA and
TC
About 7–8% reduced for
NA and about 40–45%
reduced for TC compare
to OD at NA
– About 17–19% increased
for NA and about 33–37%
increased for TC compare
to OD at NA
– [57]
4-Cylinder, 4S, TC,
DI, D:1.91 L,
CR:18.45:1 RS:
4000 rpm, RP:
77 kW
C ons tant sp eed and d if ferent load Slight ly lower th an OD – 1 0– 15 % h igher t han OD – [140]
1-Cylinder, 4S, WC,
DI, CR: 1:16.3, D:
1007 cm3 RP:
11.77 kW, RS:
2200 rpm
Fixed speed (2000 rpm), different
loads (0%, 25%, 50%, 75% and 100%)
10–20% increased 30–36% reduced Maximum about 5%
increased
Maximum about 25%
increased
[42]
4-Cylinder, 4S, WC,
DI, NA D: 4.75 L,
CR:16:1 RP:
59 kW
Different speeds (1400, 1600,
1800, 2000 and 2200 rpm) and
different blends (5%, 10%, 20%
and 35%)
30–50% lower than OD
and decreased with
increase of blend ratio
10–70% reduced
as blend ratio
increased
10% blend gave about 1–
3% lower and 100% blend
gave maximum 10%
higher than OD
At lower load about
3–10% lower but at
higher load about
15–20% higher
[100]
1-Cylinder, 4S, WC,
DI, NA D:1.007 L,CR:16.3 RP:
11.77 kW, RS:
2200rom
Constant speed (2000 rpm) and
different loads (0%, 25, 50, 75 and100%)
2 0– 25 % h igher 1 3– 20 % h igher About 2 0% r ed uced at
low load (below 50%) andabout 10% increased at
full load
About 5% reduced [122,123]
1-Cylinder, 4S, NA,
DI, D: 0.773 L,
CR:15.5:1
RP:8.6 kW, RS:
2500 rpm
Constant speed, constant load,
different blends (20%, 50% and
100%) and different percentages of
EGR (0%, 10% and 20%)
About 15–60% lower
than OD and increased
with increase of EGR
About 15–50%
lower than OD and
increased with
increase of EGR
About 18–45% higher
than OD and decreased
with increase of EGR
– [59]
4-Cylinder, 4S, NA,
DI, D: 3.14 L RS:
2400 rpm, RP:
46 kW
Full load, different speeds and
different injection pressures
Lower than OD and
with increasing speed
and injection pressure it
reduced
– Higher than OD and with
increasing speed and
injection pressure
increased
Lower than OD and
with increasing speed
and injection
pressure, it reduced
[54]
1-Cylinder, 4S, AC,
DI, D: 290 cm3 RS:
3000 rpm, RP:
4.2 kW
German agricultural five-mode
cycle with different blends (20%,
40%, 60%, 80% and 100%)
Maximum about 20%
increased with increase
of blend ratio
Maximum about
50% decreased
with increase of
blend ratio
Almost same – [144]
1-Cylinder, 4 S, WC,
NA, CR: 20:1, D:450 cm3 RS:
4500 rpm, RP:
8 kW
Constant speed (2000 rpm),
different loads (40%, 60% and 80%)and 30% blend
20–25% reduced 7–16% reduced 7–15% increased – [141]
1-Cylinder, 4S, NA,
DI, CR: 17.8:1, D:
857 cm3 RS:
2400 rpm, RP:
12.5 kW
Full load and different biodiesel About 30–35% reduced About 15–20%
reduced
6–8% reduced – [105]
M.I. Arbab et al. / Renewable and Sustainable Energy Reviews 22 (2013) 133–147 144
8/12/2019 00009786_92172
http://slidepdf.com/reader/full/0000978692172 13/15
biodiesel reduces emission including NO x. Thus, with respect
to engine emission, coconut biodiesel is better than any
other biodiesels discussed in this paper.
Single biodiesel cannot improve both engine performance
and emission at a time. But blend of two or more biodiesels
may be able to achieve this goal. In this respect, a blend of
jatropha and coconut biodiesel may be a good option. The
best suited biodiesels’ blend and the optimum blend ratio
are the scope of further research.
Acknowledgment
The authors would like to appreciate University of Malaya for
financial support through High Impact Research grant titled:
‘‘Clean Diesel Technology for Military and Civilian Transport
Vehicles’’ having grant number UM.C/HIR/MOHE/ENG/07.
References
[1] Basha SA, Gopal KR, Jebaraj S. A review on biodiesel production, combus-tion, emissions and performance. Renewable and Sustainable Energy
Reviews 2009;13:1628–34.[2] Wu F, Wang J, Chen W, Shuai S. A study on emission performance of a diesel
engine fueled with five typical methyl ester biodiesels. AtmosphericEnvironment 2009;43:1481–5.
[3] McCarthy P, Rasul MG, Moazzem S. Analysis and comparison of perfor-mance and emissions of an internal combustion engine fuelled withpetroleum diesel and different bio-diesels. Fuel 2011;90:2147–57.
[4] Demirbas A. Progress and recent trends in biodiesel fuels. Energy Conver-sion and Management 2009;50:14–34.
[5] Murugesan A, Umarani C, Subramanian R, Nedunchezhian N. Bio-diesel asan alternative fuel for diesel engines—a review. Renewable and SustainableEnergy Reviews 2009;13:653–62.
[6] Babu A, Devaradjane G. Vegetable oils and their derivatives as fuels for CIengines: an overview. SAE technical paper 2003:2003–01-0767.
[7] Shay EG. Diesel fuel from vegetable oils: status and opportunities. Biomassand Bioenergy 1993;4:227–42.
[8] Murugesan A, Umarani C, Chinnusamy TR, Krishnan M, Subramanian R,Neduzchezhain N. Production and analysis of bio-diesel from non-edibleoils—a review. Renewable and Sustainable Energy Reviews 2009;13:
825–34.[9] Meher LC, Vidya Sagar D, Naik SN. Technical aspects of biodiesel production by
transesterification—a review. Renewable and Sustainable Energy Reviews2006;10:248–68.
[10] Ghanei R, Moradi GR, TaherpourKalantari R, Arjmandzadeh E. Variation of physical properties during transesterification of sunflower oil to biodieselas an approach to predict reaction progress. Fuel Processing Technology2011;92:1593–8.
[11] Jayed MH, Masjuki HH, Kalam MA, Mahlia TMI, Husnawan M, Liaquat AM.Prospects of dedicated biodiesel engine vehicles in Malaysia and Indonesia.Renewable and Sustainable Energy Reviews 2011;15:220–35.
[12] Canakci M, Erdil A, Arcaklioglu E. Performance and exhaust emissions of abiodiesel engine. Applied Energy 2006;83:594–605.
[13] Demirbas A. Political, economic and environmental impacts of biofuels: areview. Applied Energy 2009;86(1):S108–17.
[14] Agarwal AK, Gupta T, Kothari A. Particulate emissions from biodiesel vsdiesel fuelled compression ignition engine. Renewable and SustainableEnergy Reviews 2011;15:3278–300.
[15] Varatharajan K, Cheralathan M. Influence of fuel properties and composi-tion on NO x emissions from biodiesel powered diesel engines: a review.Renewable and Sustainable Energy Reviews 2012;16:3702–10.
[16] M.S.d.P. Gomes, Muylaert de Arau jo MS. Bio-fuels production and theenvironmental indicators. Renewable and Sustainable Energy Reviews2009;13:2201–4.
[17] Jayasinghe P, Hawboldt K. A review of bio-oils from waste biomass: focuson fish processing waste. Renewable and Sustainable Energy Reviews2012;16:798–821.
[18] Singh SP, Singh D. Biodiesel production through the use of different sourcesand characterization of oils and their esters as the substitute of diesel: areview. Renewable and Sustainable Energy Reviews 2010;14:200–16.
[19] Jin C, Yao M, Liu H, Lee C-fF J. Progress in the production and application of n-butanol as a biofuel. Renewable and Sustainable Energy Reviews2011;15:4080–106.
[20] Bora DK, Baruah DC. Assessment of tree seed oil biodiesel: a comparativereview based on biodiesel of a locally available tree seed. Renewable andSustainable Energy Reviews 2012;16:1616–29.
[21] Sharma S, Rangaiah GP. Multi-objective optimization of a bio-diesel
production process. Fuel 2013:269–77.
[22] Narayanan D, Zhang Y, Mannan MS. Engineering for sustainable develop-ment (ESD) in bio-diesel production. Process Safety and EnvironmentalProtection 2007;85:349–59.
[23] Rakopoulos CD, Dimaratos AM, Giakoumis EG, Rakopoulos DC. Study of turbocharged diesel engine operation, pollutant emissions and combustionnoise radiation during starting with bio-diesel or n-butanol diesel fuelblends. Applied Energy 2011;88:3905–16.
[24] Aydin H, Bayindir H. Performance and emission analysis of cottonseed oilmethyl ester in a diesel engine. Renewable Energy 2010;35:588–92.
[25] Carraretto C, Macor A, Mirandola A, Stoppato A, Tonon S. Biodiesel asalternative fuel: experimental analysis and energetic evaluations. Energy
2004;29:2195–211.[26] Cetinkaya M, Ulusoy Y, Tekin Y, Karaosmanoglu F. Engine and winter road
test performances of used cooking oil originated biodiesel. Energy Conver-sion and Management 2005;46:1279–91.
[27] Choi S-H, Oh Y. The emission effects by the use of biodiesel fuel. Interna-tional Journal of Modern Physics B. 2006;20:4481–6.
[28] Hansen AC, Gratton MR, Yuan W. Diesel engine performance and NO x
emissions from oxygenated biofuels and blends with diesel fuel. Transac-tions of the Asabe 2006;49:589–95.
[29] Hazar H. Effects of biodiesel on a low heat loss diesel engine. RenewableEnergy 2009;34:1533–7.
[30] Kaplan C, Arslan R, Surmen A. Performance characteristics of sunflowermethyl esters as biodiesel. Energy Sources Part a-Recovery Utilization andEnvironmental Effects 2006;28:751–5.
[31] Lin Y-C, Lee W-J, Wu T-S, Wang C-T. Comparison of PAH and regulatedharmful matter emissions from biodiesel blends and paraffinic fuel blendson engine accumulated mileage test. Fuel 2006;85:2516–23.
[32] Murillo S, Miguez JL, Porteiro J, Granada E, Moran JC. Performance and
exhaust emissions in the use of biodiesel in outboard diesel engines. Fuel2007;86:1765–71.[33] Ozsezen AN, Canakci M, Turkcan A, Sayin C. Performance and combustion
characteristics of a DI diesel engine fueled with waste palm oil and canolaoil methyl esters. Fuel 2009;88:629–36.
[34] Raheman H, Phadatare AG. Diesel engine emissions and performance fromblends of karanja methyl ester and diesel. Biomass & Bioenergy 2004;27:393–7.
[35] Reyes JF, Sepulveda MA. PM-10 emissions and power of a diesel enginefueled with crude and refined biodiesel from salmon oil. Fuel 2006;85:1714–9.
[36] Ulusoy Y, Tekin Y, Cetinkaya M, Karaosmanoglu F. The engine tests of biodiesel from used frying oil. Energy Sources 2004;26:927–32.
[37] Utlu Z, Kocak MS. The effect of biodiesel fuel obtained from waste frying oilon direct injection diesel engine performance and exhaust emissions.Renewable Energy 2008;33:1936–41.
[38] Chauhan BS, Kumar N, Du Jun Y, Lee KB. Performance and emission study of preheated Jatropha oil on medium capacity diesel engine. Energy2010;35:2484–92.
[39] de Almeida SCA, Belchior CR, Nascimento MVG, LdSR Vieira, Fleury G.Performance of a diesel generator fuelled with palm oil. Fuel 2002;81:2097–102.
[40] Huang J, Wang Y, Qin J-b, Roskilly AP. Comparative study of performanceand emissions of a diesel engine using Chinese pistache and jatrophabiodiesel. Fuel Processing Technology 2010;91:1761–7.
[41] Kalam MA, Husnawan M, Masjuki HH. Exhaust emission and combustionevaluation of coconut oil-powered indirect injection diesel engine. Renew-able Energy 2003;28:2405–15.
[42] Kinoshita E, Myo T, Hamasaki K, Nishi S. Combustion characteristics of diesel engine with coconut oil ethyl ester. SAE technical paper 2007:2007–01-2021.
[43] Kinoshita E, Myo T, Hamasaki K, Tajima H, Kun ZR. Diesel combustioncharacteristics of coconut oil and palm oil biodiesels. SAE technical paper;2006-01-3251.
[44] Ndayishimiye P, Tazerout M. Use of palm oil-based biofuel in the internalcombustion engines: performance and emissions characteristics. Energy2011;36:1790–6.
[45] Ozsezen AN, Canakci M. Determination of performance and combustioncharacteristics of a diesel engine fueled with canola and waste palm oilmethyl esters. Energy Conversion and Management 2011;52:108–16.
[46] Sundaresan M., Chandrasekaran S., Porai P.T. Analysis of combustion,performance and emission characteristics of blends of methyl esters of
jatropha oi l (MEJ) in DI diesel engine. SAE technical paper, 32-0066; 2007.[47] Canakci M, Ozsezen AN, Turkcan A. Combustion analysis of preheated crude
sunflower oil in an IDI diesel engine. Biomass and Bioenergy 2009;33:760–7.
[48] _Ilkılıc- C, Aydın H. Determination of performance and exhaust emissionsproperties of B75 in a CI engine application. Fuel Processing Technology2011;92:1790–5.
[49] Rakopoulos CD, Rakopoulos DC, Hountalas DT, Giakoumis EG, AndritsakisEC. Performance and emissions of bus engine using blends of diesel fuelwith bio-diesel of sunflower or cottonseed oils derived from Greek feed-stock. Fuel 2008;87:147–57.
[50] Rakopoulos DC, Rakopoulos CD, Giakoumis EG, Dimaratos AM, Founti MA.Comparative environmental behavior of bus engine operating on blends of diesel fuel with four straight vegetable oils of Greek origin: sunflower,
cottonseed, corn and olive. Fuel 2011;90:3439–46.
M.I. Arbab et al. / Renewable and Sustainable Energy Reviews 22 (2013) 133–147 145

8/12/2019 00009786_92172
http://slidepdf.com/reader/full/0000978692172 14/15
[51] Shehata MS, Razek SMA. Experimental investigation of diesel engineperformance and emission characteristics using jojoba/diesel blend andsunflower oil. Fuel 2011;90:886–97.
[52] Usta N, Ozturk E, Can O, Conkur ES, Nas S, C- on AH, et al. Combustion of biodiesel fuel produced from hazelnut soapstock/waste sunflower oilmixture in a diesel engine. Energy Conversion and Management 2005;46:741–55.
[53] Buyukkaya E. Effects of biodiesel on a DI diesel engine performance,emission and combustion characteristics. Fuel 2010;89:3099–105.
[54] C- elikten _I, Koca A, Ali Arslan M. Comparison of performance and emissionsof diesel fuel, rapeseed and soybean oil methyl esters injected at different
pressures. Renewable Energy 2010;35:814–20.[55] Gokalp B, Buyukkaya E, Soyhan HS. Performance and emissions of a diesel
tractor engine fueled with marine diesel and soybean methyl ester. Biomassand Bioenergy 2011;35:3575–83.
[56] Hazar H, Aydin H. Performance and emission evaluation of a CI enginefueled with preheated raw rapeseed oil (RRO)–diesel blends. AppliedEnergy 2010;87:786–90.
[57] Karabektas M. The effects of turbocharger on the performance and exhaustemissions of a diesel engine fuelled with biodiesel. Renewable Energy2009;34:989–93.
[58] Pereira RG, Oliveira CD, Oliveira JL, Oliveira PCP, Fellows CE, Piamba OE.Exhaust emissions and electric energy generation in a stationary engineusing blends of diesel and soybean biodiesel. Renewable Energy2007;32:2453–60.
[59] Tsolakis A, Megaritis A, Wyszynski ML, Theinnoi K. Engine performance andemissions of a diesel engine operating on diesel-RME (rapeseed methylester) blends with EGR (exhaust gas recirculation). Energy 2007;32:2072–80.
[60] Valente OS, da Silva MJ, Pasa VMD, Belchior CRP, Sodre JR. Fuel consumptionand emissions from a diesel power generator fuelled with castor oil andsoybean biodiesel. Fuel 2010;89:3637–42.
[61] Al-Widyan MI, Tashtoush G, Abu-Qudais M. Utilization of ethyl ester of waste vegetable oils as fuel in diesel engines. Fuel Processing Technology2002;76:91–103.
[62] Keskin A, Guerue M, Altiparmak D. Influence of tall oil biodiesel with Mgand Mo based fuel additives on diesel engine performance and emission.Bioresource Technology 2008;99:6434–8.
[63] Kim H, Choi B. The effect of biodiesel and bioethanol blended diesel fuel onnanoparticles and exhaust emissions from CRDI diesel engine. RenewableEnergy 2010;35:157–63.
[64] Song JT, Zhang CH. An experimental study on the performance and exhaustemissions of a diesel engine fuelled with soybean oil methyl ester.Proceedings of the Institution of Mechanical Engineers Part D-Journal of Automobile Engineering 2008;222:2487–96.
[65] Usta N. Use of tobacco seed oil methyl ester in a turbocharged indirectinjection diesel engine. Biomass & Bioenergy 2005;28:77–86.
[66] Usta N. An experimental study on performance and exhaust emissions of a
diesel engine fuelled with tobacco seed oil methyl ester. Energy Conversionand Management 2005;46:2373–86.
[67] Armas O, Yehliu K, Boehman AL. Effect of alternative fuels on exhaustemissions during diesel engine operation with matched combustion phas-ing. Fuel 2010;89:438–56.
[68] Baiju B, Nalik MK, Das LM. A comparative evaluation of compressionignition engine characteristics using methyl and ethyl esters of Karanjaoil. Renewable Energy 2009;34:1616–21.
[69] Cheung CS, Zhu L, Huang Z. Regulated and unregulated emissions from adiesel engine fueled with biodiesel and biodiesel blended with methanol.Atmospheric Environment 2009;43:4865–72.
[70] Dorado MP, Ballesteros E, Arnal JM, Gomez J, Lopez FJ. Exhaust emissionsfrom a Diesel engine fueled with transesterified waste olive oil. Fuel2003;82:1311–5.
[71] Nascimento MAR, Lora ES, Correa PSP, Andrade RV, Rendon MA, VenturiniOJ, et al. Biodiesel fuel in diesel micro-turbine engines: modelling andexperimental evaluation. Energy 2008;33:233–40.
[72] Puhan S, Vedaraman N, Ram BVB, Sankarnarayanan G, Jeychandran K.Mah ua oil (Madhuca indica seed oil) methyl ester as biodiesel-
preparation and emission characterstics. Biomass & Bioenergy 2005;28:87–93.
[73] Sahoo PK, Das LM, Babu MKG, Naik SN. Biodiesel development from highacid value polanga seed oil and performance evaluation in a CI engine. Fuel2007;86:448–54.
[74] Sharma D, Soni SL, Mathur J. Emission reduction in a direct injection dieselengine fueled by neem-diesel blend. Energy Sources Part a-RecoveryUtilization and Environmental Effects 2009;31:500–8.
[75] Alptekin E, Canakci M. Determination of the density and the viscosities of biodiesel–diesel fuel blends. Renewable Energy 2008;33:2623–30.
[76] Alptekin E, Canakci M. Characterization of the key fuel properties of methylester–diesel fuel blends. Fuel 2009;88:75–80.
[77] Benjumea P, Agudelo J, Agudelo A. Basic properties of palm oil biodiesel–diesel blends. Fuel 2008;87:2069–75.
[78] Jain S, Sharma MP. Oxidation stability of blends of Jatropha biodiesel withdiesel. Fuel 2011;90:3014–20.
[79] Kim SY, Lee B. A prediction model for the flash point of binary liquidmixtures. Journal of Loss Prevention in the Process Industries 2010;23:
166–9.
[80] Nakpong P, Wootthikanokkhan S. High free fatty acid coconut oil as apotential feedstock for biodiesel production in Thailand. Renewable Energy2010;35:1682–7.
[81] Kumar D, Kumar G, Poonam CP. Fast, easy ethanolysis of coconut oil forbiodiesel production assisted by ultrasonication. Ultrasonics Sonochemistry2010;17:555–9.
[82] Crabbe E, Nolasco-Hipolito C, Kobayashi G, Sonomoto K, Ishizaki A.Biodiesel production from crude palm oil and evaluation of butanolextraction and fuel properties. Process Biochemistry 2001;37:65–71.
[83] Agarwal D, Agarwal AK. Performance and emissions characteristics of Jatropha oil (preheated and blends) in a direct injection compression
ignition engine. Applied Thermal Engineering 2007;27:2314–23.[84] Manieniyan V, Sivaprakasam S. Investigation of diesel engine using bio-
diesel (methyl ester of jatropha oil) for various injection timing andinjection pressure. SAE technical paper; 2008-01-1577.
[85] Narayana Reddy J, Ramesh A. Parametric studies for improving theperformance of a Jatropha oil-fuelled compression ignition engine. Renew-able Energy 2006;31:1994–2016.
[86] Pandey VC, Singh K, Singh JS, Kumar A, Singh B, Singh RP. Jatropha curcas: apotential biofuel plant for sustainable environmental development. Renew-able and Sustainable Energy Reviews 2012;16:2870–83.
[87] Rodrıguez RP, Perez LG, Alfonso M, Duarte M, Caro R, Galle J, et al.Characterization of Jatropha curcas oils and their derived fatty acid ethylesters obtained from two different plantations in Cuba. Biomass andBioenergy 2011;35:4092–8.
[88] Sahoo PK, Das LM, Babu MKG, Arora P, Singh VP, Kumar NR, et al.Comparative evaluation of performance and emission characteristics of
jatropha, karanja and polanga based biodiesel as fuel in a tractor engine.Fuel 2009;88:1698–707.
[89] Canakci M, Ozsezen AN, Arcaklioglu E, Erdil A. Prediction of performance andexhaust emissions of a diesel engine fueled with biodiesel produced fromwaste frying palm oil. Expert Systems with Applications 2009;36:9268–80.
[90] Chen K-S, Lin Y-C, Hsieh L-T, Lin L-F, Wu C-C. Saving energy and reducingpollution by use of emulsified palm-biodiesel blends with bio-solutionadditive. Energy 2010;35:2043–8.
[91] Yusaf TF, Yousif BF, Elawad MM. Crude palm oil fuel for diesel-engines:experimental and ANN simulation approaches. Energy 2011;36:4871–8.
[92] Machacon HTC, Shiga S, Karasawa T, Nakamura H. Performance andemission characteristics of a diesel engine fueled with coconut oil–dieselfuel blend. Biomass and Bioenergy 2001;20:63–9.
[93] Nabi MN, Rahman MM, Akhter MS. Biodiesel from cotton seed oil and itseffect on engine performance and exhaust emissions. Applied ThermalEngineering 2009;29:2265–70.
[94] Rakopoulos DC. Heat release analysis of combustion in heavy-duty turbo-charged diesel engine operating on blends of diesel fuel with cottonseed orsunflower oils and their bio-diesel. Fuel 2012;96:524–34.
[95] Rashid U, Anwar F, Knothe G. Evaluation of biodiesel obtained fromcottonseed oil. Fuel Processing Technology 2009;90:1157–63.
[96] Tang H, Salley SO, Simon KY. Fuel properties and precipitate formation atlow temperature in soy-, cottonseed-, and poultry fat-based biodieselblends. Fuel 2008;87:3006–17.
[97] Neto da Silva F, Salgado Prata A, Rocha Teixeira J. Technical feasibilityassessment of oleic sunflower methyl ester utilisation in diesel bus engines.Energy Conversion and Management 2003;44:2857–78.
[98] Bueno AV, Velasquez JA, Milanez LF. Heat release and engine performanceeffects of soybean oil ethyl ester blending into diesel fuel. Energy2011;36:3907–16.
[99] Labeckas G, Slavinskas S. Performance of direct-injection off-road dieselengine on rapeseed oil. Renewable Energy 2006;31:849–63.
[100] Labeckas G, Slavinskas S. The effect of rapeseed oil methyl ester on directinjection diesel engine performance and exhaust emissions. Energy Con-version and Management 2006;47:1954–67.
[101] Labecki L, Cairns A, Xia J, Megaritis A, Zhao H, Ganippa LC. Combustion andemission of rapeseed oil blends in diesel engine. Applied Energy2012;95:139–46.
[102] Labecki L, Ganippa LC. Effects of injection parameters and EGR on combus-tion and emission characteristics of rapeseed oil and its blends in diesel
engines. Fuel 2012;98:15–28.[103] Lin B-F, Huang J-H, Huang D-Y. Experimental study of the effects of
vegetable oil methyl ester on DI diesel engine performance characteristicsand pollutant emissions. Fuel 2009;88:1779–85.
[104] Qi DH, Geng LM, Chen H, Bian YZ, Liu J, Ren XC. Combustion andperformance evaluation of a diesel engine fueled with biodiesel producedfrom soybean crude oil. Renewable Energy 2009;34:2706–13.
[105] Zheng M, Mulenga MC, Reader GT, Wang M, Ting DSK, Tjong J. Biodieselengine performance and emissions in low temperature combustion. Fuel2008;87:714–22.
[106] Mofijur M, Masjuki HH, Kalam MA, Hazrat MA, Liaquat AM, Shahabuddin M,et al. Prospects of biodiesel from Jatropha in Malaysia. Renewable andSustainable Energy Reviews 2012;16:5007–20.
[107] Shahabuddin M, Kalam MA, Masjuki HH, Bhuiya MMK, Mofijur M. Anexperimental investigation into biodiesel stability by means of oxidationand property determination. Energy 2012;44:616–22.
[108] Jayed MH, Masjuki HH, Saidur R, Kalam MA, Jahirul MI. Environmentalaspects and challenges of oilseed produced biodiesel in Southeast Asia.
Renewable and Sustainable Energy Reviews 2009;13:2452–62.
M.I. Arbab et al. / Renewable and Sustainable Energy Reviews 22 (2013) 133–147 146
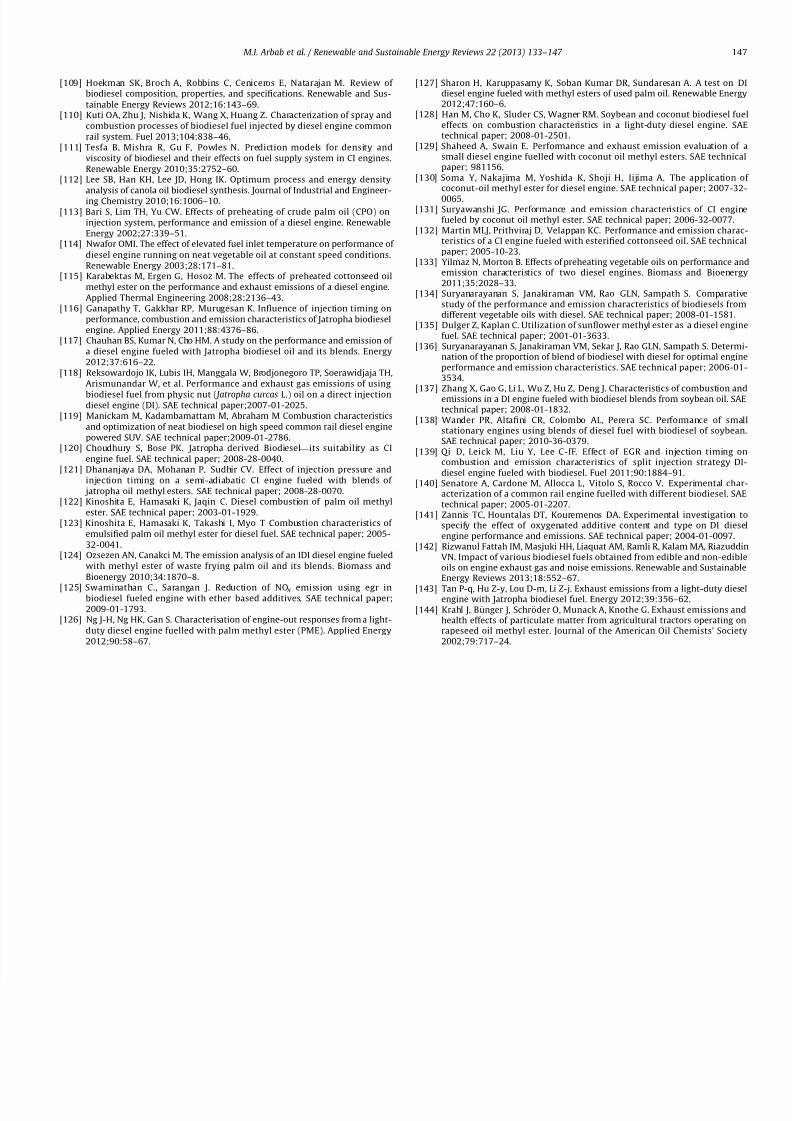
8/12/2019 00009786_92172
http://slidepdf.com/reader/full/0000978692172 15/15
[109] Hoekman SK, Broch A, Robbins C, Ceniceros E, Natarajan M. Review of biodiesel composition, properties, and specifications. Renewable and Sus-
tainable Energy Reviews 2012;16:143–69.[110] Kuti OA, Zhu J, Nishida K, Wang X, Huang Z. Characterization of spray and
combustion processes of biodiesel fuel injected by diesel engine commonrail system. Fuel 2013;104:838–46.
[111] Tesfa B, Mishra R, Gu F, Powles N. Prediction models for density andviscosity of biodiesel and their effects on fuel supply system in CI engines.Renewable Energy 2010;35:2752–60.
[112] Lee SB, Han KH, Lee JD, Hong IK. Optimum process and energy densityanalysis of canola oil biodiesel synthesis. Journal of Industrial and Engineer-ing Chemistry 2010;16:1006–10.
[113] Bari S, Lim TH, Yu CW. Effects of preheating of crude palm oil (CPO) oninjection system, performance and emission of a diesel engine. RenewableEnergy 2002;27:339–51.
[114] Nwafor OMI. The effect of elevated fuel inlet temperature on performance of
diesel engine running on neat vegetable oil at constant speed conditions.Renewable Energy 2003;28:171–81.
[115] Karabektas M, Ergen G, Hosoz M. The effects of preheated cottonseed oilmethyl ester on the performance and exhaust emissions of a diesel engine.Applied Thermal Engineering 2008;28:2136–43.
[116] Ganapathy T, Gakkhar RP, Murugesan K. Influence of injection timing onperformance, combustion and emission characteristics of Jatropha biodieselengine. Applied Energy 2011;88:4376–86.
[117] Chauhan BS, Kumar N, Cho HM. A study on the performance and emission of a diesel engine fueled with Jatropha biodiesel oil and its blends. Energy2012;37:616–22.
[118] Reksowardojo IK, Lubis IH, Manggala W, Brodjonegoro TP, Soerawidjaja TH,Arismunandar W, et al. Performance and exhaust gas emissions of using
biodiesel fuel from physic nut ( Jatropha curcas L.) oil on a direct injectiondiesel engine (DI). SAE technical paper;2007-01-2025.
[119] Manickam M, Kadambamattam M, Abraham M Combustion characteristicsand optimization of neat biodiesel on high speed common rail diesel enginepowered SUV. SAE technical paper;2009-01-2786.
[120] Choudhury S, Bose PK. Jatropha derived Biodiesel—its suitability as CIengine fuel. SAE technical paper; 2008-28-0040.
[121] Dhananjaya DA, Mohanan P, Sudhir CV. Effect of injection pressure andinjection timing on a semi-adiabatic CI engine fueled with blends of
jatropha oil methyl esters. SAE technical paper; 2008-28-0070.[122] Kinoshita E, Hamasaki K, Jaqin C. Diesel combustion of palm oil methyl
ester. SAE technical paper; 2003-01-1929.[123] Kinoshita E, Hamasaki K, Takashi I, Myo T Combustion characteristics of
emulsified palm oil methyl ester for diesel fuel. SAE technical paper; 2005-32-0041.
[124] Ozsezen AN, Canakci M. The emission analysis of an IDI diesel engine fueledwith methyl ester of waste frying palm oil and its blends. Biomass and
Bioenergy 2010;34:1870–8.
[125] Swaminathan C., Sarangan J. Reduction of NO x emission using egr inbiodiesel fueled engine with ether based additives. SAE technical paper;2009-01-1793.
[126] Ng J-H, Ng HK, Gan S. Characterisation of engine-out responses from a light-
duty diesel engine fuelled with palm methyl ester (PME). Applied Energy2012;90:58–67.
[127] Sharon H, Karuppasamy K, Soban Kumar DR, Sundaresan A. A test on DIdiesel engine fueled with methyl esters of used palm oil. Renewable Energy2012;47:160–6.
[128] Han M, Cho K, Sluder CS, Wagner RM. Soybean and coconut biodiesel fueleffects on combustion characteristics in a light-duty diesel engine. SAEtechnical paper; 2008-01-2501.
[129] Shaheed A, Swain E. Performance and exhaust emission evaluation of asmall diesel engine fuelled with coconut oil methyl esters. SAE technicalpaper; 981156.
[130] Soma Y, Nakajima M, Yoshida K, Shoji H, Iijima A. The application of coconut-oil methyl ester for diesel engine. SAE technical paper; 2007-32-
0065.[131] Suryawanshi JG. Performance and emission characteristics of CI engine
fueled by coconut oil methyl ester. SAE technical paper; 2006-32-0077.[132] Martin MLJ, Prithviraj D, Velappan KC. Performance and emission charac-
teristics of a CI engine fueled with esterified cottonseed oil. SAE technicalpaper; 2005-10-23.
[133] Yilmaz N, Morton B. Effects of preheating vegetable oils on performance andemission characteristics of two diesel engines. Biomass and Bioenergy2011;35:2028–33.
[134] Suryanarayanan S, Janakiraman VM, Rao GLN, Sampath S. Comparativestudy of the performance and emission characteristics of biodiesels fromdifferent vegetable oils with diesel. SAE technical paper; 2008-01-1581.
[135] Dulger Z, Kaplan C. Utilization of sunflower methyl ester as a diesel enginefuel. SAE technical paper; 2001-01-3633.
[136] Suryanarayanan S, Janakiraman VM, Sekar J, Rao GLN, Sampath S. Determi-nation of the proportion of blend of biodiesel with diesel for optimal engineperformance and emission characteristics. SAE technical paper; 2006-01-3534.
[137] Zhang X, Gao G, Li L, Wu Z, Hu Z, Deng J. Characteristics of combustion andemissions in a DI engine fueled with biodiesel blends from soybean oil. SAEtechnical paper; 2008-01-1832.
[138] Wander PR, Altafini CR, Colombo AL, Perera SC. Performance of smallstationary engines using blends of diesel fuel with biodiesel of soybean.SAE technical paper; 2010-36-0379.
[139] Qi D, Leick M, Liu Y, Lee C-fF. Effect of EGR and injection timing oncombustion and emission characteristics of split injection strategy DI-diesel engine fueled with biodiesel. Fuel 2011;90:1884–91.
[140] Senatore A, Cardone M, Allocca L, Vitolo S, Rocco V. Experimental char-acterization of a common rail engine fuelled with different biodiesel. SAEtechnical paper; 2005-01-2207.
[141] Zannis TC, Hountalas DT, Kouremenos DA. Experimental investigation tospecify the effect of oxygenated additive content and type on DI dieselengine performance and emissions. SAE technical paper; 2004-01-0097.
[142] Rizwanul Fattah IM, Masjuki HH, Liaquat AM, Ramli R, Kalam MA, RiazuddinVN. Impact of various biodiesel fuels obtained from edible and non-edibleoils on engine exhaust gas and noise emissions. Renewable and SustainableEnergy Reviews 2013;18:552–67.
[143] Tan P-q, Hu Z-y, Lou D-m, Li Z-j. Exhaust emissions from a light-duty dieselengine with Jatropha biodiesel fuel. Energy 2012;39:356–62.
[144] Krahl J, Bunger J, Schroder O, Munack A, Knothe G. Exhaust emissions andhealth effects of particulate matter from agricultural tractors operating onrapeseed oil methyl ester. Journal of the American Oil Chemists’ Society2002;79:717–24.
M.I. Arbab et al. / Renewable and Sustainable Energy Reviews 22 (2013) 133–147 147


