Embed Size (px)
Citation preview

Sed qui doloratur, qui sincit doles maximi, nonsentur solorro officte sima si conse optiatet acium excesti quia sanducit qui quis nis pa quam velit faccaturis
AREVA Proprietary

Basic Statistics Refresher
AREVA Proprietary

Sed qui doloratur, qui sincit doles maximi, nonsentur solorro officte sima si conse optiatet acium excesti quia sanducit qui quis nis pa quam velit faccaturis
Outline
INTRODUCTION
NORMAL DISTRIBUTION
TOLERANCE INTERVALS
RESPONSE SURFACE MODELS
CE Setpoints – Statistics - p.3
AREVA Proprietary

Sed qui doloratur, qui sincit doles maximi, nonsentur solorro officte sima si conse optiatet acium excesti quia sanducit qui quis nis pa quam velit faccaturis
Learning Objectives
Introduction� Describe the difference between a bias and a random un certainty
Normal Distribution� Explain why “2-sigma” is commonly used to describe 95% coverage of a
normal distribution
Tolerance Intervals� Describe a 95/95 tolerance interval
� Explain the difference between a one-sided tolerance in terval and a two-sided tolerance interval
Response Surface Models� Define a Response Surface Model
CE Setpoints – Statistics - p.4
AREVA Proprietary

Sed qui doloratur, qui sincit doles maximi, nonsentur solorro officte sima si conse optiatet acium excesti quia sanducit qui quis nis pa quam velit faccaturis
INTRODUCTION
Outline
INTRODUCTION
NORMAL DISTRIBUTION
TOLERANCE INTERVALS
RESPONSE SURFACE MODELS
CE Setpoints – Statistics - p.5
AREVA Proprietary

Sed qui doloratur, qui sincit doles maximi, nonsentur solorro officte sima si conse optiatet acium excesti quia sanducit qui quis nis pa quam velit faccaturis
INTRODUCTION
Learning Objectives
Introduction� Describe the difference between a bias and a random u ncertainty
Normal Distribution� Explain why “2-sigma” is commonly used to describe 95% coverage of a
normal distribution
Tolerance Intervals� Describe a 95/95 tolerance interval
� Explain the difference between a one-sided tolerance interval and a two-sided tolerance interval
Response Surface Models� Define a Response Surface Model
CE Setpoints – Statistics - p.6
AREVA Proprietary

Sed qui doloratur, qui sincit doles maximi, nonsentur solorro officte sima si conse optiatet acium excesti quia sanducit qui quis nis pa quam velit faccaturis
INTRODUCTION
Deterministic vs. Statistical
Statistics allows for the treatment of random variability. � Deterministic – Single value used to represent a Param eter.
� Statistical – Distribution of value used to represent a parameter including random variability.
CE Setpoints – Statistics - p.7
Pro
babi
lity
Den
sity
AREVA Proprietary

Sed qui doloratur, qui sincit doles maximi, nonsentur solorro officte sima si conse optiatet acium excesti quia sanducit qui quis nis pa quam velit faccaturis
INTRODUCTION
Types of Uncertainty
Bias – Shifts the mean of the distribution to the left or to the right
Random – Impacts the shape of the distribution
CE Setpoints – Statistics - p.8
Pro
babi
lity
Den
sity
Pro
babi
lity
Den
sity
AREVA Proprietary

Sed qui doloratur, qui sincit doles maximi, nonsentur solorro officte sima si conse optiatet acium excesti quia sanducit qui quis nis pa quam velit faccaturis
INTRODUCTION
Types of Uncertainty
A base assumption throughout the setpoint methodology is that uncertainty parameters may be treated as symmetric and normally distributed.
Example� Tavg uncertainty = +4.0F/-4.8F
Option 1� Apply bounding random uncertainty
Option 2� Apply bias to nominal setting
Pay extra attention in these situations
Not always the case in reality
Bias = -0.4F
Random = +-4.4F
Bias = -0.0F
Random = +-4.8F
Bias = -0.4F
Random = +-4.4F
CE Setpoints – Statistics - p.9
AREVA Proprietary

Sed qui doloratur, qui sincit doles maximi, nonsentur solorro officte sima si conse optiatet acium excesti quia sanducit qui quis nis pa quam velit faccaturis
INTRODUCTION
Visualization
A Histogram is used to visualize how a collection of data points is distributed.Probability Density Functions (PDF) are often used to analytically estimate statistical distributions.
CE Setpoints – Statistics - p.10
Pro
babi
lity
Den
sity
AREVA Proprietary

Sed qui doloratur, qui sincit doles maximi, nonsentur solorro officte sima si conse optiatet acium excesti quia sanducit qui quis nis pa quam velit faccaturis
INTRODUCTION
Review Learning Objectives
Introduction� Describe the difference between a bias and a random u ncertainty
Normal Distribution� Explain why “2-sigma” is commonly used to describe 95% coverage of a
normal distribution
Tolerance Intervals� Describe a 95/95 tolerance interval
� Explain the difference between a one-sided tolerance interval and a two-sided tolerance interval
Response Surface Models� Define a Response Surface Model
CE Setpoints – Statistics - p.11
AREVA Proprietary

Sed qui doloratur, qui sincit doles maximi, nonsentur solorro officte sima si conse optiatet acium excesti quia sanducit qui quis nis pa quam velit faccaturis
NORMAL DIST.
Outline
INTRODUCTION
NORMAL DISTRIBUTION
TOLERANCE INTERVALS
RESPONSE SURFACE MODELS
CE Setpoints – Statistics - p.12
AREVA Proprietary

Sed qui doloratur, qui sincit doles maximi, nonsentur solorro officte sima si conse optiatet acium excesti quia sanducit qui quis nis pa quam velit faccaturis
NORMAL DIST.
Learning Objectives
Introduction� Describe the difference between a bias and a random u ncertainty
Normal Distribution� Explain why “2-sigma” is commonly used to describe 95% coverage of a
normal distribution
Tolerance Intervals� Describe a 95/95 tolerance interval
� Explain the difference between a one-sided tolerance interval and a two-sided tolerance interval
Response Surface Models� Define a Response Surface Model
CE Setpoints – Statistics - p.13
AREVA Proprietary

Sed qui doloratur, qui sincit doles maximi, nonsentur solorro officte sima si conse optiatet acium excesti quia sanducit qui quis nis pa quam velit faccaturis
NORMAL DIST.
Normal Distribution
Many of the setpoint calculations use probability distributions to model the real world variability in input parameters.
Simplified models are typically used.� Most common is a Normal distribution.
� � �1
� 2��� �
��
Where,
µ = mean
σ = standard deviation
CE Setpoints – Statistics - p.14
Pro
babi
lity
Den
sity
AREVA Proprietary
Sed qui doloratur, qui sincit doles maximi, nonsentur solorro officte sima si conse optiatet acium excesti quia sanducit qui quis nis pa quam velit faccaturis
NORMAL DIST.
Normal Distribution
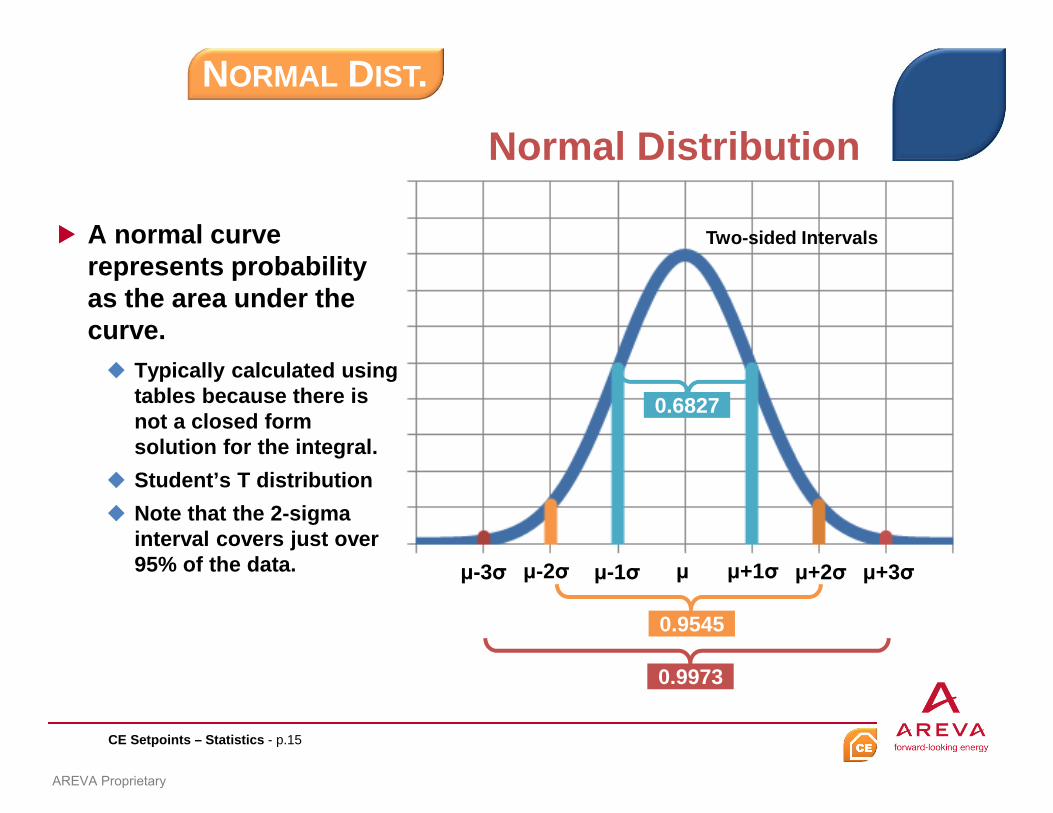
A normal curve represents probability as the area under the curve.� Typically calculated using
tables because there is not a closed form solution for the integral.
� Student’s T distribution
� Note that the 2-sigma interval covers just over 95% of the data. µ-3σ µ-2σ µ-1σ µ µ+1σ µ+2σ µ+3σ
0.9545
0.9973
0.6827
CE Setpoints – Statistics - p.15
Two-sided Intervals
AREVA Proprietary

Sed qui doloratur, qui sincit doles maximi, nonsentur solorro officte sima si conse optiatet acium excesti quia sanducit qui quis nis pa quam velit faccaturis
NORMAL DIST.
Normal Distribution
A normal curve represents probability as the area under the curve.� Typically calculated using
tables because the is not closed form solution for the integral.
µ-3σ µ-2σ µ-1σ µ µ+1σ µ+2σ µ+3σ
0.9773
0.9987
0.8414
CE Setpoints – Statistics - p.16
One-sided Intervals
AREVA Proprietary

Sed qui doloratur, qui sincit doles maximi, nonsentur solorro officte sima si conse optiatet acium excesti quia sanducit qui quis nis pa quam velit faccaturis
NORMAL DIST.
Review of Learning Objectives
Introduction� Describe the difference between a bias and a random un certainty
Normal Distribution� Explain why “2-sigma” is commonly used to describe 95% coverage of a
normal distribution
Tolerance Intervals� Describe a 95/95 tolerance interval
� Explain the difference between a one-sided tolerance in terval and a two-sided tolerance interval
Response Surface Models� Define a Response Surface Model
CE Setpoints – Statistics - p.17
AREVA Proprietary

Sed qui doloratur, qui sincit doles maximi, nonsentur solorro officte sima si conse optiatet acium excesti quia sanducit qui quis nis pa quam velit faccaturis
TOLERANCE INTV.
Outline
INTRODUCTION
NORMAL DISTRIBUTION
TOLERANCE INTERVALS
RESPONSE SURFACE MODELS
CE Setpoints – Statistics - p.18
AREVA Proprietary
Sed qui doloratur, qui sincit doles maximi, nonsentur solorro officte sima si conse optiatet acium excesti quia sanducit qui quis nis pa quam velit faccaturis
TOLERANCE INTV.
Learning Objectives
Introduction� Describe the difference between a bias and a random u ncertainty
Normal Distribution� Explain why “2-sigma” is commonly used to describe 95% coverage of a
normal distribution
Tolerance Intervals� Describe a 95/95 tolerance interval
� Explain the difference between a one-sided tolerance interval and a two-sided tolerance interval
Response Surface Models� Define a Response Surface Model
CE Setpoints – Statistics - p.19
AREVA Proprietary

Sed qui doloratur, qui sincit doles maximi, nonsentur solorro officte sima si conse optiatet acium excesti quia sanducit qui quis nis pa quam velit faccaturis
TOLERANCE INTV.
Tolerance Interval
A finite data set is inadequate to characterize a parameter’s variability with 100% certainty.
A tolerance interval has two numbers associated with it, namely a confidence level and a coverage level.
The interval is made so that we can have specified confidence that at least the specified portion of the entire population is covered by the interval.
For example, a 99/95 tolerance interval means that there is 99% confidence that 95% of the population will be covered by the given interval.� The order of the terms is not always treated consistently (i.e. 99/95 vs.
95/99).
� Luckily, we usually use 95/95 so it does not matter.
CE Setpoints – Statistics - p.20
AREVA Proprietary

Sed qui doloratur, qui sincit doles maximi, nonsentur solorro officte sima si conse optiatet acium excesti quia sanducit qui quis nis pa quam velit faccaturis
TOLERANCE INTV.
Tolerance Interval
For example, a 99/95 tolerance interval means that there is 99% confidence that 95% of the population will be covered by the given interval.
The 99% refers to the confidence of the interval.
This is typically impacted by the number of samples available. � A large uncertainty factor must be applied if a small number of samples
is available or if a high confidence is desired.
� A small uncertainty factor can be applied is a large number of samples is available or if a low confidence is desired.
� The confidence of a best estimate calculation is 50% .
CE Setpoints – Statistics - p.21
AREVA Proprietary

Sed qui doloratur, qui sincit doles maximi, nonsentur solorro officte sima si conse optiatet acium excesti quia sanducit qui quis nis pa quam velit faccaturis
TOLERANCE INTV.
Tolerance Interval
The 95% is the portion of the population being covered.
Coverage can be one-sided or two-sided.
one-sidedtwo-sided
CE Setpoints – Statistics - p.22
AREVA Proprietary

Sed qui doloratur, qui sincit doles maximi, nonsentur solorro officte sima si conse optiatet acium excesti quia sanducit qui quis nis pa quam velit faccaturis
TOLERANCE INTV.
Tolerance Interval
Tolerance intervals for normal distributions are of the form:
The constants k are typically referred to as “k-factors” and are tabulated.
The K factor for a two-sided 95/95 tolerance interval with infinite samples is 1.96
The K factor for a one-sided 95/95 tolerance interval with infinite samples is 1.645
�� � � ∗ �(two−sided) �� � � ∗ �(lower) �� � � ∗ �(upper)
�� (is the sample population mean) �(is the sample population standard deviation)
CE Setpoints – Statistics - p.23
AREVA Proprietary

Sed qui doloratur, qui sincit doles maximi, nonsentur solorro officte sima si conse optiatet acium excesti quia sanducit qui quis nis pa quam velit faccaturis
TOLERANCE INTV.
Review of Learning Objectives
Introduction� Describe the difference between a bias and a random u ncertainty
Normal Distribution� Explain why “2-sigma” is commonly used to describe 95% coverage of a
normal distribution
Tolerance Intervals� Describe a 95/95 tolerance interval
� Explain the difference between a one-sided tolerance interval and a two-sided tolerance interval
Response Surface Models� Define a Response Surface Model
CE Setpoints – Statistics - p.24
AREVA Proprietary

Sed qui doloratur, qui sincit doles maximi, nonsentur solorro officte sima si conse optiatet acium excesti quia sanducit qui quis nis pa quam velit faccaturis
RSM
Outline
INTRODUCTION
NORMAL DISTRIBUTION
TOLERANCE INTERVALS
RESPONSE SURFACE MODELS
CE Setpoints – Statistics - p.25
AREVA Proprietary

Sed qui doloratur, qui sincit doles maximi, nonsentur solorro officte sima si conse optiatet acium excesti quia sanducit qui quis nis pa quam velit faccaturis
RSM
Learning Objectives
Introduction� Describe the difference between a bias and a random uncertain ty
Normal Distribution� Explain why “2-sigma” is commonly used to describe 95% cover age of a
normal distribution
Tolerance Intervals� Describe a 95/95 tolerance interval
� Explain the difference between a one-sided tolerance interv al and a two-sided tolerance interval
Response Surface Models� Define a Response Surface Model
CE Setpoints – Statistics - p.26
AREVA Proprietary

Sed qui doloratur, qui sincit doles maximi, nonsentur solorro officte sima si conse optiatet acium excesti quia sanducit qui quis nis pa quam velit faccaturis
RSM
Response Surface Model (RSM)
A response surface is a multi-dimensional fit of a particular response to a set of input parameters.
Typically used to estimate complex phenomenon in an efficient way.
CE Setpoints – Statistics - p.27
AREVA Proprietary

Sed qui doloratur, qui sincit doles maximi, nonsentur solorro officte sima si conse optiatet acium excesti quia sanducit qui quis nis pa quam velit faccaturis
RSM
Response Surface Model
To develop an RSM, a set of experimental results characterizing the design space is required. � For DNBR calculation, the experiments are explicit XCO BRA-IIIC runs
� The design space is defined by the min and max of each input parameter
� Typically inputs are varied at integer multiples of t heir standard deviation
One option is to evaluate all possible combinations of each parameter at a given set of levels.� For example, assume each parameter can be at -2σ, -1σ, 0σ, 1σ, or 2σ
� Running all combinations of 10 parameters at 5 level s results in 9,765,625 XCOBRA-IIIC runs
CE Setpoints – Statistics - p.28
AREVA Proprietary

Sed qui doloratur, qui sincit doles maximi, nonsentur solorro officte sima si conse optiatet acium excesti quia sanducit qui quis nis pa quam velit faccaturis
RSM
Response Surface Model
Design of Experiments (DOE)� A design of experiments can be used to limit the num ber of explicit runs
needed to build an RSM while minimizing the loss of information
� Many types of DOE exist• Box-Benhken design• Plackett-Burman• Cubic centered design
CE Setpoints – Statistics - p.29
AREVA Proprietary

Sed qui doloratur, qui sincit doles maximi, nonsentur solorro officte sima si conse optiatet acium excesti quia sanducit qui quis nis pa quam velit faccaturis
RSM
Review of Learning Objectives
Introduction� Describe the difference between a bias and a random uncertainty
Normal Distribution� Explain why “2-sigma” is commonly used to describe 9 5% coverage of a
normal distribution
Tolerance Intervals� Describe a 95/95 tolerance interval
� Explain the difference between a one-sided tolerance interval and a two-sided tolerance interval
Response Surface Models� Define a Response Surface Model
CE Setpoints – Statistics - p.30
AREVA Proprietary

Sed qui doloratur, qui sincit doles maximi, nonsentur solorro officte sima si conse optiatet acium excesti quia sanducit qui quis nis pa quam velit faccaturis
Exercise 2.1Companion Notebook > Statistics Tab > Exercise 2.1� Tolerance Intervals
CE Setpoints – Statistics - p.31
AREVA Proprietary

Sed qui doloratur, qui sincit doles maximi, nonsentur solorro officte sima si conse optiatet acium excesti quia sanducit qui quis nis pa quam velit faccaturis
Review of Learning Objectives
Introduction� Describe the difference between a bias and a random u ncertainty
Normal Distribution� Explain why “2-sigma” is commonly used to describe 95% coverage of a
normal distribution
Tolerance Intervals� Describe a 95/95 tolerance interval
� Explain the difference between a one-sided tolerance interval and a two-sided tolerance interval
Response Surface Models� Define a Response Surface Model
CE Setpoints – Statistics - p.32
AREVA Proprietary