Embed Size (px)
Citation preview

0 ciiiu., Calculation
Calculation No.: Calc 388996-SW-01_Rev_3 Revision No.: 3Project: Honeywell Metropolis Works Facility (388996.HW.T6)
Engineering Discipline: Civil Date: 9/512012
Calculation Title & Description:"le." Civil and Stormwater Drainage Calculations
Descriotion: These calculations present the stormwater drainage evaluations related to the Honeywell - MetropoilisWorks Surface Water Impoundment Closure Project
Revision HNstoy* "
Revision No. Description Date Affected PagesFinal Calculation Package
3 9/5/2012 Complete StormwaterPackage (not HELP)
Document Review & Approval:Originator: Elizabeth Butterfield/CH2M HILL - 801, SW Lead
NtAMEiPOSITIOt4
I
I 9/5/2012DATF
NAMEJPSITION
9/5/2012DATE
Calculation 388996-SW-01, Rev 3 Page 1 of 152

1. Objective:
The objective of these calculations are to size the stormwater drainage ditches and drainage features,
including riprap, culverts, and discharge aprons.
2. Desicqn Standards and Criteria:
Stormwater Design Standards and CriteriaIllinois EPA and USEPA Requirements
General Illinois EPA criteria regarding drainage and erosion protection for in-place closure of surface
impoundments (per 35 III. Adm. Code 724) do not provide specific design storm requirements; however,
the 25-year, 24-hour design storm is cited throughout the 40 CFR 264 regulation for run-on and runoff
facilities at Subtitle C facilities.
For this project, surface water features are sized to manage the 100-year, 24-hour storm without
overtopping and to tolerate larger events without damage. Vegetated top-covers and riprap-stabilized
ditches, berm side slopes, and downslope drains will be provided to protect against erosion. Run-on is
not a significant concern because the impoundments are elevated above the surrounding topography.
The natural topography slopes away from the ponds into various natural drainages and to Outfall 002.
NRC Requirements and GuidanceGuidance in NUREG 1623 for uranium mine tailings sites is not directly applicable to MTW, but NRC staff
considers that this guidance can be used for any application where similar long-term stability is required.
Therefore, various guidance in NUREG 1623 has been considered for stormwater drainage design,
including the following:
* NUREG 1623, Section 2.2.1, "Selection of Design Flood and Precipitation Event": NRC cites the use of
the probable maximum flood for design storm events related to mine tailing sites, based on the
occurrence of the probable maximum precipitation (PMP). The PMP is the estimated depth of
rainfall for a given duration, drainage area, and time of year for which there is virtually no risk of
exceedance. The PMP approaches and approximates the maximum rainfall that is physically possible
within the limits of contemporary hydrometeorological knowledge and techniques. National
Oceanographic and Atmospheric Administration (NOAA) has developed methods in the form of
hydrometeorological reports for specific regions. Using the procedures outlined in
Hydrometeorological Report No. 51, "Probable Maximum Precipitation Estimates, United States East
of the 105th Meridian" (NOAA, 1978), and Hydrometeorological Report No. 52, "Application of
Probable Maximum Precipitation Estimates-United States East of the 105th Meridian" (NOAA,
1982), the PMP can be calculated.
Consideration for design: The combined drainage basin is on the order of 10.5 acres (or 0.016
square mile). For purposes of comparison to the design storm event used for this project, a
maximum flow rate (generated by a PMP event) is calculated in the design analysis section below to
arrive at an estimated, equivalent PMP storm using the charts and procedures outlined in HMR 51
and HMR 52.
" NUREG 1623, Section 2.2.2, "Gully Erosion," and Section 2.2.3, "Flow Concentrations and Drainage
Network Development": These sections describe the importance of preventing concentrated
drainage flows from creating gullies during a very large design storm event. By designing for a large
Calculation 388996-SW-01, Rev 3 Page 2 of 152

design storm event, the more frequent smaller events will have little to no cumulative impact on thestability of the cover system. The guidance states that it is unlikely that evenly distributed sheet flowwill occur from top to bottom of a slope as flow concentrations (gullies) can be caused by differentactions such as differential settlement, abnormal wind erosion, and/or random flow process andthat flow concentrations can develop even on carefully placed and compacted slopes and result information of rills and gullies, and eventually large preferential flow paths can develop.
Consideration for design: For this project, relatively short drainage lengths (approximately 125 feetor less) for the vegetated cover system are planned with a shallow graded cover crown of 4 percent,shedding off in all directions to prevent initiation of rills and gullies. Riprap in ditches and on bermside slopes is designed to tolerate the very large PMP flow rates without damage.
NUREG 1623, Appendix D, "Procedures for Designing Riprap Erosion Protection"--This appendix ofthe NUREG discusses the importance of riprap as protection from erosion and the various methodsof riprap design. The Safety Factors Method, the Stephenson Method, and the Abt and JohnsonMethod are discussed. These studies have indicated that the Safety Factors Method is applicable forslopes less than 10 percent and that the Stephenson Method is more applicable for slopes greaterthan 10 percent. Historic use of the Safety Factors Method has indicated that a minimum safetyfactor of 1.5 for nonprobable maximum flood applications (i.e., 100-year events) provides stabilityand protection. However, since the PMP is the estimated depth of rainfall for a given duration,drainage area, and time of year for which there is virtually no risk of exceedance, a safety factor of1.0 for the PMP application is sufficient for design. It is recommended that the riprap thickness bespecified as a minimum of 1.5 times the D50 of the riprap using the Safety Factors Method and 2times the D50 of the riprap using the Stephenson Method. The D50 is the stone diameter for whichhalf the material (by weight) is smaller and half is larger.
Consideration for design: The above guidance has been incorporated for riprap design in ditchesand on berm side slopes, as described below.
Summary of Selected Design CriteriaPermanent stormwater management features have been designed based on the following criteria.
Design Flow. Typical Subtitle C design requires the use of the 25-year, 24-hour design storm event. Forthis project the 100-year, 24-hour storm event is used to calculate the peak flows and to size ditches andother conveyance features, thus providing a safety factor (freeboard) for the features while carrying the25-year, 24-hour storm event. Consideration of the PMP event is made and compared for variouselements of the drainage system design. Peak flows are calculated from contributing drainages using theModified Rational Method.
Ditches. Ditches will be V-shaped with side slopes of 2H:1V, except for the interior slope of the exteriorperimeter ditches, which will have 3H:1V slopes to match the side slopes of the berms. The design depthof stormwater ditches has been determined using the following criteria:
* Size to convey the peak 100-year, 24-hour design storm event without overtopping, providingfreeboard and a safety factor to carry the conventional 25-year event. For interior ditches, designthe ditches to convey the 100-year, 24-hour design storm event below the elevation of the CDN.
* Define the ditch invert elevation as the top of the riprap layer-i.e., flow within the riprap is notconsidered for ditch design.
" Use n = 0.035 for rock-lined (riprap) ditches.
Calculation 388996-SW-01, Rev 3 Page 3 of 152

* Determine required depth for new ditches using a typical slope of one percent for allinterior/common berm ditches, with slopes marginally greater or less than 1 percent in select areasas necessary due to topographic and cover system design constraints.
Riprap. Ditch riprap D50 is designed to protect against erosion caused by the 100-year, 24-hour stormusing the Safety Factors Method with a minimum SF of 1.5, or the PMP event with an SF of 1.0. Sideslope riprap is designed using the Stephenson Method. Thickness of the riprap layers is specified as aminimum of 1.5 times the D50.
Downslope Drainage Ditches/Discharge Points. Downslope drains and discharge points where ditchesinterface with existing, natural drainage ravines and gullies (and Outfall 002) will be stabilized withriprap to prevent erosion. This reduces flow velocities to a level that the natural drainage can receivethe added flow, known as an energy dissipater. The energy dissipater will consist of a scour holefollowed by a riprap apron, which widens from the culvert outlet to the end of the apron. NUREG 1623Appendix D Section 4 Riprap Design for Aprons and Diversion Channel Outlets addresses this concern.Several methods exist to design the riprap energy dissipater. NUREG 1623 refers to EM 1110-2-1601 andHEC-14 as recommended design methods. Using HEC-14 and the culvert outlet calculations, the scourdepth is calculated. Then scour depth is used to calculate the length and width of the riprap apron. Thescour hole depth, length, and width are related to the size of the D50 riprap.
Culverts. Size culverts to convey the peak flow from the design event (100-year, 24-hour storm). Usecorrugated polyethylene pipe (such as ADS N-12) with corrugated exterior and smooth interior. Provideinlet and outlet protection using riprap.
3. Methodology and Assumptions:
Refer to Section 2 above.
4. Results and Conclusions
Summary of Stormwater Management FeaturesKey permanent stormwater management features are summarized as follows:
* Surface water will sheet flow off the top final cover from each pond and either convey into interiorditches collocated at the top of common pond berms or convey via sheet flow down the berm sideslope riprap to exterior perimeter ditches located at the toe of the berms.
" Concentrated flows from the common berm ditches will be conveyed under the perimeter accessroads via culverts to the exterior perimeter ditches.
* Exterior perimeter ditches will convey flows to three discharge points, as follows:
o Discharge point 1 (DP1) will collect surface water runoff from parts of Ponds B, C, and E.
o Discharge point 2 (DP2) will collect surface water runoff from part of Pond E.
o Discharge point 3 (DP3; existing Outfall 002) will collect surface water runoff from partsof Ponds B, C, and E, and all of Pond D.
Calculation 388996-SW-01, Rev 3 Page 4 of 152

Design Analyses
1.1.1.1 100-Year, 24-Hour Design Flow CalculationThe Rational Method was used to determine the peak runoff from each of the drainage basins as shownin Drawing C-4. The time of concentration (Tc) was calculated using the industry-standard TR-55methodology, as outlined in Chapter 3 of the USDA's Urban Hydrology for Small Watersheds. Tc iscomputed by determining the longest travel path in a drainage basin and summing the travel times forconsecutive components of the drainage path over three types of flow regimes: sheet flow, shallowconcentrated flow, and open channel flow. Surface roughness, channel shape, and channel slope allfactor into the Tc calculation.
A runoff coefficient of 0.95 was selected for the Rational Method stormwater runoff calculations as aconservative measure assuming frozen ground conditions with little or no infiltration or initialabstraction. it is assumed THAT virtually all stormwater runoff generated by the design storm events willbe conveyed BY ditches and culverts to the three outfalls. The storm intensity was chosen from theintensity-duration-frequency curves (and data tables) obtained from the nearby weather station for a100-year design storm with the corresponding time of concentration for each basin.
Based on the above, the peak flow for all contributing drainage areas is 62.65 cubic feet per second (cfs)for the 100-year storm. Table 5-1A summarizes the flows from each contributing drainage basin.
TABLE 5-1ADrainage Basin Flow Summary: 100-Year, 24-Hour Storm EventHoneywell-Metropolis Works Surface Impoundment Closure Engineering Report
Time ofArea Area Peak Flow Runoff Intensity ConcentrationID (acre) (cfs) Coefficient (in./hr) (min)
Pond B
A B-1 0.49 2.80 0.95 6.02 17
A B-2 0.18 1.28 0.95 7.49 10
A B-3 0.31 2.21 0.95 7.49 10
A B-4 0.11 0.64 0.95 6.13 16
A B-5 0.21 1.44 0.95 7.24 11
A B-6 0.26 1.79 0.95 7.24 11
Pond B Total 1.56 10.16
Pond C
A C-1 0.49 2.80 0.95 6.02 17
A C-2 0.19 1.35 0.95 7.49 10
A C-3 0.19 1.35 0.95 7.49 10
A C-4 0.15 1.03 0.95 7.24 11
A C-5 0.57 3.79 0.95 6.99 12
Pond C Total 1.59 10.32
Pond D
Calculation 388996-SW-01, Rev 3 Page 5 of 152

TABLE 5-1ADrainage Basin Flow Summary: 100-Year, 24-Hour Storm EventHoneywell-Metropolis Works Surface Impoundment Closure Engineering Report
Time ofArea Area Peak Flow Runoff Intensity Concentration
ID (acre) (cfs) Coefficient (in./hr) (min)
A D-1 0.24 1.71 0.95 7.49 10
A D-2 0.25 1.48 0.95 6.24 15
A D-3 0.85 4.77 0.95 5.91 18
A D-4 0.26 1.73 0.95 6.99 12
Pond D Total 1.60 9.69
Pond E
A E-1 0.92 5.17 0.95 5.91 18
A E-2 0.63 4.03 0.95 6.74 13
A E-3 0.37 2.46 0.95 6.99 12
A E-4 1.08 5.73 0.95 5.58 21
A E-5 0.66 3.64 0.95 5.80 19
A E-6 1.33 7.05 0.95 5.58 21
A E-7 0.80 4.41 0.95 5.80 19
Pond E Total 5.79 32.48
Project Total 10.54 62.65
1.1.1.2 PMP Flow Calculation
As described in Section 5.4.1, based on NRC guidance in NUREG 1623, theoretical maximum ditch flowrates are calculated based on the PMP for comparison to the design storm (100-year, 24-hour storm).
The Illinois EPA does not require consideration of the PMP.
Using the steps outlined in Sections 5.a and 5.b in HMR 51, the all-season, 6-hour, 10-square-mile PMP(inches) for the pond site in Metropolis, Illinois, was shown to be 28.7 inches (Calculation Step 1). Forthis analysis, it was necessary to derive the PMP for smaller durations and smaller areas per the stepsoutlined in HMR 52. From HMR 52, Figure 23, the ratio of the 1-hour point to 6-hour, 10-square-milePMP for the Metropolis ponds site is 0.647 (Calculation Step 2). This results in a 1-hour point PMP of18.6 inches (Calculation Step 3). Using HMR 52 Figures 36, 37, and 38, the ratios of the 5-, 15-, and 30-minute PMP to 1-hour point PMP calculated in the previous step are obtained (Calculation Step 4). Usingthese ratios the 5-, 15-, and 30-minute PMP results are 6.1, 9.6, and 13.9 inches respectively (CalculationStep 5). By plotting the 5-, 15-, and 30-minute PMP values, the PMP for various times of concentration(Tc) are obtained (Calculation Step 6). To determine Tc values for various ponds for the PMP eventfollowing iterative procedure was used:
1. PMPs are obtained using the Tc values calculated for the 100-year event. Using this information,
the peak flows from various pond drainage areas were calculated.
Calculation 388996-SW-01, Rev 3 Page 6 of 152

2. The peak flows calculated in Step 1 were used as inflow inputs in FlowMaster to route flowthrough the ditches. The obtained elevation profile from the FlowMaster output was used tocorrect the flow lengths used in the calculation of travel times.
3. The corrected travel times were used to determine the Tc values. Using these Tc values abovesteps 1 and 2 were repeated until the currently obtained elevation profile converges to theelevation profile.
Based on the above iterative procedure, the peak flow for all contributing drainage areas was calculatedto be 704.18 cfs for the PMP event. Table 5-1B summarizes the flows from each contributing drainagebasin. Drawing C-4 shows the configuration of the drainage areas listed in Table 5-lB. (Note: forconvenience, this drawing is reproduced as Attachment A in this memorandum.)
Calculation 388996-SW-01, Rev 3 Page 7 of 152

TABLE 5-1BDrainage Basin Flow Summary: PMP EventHoneywell-Metropolis Works Surface Impoundment Closure Engineering Report
Time ofArea Area Peak Flow Runoff Intensity Concentration
ID (acre) (cfs) Coefficient (in./hr) (min)
Pond B
A B-1 0.49 31.85 1.00 65.0 6
A B-2 0.18 13.18 1.00 73.2 3
A 8-3 0.31 22.69 1.00 73.2 3
A B-4 0.11 7.15 1.00 65.0 6
A B-5 0.21 15.37 1.00 73.2 3
A B-6 0.26 19.03 1.00 73.2 3
Pond B Total 1.56 109.27
Pond C
A C-1 0.49 35.87 1.00 73.2 5
A C-2 0.19 13.91 1.00 73.2 3
A C-3 0.19 13.91 1.00 73.2 3
A C-4 0.15 10.98 1.00 73.2 3
A C-5 0.57 41.72 1.00 73.2 4
Pond C Total 1.59 116.39
Pond D
A D-1 0.24 17.57 1.00 73.2 3
A D-2 0.25 18.30 1.00 73.2 5
A D-3 0.85 55.25 1.00 65.0 6
A D-4 0.26 19.03 1.00 73.2 4
Pond D Total 1.60 110.15
Pond E
A E-1 0.92 59.80 1.00 65.0 6
A E-2 0.63 46.12 1.00 73.2 4
A E-3 0.37 27.08 1.00 73.2 4
A E-4 1.08 62.95 1.00 58.3 7
A E-5 0.66 42.90 1.00 65.0 6
A E-6 1.33 42.90 1.00 58.3 7
A E-7 0.80 52.00 1.00 65.0 6
Pond E Total 5.79 368.37
Calculation 388996-SW-01, Rev 3 Page 8 of 152

TABLE 5-1BDrainage Basin Flow Summary: PMP EventHoneywell-Metropolis Works Surfoce Impoundment Closure Engineering Report
Time ofArea Area Peak Flow Runoff Intensity Concentration
ID (acre) (cfs) Coefficient (in./hr) (min)
Project Total 10.54 704.18
Ditch Sizes
Ditches were sized using the design criteria presented in Section 5.4.1. As noted, the Rational Methodwas used to calculate the stormwater runoff peak flow rate conveyed in each ditch. The flow for eachditch was then inserted into FlowMaster, a software package that uses the industry-standard open-channel Manning's equation to solve for the minimum depth of ditch with given inputs of flow rate,ditch cross-section, ditch side slope geometry, ditch slope, and Manning's n value (based on ditchroughness). Tables 5-2A and 5-2B list the minimum ditch depths calculated in order for the ditch tocontain the total ditch flow without overtopping during the 100-year and PMP events, respectively.
During the PMP event, the flow velocities are all subcritical, meaning the flow depth is greater than thecritical depth, and the velocity is less than the critical velocity. This occurs where slopes are relativelyflat. Low flow velocities are expected to ensure that the stormwater features will remain intact andfunctional. All ditches are sized to handle the updated PMP flow rates without overtopping during the
PMP event.
Calculation 388996-SW-01, Rev 3 Page 9 of 152

TABLE 5-2ADitch Flows and Design Summary: 100-Year, 24-Hour Storm Event
Honeywell-Metropolis Works Surface Impoundment Closure Engineering Report
ConveyanceDitch No.
DP1
DPi-1
DP1-2
DP1-3
DP1-4
DP1-5
DP1-6
DP1-7
DP1-8
DP2
DP2-1
DP2-2
DP3
DP3-1
DP3-2
DP3-3
DP3-4
DP3-5
DP3-6
Required Minimum DitchDepth (Normal Depth) (ft)
2.07
1.04
1.73
1.62
1.19
1.19
0.84
0.85
0.55
1.27
0.81
0.96
1.65
1.37
0.94
1.18
1.22
0.81
0.67
AverageSlope (ft/ft)
0.01
0.01
0.01
0.01
0.01
0.01
0.01
0.01
0.01
0.01
0.01
0.01
0.01
0.01
0.01
0.01
0.01
0.01
0.01
Velocity Side Slopes(ft/s) (Left/Right)
4.03 2H:1V/2H:1V
2.61 3H:1V/2H:1V
3.66 3H:1V/2H:1V
3.51 3H:1V/2H:1V
2.78 2H:IV/2H:IV
2.85 3H:1V/2H:1V
2.21 2H:1V/2H:IV
2.28 3H:1V/2H:IV
1.70 3H:1V/2H:1V
2.91 2H:1V/2H:IV
2.21 3H:1V/2H:1 V
2.48 2H:1V/3H:IV
3.46 2H:1V/2H:IV
3.13 2H:1V/3H:1V
2.38 2H:1V/2H:IV
2.84 2H:1V/3H:1V
2.83 2H:1V/2H:1V
2.15 2H:1V/2H:1V
1.95 2H:lV/3H:lV
Ditch Total Flow(cfs)
34.47
7.05
27.42
23.01
7.82
10.03
3.14
4.08
1.28
9.36
3.64
5.73
18.82
14.64
4.18
9.86
8.38
2.80
2.21
Calculation 388996-SW-01, Rev 3 Page 10 of 152

TABLE 5-2BDitch Flows and Design Summary: PMP EventHoneywell-Metropolis Works Surface Impoundment Closure Engineering Report
Conveyance Required Minimum Ditch Average Velocity Side Slopes Ditch Total FlowDitch No. Depth (Normal Depth) (ft) Slope (ft/ft) (ftls) (Left/Right) (cfs)
DP1 5.14 0.01 7.40 2H:1V/2H:1V 390.99
DPI-1 2.56 0.01 4.75 3H:IV/2H:IV 77.52
DP1-2 4.31 0.01 6.74 3H:1V/2H:IV 313.47
DP1-3 4.03 0.01 6.44 3H:IV/2H:IV 261.47
DP1-4 2.94 0.01 5.09 2H:IV/2H:IV 87.84
DP1-5 2.95 0.01 5.23 3H:IV/2H:IV 113.83
DP1-6 2.03 0.01 3.99 2H:IV/2H:IV 32.94
DP1-7 2.08 0.01 4.15 3H:IV/2H:IV 45.03
DP1-8 1.32 0.01 3.05 3H:IV/2H:IV 13.18
DP2 3.15 0.01 5.33 2H:IV/2H:IV 105.85
DP2-1 2.05 0.01 4.10 3H:IV/2H:IV 42.90
DP2-2 2.36 0.01 4.51 2H:IV/3H:lV 62.95
DP3 4.05 0.01 6.31 2H:IV/2H:IV 207.34
DP3-1 3.36 0.01 5.70 2H:IV/3H:IV 161.22
DP3-2 2.31 0.01 4.33 2H:IV/2H:IV 46.12
DP3-3 2.87 0.01 5.14 2H:IV/3H:IV 105.97
DP3-4 2.93 0.01 5.09 2H:1V/2H:1V 87.67
DP3-5 1.95 0.01 3.87 2H:IV/2H:1V 29.28
DP3-6 1.61 0.01 3.49 2H:IV/3H:IV 22.69
Culverts
Culverts were sized based on the design criteria presented above. The culverts were sized based on the
contributing ditch flows as described. Sizing was done using the FlowMaster software package
distributed by Bentley. The calculated flow rate for each culvert was imported into FlowMaster along
with the geometry of the culvert. The culvert design method used in the FlowMaster program is based
on Manning's equation.
Table 5-3 summarizes the associated culvert sizes for both the 100-year and the PMP design events. The
100-year design culvert sizes are planned for construction (very similar to the culvert sizes listed in the
LARR Volume 2), which are smaller than required to manage the PMP flow rates. These culvert sizes are
consistent with security requirements for the operating facility. At the end of the post-closure
monitoring period (required by Illinois EPA), the culverts will be replaced either with riprap armored
open channels (same designs as the corresponding ditch segments) or with larger culverts sized to
handle the PMP flow rates, as listed in Table 5-3.
Calculation 388996-SW-01, Rev 3 Page 11 of 152

TABLE 5-3Culvert Sizing SummaryHoneywell-Metropolis Works Surface Impoundment Closure Engineering Report
100-year 100-yearDesign Flow Design PMP Design PMP Design
Culvert ID (cfs) Diameter (in.) Flow (cfs) Diameter (in.)
01 7.82 24 87.84 54
C2 3.14 15 32.94 36
C3 1.28 12 13.18 24
C4 4.18 18 46.12 42
C5 8.38 24 87.67 54
C6 18.82 30 207.34 72
C7 18.82 30 207.34 72
C8 9.36 24 105.85 54
C9 34.47 36 390.99 90
C10 2.21 15 22.69 30
Riprap
Design of the riprap slope protection was performed using the criteria presented above. As described inNUREG 1623, the PMP event "approximates the maximum rainfall that is physically possible within thelimits of contemporary hydrometeorological knowledge and techniques." By this definition, the riprapsizing based on the PMP event and a safety factor of 1.0 is considered conservative for riprap design.The ditch riprap results in Table 5-4 are based on the flow rate for each ditch section.
For constructability purposes, the calculated minimum riprap sizes will be rounded up to accommodate
only four different gradations. Along the ditches, riprap sizes will be 6, 10, or 14 inches D50. Riprap sizesalong the approximately 3H:IV sideslopes will be either 6 or 8 inches D50. The planned riprap sizes for
construction are shown in Table 5-4.
TABLE 5-4Riprap Sizing SummaryHoneywell-Metropolis Works Surface Impoundment Closure Engineering Report
Ditch or Minimum Riprap Planned Planned ConstructedSideslope Storm Minimum Layer Thickness Safety Constructed Dso Riprap Layer Thickness
ID Event Dso (in.) (in.) Factor (in.) (in.)
Ditches
PMP 14 21 1.0DP1
100-year 14 21 1.4 14 21
PMP 7 10.5 1.0DPI-1
100-year 7 10.5 1.4 10 15
PMP 12 18 1.0DP 1-2
100-year 12 18 1.4 14 21
DP1-3 PMP 11 16.5 1.0
Calculation 388996-SW-01, Rev 3 Page 12 of 152

TABLE 5-4Riprap Sizing SummaryHoneywell-Metropolis Works Surface Impoundment Closure Engineering Report
Ditch or Minimum Riprap Planned Planned ConstructedSideslope Storm Minimum Layer Thickness Safety Constructed D50 Riprap Layer Thickness
ID Event D50 (in.) (in.) Factor (in.) (in.)
100-year 11 16.5 1.4 14 21
PMP 8 12 1.0DP1-4
100-year 8 12 1.4 10 15
PMP 8 12 1.0DP1-5
100-year 8 12 1.4 10 15
PMP 6 9 1.1DP1-6
100-year 6 9 1.4 6 9
PMP 6 9 1.0DP11-7
100-year 6 9 1.4 6 9
PMP 4 6 1.1DP1-8
100-year 4 6 1.4 6 9
PMP 9 13.5 1.0DP2
100-year 9 13.5 1.4 10 15
PMP 6 9 1.0D P2-1100-year 6 9 1.4 6 9
PMP 7 10.5 1.1DP2-2
100-year 7 10.5 1.4 10 15
PMP 11 16.5 1.0DP3100-year 11 16.5 1.4 14 21
PMP 9 13.5 1.0DP3-1
100-year 9 13.5 1.4 10 15
PMP 7 10.5 1.1DP3-2
100-year 7 10.5 1.4 10 15
PMP 8 12 1.0D0P3-3
100-year 8 12 1.4 10 15
PMP 8 12 1.0DP3-4
100-year 8 12 1.4 10 15
PMP 6 9 1.1DP3-5
100-year 6 9 1.4 6 9
PMP 5 7.5 1.1DP3-6
100-year 5 7.5 1.4 6 9
Sideslopes
Between A PMP 4 8
Calculation 388996-SW-01, Rev 3 Page 13 of 152

TABLE 5-4Riprap Sizing SummaryHoneywell-Metropolis Works Surface Impoundment Closure Engineering Report
Ditch or Minimum Riprap Planned Planned ConstructedSideslope Storm Minimum Layer Thickness Safety Constructed D50 Riprap Layer Thickness
ID Event D50 (in.) (in.) Factor (in.) (in.)
B-2 and 100-year 1 2 6 12DP1-8
Between A PMP 7 14B-1 and 100-year 2 4 8 16DP1-7
Between A PMP 7 14C-1 and 100-year 2 4 8 16DP1-5
Between A PMP 7 14E-1 and 100-year 2 4 8 16DP1-3
Between A PMP 8 16E-7 and 100-year 2 4 8 16DP1-2
Between A PMP 6 12E-6 and 100-year 2 4 6 12DPi-1
Between A PMP 7 14E-5 and 100-year 2 4 8 16DP2-1
Between A PMP 7 14E-4 and 100-year 2 4 8 16DP2-2
Between A PMP 8 16D-3 and 100-year 2 4 8 16DP3-1
Between A PMP 4 8D-2 and 100-year 1 2 6 12DP3-3
Between A PMP 3 6B-4 and 100-year 1 2 6 12DP3-6
Between A PMP 6 12B-3 and 100-year 2 4 6 12DP3-6
Downslope Drainage Ditches/Discharge Points. Downslope drains and discharge points where ditchesinterface with existing, natural drainage ravines and gullies (and Outfall 002) will be stabilized with
riprap to prevent erosion. This reduces flow velocities to a level that the natural drainage can receive
the added flow, known as an energy dissipater. The energy dissipater will consist of a scour hole
followed by a riprap apron, which widens from the culvert outlet to the end of the apron. NUREG 1623Appendix D Section 4 Riprap Design for Aprons and Diversion Channel Outlets addresses this concern.
Several methods exist to design the riprap energy dissipater. NUREG 1623 refers to EM 1110-2-1601 and
Calculation 388996-SW-01, Rev 3 Page 14 of 152

HEC-14 as recommended design methods. Using HEC-14 and the culvert outlet calculations, the scourdepth is calculated. Then scour depth is used to calculate the length and width of the riprap apron. Thescour hole depth, length, and width are related to the size of the D50 riprap.
Preliminary calculations have been prepared to achieve approximate dimensions for the energydissipaters. Culvert C9 outfalls to Discharge Point No. 1, or ditch DP1. The energy dissipater for DP1 willconsist of, at a minimum, a 3.54 feet deep, 36 foot long dissipater pool, with a 18 foot long apron, usinga D50 of 5 inches. The apron will widen from 7.5 feet to 44 feet at the basin exit. Culvert C8 outfalls toDischarge Point No. 2, or ditch DP2. The energy dissipater for DP2 will consist of, at a minimum, a 1.93feet deep, 20 foot long dissipater pool, with a 9 foot long apron, using a D50 of 3 inches. The apron willwiden from 4.5 feet to 24 feet at the basin exit.
Culvert C7 outfalls to Discharge Point No. 3, or ditch DP3. Ditch DP3 terminates in existing outfall 002,which consists of a concrete structure and overflow weir, which then discharges to a riprap-linedchannel that directs flow downslope toward the Ohio River floodplain. Outfall 002 will remain in itscurrent configuration during construction and throughout the IEPA post-closure period. Prior tocompletion of the post-closure period, additional energy dissipation features will be implemented asnecessary downstream of Outfall 002 consistent with NUREG 1623 guidance.
5. List of Attachments
Calculations:
" Drainage and Ditch Sizing Calculations
" PMP Calculations
* Riprap Sizing Calculatins
* Culvert Sizing Calculations
" Discharge Apron Calculations
6. Additional References
NOAA (National Oceanic and Atmospheric Administration). 1978. Probable Maximum PrecipitationEstimates, United States East of the 105th Meridian. Hydrometeorological Report No. 51. Available athttp://www.nws.noaa.gov/oh/hdsc/PMP documents/HMR51.pdf.
NOAA (National Oceanic and Atmospheric Administration). 1982. Application of Probable MaximumPrecipitation Estimates, United States East of the 105th Meridian. Hydrometeorological Report No. 52.Available at http://www.nws.noaa.gov/oh/hdsc/PMP documents/HMR52.pdf.
NRC, 1988. NUREG/CR-4651. Development of Riprap Design Criteria by Riprap Testing in Flumes: PhaseII. Follow-up Investigations.
NRC, 2002. NUREG-1623. Design of Erosion Protection for Long-Term Stabilization. Final Report.
US. Department of Transportation Federal Highway Administration, 2006. Hydraulic Design of EnergyDissipators for Culverts and Channels. Hydraulic Engineering Circular No. 14, Third Edition. Available athttp://www.fhwa.dot.gov/engineering/hydraulics/pubs/06086/hecl4.pdf.
Calculation 388996-SW-01, Rev 3 Page 15 of 152

Attachment ACALCULATIONS
Calculation 388996-SW-01, Rev 3 Page 16 of 152

Honeywell Pond Closure
Time of Concentration
Source: USDA, Urban Hydrology for Small Watersheds (TR-55)
Time of concentration is a combination of sheet flow, shallow concentrated flow,
and open channel flow. The total time of concentration results from the sum of
all contributing basins.
Sheet Flow
equation 3-3
00 = O.X (nY )O'sT, (p)0.5S 0'.4
T, = travel time (hr)
n = Manning's roughness coefficient for sheet flow (Table 3-1)L = flow length (ft)
P = rainfall (in)s = slope of hydraulic grade line (land slope, ft/ft)
Table 3-1 Roughness coefficients (Manning's n) forsheet flow
Surface description n I
Smooth surfaces (concrete, asphalt,
gravel, or bare soil) ......................................... 0.011
Fallow (no residue) .................................................. 0.05
Cultivated soils:
Residue cover <20% ......................................... 0.06
Residue cover >20% ......................................... 0.17
Grass:
Short grass prairie ............................................ 0.15
D ense grasses 2-/ .............................................. 0.24
Berm udagrass .................................................. 0.41
R lange (natural) ......................................................... 0.13
Woods:-'
Light underbrush .............................................. 0.40
Dense underbrush ............................................ 0.80
I The ji values are a composite of information compiled by Engmnan
(1986).2 Includes species such as weeping lovegrass, bluegrass, buffalo
grass, blue graina grass, and native grass mixtures.3 When selecting n, consider cover to a height of about 0.1 ft. This
is the only part of the plant cover that will obstruct sheet flow.
Calculation 388996-SW-01, Rev 3 Page 17 of 152

Shallow Concentrated FlowAfter a maximum of 300 feet, sheet flow usually becomes shallow concentrated flow.
equation 3-1
T, - L
3600 V
Tt = travel time (hr)
L = flow length (ft)V = average velocity (Figure 3-1, ft/s)
Figure 3-1 Average velocities for estimating travel time for shallow concentrated flow
.50
.20
.10
.06
.04
I. 1I/
tI'
CD
0
0)
i
.. ....... .... .
, Y-441t
.. ... ..... ..
.02
.01 (
////!
nn.,;2 4 6 10 20
Average velocity (ft/sec)
Calculation 388996-SW-01, Rev 3 Page 18 of 152

Open Channels
equation 3-4
2 1
1 .49 r 3 s 2
n
ar --P "I
V = average velocity (ft/s)r = hydraulic radius (ft)
a = cross sectional flow area (ft2)
Pw = wetted perimeter (ft)
s = slope of the hydraulic grade line (channel slope, ft/ft)n = Manning's roughness coefficient for open channel flow
equation 3-1
T= L3600 V
LV
= travel time (hr)
= flow length (ft)= average velocity from Equation 3-4 (ft/s)
Time of Concentration Calculations
A B-1 100-yearSheet Flow (4% slopes)n = 0.15L = 134 ftP1lo-year, 14 min = 1.498 in
s= 0.04 ft/ft
Tt= 0.22861hr
Sheet Flow (3:1 slopes)n = 0.15
L = 40 ft
Ploo-year, 5 min = 0.81 ins = 0.3333 ft/ft
T, = F.o005o6 hr
Total Time of Concentration
Tt= 0.2792-hr
short grass prairie
= [13.7]mrin
short grass prairie
= •.Ormin
A B-1 PMP
Sheet Flow (4% slopes)n = 0.1
L = 134 ft
PPMP, S rnin = 6.1 in
s = 0.04 ft/ft
T = 0.0819 hr
Sheet Flow (3:1 slopes)n = 0.1
L = 30 ft
PPMP, 5 min = 6.1 in
s = 0.3333 ft/ftTt = L 0.0106 h
11 __ _ _jhr
Total Time of Concentration
Tt = t_0.0925!hr
short grass prairie
= Izq, min
short grass prairie
shortened due to ditch depth
= [0.6min
LJ7 mi
.%16min
Calculation 388996-SW-01, Rev 3 Page 19 of 152

A B-2 100-yearSheet Flow (4% slopes)n = 0.15L = 70 ft
P100-year, 10 min = 1.25 in
s = 0.04 ft/ft
T= 0.1489;hr
Sheet Flow (3:1 slopes)n = 0.15L = 12 ft
P100-year, 5 min = 0.81 in
s = 0.3333 ft/ft
T,= 00l93'!hr
Total Time of Concentration
T, : 0.1682ihr
A B-3 100-yearSheet Flow (4% slopes)n = 0.15L = 70 ft
P00-year, 10 min = 1.25 in
s = 0.04 ft/ft
T, = 0.14891hr
Sheet Flow (3:1 slopes)n = 0.15L = 12ft
P100-year, 5 min = 0.81 in
s = 0.3333 ft/ft
Tt -= -. 01931hr
Total Time of Concentration
Tt= 0.1682!hr
A B-4 100-year
Sheet Flow (4% slopes)n = 0.15L = 157 ft
P100-year, 16 min 1.609 ins = 0.04 ft/ft
T, -025O0i 1hr
Sheet Flow (3:1 slopes)n = 0.15L = iSft
P100-year, 5 min = 0.81 ins = 0.3333 ft/ft
mT = k 0.0231lhr
Total Time of Concentration
Tt 0'27351hr
short grass prairie
S 8.9min
short grass prairie
j 1.21min
= 10-min
short grass prairie
=-8.9,min
short grass prairie
S 1.21min
A B-2 PMP
Sheet Flow (4% slopes)n = 0.1L = 70 ft
PPMP, 5 min = 6.1 in
s = 0.04 ft/ft
T = 0.0487!hr
Sheet Flow (3:1 slopes)n = 0.1L = 2ft
PPMP, 5 min = 6.1 in
s = 0.3333 ft/ft
Tt = i '0.0012!hr
Total Time of Concentration
Tt = 0.0499 hr
A B-3 PMP
Sheet Flow (4% slopes)n = 0.1L = 70 ft
PPMP, 5 mnin = 6.1 in
s = 0.04 ft/ft
Tt :[o.o48 hhr
Sheet Flow (3:1 slopes)n = 0.1L = 2 ft
PPMP, 5 min = 6.1 in
s = 0.3333 ft/ft
Tt = FO.ý-t2J0 I hr
Total Time of Concentration
Tt = 0.04991 hr
A B-4 PMP
Sheet Flow (4% slopes)n = 0.1L = 157 ft
PPMP, 6 min = 6.45 in
s = 0.04 ft/ft
Tt : 0.09041hr
Sheet Flow (3:1 slopes)n = 0.1
short grass prairie
12.9imin
= - 31min
short grass prairie
shortened due to ditch depth
- 1oii0im in
short grass prairie
= I2.9Imin
short grass prairie
shortened due to ditch depth
r6iji
L m min =h 31min
short grass prairie
: 15.O1min
short grass prairie
short grass prairie
= "••m i n
short grass prairie
shortened due to ditch depth
= ,O2! min
L = 5ft
PPMP, 5 min = 6.1 in
s = 0.3333 ft/ft= 14min Tt = 0.0025 hr
= L-illminTotal Time of Concentration
Tt = O.00929hr - IG '6minL-_ I
Calculation 388996-SW-01, Rev 3 Page 20 of 152

A B-5 100-yearSheet Flow (4% slopes)n = 0.15
L
P100-yer, 10 min
s
= 77 ft
= 1.25 in
= 0.04 ft/ft
= O.•607:hr
short grass prairie
= 9.6,min
short grass prairie
Sheet Flow (3:1 slopes)n = 0.15
L = 12 ft
P100-year, 5 min -
Tt
0.81 in
0.3333 ft/ft
0.0193ihr =:1.2imin
S11:min
Total Time of Concentration
T= 0.18'hr
A B-6 100-yearSheet Flow (4% slopes)n 0.15L = 83 ft
P100-year, 11 min
5
= 1.312 in
= 0.04 ft/ft
= 0. 1665- hr
short grass prairie
= 10.Ojmin
short grass prairie
Sheet Flow (3:1 slopes)n = 0.15L = 12ft
P1oo-year, 5 min = 0.81 in
s = 0.3333 ft/ft
Tt = 1 0.01931hr
Total Time of Concentration
Tt [0.1858:hr
A C-1 100-yearSheet Flow (4% slopes)n = 0.15
L = 142 ft
P100-year, 15 nin 1.56 in
s = 0.04 ft/ft
Tt = -0.23-46 1hr
A B-5 PMP
Sheet Flow (4% slopes)
n = 0.1L = 77 ft
PPMP, 5 min = 6.1 in
s = 0.04 ft/ft
T = 0.0526:hr
Sheet Flow (3:1 slopes)n = 0.1L = 2ft
PPMP, 5 min = 6.1 in
s = 0.3333 ft/ft
Tt = = "0.0012ihr
Total Time of Concentration
Tt = r 0.05 38-i hr
A B-6 PMP
Sheet Flow (4% slopes)n = 0.1L = 83 ft
PPMP, 5 min = 6.1 in
s = 0.04 ft/ft
T, 0.0558-hr
Sheet Flow (3:1 slopes)n = 0.1L 2ft
PPMP, 5 rin = 6.1 in
s = 0.3333 ft/ft
T, = -%90.0012 hr
Total Time of Concentration
Tt = F 0.057i hr
A C-1 PMP
Sheet Flow (4% slopes)n = 0.1
L = 142 ft
PPMP, 6 min = 6.45 in
s = 0.04 ft/ft
Tt = O.08341 hr
Sheet Flow (3:1 slopes)n = 0.1
L = 21 ft
PPMP, 5 min = 6.1 in
s = 0.3333 ft/ft
Tt = 0.0- o,8: hr
Total Time of Concentration
Tt = 0.0914ihr
short grass prairie
= 13.3min
short grass prairie
shortened due to ditch depth
= 10.1min
= ) 3imin
short grass prairie
= 3.2:min
short grass prairie
shortened due to ditch depth
= 0.11min= LI?1min
= 11min -- I [min
short grass prairie short grass prairie
S d0_! min: -14.11 min
Sheet Flow (3:1 slopes)
n = 0.15
L = 41 ft
P100-year, 5 min = 0.81 ins = 0.3333 ft/ft
Tt = L0.0516hr
Total Time of Concentration
Tt,= 0-.2863-:hr
short grass prairie
3.1; min
short grass prairie
shortened due to ditch depth
S10.5min
= 171min = 1i min
Calculation 388996-SW-01, Rev 3 Page 21 of 152

A C-2 100-yearSheet Flow (4% slopes)
n = 0.15L = 64 ft
P1oo-year, 9 min = 1.162 in
s = 0.04 ft/ftr . ... .. ...T, 0.1437hr
short grass prairie
- 8.6imin
short grass prairie
= 1.2;min
Sheet Flow (3:1 slopes)
nL
P1OO-year, 5 m~in-
5
0.15
12 ft
0.81 in
0.3333 ft/ft
i 0.0193'hr
Total Time of Concentration
= 0 .163;hr
A C-3 100-year
Sheet Flow (4% slopes)n = 0.15L = 66 ft
P1oo-year, 9 min = 1.162 in
s = 0.04 ft/ft
Tt= 0.14731hr
Sheet Flow (3:1 slopes)n = 0.15L = 12 ft
P1oo-year, 5 min = 0.81 in
s = 0.3333 ft/ft
SL-0.0193jhr
Total Time of Concentration
Tt 0.16661hr
A C-4 100-year
Sheet Flow (4% slopes)
n = 0.15
L = 82 ft
Pl00-year, 11 min = 1.312 in
s = 0.04 ft/ft
T,= L- 0.1649- hr
Sheet Flow (3:1 slopes)
n = 0.15
L = 14 ft
P100-year, 5 rin = 0.81 ins = 0.3333 ft/ft
mt =-002191 hr
Total Time of Concentration
T, IL= 0.1868,hr
10= min
short grass prairie
= 8.8"8min
short grass prairie
: 1-2min
A C-2 PMP
Sheet Flow (4% slopes)
n = 0.1L = 64 ft
PPMP, 5 rnin = 6.1 in
s = 0.04 ft/ft
Tt = 0.0453 hr
Sheet Flow (3:1 slopes)n = 0.1L = 2ft
PPMP, S min = 6.1 in
s = 0.3333 ft/ft
Tt = I 0.00121hr
Total Time of Concentration
T, 0= -04 66hr
A C-3 PMP
Sheet Flow (4% slopes)n = 0.1L 66 ft
PPMP, 5 min = 6.1 in
s = 0.04 ft/ft
T, = 0.04K65hr
Sheet Flow (3:1 slopes)n = 0.1
L = 2ft
PPMP, 5 min = 6.1 in
s = 0.3333 ft/ftT , = [-O -.'66 T2'• h r
Total Time of Concentration
Tt :0.04771hr
A C-4 PMP
Sheet Flow (4% slopes)n = 0.1L = 82 ft
PPMP, 5 min = 6.1 in
s = 0.04 ft/ft
Sheet Flow (3:1 slopes)
short grass prairie
S2.7min
I 3amin
short grass prairieshortened due to ditch depth
- 1O.lVmin
short grass prairie
S12.81mm
short grass prairieshortened due to ditch depth
= [-0--min
161 min= L-1-1 S31min
short grass prairie
= min
short grass prairie
short grass prairie
S3.3- minL _.
n
L
- 0.1 short grass prairie
= 2 ft shortened due to ditch depth
= 1.3;min
= 11!min
PPMP, 5 min = 6.1 ins = 0.3333 ft/ft
Tt = il 0.0012;hr
Total Time of Concentration.- 0-6-
Tt 10.0565!hr
= 10.1:min
- 31min
Calculation 388996-SW-01, Rev 3 Page 22 of 152

A C-5 100-yearSheet Flow (4% slopes)
n = 0.15
L = 90 ft
P100-year, 11 min = 1.312 in
s = 0.04 ft/ft
T, CAM7'7hr
Sheet Flow (3:1 slopes)
n = 0.15
L = 17 ft
P100-year, 5 rin = 0.81 in
s = 0.3333 ft/ft
T= f.0255ihr
Total Time of Concentration
Tt=, 0.2032 hr
A D-1 100-year
Sheet Flow (4% slopes)
n = 0.15
L = 71 ft
short grass prairie
= 10.7rmin
short grass prairie
= !1.5_min
A C-S PMPSheet Flow (4% slopes)
n = 0.1
L = 90 ft
PPMP, 5 min 6.1 in
s = 0.04 ft/ft
= 0.0596&hr
Sheet Flow (3:1 slopes)
n = 0.1
L = 3 ft
PPMP, 5 min = 6.1 in
s = 0.3333 ft/ft
T, = -0(OOl7hr
Total Time of Concentrationr-- .. --
T, = 0.0612 1hr
A D-1 PMPSheet Flow (4% slopes)n = 0.1
L = 71 ft
PPMP, 5 min = 6.1 in
s = 0.04 ft/ft
_ { 0.04931 hr
short grass prairie
- 3.6mmfi
short grass prairie
shortened due to ditch depth
= 0.1Omin
- 1 2!min - 4imin
short grass prairie short grass prairie
P100-year, 10 min
sTt
1.25 in
0.04 ft/ft
0.1506 hr = 9.90 min
short grass prairie
= 3.01min
Sheet Flow (3:1 slopes)n = 0.15
Sheet Flow (3:1 slopes)n = 0.1 short grass prairieL = 2 ft shortened due to ditch depthL
P 100.year, 5 min
5
= 14 ft
= 0.81 in
= 0.3333 ft/ft
= 0.0219%hrI.. -. - -1... .Z = 1.31min
S101.min
Total Time of Concentration
Tt,= 10.17241hr
A D-2Sheet Flow (4% slopes)n = 0.15
L = 129 ft
P155.year, 14 min
5
= 1.498 in
= 0.04 ft/ft
= 0.22171 hr
Sheet Flow (3:1 slopes)n = 0.15
L = 14 ft
P100-year, 5 min = 0.81 in
s = 0.3333 ft/ftSI.0.0219!hr
Total Time of Concentration
Tt= 0.24361hr
short grass prairie
I13.31min
short grass prairie
= 1.31min
SL1..35)min
PPMP,5min = 6.1 ins = 0.3333 ft/ft
= F -.-- -hITt : [0 .0 012ýIhr
Total Time of Concentration
Tt = I 0.05051hr
A D-2Sheet Flow (4% slopes)n = 0.1
L = 129 ft
PPMP, 5 min 6.1 ins = 0.04 ft/ft
Tt = '-O1.-7941hr
Sheet Flow (3:1 slopes)n = 0.1L = 2ft
PPMP, 5 in = 6.1 in
s = 0.3333 ft/ft
Tt = F O.O0121hr
Total Time of Concentration
Tt : -0,0807Ahr
short grass prairie
- •4.8min
iO-I 0lmin
I ~3ýmin
short grass prairieshortened due to ditch depth
: 0._Imin
S•5imm
Calculation 388996-SW-01, Rev 3 Page 23 of 152
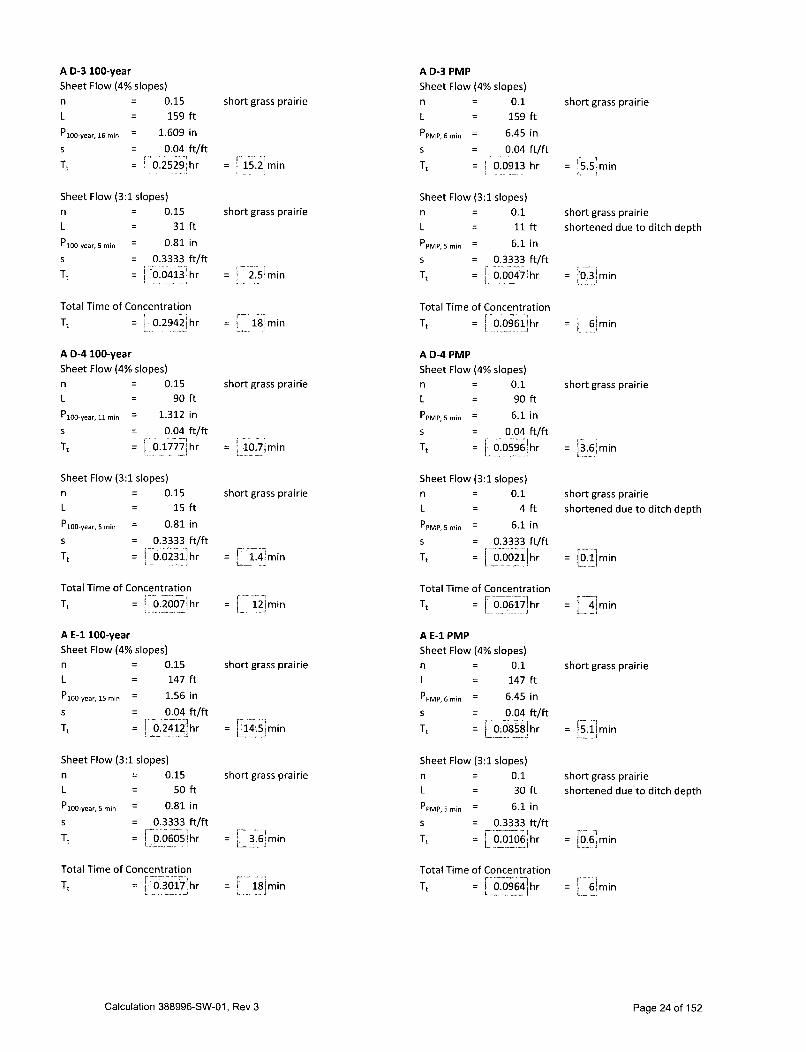
A D-3 100-year
Sheet Flow (4% slopes)n = 0.15
L = 159 ft
P100-year, 16 min 1.609 in
s = 0.04 ft/ft
Tt= 0.2529thr
Sheet Flow (3:1 slopes)n = 0.15
L = 31ft
P10o-year, 5 rain = 0.81 in
s = 0.3333 ft/ft
Tt = 0.04413' hr
Total Time of Concentration
T,= 0.29421 hr
A D-4 100-year
Sheet Flow (4% slopes)n = 0.15
L = 90 ft
P100-year, 11 min = 1.312 in
s = 0.04 ft/ft
Tt 0. 177.7 hr
Sheet Flow (3:1 slopes)n = 0.15
L = 15 ft
P1oo-year, 5 min -= 0.81 in
s = 0.3333 ft/ft
Tt = 0.0231 hr
Total Time of Concentration
Tt = 0.2007ihr
A E-1 100-year
Sheet Flow (4% slopes)n = 0.15
L = 147 ft
P100-year, 15 min 1.56 in
s = 0.04 ft/ft
Tt :0:2472ihr
Sheet Flow (3:1 slopes)n = 0.15
L = 50ft
P1oo-year, 5 min = 0.81 ins = 0.3333 ft/ft
Tt = 0.0605 hr
Total Time of Concentration
T, = 0.3017hr
short grass prairie
= : 15.2 min
short grass prairie
. 2.51min
A D-3 PMP
Sheet Flow (4% slopes)
n = 0.1
L = 159 ft
PPMP, 6 min = 6.45 in
s = 0.04 ft/ft
Tt = 0.0913 hr
Sheet Flow (3:1 slopes)n = 0.1
L = lift
PPMP, 5 min = 6.1 in
s = 0.3333 ft/ft
Tt = 0.0-0471 h r
Total Time of Concentration
Tt r-.0= 9006-911hr
A D-4 PMP
Sheet Flow (4% slopes)n = 0.1L = 90 ft
PPMP, 5 min = 6.1 ins = 0.04 ft/ft
ZT L 0.05"961 hr
short grass prairie
! 5.5.min
short grass prairieshortened due to ditch depth
= _03Imin
= 18- min S6min
short grass prairie
= 10.7,min
short grass prairie
= -.4 1 min
short grass prairie
= 3.6min
Sheet Flow (3:1 slopes)n = 0.1 short grass prairieL = 4 ft shortened due to ditch depth
PPMP, 5 min = 6.1 in
s = 0.3333 ft/ft
Tt =0. [O.00212hr = {9.ljmin
12 !~min
short grass prairie
= B4'min
short grass prairie
S3.6min
Total Time of ConcentrationTtF-_6.66i7] h r
A E-1 PMPSheet Flow (4% slopes)n = 0.1
L = 147 ft
PPMP, 6 min = 6.45 in
s = 0.04 ft/ft
T, = 0.0858 hr
Sheet Flow (3:1 slopes)
n = 0.1L 30 ft
PPMP, 5 min = 6.1 in
s = 0.3333 ft/ft
T, = F 00106!hr
Total Time of Concentration
T, 10 = * -06"4hr
= L_4min
short grass prairie
- [!.Imin
short grass prairieshortened due to ditch depth
[0.6, min
= 181min - 6- min
Calculation 388996-SW-01, Rev 3 Page 24 of 152

A E-2 100-yearSheet Flow (4% slopes)
nL
P100-year, 12 min
s
= 0.15
= 101 ft
= 1.374 in
= 0.04 ft/ft
= 0.1904'hr
short grass prairie
=i 11.4:mm
Sheet Flow (3:1 slopes)
nL
P10O-year, 5 min
5
= 0.15= 17 ft
= 0.81 in
= 0.3333 ft/ft
0 .:02551hr
short grass prairie
1.5ýmin
A E-2 PMP
Sheet Flow (4% slopes)
n = 0.1L = 101ft
PPMP, 5 min 6.1 in
s = 0.04 ft/ft
ZT = 0.06531hr
Sheet Flow (3:1 slopes)n 0.1L = 4ft
PPMP, 5 min = 6.1 in
s = 0.3333 ft/ft
T, = 0.0021_hr
Total Time of Concentration
Tt 0=.06741hr
A E-3 PMPSheet Flow (4% slopes)n = 0.1L = 85 ft
short grass prairie
shortened due to ditch depth
-- 0.1min
short grass prairie
- 3.9imin
Total Time of Concentration
Tt= 0. 2159! hr
A E-3 100-yearSheet Flow (4% slopes)n = 0.15L = 85 ft
Ploo-year, 11rmin = 1.312 in
s = 0.04 ft/ft
Zt = 0,16971hr
Sheet Flow (3:1 slopes)n = 0.15L = 15ft
P10-year, 5 min = 0.81 ins = 0.3333 ft/ft
T, = j 0.0231'hr
Total Time of Concentration
T,= 0.1928!hr
A E-4 100-yearSheet Flow (4% slopes)n = 0.15L = 192 ft
P100-year, 18 min = 1.708 ins 0.04 ft/ft
Tt= -0.28551 hr
- 13m mi - 4,min
short grass prairie
PPMP, 5 mnif
5
= 6.1 in
= 0.04 ft/ft
= 0.0569ihr10.2i min
short grass prairie
short grass prairie
= 3.4• min
short grass prairie
shortened due to ditch depth
SiO.1jmin
Sheet Flow (3:1 slopes)n = 0.1
L = 4ft
PPMP,5min = 6.1 ins = 0.3333 ft/ft
= 1 _,min T, o--: gi_ h.... = 0: 00211 h r
F12mi
short grass prairie
[17 1mn
short grass prairie
= V 35 min
Total Time of Concentration
mt = L_0.059hr
A E-4 PMPSheet Flow (4% slopes)n = 0.1L = 192 ft
PPMP, 7 rain 6.8 in
s = 0.04 ft/ft
Tt = 0 10034 hhr
Sheet Flow (3:1 slopes)n = 0.1L = 40 ft
PPMP, 5 min = 6.1 in
s = 0.3333 ft/ft
Tt := L0. 03,33. h r
Total Time of Concentration
t = 0.1168j hr
I 4.min
short grass prairie
= 6.2 mi
Sheet Flow (3:1 slopes)n
L
Ploo-year, 5 min
Tt
= 0.15= 52 ft
= 0.81 in
= 0.3333 ft/ft= O.6241hr
short grass prairie
shortened due to ditch depth
- 0_min
Total Time of Concentration
Tt,= 0.3479hrL_ .. .. . .- - . 21Vmin - i7jmin
Calculation 388996-SW-01, Rev 3 Page 25 of 152

A E-5 100-yearSheet Flow (4% slopes)n = 0.15
L = 149 ft
P100-year, 15 min 1.56 in
s = 0.04 ft/ft
Tt : 0.243"91 hr
Sheet Flow (3:1 slopes)
n = 0.15L = 69 ft
P100-year, 5 min = 0.81 in
s = 0.3333 ft/ft
T, = F 0.0783ihr
Total Time of Concentration
Tt = 0.3221:hr
A E-6 100-yearSheet Flow (4% slopes)n = 0.15
L = 173 ft
P1oo-year, 17 min 1.659 in
s = 0.04 ft/ft
T= 0.2665'hr
Sheet Flow (3:1 slopes)n = 0.15L = 69 ft
P100-year, s min = 0.81 in
s = 0.3333 ft/ft
T, = [.0 7,3j hr
Total Time of Concentrationi
Tt = ¶0.3448hr
A E-7 100-yearSheet Flow (4% slopes)n = 0.15
L 149 ft
P100-year, 15 = 1.56 in
s = 0.04 ft/ft
Tt F0.= {02439] hr
Sheet Flow (3:1 slopes)n = 0.15
L = 69 ft
short grass prairie
1 -4.6 min
short grass prairie
. 4.7:min
19 -4min
A E-5 PMPSheet Flow (4% slopes)
n = 0.1
L = 149 ft
PPMP, 6 min = 6.45 in
s = -- 0.04 ft/ft
Tt = 0.0867ihr
Sheet Flow (3:1 slopes)
n = 0.1L = 57 ft
PPMP, 5 min = 6.1 in
s = 0.3333 ft/ft
Tt = 0.O1i77 hr
Total Time of Concentration
Tt = 0.1044ihr
A E-6 PMP
Sheet Flow (4% slopes)n = 0.1L = 173 ft
PPMP, 6 i = 6.45 in
s = 0.04 ft/ftT, L a-_ h r
Sheet Flow (3:1 slopes)n = 0.1
L = 54 ft
PPMP, 5 min = 6.1 in
s = 0.3333 ft/ft
Tt = L_.0.0171hr
Total Time of Concentration
Tt 11477 hr
A E-7 PMPSheet Flow (4% slopes)n = 0.1
short grass prairieshortened due to ditch depth
= 1.1_min
short grass prairie
Sý5.2 min
- 6ýmin
short grass prairie
F !-i6.01 amin
short grass prairie
: 4i--j7! min
short grass prairie
-- I 5min
short grass prairie
shortened due to ditch depth
S1.01 min
= 21mm S71min
short grass prairie
= Lgrss prmin
short grass prairie
L
PPMP, 6 mnir
5
= 149 ft
= 6.45 in
= 0.04 ft/ft
- Oý.8671hr
short grass prairie
is.21min
short grass prairie
shortened due to ditch depth
- (Ojmin
Sheet Flow (3:1 slopes)n = 0.1
L = 48 ft
P1OO-year, 5 min
5
= 0.81 in
= 0.3333 ft/ft=!0.0783• 1h r
PPMP, 5 min = 6.1 ins = 0.3333 ft/ft
=F47 i•-min Tt = FO0 5 0
Total Time of Concentration
T, [0.32211h = Fi~lmin
Total Time of Concentration
mt = V0.1021hr - i6min
Calculation 388996-SW-01, Rev 3 Page 26 of 152

Honeywell Pond ClosurePMP Calculation Using HMR 51 (Steps from Section 5) and HMR 52 (Section 6)
References:Hydrometorological Report No. 51, Probable Maximum Precipitation Estimates,
United States East of the 105th Meridian (HMR 51)
NOAA Hydrometorological Report No. 52, Application of Probable MaximumPrecipitation Estimates, United States East of the 105th Meridian (HMR 52)
Step 1. All-season PMP (inches) for Metropolis, Illinois (HMR 51 5.a & b)
Duration Drainage Area (square miles)
(hours) 10 200 1000 5000 10000 20000
6 28.7 21 15.5 9.2 7.1 5.1
12 34 25.2 19.2 13 10.3 8.1
24 36.2 27.3 21.8 15.2 12.6 10.3
48 40 30.5 25 18.6 15.9 13.4
72 42 32.4 26.5 20.2 17.6 15
Step 2. Ratio of 1-hr point to 6-hr 10-mi2 precipitation (HMR 52 Figure 23)
0.647
Step 3. 1-hr point precipitation = ratio from Step 2 multiplied by 6-hr 10-mi2
precipitation from Step 1
18.6 inches
Step 4. Ratios of 5-min, 15-min, and 30-min to 1-hr precipitation for areas < 200 mi2
5-min 0.330 (HMR 52 Figure 36)
15-min 0.519 (HMR 52 Figure 37)
30-min 0.746 (HMR 52 Figure 38)
Step 5. 5-min, 15-min, and 30-min precipitation = ratio from Step 4 multiplied by 1-hr
precipitation from Step 3
5-min 6.1 inches
15-min 9.6 inches
30-min 13.9 inches
Step 6. Plot the 5-min, 15-min, 30-min, and 1-hr values to obtain precipitations for other
durations obtained from T, calculations
Duration (min) PMP (inches)
5 6.1
15 9.6
30 13.9
60 18.6
Calculation 388996-SW-01, Rev 3 Page 27 of 152

Depth vs. Duration70
60
50
E 40
.20 30- 301-0-1 square mile
20
10
00 5 10 15 20
All-Season PMP (inches)
Interpolation from the Depth vs. Duration graph
Tc (min) PMP (in) Intensity (in/hr)
6 6.5 65.07 6.8 58.3
8 7.2 54.0
9 7.5 50.0
10 7.9 47.411 8.2 44.712 8.6 43.013 8.9 41.114 9.3 39.9
Calculation 388996-SW-01, Rev 3 Page 28 of 152

Honeywell Pond Closure
Peak Flow Calculations - 100-year event
Interpolation from the NOAA ATLAS 14 graphs for the 100-year event
Intensity(in/hr)
5 9.78
6 9.327 8.86
8 8.41
9 7.95
10 7.49
11 7.24
12 6.99
13 6.74
14 6.49
15 6.24
16 6.13
17 6.02
18 5.91
19 5.80
20 5.69
21 5.58
Area ID Area Frequency Method RunoffCoef Intensity TimeofConc PeakFlow(acres) (in/hr) (min) (cfs)
Pond B
A B-1 0.49 100 Mod. Rational 0.95 6.02 17 2.80
A B-2 0.18 100 Mod. Rational 0.95 7.49 10 1.28
A B-3 0.31 100 Mod, Rational 0.95 7.49 10 2.21
A B-4 0.11 100 Mod. Rational 0.95 6.13 16 0.64
A B-5 0.21 100 Mod. Rational 0.95 7.24 11 1.44
A B-6 0.26 100 Mod, Rational 0.95 7.24 11 1.79
Pond B Total 1.56 10.16
Pond CA C-1 0.49 100 Mod, Rational 0.95 6.02 17 2.80
A C-2 0.19 100 Mod, Rational 0.95 7.49 10 1.35
A C-3 0.19 100 Mod. Rational 0.95 7.49 10 1.35
A C-4 0.15 100 Mod, Rational 0.95 7.24 11 1.03
A C-5 0.57 100 Mod. Rational 0.95 6.99 12 3.79
Pond C Total 1.59 10.32
Pond D
A D-1 0.24 100 Mod. Rational 0.95 7.49 10 1.71
A D-2 0.25 100 Mod. Rational 0.95 6.24 15 1.48
A D-3 0.85 100 Mod. Rational 0.95 5.91 18 4.77
A D-4 0.26 100 Mod. Rational 0.95 6.99 12 1.73
Pond D Total 1.60 9.69
Pond E
A E-1 0.92 100 Mod. Rational 0.95 5.91 18 5.17
A E-2 0.63 100 Mod. Rational 0.95 6.74 13 4.03
A E-3 0.37 100 Mod. Rational 0.95 6.99 12 2.46
A E-4 1.08 100 Mod. Rational 0.95 5.58 21 5.73
A E-5 0.66 100 Mod. Rational 0.95 5.80 19 3.64
A E-6 1.33 100 Mod. Rational 0.95 5.58 21 7.05
A E-7 0.80 100 Mod. Rational 0.95 5.80 19 4.41
Pond E Total 5.79 32.48
Totals 10.54 62.65
Calculation 388996-SW-01, Rev 3 Page 29 of 152

Honeywell Pond Closure
Peak Flow Calculations - PMP event
From the PMP calculations
Intensity(in/hr)
3 73.2
4 73.2
5 73.2
6 65.0
7 58.3
8 54.0
9 50.0
10 47.4
Area IDAreaAcres Frequency
(acres) Method RunoffCoefIntensity
(in/fr)TimeofConc PeakFlow
(min) (cfs)Pond B
A B-1 0.49 N/A Mod. Rational 1.00 65.0 6 31.85
A B-2 0.18 N/A Mod. Rational 1.00 73.2 3 13.18
A B-3 0.31 N/A Mod. Rational 1.00 73.2 3 22.69
A B-4 0.11 N/A Mod. Rational 1.00 65.0 6 7.15
A B-5 0.21 N/A Mod. Rational 1.00 73.2 3 15.37
A B-6 0.26 N/A Mod. Rational 1.00 73.2 3 19.03
Pond B Total 1.56 109.27
Pond C
A C-1 0.49 N/A Mod. Rational 1.00 73.2 5 35.87
A C-2 0.19 N/A Mod. Rational 1.00 73.2 3 13.91
A C-3 0.19 N/A Mod. Rational 1.00 73.2 3 13.91
A C-4 0.15 N/A Mod. Rational 1.00 73.2 3 10.98
A C-5 0.57 N/A Mod. Rational 1.00 73.2 4 41.72
Pond C Total 1.59 116.39
Pond D
A D-1 0.24 N/A Mod. Rational 1.00 73.2 3 17.57
A D-2 0.25 N/A Mod. Rational 1.00 73.2 5 18.30
A D-3 0.85 N/A Mod. Rational 1.00 65.0 6 55.25
A D-4 0.26 N/A Mod. Rational 1.00 73.2 4 19.03
Pond D Total 1.60 110.15
Pond E
A E-1 0.92 N/A Mod. Rational 1.00 65.0 6 59.80
A E-2 0.63 N/A Mod. Rational 1.00 73.2 4 46.12
A E-3 0.37 N/A Mod. Rational 1.00 73.2 4 27.08
A E-4 1.08 N/A Mod. Rational 1.00 58.3 7 62.95
A E-5 0.66 N/A Mod. Rational 1.00 65.0 6 42.90
A E-6 1.33 N/A Mod. Rational 1.00 58.3 7 77.52
A E-7 0.80 N/A Mod. Rational 1.00 65.0 6 52.00
Pond E Total 5.79 368.37
Totals 10.54 704.18
Calculation 388996-SW-01, Rev 3 Page 30 of 152

Honeywell Pond Closure
Ditch Total Flows - 100-year event
Discharge Point 1DP1-8Flow From A (AC) Q (cfs)A B-2 0.18 1.28Totals 0.18 1.28
Discharge Point 2DP2-2
Flow From A (AC) Q (cfs)
A E-4 1.08 5.73Totals 1.08 5.73
Discharge Point 3DP3-6Flow From A (AC) Q (cfs)
A B-3 0.31 2.21Totals 0.31 2.21
DP1-7Flow FromDP1-8A B-1Totals
DP1-6Flow FromA B-6A C-2
Totals
DPI-S
Flow FromDP1-6DP1-7A C-1Totals
DP1-4Flow From
A C-5A E-2Totals
DP1-3Flow From
DP1-4DPi-5A E-1
Totals
DP1-2
Flow From
DP1-3A E-7Totals
DPI-1
Flow From
A E-6Totals
A (AC) Q(cfs)0.18 1.280.49 2.800.67 4.08
A(AC) Q(cfs)
0.26 1.790.19 1.35
0.45 3.14
A (AC) Q(cfs)0.45 3.14
0.67 4.08
0.49 2.801.61 10.03
A (AC) Q(cfs)
0.57 3.790.63 4.031.20 7.82
A (AC) Q(cfs)1.20 7.82
1.61 10.030.92 5.17
3.73 23.01
A (AC) Q(cfs)3.73 23.01
0.80 4.414.53 27.42
A (AC) Q(cfs)
1.33 7.051.33 7.05
DP2-1Flow FromA E-5Totals
A (AC) Q (cfs)0.66 3.640.66 3.64
DP2Flow From A (AC) Q (cfs)DP2-1 0.66 3.64DP2-2 1.08 5.73Totals 1.74 9.36
DP3-5
Flow FromA B-5A C-3Totals
DP3-4Flow FromA D-1A C-4
A B-4DP3-5DP3-6
Totals
DP3-3Flow FromDP3-4
A D-2Totals
DP3-2Flow FromA D-4A E-3Totals
DP3-1Flow From
DP3-3
A D-3Totals
A (AC) Q(cfs)0.21 1.44
0.19 1.350.40 2.80
A (AC) Q (cfs)
0.24 1.710.15 1.03
0.11 0.640.40 2.80
0.31 2.21
1.21 8.38
A (AC) O(cfs)
1.21 8.380.25 1.481.46 9.86
A (AC) Q(cfs)0.26 1.730.37 2.460.63 4.18
A(AC) Q(cfs)
1.46 9.86
0.85 4.772.31 14.64
DP3
Flow From A (AC) Q (cfs)DP3-1 2.31 14.64DP3-2 0.63 4.18Totals 2.94 18.82
DPI
Flow From A (AC) Q(cfs)DPi-1 1.33 7.05DP1-2 4.53 27.42Totals 5.86 34.47
Calculation 388996-SW-01, Rev 3 Page 31 of 152

Worksheet for DPI_100-year
[Project Description
Friction Method
Solve For
Lput Data --
Roughness Coefficient
Channel Slope
Left Side Slope
Right Side Slope
Discharge
EResu Its
Manning Formula
Normal Depth
0.035
0.01000
2.00
2.00
34.47
Normal Depth
Flow Area
Wetted Perimeter
Hydraulic Radius
Top Width
Critical Depth
Critical Slope
Velocity
Velocity Head
Specific Energy
Froude Number
Flow Type
Downstream Depth
Length
Number Of Steps
'GVF Output Data
Upstream Depth
Profile Description
Profile Headloss
Downstream Velocity
Upstream Velocity
Normal Depth
Critical Depth
Channel Slope
Critical Slope
2.07
8.55
9.25
0.92
8.27
1.79
0.02149
4.03
0.25
2.32
0.70
Subcritical
ft/ft
ft/ft (H:V)
ft/ft (H:V)ftc/s
ftft2
ft
ft
ft
ft
ft/ft
ft/s
ft
ft
0.00 ft
0.00 ft
0
-- _~~~1~0.00 ft
0.00 ft
Infinity ft/s
Infinity ft/s
2.07 ft
1.79 ft
0.01000 ft/ft
0.02149 ft/ft
Bentley Systems, Inc. Haestad Methods SolBkdot14efbwMaster V8i (SELECTseries 1) [08.11.01.03]27 Siemons Company Drive Suite 200 W Watertown, CT 06795 USA +1-203-755-1666 Page 1 of 19/5/2012 12:11:32 PM
Calculation 388996-SW-01, Rev 3 Page 32 of 152

jiroýject Description
Friction Method
Solve For
Onput Data
Roughness Coefficient
Channel Slope
Left Side Slope
Right Side Slope
Discharge
...suits
Worksheet for DPI-l 100-year
Manning Formula
Normal Depth
0.035
0.01000
3.00
2.00
7.05
ft/ft
ft/ft (H:V)
ft/ft (H:V)
ft3/s
iI!7.f 77]Normal Depth
Flow Area
Wetted Perimeter
Hydraulic Radius
Top Width
Critical Depth
Critical Slope
1.04
2.70
5.61
0.48
5.20
0.87
0.02611
ftft2
ft
ft
ft
ft
ft/ft
ft/s
ft
ft
Velocity 2.61
Velocity Head 0.11
Specific Energy 1.15
Froude Number 0.64
Flow Type Subcritical
SFD-t- Data
Downstream Depth
Length
Number Of Steps
GVFOututbata
Upstream Depth
Profile Description
Profile Headloss
Downstream Velocity
Upstream Velocity
Normal Depth
Critical Depth
Channel Slope
Critical Slope
0.00 ft
0.00 ft
0
0.00 ft
0.00 ft
Infinity ft/s
Infinity ft/s
1.04 ft
0.87 ft
0.01000 ft/ft
0.02611 ft/ft
Bentley Systems, Inc. Haestad Methods SolBtiatldýrbMaster V8i (SELECTseries 1) [08.11.01.03]27 Siemons Company Drive Suite 200 W Watertown, CT 06795 USA +1-203-755-1666 Page 1 of 19/4/2012 4:57:10 PM
Calculation 388996-SW-01, Rev 3 Page 33 of 152

Worksheet for DPI-2 100-year
.Iroject Description
Friction Method
Solve For
.hput Data
Roughness Coefficient
Channel Slope
Left Side Slope
Right Side Slope
Discharge
["esu ts
Manning Formula
Normal Depth
0.035
0.01000
3.00
2.00
27.42
Normal Depth
Flow Area
Wetted Perimeter
Hydraulic Radius
Top Width
Critical Depth
Critical Slope
Velocity
Velocity Head
Specific Energy
Froude Number
Flow Type
.ýVF Iput Data
Downstream Depth
Length
Number Of Steps
r.-", . ... . .. .. ...G-VF Output DataT
Upstream Depth
Profile Description
Profile Headloss
Downstream Velocity
Upstream Velocity
Normal Depth
Critical Depth
Channel Slope
Critical Slope
1.73
7.49
9.34
0.80
8.65
1.50
0.02178
3.66
0.21
1.94
0.69
Subcritical
ft/ft
ft/ft (H:V)
ft/ft (H:V)ft3/s
ftft2
ft
ft
ft
ft
ft/ft
ft/s
ft
ft
0.00
0.00
0
ft
ft
0.00 ft
0.00 ft
Infinity ft/s
Infinity ft/s
1.73 ft
1.50 ft
0.01000 ft/ft
0.02178 ft/ft
Bentley Systems, Inc. Haestad Methods SolBbatiod•egwMaster V8i (SELECTseries 1) [08.11.01.03]27 Siemons Company Drive Suite 200 W Watertown, CT 06795 USA +1-203-755-1666 Page 1 of 19/5/2012 12:10:50 PM
Calculation 388996-SW-01, Rev 3 Page 34 of 152

Worksheet for DPl-3 100-year
;,Project Description
Friction Method
Solve For
Manning Formula
Normal Depth
[Inpubt Data
Roughness Coefficient
Channel Slope
Left Side Slope
Right Side Slope
Discharge
seuits
Normal Depth
Flow Area
Wetted Perimeter
Hydraulic Radius
Top Width
Critical Depth
Critical Slope
Velocity
Velocity Head
Specific Energy
Froude Number
Flow Type
',GVF_.I~n~ut- Data
0.035
0.01000
3.00
2.00
23.01
1.62
6.56
8.75
0.75
8.10
1.39
0.02230
3.51
0.19
1.81
0.69
ft/ft
ft/ft (H:V)
ft/ft (H:V)
ft3/s
ftft2
ft
ft
ft
ft
ft/ft
ft/s
ft
ft
Subcritical
Downstream Depth
Length
Number Of Steps
GF OutputData .
Upstream Depth
Profile Description
Profile Headloss
Downstream Velocity
Upstream Velocity
Normal Depth
Critical Depth
Channel Slope
Critical Slope
0.00 ft
0.00 ft
0
0.00 ft
0.00 ft
Infinity ft/s
Infinity ft/s
1.62 ft
1.39 ft
0.01000 ft/ft
0.02230 ft/ft
Bentley Systems, Inc. Haestad Methods SolBkintld•rrAwuwMaster V8i (SELECTseries 1) [08.11.01.03]27 Siemons Company Drive Suite 200 W Watertown, CT 06795 USA +1-203-755-1666 Page 1 of I9/4/2012 4:56:02 PM
Calculation 388996-SW-01, Rev 3 Page 35 of 152

Worksheet for DPI-4 100-year
Prject Description
Friction Method Manning Formula
Solve For Normal Depth
1Input Data .. . ... i iRoughness Coefficient 0.035
Channel Slope 0.01000 ft/ft
Left Side Slope 2.00 ft/ft (H:V)
Right Side Slope 2.00 ft/ft (H:V)
Discharge 7.82 ft3/s
Normal Depth 1.19 ft
Flow Area 2.81 ft2
Wetted Perimeter 5.30 ft
Hydraulic Radius 0.53 ft
Top Width 4.74 ft
Critical Depth 0.99 ft
Critical Slope 0.02619 ft/ft
Velocity 2.78 ft/s
Velocity Head 0.12 ft
Specific Energy 1.31 ft
Froude Number 0.64
Flow Type Subcritical
OW Inut D ta J - _
Downstream Depth 0.00 ft
Length 0.00 ft
Number Of Steps 0
GVF Output Dt
Upstream Depth 0.00 ft
Profile Description
Profile Headloss 0.00 ft
Downstream Velocity Infinity ft/s
Upstream Velocity Infinity ft/s
Normal Depth 1.19 ft
Critical Depth 0.99 ft
Channel Slope 0,01000 ft/ft
Critical Slope 0.02619 ft/ft
Bentley Systems, Inc. Haestad Methods SolBklottd•eFvwMaster V8i (SELECTseries 1) [08.11.01.03]9/4/2012 4:55:28 PM 27 Siemons Company Drive Suite 200 W Watertown, CT 06795 USA +1-203-755-1666 Page 1 of 1
Calculation 388996-SW-01, Rev 3 Page 36 of 152

Worksheet for DPI-5 100-year
P.roject Description
Friction Method
Solve For
Iput Data_
Roughness Coefficient
Channel Slope
Left Side Slope
Right Side Slope
Discharge
iI uJts
Normal Depth
Flow Area
Wetted Perimeter
Hydraulic Radius
Top Width
Critical Depth
Critical Slope
Velocity
Velocity Head
Specific Energy
Froude Number
Flow Type
GVF Input Data
Downstream Depth
Length
Number Of Steps
LVF Output Data
Upstream Depth
Profile Description
Profile Headloss
Downstream Velocity
Upstream Velocity
Normal Depth
Critical Depth
Channel Slope
Critical Slope
J
Manning Formula
Normal Depth
0.035
0.01000
3.00
2.00
10.03
1.19
3.52
6.41
0.55
5.93
1.00
0.02491
2.85
0.13
1.31
0.65
ft/ft
ft/ft (H:V)
ft/ft (H:V)
ft3/s
111.1]ftft2
ft
ft
ft
ft
ft/ft
ft/s
ft
ft
Subcritical
0.00 ft
0.00 ft
0
0 .77 - 7707
0.00 ft
0.00 ft
Infinity ft/s
Infinity ft/s
1.19 ft
1.00 ft
0.01000 ft/ft
0.02491 ft/ft
Bentley Systems, Inc. Haestad Methods SolBk~ottd4hwMaster V8i (SELECTseries 1) [08.11.01.03]27 Siemons Company Drive Suite 200 W Watertown, CT 06795 USA +1-203-755-1666 Page 1 of 19/4/2012 4:54:53 PM
Calculation 388996-SW-01, Rev 3 Page 37 of 152

1P,,roject Description
Friction Method
Solve For
Worksheet for DP1-6 100-year
Manning Formula
Normal Depth
Iiropt Dataa
Roughness Coefficient
Channel Slope
Left Side Slope
Right Side Slope
Discharge
Normal Depth
Flow Area
Wetted Perimeter
Hydraulic Radius
Top Width
Critical Depth
Critical Slope
Velocity
Velocity Head
Specific Energy
Froude Number
Flow Type Subcritical
0.035
0.01000
2.00
2.00
3.14
0.84
1.42
3.77
0.38
3.37
0.69
0.02957
2.21
0.08
0.92
0.60
ft
ft2
ft
ft
ft
ft
ft/ft
ft/s
ft
ft
ft/ft
ft/ft (H:V)
ft/ft (H:V)
ftI/s
Downstream Depth
Length
Number Of Steps
Upstream Depth
Profile Description
Profile Headloss
Downstream Velocity
Upstream Velocity
Normal Depth
Critical Depth
Channel Slope
Critical Slope
0.00 ft
0.00 ft
0
0 ft __
0.00 ft
0.00 ft
Infinity ft/sInfinity ft/s
0.84 ft
0.69 ft
0.01000 ft/ft
0.02957 ft/ft
Bentley Systems, Inc. Haestad Methods SolBot1dod wvMaster V8i (SELECTseries 1) [08.11.01.03]27 Siemons Company Drive Suite 200 W Watertown, CT 06795 USA +1-203-755-1666 Page 1 of 19/4/2012 4:54:20 PM
Calculation 388996-SW-01, Rev 3 Page 38 of 152

Worksheet for DP1-7 100-year
iýoJqe-t Description
Friction Method
Solve For
Manning Formula
Normal Depth
16u"Data"'
Roughness Coefficient
Channel Slope
Left Side Slope
Right Side Slope
Discharge
[Fsuits
Normal Depth
Flow Area
Wetted Perimeter
Hydraulic Radius
Top Width
Critical Depth
Critical Slope
Velocity
Velocity Head
Specific Energy
Froude Number
Flow Type Subcritical
NGFInput Data
Downstream Depth
Length
Number Of Steps
Upstream Depth
Profile Description
Profile Headloss
Downstream Velocity
Upstream Velocity
Normal Depth
Critical Depth
Channel Slope
Critical Slope
0.035
0.01000
3.00
2.00
4.08
0.85
1.79
4.57
0.39
4.23
0.70
0.02808
2.28
0.08
0.93
0.62
ft/ft
ft/ft (H:V)
ft/ft (H:V)
ft3/s
Zifli]ftft2
ft
ft
ft
ft
ft/ft
ft/s
ft
ft
0.00 ft
0.00 ft
0
0.00 ft
In
In
0.00 ft
finity ft/s
finity ft/s
0.85 ft
0.70 ft
1000 ft/ft
2808 ft/ft
0.0
0.0.
Bentley Systems, Inc. Haestad Methods SoIBtIottd;4*wMaster V8i (SELECTseries 1) [08.11.01.03]27 Siemons Company Drive Suite 200 W Watertown, CT 06795 USA +1-203-755-1666 Page 1 of I9/4/2012 4:53:54 PM
Calculation 388996-SW-01, Rev 3 Page 39 of 152

Worksheet for DPI-8 100-year
F~roject Description I -
Friction Method
Solve For
Inp D at
Roughness Coefficient
Channel Slope
Left Side Slope
Right Side Slope
Discharge
I~esults
Normal Depth
Flow Area
Wetted Perimeter
Hydraulic Radius
Top Width
Critical Depth
Critical Slope
Velocity
Velocity Head
Specific Energy
Froude Number
Flow Type
•GVF Dnput Data
Downstream Depth
Length
Number Of Steps
jGVF Output? Data .
Upstream Depth
Profile Description
Profile Headloss
Downstream Velocity
Upstream Velocity
Normal Depth
Critical Depth
Channel Slope
Critical Slope
Manning Formula
Normal Depth
0.035
0.01000
3.00
2.00
1.28
0.55
0.75
2.96
0.25
2.74
0.44
0.03278
1.70
0.05
0.59
0.57
ft/ft
ft/ft (H:V)
ft/ft (H:V)ft3/s
ftft2
ft
ft
ft
ft
ft/ft
ft/s
ft
ft
Subcritical
0.00 ft
0.00 ft
0
0.00 ft
0.00
Infinity
Infinity
0.55
0.44
0.01000
0.03278
ft
ft's
ft/s
ft
ft
ft/ft
ft/ft
Bentley Systems, Inc. Haestad Methods SolBkoetld~MasterV8i (SELECTseries 1) [08.11.01.03]27 Siemons Company Drive Suite 200 W Watertown, CT 06795 USA +1-203-755-1666 Page 1 of 19/4/2012 4:44:54 PM
Calculation 388996-SW-01, Rev 3 Page 40 of 152

ProjectODescription.........
Worksheet for DP2_100-year
Friction Method
Solve For
i[n6put Data.. .
Roughness Coefficient
Channel Slope
Left Side Slope
Right Side Slope
Discharge
esuits
Normal Depth
Flow Area
Wetted Perimeter
Hydraulic Radius
Top Width
Critical Depth
Critical Slope
Velocity
Velocity Head
Specific Energy
Froude Number
Flow Type
'GF Input Data
Manning Formula
Normal Depth
j0.035
0.01000
2.00
2.00
9.36
ft/ft
ft/ft (H:V)
ft/ft (H:V)
ft3/s
1.27 ft
3.22 ft2
5.67 ft
0.57 ft
5.07 ft
1.06 ft
0.02557 ft/ft
2.91 ft/s
0.13 ft
1.40 ft
0.64
Subcritical
1Downstream Depth
Length
Number Of Steps
GVF'Output Data'
Upstream Depth
Profile Description
Profile Headloss
Downstream Velocity
Upstream Velocity
Normal Depth
Critical Depth
Channel Slope
Critical Slope
0.00
0.00
0
ft
ft
0.00 ft
0.00 ft
Infinity ft/s
Infinity ft/s
1.27 ft
1.06 ft
0.01000 ft/ft
0.02557 ft/ft
Bentley Systems, Inc. Haestad Methods SoIBatd~etdIAmMaster V8i (SELECTseries 1) [08.11.01.03]27 Siemons Company Drive Suite 200 W Watertown, CT 06795 USA +1-203-755-1666 Page 1 of 19/512012 12:12:48 PM
Calculation 388996-SW-01, Rev 3 Page 41 of 152

Worksheet for DP2-1 100-year
!Project Description
Friction Method Manning Formula
Solve For Normal Depth
nput Data
Roughness Coefficient 0.035
Channel Slope 0.01000 ft/ft
Left Side Slope 3.00 ft/ft (H:V)
Right Side Slope 2.00 ft/ft (H:V)
Discharge 3.64 ft3/s
LFesults
Normal Depth 0.81 ft
Flow Area 1.65 ft2
Wetted Perimeter 4.38 ft
Hydraulic Radius 0.38 ft
Top Width 4.06 ft
Critical Depth 0.67 ft
Critical Slope 0.02851 ft/ft
Velocity 2.21 ft/s
Velocity Head 0.08 ft
Specific Energy 0.89 ft
Froude Number 0.61
Flow Type Subcritical
'qVF -nu Data- - - - ._ _
Downstream Depth 0.00 ft
Length 0.00 ft
Number Of Steps 0
.GVF Output Data
Upstream Depth 0.00 ft
Profile Description
Profile Headloss 0.00 ft
Downstream Velocity Infinity ft/s
Upstream Velocity Infinity ft/s
Normal Depth 0.81 ft
Critical Depth 0.67 ft
Channel Slope 0.01000 ft/ft
Critical Slope 0.02851 ft/ft
Bentley Systems, Inc. Haestad Methods SolBliatid;rbwMaster V8i (SELECTseries 1) [08.11.01.03]9/5/2012 12:12:14 PM 27 Siemons Company Drive Suite 200 W Watertown, CT 06795 USA +1-203-755-1666 Page 1 of 1
Calculation 388996-SW-01, Rev 3 Page 42 of 152

Worksheet for DP2-2 100-year
Project Description
Friction Method
Solve For
Input Data
Roughness Coefficient
Channel Slope
Left Side Slope
Right Side Slope
Discharge
Normal Depth
Flow Area
Wetted Perimeter
Hydraulic Radius
Top Width
Critical Depth
Critical Slope
Velocity
Velocity Head
Specific Energy
Froude Number
Flow Type
ýGVF Input Data
Downstream Depth
Length
Number Of Steps
GF Output Data
Upstream Depth
Profile Description
Profile Headloss
Downstream Velocity
Upstream Velocity
Normal Depth
Critical Depth
Channel Slope
Critical Slope
Manning Formula
Normal Depth
0.035
0.01000
2.00
3.00
5.73
0.96
2.31
5.19
0.45
4.81
0.80
0.02684
2.48
0.10
1.06
0.63
ft/ft
ft/ft (H:V)
ft/ft (H:V)
ftl/s
ftft2
ft
ft
ft
ft
ft/ft
ft/s
ft
ft
Subcritical
0.00 ft
0.00 ft
0
ji0.00 ft
0.00
Infinity
Infinity
0.96
0.80
0.01000
0.02684
ft
ft/s
ft/s
ft
ft
ft/ft
ft/ft
Bentley Systems, Inc. Haestad Methods SolBljotld$ufvMaster V8i (SELECTseries 1) [08.11.01.03]27 Siemons Company Drive Suite 200 W Watertown, CT 06795 USA +1-203-755-1666 Page 1 of I9/4/2012 4:58:20 PM
Calculation 388996-SW-01, Rev 3 Page 43 of 152

Worksheet for DP3 100-year
I1yroject Description
Friction Method
Solve For
Manning Formula
Normal Depth
[nput Data .
Roughness Coefficient
Channel Slope
Left Side Slope
Right Side Slope
Discharge
Results
Normal Depth
Flow Area
Wetted Perimeter
Hydraulic Radius
Top Width
Critical Depth
Critical Slope
Velocity
Velocity Head
Specific Energy
Froude Number
Flow Type
GVF Input Data
__1
0.035
0.01000 ft/ft
2.00 ft/ft (H:V)
2.00 ft/ft (H:V)
18.82 ft3/s
1.65 ft
5.43 ft2
7.37 ft
0.74 ft
6.59 ft
1.41 ft
0.02329 ft/ft
3.46 ft/s
0.19 ft
1.83 ft
0.67
Subcritical
71]Downstream Depth
Length
Number Of Steps
GV\F Outp~ut Data __ __
Upstream Depth
Profile Description
Profile Headloss
Downstream Velocity
Upstream Velocity
Normal Depth
Critical Depth
Channel Slope
Critical Slope
0.00 ft
0.00 ft
0
0.00 ft
-- - -i
0.00 ft
Infinity ft/s
Infinity ft/s
1.65 ft
1.41 ft
0.01000 ft/ft
0.02329 ft/ft
Bentley Systems, Inc. Haestad Methods SolBtdotid;4OwMaster V8i (SELECTseries 1) [08.11.01.03]27 Siemons Company Drive Suite 200 W Watertown, CT 06795 USA +1-203-755-1666 Page 1 of 19/512012 12:15:15 PM
Calculation 388996-SW-01, Rev 3 Page 44 of 152

Worksheet for DP3-1_ 100-year
LP, roject -Description
Friction Method Manning Formula
Solve For Normal Depth
[in':put Dataa . .. ..
Roughness Coefficient 0.035
Channel Slope 0.01000 ft/ft
Left Side Slope 2.00 ft/ft (H:V)
Right Side Slope 3.00 ft/ft (H:V)
Discharge 14.64 ft3/s
iResults
Normal Depth 1.37 ft
Flow Area 4.68 ft2
Wetted Perimeter 7.38 ft
Hydraulic Radius 0.63 ft
Top Width 6.84 ft
Critical Depth 1.16 ft
Critical Slope 0.02368 ft/ft
Velocity 3.13 ft/s
Velocity Head 0.15 ft
Specific Energy 1.52 ft
Froude Number 0.67
Flow Type Subcritical
VF Input Data --... . ...
Downstream Depth 0.00 ft
Length 0.00 ft
Number Of Steps 0
'GVF Output Data -- -__ ___
Upstream Depth 0.00 ft
Profile Description
Profile Headloss 0.00 ft
Downstream Velocity Infinity ft/s
Upstream Velocity Infinity ft/s
Normal Depth 1.37 ft
Critical Depth 1.16 ft
Channel Slope 0.01000 ft/ft
Critical Slope 0.02368 ft/ft
Bentley Systems, Inc. Haestad Methods SolBtaotld•AmwMasterV8i (SELECTseries 1) [08.11.01.03]9/5/2012 12:14:48 PM 27 Siemons Company Drive Suite 200 W Watertown, CT 06795 USA +1-203-755-1666 Page 1 of 1
Calculation 388996-SW-01, Rev 3 Page 45 of 152

Worksheet for DP3-2 100-year
PIr0oject Description- ---- --_
Friction Method M
Solve For N
iqrjput Data
Roughness Coefficient
Channel Slope
Left Side Slope
Right Side Slope
Discharge
l~esults
Normal Depth
Flow Area
Wetted Perimeter
Hydraulic Radius
Top Width
Critical Depth
Critical Slope
Velocity
Velocity Head
Specific Energy
Froude Number
Flow Type S
qy Input Data
Downstream Depth
Length
Number Of Steps
DVF Output a.ta
Upstream Depth
Profile Description
Profile Headloss
Downstream Velocity
Upstream Velocity
Normal Depth
Critical Depth
Channel Slope
Critical Slope
lanning Formula
lormal Depth
0.035
0.01000
2.00
2.00
4.18
0.94
1.76
4.19
0.42
3.75
0.77
0.02847
2.38
0.09
1.03
0.61
ft/ft
ft/ft (H:V)
ft/ft (H:V)
ftf/s
ftft2
ft
ft
ft
ft
ft/ft
ft/s
ft
ft
;ubcritical
]0.00
0.00
0
ft
ft
~~1
0.00 ft
0.00 ft
Infinity ft/s
Infinity ft/s
0.94 ft
0.77 ft
0.01000 ft/ft
0.02847 ft/ft
Bentley Systems, Inc. Haestad Methods SolBkiotId4 wMaster V8i (SELECTseries 1) [08.11.01.03127 Siemons Company Drive Suite 200 W Watertown, CT 06795 USA +1-203-755-1666 Page 1 of I9/4/2012 5:01:58 PM
Calculation 388996-SW-01, Rev 3 Page 46 of 152

Worksheet for DP3-3 100-year
F'rojec!Descriptlon -
Friction Method
Solve For
lnput Data
Roughness Coefficient
Channel Slope
Left Side Slope
Right Side Slope
Discharge
Results_.
Manning Formula
Normal Depth
0.035
0.01000
2.00
3.00
9.86
ft/ft
ft/ft (H:V)
ft/ft (H:V)
ft3/s
Normal Depth
Flow Area
Wetted Perimeter
Hydraulic Radius
Top Width
Critical Depth
Critical Slope
Velocity
Velocity Head
Specific Energy
Froude Number
Flow Type
:GVF Input Data
Downstream Depth
Length
Number Of Steps
ýGVF Out ,put Data
Upstream Depth
Profile Description
Profile Headloss
Downstream Velocity
Upstream Velocity
Normal Depth
Critical Depth
Channel Slope
Critical Slope
1.18
3.48
6.37
0.55
5.90
0.99
0.02497
2.84
0.13
1.30
0.65
ftft2
ft
ft
ft
ft
ft/ft
ft/s
ft
ft
Subcritical
0.00 ft
0.00 ft
0
0.00 ft
0.00 ft
Infinity ft/s
Infinity ft/s
1.18 ft
0.99 ft
0.01000 ft/ft
0.02497 ft/ft
Bentley Systems, Inc. Haestad Methods SolBtiotl14ewMaster V8i (SELECTseries 1) [08.11.01.03]27 Siemons Company Drive Suite 200 W Watertown, CT 06795 USA +1-203-755-1666 Page 1 of I9/5/2012 12:14:14 PM
Calculation 388996-SW-01, Rev 3 Page 47 of 152

Worksheet for DP3-4 100-year
Prject Description
Friction Method
Solve For
n1put Data
Roughness Coefficient
Channel Slope
Left Side Slope
Right Side Slope
Discharge
. . .esy. s
Normal Depth
Flow Area
Wetted Perimeter
Hydraulic Radius
Top Width
Critical Depth
Critical Slope
Velocity
Velocity Head
Specific Energy
Froude Number
Flow Type
,--VF Input Data
Downstream Depth
Length
Number Of Steps
Manning Formula
Normal Depth
0.035
0.01000 ft/ft
2.00 ft/ft (H:V)
2.00 ft/ft (H:V)
8.38 fW/s
1.22 ft
2.96 ft2
5.44 ft
0.54 ft
4.87 ft
1.02 ft
0.02595 ft/ft
2.83 ft/s
0.12 ft
1.34 ft
0.64
0.00 ft
0.00 ft
0
Subcritical
G•Otutput Data-
Upstream Depth
Profile Description
Profile Headloss
Downstream Velocity
Upstream Velocity
Normal Depth
Critical Depth
Channel Slope 0.
Critical Slope 0.
0.00 ft
0.00 ft
Infinity ft/s
Infinity ft/s
1.22 ft
1.02 ft
01000 ft/ft
02595 ft/ft
Bentley Systems, Inc. Haestad Methods SolBaotdpawjvFtMaster V8i (SELECTseries 1) [08.11.01.03]
27 Siemons Company Drive Suite 200 W Watertown, CT 06795 USA +1-203-755-1666 Page 1 of I91512012 12:13:39 PM
Calculation 388996-SW-01, Rev 3 Page 48 of 152

Worksheet for DP3-5 100-year
Lroject Description
Friction Method
Solve For
~~~~~1Manning Formula
Normal Depth
linputData
Roughness Coefficient
Channel Slope
Left Side Slope
Right Side Slope
Discharge
11ýeSults
0.035
0.01000 ft/ft
2.00 ft/ft (H:V)
2.00 ft/ft (H:V)
2.80 ft3/s
71 III]Normal Depth
Flow Area
Wetted Perimeter
Hydraulic Radius
Top Width
Critical Depth
Critical Slope
Velocity
Velocity Head
Specific Energy
Froude Number
Flow Type Subcritical
F InputDat
0.81
1.30
3.61
0.36
3.23
0.66
0.03003
2.15
0.07
0.88
0.60
ftft2
ft
ft
ft
ft
ft/ft
ft/s
ft
ft
7
Downstream Depth
Length
Number Of Steps
.GyE Output Data
Upstream Depth
Profile Description
Profile Headloss
Downstream Velocity
Upstream Velocity
Normal Depth
Critical Depth
Channel Slope
Critical Slope
0.00
0.00
0
ft
ft
0.00 ft
0.00 ft
Infinity ft/s
Infinity ft/s
0.81 ft
0.66 ft
0.01000 ft/ft
0.03003 ft/ft
Bentley Systems, Inc. Haestad Methods SolB~dtldAuvwMasterV8i (SELECTseries 1) [08.11.01.03]
27 Siemons Company Drive Suite 200 W Watertown, CT 06795 USA +1-203-755-1666 Page 1 of 19/412012 5:00:21 PM
Calculation 388996-SW-01, Rev 3 Page 49 of 152

Worksheet for DP3-6 100-year
R0roject -DescripOtion
Friction Method
Solve For
jiput Dtata
Roughness Coefficient
Channel Slope
Left Side Slope
Right Side Slope
Discharge
LResults
Normal Depth
Flow Area
Wetted Perimeter
Hydraulic Radius
Top Width
Critical Depth
Critical Slope
Velocity
Velocity Head
Specific Energy
Froude Number
Flow Type
,GVF Input Data
Downstream Depth
Length
Number Of Steps
r-1 -- --- . -
LGVF Output Data
Upstream Depth
Profile Description
Profile Headloss
Downstream Velocity
Upstream Velocity
Normal Depth
Critical Depth
Channel Slope
Critical Slope
Manning Formula
Normal Depth
0.035
0.01000
2.00
3.00
2.21
0.67
1.13
3.63
0.31
3.37
0.55
0.03048
1.95
0.06
0.73
0.59
ft/ft
ft/ft (H:V)
ft/ft (H:V)
ft3/s
ftft2
ft
ft
ft
ft
ft/ft
ft/s
ft
ft
Subcritical
0.00 ft
0.00 ft
0
0.00 ft
0.00 ft
Infinity ft/s
Infinity ft/s
0.67 ft
0.55 ft
0.01000 ft/ft
0.03048 ft/ft
Bentley Systems, Inc. Haestad Methods SoIB1ettd1e4lwMaster V8i (SELECTseries 1) [08.11.01.03]27 Siemons Company Drive Suite 200 W Watertown, CT 06795 USA +1-203-755-1666 Page 1 of I9/4/2012 4:59:51 PM
Calculation 388996-SW-01, Rev 3 Page 50 of 152

Honeywell Pond ClosureDitch Total Flows - PMP event
Discharge Point 1DP1-8Flow From A (AC) Q (cfs)A B-2 0.18 13.18Totals 0.18 13.18
DP1-7Flow FromDP1-8A B-1Totals
DP1-6Flow From
A B-6A C-2
Totals
DPI-SFlow FromDP1-6DP1-7
A C-1Totals
DP1-4Flow From
A C-5A E-2Totals
DP1-3Flow From
DP1-4
DP1-5A E-1Totals
DP1-2
Flow FromDP1-3A E-7
Totals
DPi-1Flow From
A E-6Totals
A (AC) Q(cfs)0.18 13.180.49 31.850.67 45.03
A (AC) Q (cfs)
0.26 19.03
0.19 13.91
0.45 32.94
A (AC) Q(cfs)0.45 32.940.67 45.03
0.49 35.871.61 113.83
A (AC) Q.(cfs)
0.57 41.720.63 46.121.20 87.84
A (AC) Q(cfs)
1.20 87.84
1.61 113.830.92 59.803.73 261.47
A(AC) Q(cfs)3.73 261.470.80 52.004.53 313.47
A (AC) Q (cfs)1.33 77.52
1.33 77.52
Discharge Point 2
DP2-2
Flow From A (AC) Q (cfs)
A E-4 1.08 62.95Totals 1.08 62.95
DP2-1
Flow From A (AC) Q (cfs)A E-5 0.66 42.90Totals 0.66 42.90
DP2Flow From A (AC) . (cfs)DP2-1 0.66 42.90DP2-2 1.08 62.95Totals 1.74 105.85
DP3-5Flow FromA B-5
A C-3Totals
DP3-4Flow FromA D-1
A C-4
A B-4DP3-5
DP3-6
Totals
DP3-3Flow FromDP3-4A D-2Totals
DP3-2Flow FromA D-4
A E-3
Totals
DP3-1
Flow From
DP3-3
A D-3Totals
Discharge Point 3DP3-6
Flow From A (AC) Q (cfs)A B-3 0.31 22.69Totals 0.31 22.69
A (AC) Q(cfs)0.21 15.370.19 13.910.40 29.28
A(AC) Q(cfs)
0.24 17.57
0.15 10.98
0.11 7.150.40 29.28
0.31 22.69
1.21 87.67
A (AC) Q.(cfs)1.21 87.670.25 18.301.46 105.97
A(AC) Q(cfs)0.26 19.03
0.37 27.080.63 46.12
A (AC) (cfs)1.46 105.970.85 55.252.31 161.22
DP3Flow From A (AC) . (cfs)DP3-1 2.31 161.22DP3-2 0.63 46.12Totals 2.94 207.34
DP1Flow From A (AC) Q (cfs)DPI-I 1.33 77.52DP1-2 4.53 313.47Totals 5.86 390.99
Calculation 388996-SW-01, Rev 3 Page 51 of 152

Worksheet for DPI PMP
Project Description
Friction Method
Solve For
lin ut Data_
Roughness Coefficient
Channel Slope
Left Side Slope
Right Side Slope
Discharge
i~esutts . ..
Normal Depth
Flow Area
Wetted Perimeter
Hydraulic Radius
Top Width
Critical Depth
Critical Slope
Velocity
Velocity Head
Specific Energy
Froude Number
Flow Type
,GVF Input Data
Downstream Depth
Length
Number Of Steps
Manning Formula
Normal Depth
0.035
0.01000
2.00
2.00
390.99
5.14
52.87
22.99
2.30
20.57
4.73
0.01554
7.40
0.85
5.99
0.81
ft/ft
ft/ft (H:V)
ft/ft (H:V)
ft3/s
j]ftft2
ft
ft
ft
ft
ft/ft
ft/s
ft
ft
Subcritical
0.00 ft
0.00 ft
0
DF Output Data ____
Upstream Depth
Profile Description
Profile Headloss
Downstream Velocity
Upstream Velocity
Normal Depth
Critical Depth
Channel Slope
Critical Slope
0.00 ft
0.00 ft
Infinity ft/s
Infinity ft/s
5.14 ft
4.73 ft
0.01000 ft/ft
0.01554 ft/ft
Bentley Systems, Inc. Haestad Methods SolBtiatlddt~ Master V8i (SELECTseries 1) [08.11.01.03]27 Siemons Company Drive Suite 200 W Watertown, CT 06795 USA +1-203-755-1666 Page 1 of 1915/2012 12:25:45 PM
Calculation 388996-SW-01, Rev 3 Page 52 of 152

Worksheet for DPI-I PMP
Iroject Description
Friction Method
Solve For
~Input 'Data
Roughness Coefficient
Channel Slope
Left Side Slope
Right Side Slope
Discharge
feu its
Normal Depth
Flow Area
Wetted Perimeter
Hydraulic Radius
Top Width
Critical Depth
Critical Slope
Velocity
Velocity Head
Specific Energy
Froude Number
Flow Type
GGVF Input Data
Downstream Depth
Length
Number Of Steps
Manning Formula
Normal Depth
0.035
0.01000 ft/ft
3.00 ft/ft (H:V)
2.00 ft/ft (H:V)
77.52 ft3/s
2.56 ft
16.32 ft2
13.79 ft
1.18 ft
12.78 ft
2.27 ft
0.01896 ft/ft
4.75 ft/s
0.35 ft
2.91 ft
0.74
§ §7]
Subcritical
0.00 ft
0.00 ft
0
IGVF Outiput:Data' __. _
Upstream Depth
Profile Description
Profile Headloss
Downstream Velocity
Upstream Velocity
Normal Depth
Critical Depth
Channel Slope
Critical Slope
0.00 ft
0.00 ft
Infinity ft/s
Infinity ft/s
2.56 ft
2.27 ft
0.01000 ft/ft
0.01896 ft/ft
Bentley Systems, Inc. Haestad Methods SoIBEaott4euwMaster V8i (SELECTseries 1) [08.11.01.03]27 Siemons Company Drive Suite 200 W Watertown, CT 06795 USA +1-203-755-1666 Page 1 of 19/5/2012 9:27:02 AM
Calculation 388996-SW-01, Rev 3 Page 53 of 152

Worksheet for DPI-2_PMP
PoetDescription
Friction Method
Solve For
qnput Data
Manning Formula
Normal Depth
- - ~1
Roughness Coefficient
Channel Slope
Left Side Slope
Right Side Slope
Discharge
L pesuit~s: : _ _':•L_ _
Normal Depth
Flow Area
Wetted Perimeter
Hydraulic Radius
Top Width
Critical Depth
Critical Slope
Velocity
Velocity Head
Specific Energy
Froude Number
Flow Type S
LqV InIput Data
Downstream Depth
Length
Number Of Steps
VFG OLutput Data'
Upstream Depth
Profile Description
Profile Headloss
Downstream Velocity
Upstream Velocity
Normal Depth
Critical Depth
Channel Slope
Critical Slope
0.035
0.01000 ft/ft
3.00 ft/ft (H:V)
2.00 ft/ft (H:V)
313.47 ft3/s
4.31 ft
46.54 ft2
23.29 ft
2.00 ft
21.57 ft
3.96 ft
0.01574 ft/ft
6.74 ft/s
0.70 ft
5.02 ft
0.81
ubcritical
i-i0.00 ft
0.00 ft
0
0.00 ft
0.00 ft
Infinity ft/s
Infinity ft/s
4.31 ft
3.96 ft
0.01000 ft/ft
0.01574 ft/ft
Bentley Systems, Inc. Haestad Methods SolBaot1d•bwMaster V8i (SELECTseries 1) [08.11.01.03]27 Siemons Company Drive Suite 200 W Watertown, CT 06795 USA +1-203-755-1666 Page 1 of 19/5/2012 12:25:08 PM
Calculation 388996-SW-01, Rev 3 Page 54 of 152

{Project Description• ....
Friction Method
Solve For
11 p1_ut Data_
Roughness Coefficient
Channel Slope
Left Side Slope
Right Side Slope
Discharge
L~~Its-Normal Depth
Flow Area
Wetted Perimeter
Hydraulic Radius
Top Width
Critical Depth
Critical Slope
Velocity
Velocity Head
Specific Energy
Froude Number
Flow Type
GV Input Data
Downstream Depth
Length
Number Of Steps
'GVF.Output Data
Upstream Depth
Profile Description
Profile Headloss
Downstream Velocity
Upstream Velocity
Normal Depth
Critical Depth
Channel Slope
Critical Slope
Worksheet for DPI-3_PMP
Manning Formula
Normal Depth
0.035
0.01000
3.00
2.00
261.47
4.03
40.62
21.76
1.87
20.15
3.69
0.01613
6.44
0.64
4.67
0.80
ft/ft
ft/ft (H:V)
ft/ft (H:V)
ft3/s
ftft2
ft
ft
ft
ft
ft/ft
ft/s
ft
ft
Subcritical
0.00 ft
0.00 ft
0
0.00 ft
0.00 ft
Infinity ft/s
Infinity ft/s
4.03 ft
3.69 ft
0.01000 ft/ft
0.01613 ft/ft
Bentley Systems, Inc. Haestad Methods SotBeutdj4#&wMaster V8i (SELECTseries 1) 108.11.01.03]27 Siemons Company Drive Suite 200 W Watertown, CT 06795 USA +1-203-755-1666 Page 1 of 19/5/2012 12:24:28 PM
Calculation 388996-SW-01, Rev 3 Page 55 of 152

P roject Description
Friction Method
Solve For
[iput Data
Roughness Coefficient
Channel Slope
Left Side Slope
Right Side Slope
Discharge
[Ielts
Worksheet for DP1-4_PMP
Manning Formula
Normal Depth
Normal Depth
Flow Area
Wetted Perimeter
Hydraulic Radius
Top Width
Critical Depth
Critical Slope
Velocity
Velocity Head
Specific Energy
Froude Number
Flow Type
0.035
0.01000
2.00
2.00
87.84
2.94
17.25
13.13
1.31
11.75
2.60
0.01897
5.09
0.40
3.34
0.74
.1ft
ft2
ft
ft
ft
ft
ft/ft
ft/s
ft
ft
ft/ft
ft/ft (H:V)
ft/ft (H:V)
ft3/s
Subcritical
,GFInput Data __
Downstream Depth
Length
Number Of Steps
,GVF Output Data
Upstream Depth
Profile Description
Profile Headloss
Downstream Velocity
Upstream Velocity
Normal Depth
Critical Depth
Channel Slope
Critical Slope
0.00 ft.
0.00 ft
0.00 ft
0
0.00 ft
0.00 ft
Infinity ft/s
Infinity ft/s
2.94 ft
2.60 ft
0.01000 ft/ft
0.01897 ft/ft
Bentley Systems, Inc. Haestad Methods SoIBldetufid;twMaster V8i (SELECTseries 1) [08.11.01.03]
27 Siemons Company Drive Suite 200 W Watertown, CT 06795 USA +1-203-755-1666 Page 1 of I9/512012 9:25:23 AM
Calculation 388996-SW-01, Rev 3 Page 56 of 152

P•roject Description
Friction Method
Solve For
in6put Data
Roughness Coefficient
Channel Slope
Left Side Slope
Right Side Slope
Discharge
iResul't ....'iT2- 2:--Normal Depth
Flow Area
Wetted Perimeter
Hydraulic Radius
Top Width
Critical Depth
Critical Slope
Velocity
Velocity Head
Specific Energy
Froude Number
Flow Type
TGVF InputData
Worksheet for DPI-5_PMP
Manning Formula
Normal Depth
0.035
0.01000
3.00
2.00
113.83
2.95
21.77
15.93
1.37
14.75
2.64
0.01802
5.23
0.42
3.38
0.76
ft/ft
ft/ft (H:V)
ft/ft (H:V)
ft3/s
ftft2
ft
ft
ft
ft
ft/ft
ft/s
ft
ft
Subcritical
Downstream Depth
Length
Number Of Steps
Output Data
Upstream Depth
Profile Description
Profile Headloss
Downstream Velocity
Upstream Velocity
Normal Depth
Critical Depth
Channel Slope
Critical Slope
0.00
0.00
0
ft
ft
0.00 ft
0.00 ft
Infinity ft/s
Infinity ft/s
2.95 ft
2.64 ft
0.01000 ft/ft
0.01802 ft/ft
Bentley Systems, Inc. Haestad Methods SolBtaotlI4d*9Master V8i (SELECTseries 1) [08.11.01.03]27 Siemons Company Drive Suite 200 W Watertown, CT 06795 USA +1-203-755-1666 Page 1 of 19/5/2012 12:23:34 PM
Calculation 388996-SW-01, Rev 3 Page 57 of 152

Worksheet for DPI-6_PMP
LPoject Description
Friction Method
Solve For
Idput Data
Roughness Coefficient
Channel Slope
Left Side Slope
Right Side Slope
Discharge
JR~esults
Normal Depth
Flow Area
Wetted Perimeter
Hydraulic Radius
Top Width
Critical Depth
Critical Slope
Velocity
Velocity Head
Specific Energy
Froude Number
Flow Type
;GFIn put Data_
Downstream Depth
Length
Number Of Steps
Manning Formula
Normal Depth
0.035
0.01000
2.00
2.00
32.94
2.03
8.27
9.09
0.91
8.13
1.76
0.02162
3.99
0.25
2.28
0.70
ft/ft
ft/ft (H:V)
ft/ft (H:V)
ft3/s
ftft2
ft
ft
ft
ft
ft/ft
ft/s
ft
ft
Subcritical
0.00 ft
0.00 ft
0
__V Output Data___
Upstream Depth
Profile Description
Profile Headloss
Downstream Velocity
Upstream Velocity
Normal Depth
Critical Depth
Channel Slope
Critical Slope
0.00 ft
0.00 ft
Infinity ft/s
Infinity ft/s
2.03 ft
1.76 ft
0.01000 ft/ft
0.02162 ft/ft
Bentley Systems, Inc. Haestad Methods SolBfiotld•eFlAwMaster V8i (SELECTseries 1) [08.11.01.03]27 Siemons Company Drive Suite 200 W Watertown, CT 06795 USA +1-203-755-1666 Page 1 of 19/4/2012 5:04:40 PM
Calculation 388996-SW-01, Rev 3 Page 58 of 152

iPpoject Description
Worksheet for DPl-7_PMP
Friction Method Manning Formula
Solve For Normal Depth
LInput Data
Roughness Coefficient
Channel Slope
Left Side Slope
Right Side Slope
Discharge
Results
Normal Depth
Flow Area
Wetted Perimeter
Hydraulic Radius
Top Width
Critical Depth
Critical Slope
Velocity
Velocity Head
Specific Energy
Froude Number
Flow Type Subcritical
•VF Input Data.
Downstream Depth
Length
Number Of Steps
'G Output Data
Upstream Depth
Profile Description
Profile Headloss
Downstream Velocity
Upstream Velocity
Normal Depth
Critical Depth
Channel Slope
Critical Slope
0.035
0.01000
3.00
2.00
45.03
2.08
10.86
11.25
0.97
10.42
1.82
0.02039
4.15
0.27
2.35
0.72
ft/ft
ft/ft (H:V)
ft/ft (H:V)
ft3/S
ft
ft2
ft
ft
ft
ft
ft/ft
ft's
ft
ft
00 ft - -
0.00 ft0.00 ft
0
0.00 ft
0.00 ft
Infinity ft/s
Infinity ft/s
2.08 ft
1.82 ft
0.01000 ft/ft
0.02039 ft/ft
Bentley Systems, Inc. Haestad Methods SolBkoId4ttd uMasterV8i (SELECTseries 1) [08.11.01.03]27 Siemons Company Drive Suite 200 W Watertown, CT 06795 USA +1-203-755-1666 Page 1 of 19/5/2012 9:23:56 AM
Calculation 388996-SW-01, Rev 3 Page 59 of 152

Project Description . . .
Friction Method
Solve For
Worksheet for DPI-8_PMP
Manning Formula
Normal Depth
[In4put Data -]
Roughness Coefficient
Channel Slope
Left Side Slope
Right Side Slope
Discharge
pResuits
Normal Depth
Flow Area
Wetted Perimeter
Hydraulic Radius
Top Width
Critical Depth
Critical Slope
Velocity
Velocity Head
Specific Energy
Froude Number
Flow Type
LGVF Input Data
0.035
0.01000
3.00
2.00
13.18
1.32
4.32
7.10
0.61
6.58
1.12
0.02402
3.05
0.14
1.46
0.66
ft/ft
ft/ft (H:V)
ft/ft (H:V)
ft3/s
ft
ft2
ft
ft
ft
ft
ft/ft
ft/s
ft
ft
Subcritical
Downstream Depth
Length
Number Of Steps
{6GVF Output Data
Upstream Depth
Profile Description
Profile Headloss
Downstream Velocity
Upstream Velocity
Normal Depth
Critical Depth
Channel Slope
Critical Slope
0.00 ft
0.00 ft
0
0.00 ft
0.00 ft
Infinity ft/s
Infinity ft/s
1.32 ft
1.12 ft
0.01000 ft/ft
0.02402 ft/ft
Bentley Systems, Inc. Haestad Methods SolBtiottd•rIwMaster V8i (SELECTseries 1) [08.11.01.03]
27 Siemons Company Drive Suite 200 W Watertown, CT 06795 USA +1-203-755-1666 Page 1 of I9/4/2012 5:03:39 PM
Calculation 388996-SW-01, Rev 3 Page 60 of 152

Worksheet for DP2_PMP
Project Description
Friction Method
Solve For
Input Data
Roughness Coefficient
Channel Slope
Left Side Slope
Right Side Slope
Discharge
f'esutlts
Manning Formula
Normal Depth
Normal Depth
Flow Area
Wetted Perimeter
Hydraulic Radius
Top Width
Critical Depth
Critical Slope
Velocity
Velocity Head
Specific Energy
Froude Number
Flow Type
GVF In pUt Data
0.035
0.01000
2.00
2.00
105.85
3.15
19.84
14.09
1.41
12.60
2.81
0.01850
5.33
0.44
3.59
0.75
ft/ft
ft/ft (H:V)
ft/ft (H:V)
ft3/s
ftft2
ft
ft
ft
ft
ft/ft
ft/s
ft
ft
Subcritical
Downstream Depth
Length
Number Of Steps
,GVF Output Data
Upstream Depth
Profile Description
Profile Headloss
Downstream Velocity
Upstream Velocity
Normal Depth
Critical Depth
Channel Slope
Critical Slope
0.00 ft
0.00 ft
0
0.00 ft
0.00 ft
Infinity ft/s
Infinity ft/s
3.15 ft
2.81 ft
0.01000 ft/ft
0.01850 ft/ft
Bentley Systems, Inc. Haestad Methods SolBkaotU4bwMasterV8i (SELECTseries 1) [08.11.01.03]27 Siemons Company Drive Suite 200 W Watertown, CT 06795 USA +1-203-755-1666 Page 1 of 19/5/2012 9:29:01 AM
Calculation 388996-SW-01, Rev 3 Page 61 of 152

Project Description
Worksheet for DP2-1_PMP
Friction Method
Solve For
Ir9put Data,
Roughness Coefficient
Channel Slope
Left Side Slope
Right Side Slope
Discharge
fiesults
Normal Depth
Flow Area
Wetted Perimeter
Hydraulic Radius
Top Width
Critical Depth
Critical Slope
Velocity
Velocity Head
Specific Energy
Froude Number
Flow Type
GVF Input Data
Downstream Depth
Length
Number Of Steps
Manning Formula
Normal Depth
0.035
0.01000
3.00
2.00
42.90
2.05
10.47
11.05
0.95
10.23
1.79
0.02052
4.10
0.26
2.31
0.71
ft/ft
ft/ft (H:V)
ft/ft (H:V)
ft1/s
ftft2
ft
ft
ft
ft
ft/ft
ft's
ft
ft
Subcritical
0.00
0.00 ft
0
IVF Output Data .... __ ___ --_]
Upstream Depth 0.00 ft
Profile Description
Profile Headloss 0.00 ft
Downstream Velocity Infinity ft/s
Upstream Velocity Infinity ft/s
Normal Depth 2.05 ft
Critical Depth 1.79 ft
Channel Slope 0.01000 ft/ft
Critical Slope 0.02052 ft/ft
Bentley Systems, Inc. Haestad Methods SolBiottd•e~twMaster V8i (SELECTseries 1) [08.11.01.03]
27 Siemons Company Drive Suite 200 W Watertown, CT 06795 USA +1-203-755-1666 Page 1 of 19/5/2012 9:28:31 AM
Calculation 388996-SW-01, Rev 3 Page 62 of 152

Project Descriýiion
Friction Method
Solve For
Worksheet for DP2-2_PMP
Manning Formula
Normal Depth
ilnput Data
Roughness Coefficient
Channel Slope
Left Side Slope
Right Side Slope
Discharge
Normal Depth
Flow Area
Wetted Perimeter
Hydraulic Radius
Top Width
Critical Depth
Critical Slope
Velocity
Velocity Head
Specific Energy
Froude Number
Flow Type
LV utData'
0.035
0.01000
2.00
3.00
62.95
2.36
13.96
12.76
1.09
11.82
2.09
0.01950
4.51
0.32
2.68
0.73
ft/ft
ft/ft (H:V)
ft/ft (H:V)
ft3/s
ftft2
ft
ft
ft
ft
ft/ft
ft/s
ft
ft
Subcritical
Downstream Depth
Length
Number Of Steps
V•,V-F'utput Data __ ___ .
Upstream Depth
Profile Description
Profile Headloss
Downstream Velocity
Upstream Velocity
Normal Depth
Critical Depth
Channel Slope
Critical Slope
--- --. .-----
0.00 ft
0.00 ft
0
0.00 ft
0.00 ft
Infinity ft/s
Infinity ft/s
2.36 ft
2.09 ft
0.01000 ft/ft
0.01950 ft/ft
Bentley Systems, Inc. Haestad Methods SolBkoattd;4iuwMaster V8i (SELECTseries 1) [08.11.01.03]27 Siemons Company Drive Suite 200 W Watertown, CT 06795 USA +1-203-755-1666 Page 1 of I9/5/2012 9:28:02 AM
Calculation 388996-SW-01, Rev 3 Page 63 of 152

Worksheet for DP3 PMP
Project Description
Friction Method
Solve For
Manning Formula
Normal Depth
Input Data
Roughness Coefficient
Channel Slope
Left Side Slope
Right Side Slope
Discharge
lResults
Normal Depth
Flow Area
Wetted Perimeter
Hydraulic Radius
Top Width
Critical Depth
Critical Slope
Velocity
Velocity Head
Specific Energy
Froude Number
Flow Type
9_VF_ Input Data
Downstream Depth
Length
Number Of Steps
'VF Output Data
Upstream Depth
Profile Description
Profile Headloss
Downstream Velocity
Upstream Velocity
Normal Depth
Critical Depth
Channel Slope
Critical Slope
0.035
0.01000
2.00
2.00
207.34
4.05
32.85
18.12
1.81
16.21
3.67
0.01692
6.31
0.62
4.67
0.78
ft/ft
ft/ft (H:V)
ft/ft (H:V)
ft3/s
ftft2
ft
ft
ft
ft
ft/ft
ft/s
ft
ft
Subcritical
0.00 ft
0.00 ft
0
.Li0.00 ft
0.00 ft
Infinity ft/s
Infinity ft/s
4.05 ft
3.67 ft
0.01000 ft/ft
0.01692 ft/ft
Bentley Systems, Inc. Haestad Methods SolBdottd•dvbwMaster V8i (SELECTseries 1) [08.11.01.03]
27 Siemons Company Drive Suite 200 W Watertown, CT 06795 USA +1-203-755-1666 Page 1 of 191512012 9:31:16 AM
Calculation 388996-SW-01, Rev 3 Page 64 of 152

Project Description
Friction Method
Solve For
Input Data---
Roughness Coefficient
Channel Slope
Left Side Slope
Right Side Slope
Discharge
iLesults
Worksheet for DP3-1_PMP
Manning Formula
Normal Depth
0.035
0.01000 ft/ft
2.00 ft/ft (H:V)
3.00 ft/ft (H:V)
161.22 ft3/s
Normal Depth
Flow Area
Wetted Perimeter
Hydraulic Radius
Top Width
Critical Depth
Critical Slope
Velocity
Velocity Head
Specific Energy
Froude Number
Flow Type
9YF Input Data
3.36 ft
28.27 ft2
18.15 ft
1.56 ft
16.81 ft
3.04 ft
0.01720 ft/ft
5.70 ft/s
0.51 ft
3.87 ft
0.78
Subcritical
Downstream Depth
Length
Number Of Steps
GVF Output -Data
Upstream Depth
Profile Description
Profile Headloss
Downstream Velocity
Upstream Velocity
Normal Depth
Critical Depth
Channel Slope
Critical Slope
0.00 ft
0.00 ft
0
0.00 ft
0.00 ft
Infinity ft/s
Infinity ft/s
3.36 ft
3.04 ft
0.01000 ft/ft
0.01720 ft/ft
Bentley Systems, Inc. Haestad Methods SoIBadot4eRf Master V8i (SELECTseries 1) [08.11.01.03]27 Siemons Company Drive Suite 200 W Watertown, CT 06795 USA +1-203-755-1666 Page 1 of 19/5/2012 9:30:47 AM
Calculation 388996-SW-01, Rev 3 Page 65 of 152

Worksheet for DP3-2 PMP
!Project Description
Friction Method
Solve For
Lnput Data _
Roughness Coefficient
Channel Slope
Left Side Slope
Right Side Slope
Discharge
I1e'sults
Manning Formula
Normal Depth
Normal Depth
Flow Area
Wetted Perimeter
Hydraulic Radius
Top Width
Critical Depth
Critical Slope
Velocity
Velocity Head
Specific Energy
Froude Number
Flow Type Subcritical
LG'F Input Data
Downstream Depth
Length
Number Of Steps
L6VF Output Data
Upstream Depth
Profile Description
Profile Headloss
Downstream Velocity
Upstream Velocity
Normal Depth
Critical Depth
Channel Slope
Critical Slope
0.035
0.01000
2.00
2.00
46.12
2.31
10.64
10.32
1.03
9.23
2.01
0.02067
4.33
0.29
2.60
0.71
ft/ft
ft/ft (H:V)
ft/ft (H:V)
ft3/s
ftft2
ft
ft
ft
ft
ft/ft
ft/s
ft
ft
]
0.00 ft
0.00 ft
0
___-- -~.---- j0.00 ft
0.00 ft
Infinity ft/s
Infinity ft/s
2.31 ft
2.01 ft
0.01000 ft/ft
0.02067 ft/ft
Bentley Systems, Inc. Haestad Methods SolBfotlddlmfwMaster V1i (SELECTseries 1) 108.11.01.03]27 Siemons Company Drive Suite 200 W Watertown, CT 06795 USA +1-203-755-1666 Page 1 of 19/4/2012 5:11:34 PM
Calculation 388996-SW-01, Rev 3 Page 66 of 152

Worksheet for DP3-3 PMP
IProject Description
Friction Method
Solve For
Manning Formula
Normal Depth
jlnput Data
Roughness Coefficient
Channel Slope
Left Side Slope
Right Side Slope
Discharge
LiPsits-
Normal Depth
Flow Area
Wetted Perimeter
Hydraulic Radius
Top Width
Critical Depth
Critical Slope
Velocity
Velocity Head
Specific Energy
Froude Number
Flow Type Subcritical
'GVF lIput Data
Downstream Depth
Length
Number Of Steps
GVF Outlpbut Data
Upstream Depth
Profile Description
Profile Headloss
Downstream Velocity
Upstream Velocity
Normal Depth
Critical Depth
Channel Slope
Critical Slope
q
0.035
0.01000
2.00
3.00
105.97
2.87
20.63
15.51
1.33
14.36
2.57
0.01819
5.14
0.41
3.28
0.76
ft/ft
ft/ft (H:V)
ft/ft (H:V)
ft3/s
-1
ft
ft2
ft
ft
ft
ft
ft/ft
ft/s
ft
ft
0.00
0.00
0
ft
ft
0.00 ft
0.00 ft
Infinity ft/s
Infinity ft/s
2.87 ft
2.57 ft
0.01000 ft/ft
0.01819 ft/ft
Bentley Systems, Inc. Haestad Methods SoIBtiothd•lfOuwMaster V8i (SELECTseries 1) [08.11.01.03]
27 Siemons Company Drive Suite 200 W Watertown, CT 06795 USA +1-203-755-1666 Page 1 of I9/5/2012 9:30:12 AM
Calculation 388996-SW-01, Rev 3 Page 67 of 152

Worksheet for DP3-4_PMP
!Pr°oject Description ..
Friction Method
Solve For
~nput Data_
Roughness Coefficient
Channel Slope
Left Side Slope
Right Side Slope
Discharge
Ife sults
Manning Formula
Normal Depth
Normal Depth
Flow Area
Wetted Perimeter
Hydraulic Radius
Top Width
Critical Depth
Critical Slope
Velocity
Velocity Head
Specific Energy
Froude Number
Flow Type
GUVFInput Data
0.035
0.01000
2.00
2.00
87.67
2.93
17.23
13.12
1.31
11.74
2.60
0.01897
5.09
0.40
3.34
0.74
ft/ft
ft/ft (H:V)
ft/ft (H:V)
ft3/s
ftft2
ft
ft
ft
ft
ft/ft
ft/s
ft
ft
Subcritical
Downstream Depth
Length
Number Of Steps
Upstream Depth
Profile Description
Profile Headloss
Downstream Velocity
Upstream Velocity
Normal Depth
Critical Depth
Channel Slope
Critical Slope
0.00 ft
0.00 ft
0
00 f
0.00 ft
0.00 ft
Infinity ft/sInfinity ft/s
2.93 ft
2.60 ft
0.01000 ft/ft
0.01897 ft/ft
Bentley Systems, Inc. Haestad Methods SoIBklottd;r*wMaster V8i (SELECTseries 1) [08.11.01.03]27 Siemons Company Drive Suite 200 W Watertown, CT 06795 USA +1-203-755-1666 Page 1 of 19/5/2012 9:29:44 AM
Calculation 388996-SW-01, Rev 3 Page 68 of 152

Worksheet for DP3-5 PMP
Project Description
Friction Method
Solve For
lInput Data
Roughness Coefficient
Channel Slope
Left Side Slope
Right Side Slope
Discharge
!Results
Normal Depth
Flow Area
Wetted Perimeter
Hydraulic Radius
Top Width
Critical Depth
Critical Slope
Velocity
Velocity Head
Specific Energy
Froude Number
Flow Type
GV nputData
Downstream Depth
Length
Number Of Steps
-1 6O utput Data
Upstream Depth
Profile Description
Profile Headloss
Downstream Velocity
Upstream Velocity
Normal Depth
Critical Depth
Channel Slope
Critical Slope
Manning Formula
Normal Depth
0.035
0.01000
2.00
2.00
29.28
ft/ft
ft/ft (H:V)
ft/ft (H:V)
ftI/s
1.95 ft
7.57 ft2
8.70 ft
0.87 ft
7.78 ft
1.68 ft
0.02196 ft/ft
3.87 ft/s
0.23 ft
2.18 ft
0.69
Subcritical
0.00 ft
0.00 ft
0
0.00 ft
0.00 ft
Infinity ft/s
Infinity ft/s
1.95 ft
1.68 ft
0.01000 ft/ft
0.02196 ft/ft
Bentley Systems, Inc. Haestad Methods SolBattd(et uvMaster V8i (SELECTseries 1) [08.11.01.03]27 Siemons Company Drive Suite 200 W Watertown, CT 06795 USA +1-203-755-1666 Page 1 of I9/4/2012 5:10:08 PM
Calculation 388996-SW-01, Rev 3 Page 69 of 152

Project Description
Worksheet for DP3-6_PMP
Friction Method
Solve For
jiput Dt
Roughness Coefficient
Channel Slope
Left Side Slope
Right Side Slope
Discharge
IResults
Manning Formula
Normal Depth
Normal Depth
Flow Area
Wetted Perimeter
Hydraulic Radius
Top Width
Critical Depth
Critical Slope
Velocity
Velocity Head
Specific Energy
Froude Number
Flow Type
GF,LGVF nput, Data.
Downstream Depth
Length
Number Of Steps
LGYFOutput Data'Upstream Depth
Profile Description
Profile Headloss
Downstream Velocity
Upstream Velocity
Normal Depth
Critical Depth
Channel Slope
Critical Slope
0.035
0.01000
2.00
3.00
22.69
1.61
6.49
8.70
0.75
8.06
1.39
0.02234
3.49
0.19
1.80
0.69
-... . . . . .
ft/ft
ft/ft (H:V)
ft/ft (H:V)
ft3/s
ftft2
ft
ft
ft
ft
ft/ft
ft/s
ft
ft
Subcritical
0.00 ft
0.00 ft
0
..........
0.00 ft
0.00 ft
Infinity ft/s
Infinity ft/s
1.61 ft
1.39 ft
0.01000 ft/ft
0.02234 ft/ft
Bentley Systems, Inc. Haestad Methods SolBboattdeFwMaster V8i (SELECTseries 1) [08.11.01.03127 Siemons Company Drive Suite 200 W Watertown, CT 06795 USA +1-203-755-1666 Page 1 of I9/4/2012 5:09:40 PM
Calculation 388996-SW-01, Rev 3 Page 70 of 152

Honeywell Pond ClosureRock Slope Protection - Conveyance Ditch
Ref: Development of Riprap Design Criteria by Riprap Testing in Flumes: Phase IIDivision of Low Level Waste Management and DecommissioningOffice of Nuclear Material Safety and SafeguardsU.S. Nuclear Regulatory CommissionNUREG/CR-4651, ORNL/TM-10100/V2Obtained from National Technical Information Service: U.S. Department of Commerce
Safety Factors Method
1.0 Determine the Safety Factor (SF) for a given Den
Use SF Cos 0 tan 0 Equation 3.5
/7'tan 0+ sin 0cos,8
Where:
1± sin( A+ ,8) EO = ýDS Equation 3.87/'=/7 Equation 3.6 D
21 L cos 2sn91Euto .2 1,co fl=arctanl~i Co+sm
)7 (G, -1)^D5 0 Equation 3.7 2 + Equation 3.9I tan j
as shown in Fig. 3.1, the angle between a horizontal line and theA velocity vector component, Vr, measured in the plane of the side
slope
a = the side slope angle shown in Fig. 3.1
the angle between the vector component of the weight, Ws,
directed down the side slope and the direction of particlemovement
4) = the angle of repose of the riprapTo = the bed shear stress
D50 = the representative median stone size
G = the specific weight of the rockD = the depth of flowy the specific weight of the liquidS = the slope of the channel
rq' and q = stability numbersF, and Fd = the lift and drag forces in Fig. 3.1
Calculation 388996-SW-01, Rev 3 Page 71 of 152

of Velacity, Wr
0.3 1 2. 4 10 20 40 60 100 200 400 600
40 A.,oo~o
44
NmOi Diameter (bfl
Fig-~, 3-2. MArk. -~.p-, (,..tI., fi 4LJ= -w~ di--~. sd shap..
(o) Generol View
i, Co 6
(al Sectiorn A-Aj b) V irm Normal To the Side Slope
Figure 3-1- Riprap stabi~lity conditiono as deacxibed ir. the Saeftyractars maethod.l
2.0 Determine the RiDraD Size and Laver Thickness
It is recommended that the riprap thickness be a minimum of 1.5 times the D50.
Calculation 388996-SW-01, Rev 3 Page 72 of 152

DP1-8 PMPGiven Data:
SD
Ditch Sideslopes
1.00%0.010000
2 1 (H:V, worst case)E = 0.463648 radians
Figure 3.2 (Assumptions: very roundedS = 40 degrees 10" riprap)
D 50
G,
D
Y
0.6981324
0.3333332.66
radiansinchesfeet
=1.32 feet (depth of flow from interior dike ditchsizing calculations)
= 62.43 pounds/cubic foot (water)
Calculations:To =
SF =
D5TThickness
0.8240760.5009640.4375190.3588731.062721
4• inches6~inches
DP1-8 100-yearGiven Data:
S\
Ditch Sideslopese
g50
Go
= 1.00%= 0.010000= 2= 0.463648
40
= 0.698132= 4= 0.333333= 2.66
= 0.55
= 62.43
1 (H:V, worst case)radians
Figure 3.2 (Assumptions: very roundeddegrees 10" riprap)
radiansinches (maximum from above PMP riprap calc)feet
feet (depth of flow from interior dike ditch
sizing calculations)
pounds/cubic foot (water)
Calculations:To
ri,SF
D50
Thickness
0.3433650.2087350.1929980.1254091.379264
41 inches... . inches
Calculation 388996-SW-01, Rev 3 Page 73 of 152

DP1-7 PMPGiven Data:
A1.00%
0.0100002:
0.463648 radiansDitch Sideslopes
01 (H:V, worst case)
Figure 3.2 (Assumptions: very rounded40 degrees 10" riprap)
D5o
G ý
D
Y
0.698132
60.5
2.66
radiansinches
feet
=2.08 feet (depth of flow from interior dike ditchsizing calculations)
- 62.43 pounds/cubic foot (water)
Calculations:To =
F3 =
SF =
1.2985440.5262650.4566320.3815111.040186
D 50
Thickness
= 1i= !
61 inches91 inches
DP1-7 100-yearGiven Data:
SX
Ditch Sideslopes8
D 50
GD
D
= 1.00%= 0.010000= 2= 0.463648
= 40
= 0.698132= 6= 0.5
= 2.66
= 0.85
= 62.43
1 (H:V, worst case)radians
Figure 3.2 (Assumptions: very roundeddegrees 10" riprap)radiansinches (maximum from above PMP riprap calc)feet
feet (depth of flow from interior dike ditch
sizing calculations)
pounds/cubic foot (water)
Calculations:To
q
139,
SF
D50
Thickness
0.5306550.21506
0.1986840.1298071.371209
6' inches
. . inches
Calculation 388996-SW-01, Rev 3 Page 74 of 152

DP1-6 PMPGiven Data:
S =
A =Ditch Sideslopes =
1.00%0.010000
2 1 (H:V, worst case)e = 0.463648 radians
Figure 3.2 (Assumptions: very rounded4) = 40 degrees 10" riprap)
D50
G,
D
V
Calculations:To
n13
SF
D5hThickness
0.698132
60.5
2.66
radiansinchesfeet
=2.03 feet (depth of flow from interior dike ditchsizing calculations)
= 62.43 pounds/cubic foot (water)
= 1.267329= 0.513614= 0.447121= 0.370153= 1.051366
S . 6' inches
= 9 iinches
DP1-6 100-yearGiven Data:
SA
Ditch Sideslopes8
D50
G,
D
= 1.00%= 0.010000= 2= 0.463648
= 40
- 0.698132= 6= 0.5
= 2.66
= 0.84
= 62.43
radians
degrees
radiansinchesfeet
feet
1 (H:V, worst case)
Figure 3.2 (Assumptions: very rounded10" riprap)
(maximum from above PMP riprap calc)
(depth of flow from interior dike ditchsizing calculations)
pounds/cubic foot (water)
Calculations:To
q'
SF
D5hThickness
0.5244120.21253
0.1964110.1280441.374424
-- i' 6 1 inches91 inches
Calculation 388996-SW-01, Rev 3 Page 75 of 152

DP1-5 PMPGiven Data:
S
S =
1.00%0.010000
2 1 (H:V, worst case)Ditch Sideslope8 = 0.463648 radians
Figure 3.2 (Assumptions: very rounded• = 40 degrees 10" riprap)
D 50
Gs;
D
Y
0.698132
80.666667
2.66
radiansinchesfeet
=2.95 feet (depth of flow from interior dike ditchsizing calculations)
= 62.43 pounds/cubic foot (water)
Calculations:To =
r =
SF =
D5h =
Thickness =
1.8416850.559789
0.48140.4119661.011382
8' inches.12i inches
DP1-5 100-yearGiven Data:
SX
Ditch Sideslopes8
= 1.00%= 0.010000= 2= 0.463648
40
= 0.698132- 8= 0.666667= 2.66
D50
Gs
1 (H:V, worst case)radiansdegrees Figure 3.2 (Assumptions: very rounded
10" riprap)radiansinches (maximum from above PMP riprap calc)feet
feet (depth of flow from interior dike ditch
sizing calculations)
pounds/cubic foot (water)
D 1.19
y 62.43
Calculations:To
ri,SF
D5hThickness
0.7429170.225813
0.208320.1373611.357648
inches
- - ... . 12 inches
Calculation 388996-SW-01, Rev 3 Page 76 of 152

DP1-4 PMPGiven Data:
SA
Ditch Sideslopes
1.00%0.010000
2 1 (H:V, worst case)a = 0.463648 radians
Figure 3.2 (Assumptions: very roundedS = 40 degrees 10" riprap)
D5o
Gsr
D
y
Calculations:To
f3r'
SF
D50
Thickness
0.698132
80.666667
2.66
radiansinches
feet
=2.94 feet (depth of flow from interior dike ditchsizing calculations)
= 62.43 pounds/cubic foot (water)
= 1.835442
- 0.557892= 0.480015= 0.410229= 1.012981
8! inches121 inches
DP1-4 100-yearGiven Data:
SA
Ditch Sideslopes0ci
D50
Gs
D
= 1.00%= 0.010000= 2= 0.463648
40
= 0.698132= 8= 0.666667= 2.66
1.19
62.43
radians
degrees
radiansinchesfeet
feet
1 (H:V, worst case)
Figure 3.2 (Assumptions: very rounded10" riprap)
(maximum from above PMP riprap calc)
(depth of flow from interior dike ditchsizing calculations)
pounds/cubic foot (water)
Calculations:To
$3
SF
D 50
Thickness
= 0.742917= 0.225813= 0.20832- 0.137361= 1.357648
= .inches
= L .. 12 inches
Calculation 388996-SW-01, Rev 3 Page 77 of 152

DP1-3 PMPGiven Data:
A1.00%
0.0100002:
0.463648 radiansDitch Sideslopes
a1 (H:V, worst case)
Figure 3.2 (Assumptions: very rounded40 degrees 10" riprap)
D50
G,
D
Y
0.69813211
0.9166672.66
radiansinchesfeet
(depth of flow from interior dike ditchS 4.03 feet sizing calculations)
= 62.43 pounds/cubic foot (water)
Calculations:To
SF
D5hThickness
2.5159290.5561660.4787550.4086511.014438
- I 16.5;inchesinches
DP1-3 100-yearGiven Data:
S
Ditch Sideslopese
D 5 0
Gs
D
= 1.00%= 0.010000= 2:= 0.463648
40
= 0.698132= 11= 0.916667= 2.66
1.62
62.43
1 (H:V, worst case)radians
Figure 3.2 (Assumptions: very roundeddegrees 10" riprap)radiansinches (maximum from above PMP riprap calc)feet
feet (depth of flow from interior dike ditch
sizing calculations)
pounds/cubic foot (water)
Calculations:To
13
SF
T 5nThickness
- 1.011366= 0.223571= 0.206314= 0.135778= 1.360463
= K -! 1'i~ inches
= 1'inches
Calculation 388996-SW-01, Rev 3 Page 78 of 152

DP1-2 PMPGiven Data:
S =
A =Ditch Sideslopes =
1.00%0.010000
2: 1 (H:V, worst case)0 = 0.463648 radians
Figure 3.2 (Assumptions: very roundedS40 degrees 10" riprap)
D5o
G,
D
Y
Calculations:To
SF
D50
Thickness
Given Data:SA
Ditch Sideslopes6
4)
0.698132
121
2.66
radiansinchesfeet
4.31 feet (depth of flow from interior dike ditchsizing calculations)
62.43 pounds/cubic foot (water)
= 2.690733= 0.545241= 0.47073= 0.398687= 1.023737
121 inches181 inches
DP1-2 100-year
D 5 0
G,
D
Y
= 1.00%= 0.010000= 2= 0.463648
= 40
- 0.698132= 12= 1= 2.66
= 1.73
= 62.43
radians
degrees
radiansinchesfeet
feet
1 (H:V, worst case)
Figure 3.2 (Assumptions: very rounded10" riprap)
(maximum from above PMP riprap calc)
(depth of flow from interior dike ditchsizing calculations)
pounds/cubic foot (water)
Calculations:To
q'rl
SF
D50Thickness
1.080039
0.2188550.20209
0.1324631.366404
12- inches181 inches
Calculation 388996-SW-01, Rev 3 Page 79 of 152

DPI-1 PMPGiven Data:
S =
A =
Ditch Sideslopes =6 =
D50 =
Gs
1.00%0.010000
20.463648 radians
1 (H:V, worst case)
Figure 3.2 (Assumptions: very rounded40 degrees 10" riprap)
0.6981327
0.5833332.66
radiansinchesfeet
D =2.56 feet (depth of flow from interior dike ditchsizing calculations)
y = 62.43 pounds/cubic foot (water)
Calculations:To = 1.598208
q = 0.55518113 = 0.478033
' = 0.40775SF = 1.015272
D =5 7ý inches
Thickness = 1 0' i0•5J inches
DPI-10 l0-yearGiven Data:
SA
Ditch Sideslopese
= 1.00%= 0.010000- 2= 0.463648
= 40
= 0.698132= 7= 0.583333= 2.66
D50
Gý
1 (H:V, worst case)radians
Figure 3.2 (Assumptions: very roundeddegrees 10" riprap)radiansinches (maximum from above PMP riprap calc)feet
feet (depth of flow from interior dike ditch
sizing calculations)
pounds/cubic foot (water)
D 1.04
y 62.43
Calculations:To
SF
D5hThickness
0.6492720.2255420.2080770.1371691.357988
71 inchesL 10.i inches
Calculation 388996-SW-01, Rev 3 Page 80 of 152

DP1 PMPGiven Data:
C,
A =
1.00%0.010000
2 1 (H:V, worst case)Ditch Sideslopea = 0.463648 radians
D50
Figure 3.2 (Assumptions: very rounded40 degrees 10" riprap)
0.698132
141.166667
2.66
radiansinchesfeet
D =5.14 feet (depth of flow from interior dike ditchsizing calculations)
y = 62.43 pounds/cubic foot (water)
Calculations:To
SF
D50
Thickness
= 3.208902
= 0.5573490.479619
= 0.409733= 1.013439
= • 14i inches= L . 211 inches
DP1 100-yearGiven Data:
S = 1.00%A = 0.010000
Ditch Sideslopes = 28 = 0.463648
4) = 40
= 0.698132D5 = 14
= 1.166667G = 2.66
D = 2.07
y = 62.43
radians
degrees
radiansinchesfeet
feet
1 (H:V, worst case)
Figure 3.2 (Assumptions: very rounded10" riprap)
(maximum from above PMP riprap calc)
(depth of flow from interior dike ditchsizing calculations)
pounds/cubic foot (water)
Calculations:To
SF
D5hThickness
1.292301
0.2244580.2071070.1364041.359348
- 14 inches. • inches
Calculation 388996-SW-01, Rev 3 Page 81 of 152

DP2-2 PMPGiven Data:
SA\
Ditch Sideslopes6
1.00%0.010000
20.463648
1 (H:V, worst case)radians
Figure 3.2 (Assumptions: very rounded40 degrees 10" riprap)
D50
Gs,
D
V
Calculations:To
q
q'
SF
D50
Thickness
0.6981327
0.5833332.66
radiansinchesfeet
=2.36 feet (depth of flow from interior dike ditchsizing calculations)
= 62.43 pounds/cubic foot (water)
= 1.473348
- 0.511807= 0.445755= 0.368537= 1.052978
S71 inches. . 0'.51 inches
DP2-2 100-yearGiven Data:
SA
Ditch Sideslopese
D5o
Gs
D
= 1.00%= 0.010000= 2= 0.463648
= 40
= 0.698132= 7= 0.583333= 2.66
= 0.96
= 62.43
1 (H:V, worst case)radians
Figure 3.2 (Assumptions: very roundeddegrees 10" riprap)radiansinches (maximum from above PMP riprap calc)feet
feet (depth of flow from interior dike ditch
sizing calculations)
pounds/cubic foot (water)
Calculations:To
rSSF
0.5993280.208193
0.192510.1250331.379957
D 5 0
Thickness= i
-7.. -771 inches
10.51 inches
Calculation 388996-SW-01, Rev 3 Page 82 of 152

DP2-1 PMPGiven Data:
s
1.00%0.010000
2:Ditch SideslopE 1 (H:V, worst case)6 = 0.463648 radians
Figure 3.2 (Assumptions: very rounded4, = 40 degrees 10" riprap)
D5o
Gs
D
Y
=
=
0.6981326
0.52.66
radiansinchesfeet
=2.05 feet (depth of flow from interior dike ditchsizing calculations)
= 62.43 pounds/cubic foot (water)
Calculations:To =
F =13 =
I"1' =
SF =
1.279815
0.5186750.4509360.3746871.046873
6! inches61 inches
D5 0
Thickness -
DP2-1 100-yearGiven Data:
SA
Ditch SideslopeseE),
D50
Gs
D
- 1.00%- 0.010000= 2- 0.463648
= 40
- 0.698132= 6- 0.5= 2.66
= 0.81
= 62.43
1 (H:V, worst case)radiansdegrees Figure 3.2 (Assumptions: very rounded
10" riprap)radiansinches (maximum from above PMP riprap calc)
feet
feet (depth of flow from interior dike ditch
sizing calculations)
pounds/cubic foot (water)
Calculations:To
SF
D50
Thickness
= 0.505683= 0.20494= 0.18958= 0.122785= 1.384124
- - 61 inches=I inches
Calculation 388996-SW-01, Rev 3 Page 83 of 152

DP2 PMPGiven Data:
SA
Ditch Sideslopes
1.00%0.010000
2 1 (H:V, worst case)= 0.463648 radians
Figure 3.2 (Assumptions: very rounded4, = 40 degrees 10" riprap)
D 50
G,
D
Y
0.6981329
0.752.66
radiansinchesfeet
=3.15 feet (depth of flow from interior dike ditchsizing calculations)
= 62.43 pounds/cubic toot (water)
Calculation S:
To
11
13ri I
SF
D5hThickness
1.966545
0.5313250.4604120.3860751.035762
K,-.ý9i inches-1315, inches
DP2 100-yearGiven Data:
SA
Ditch Sideslopes6
D 5 0
GD
D
= 1.00%= 0.010000= 2= 0.463648
= 40
= 0.698132
= 9= 0.75= 2.66
= 1.27
= 62.43
radians
degrees
radiansinchesfeet
feet
1 (H:V, worst case)
Figure 3.2 (Assumptions: very rounded10" riprap)
(maximum from above PMP riprap calc)
(depth of flow from interior dike ditchsizing calculations)
pounds/cubic foot (water)
Calculations:To
n
riISF
D5hThickness
= 0.792861- 0.214217= 0.197927- 0.129219= 1.37228
= : 9 inches= t 13.5. inches
Calculation 388996-SW-01, Rev 3 Page 84 of 152

DP3-6 PMPGiven Data:
S =
D =Ditch Sideslopes =
e =
1.00%0.010000
2 1 (H:V, worst case)0.463648 radians
Figure 3.2 (Assumptions: very rounded40 degrees 10" riprap)
D50
G,
0.698132
50.416667
2.66
radiansinchesfeet
D
Y
Calculations:To
13r'
SF
=1.61 feet (depth of flow from interior dike ditchsizing calculations)
- 62.43 pounds/cubic foot (water)
= 1.005123= 0.488819= 0.428218= 0.348119- 1.073788
D 5 0
Thickness5i inches
7.51 inches
DP3-6 100-yearGiven Data:
S = 1.00%= 0.010000
Ditch Sideslopes = 20 = 0.463648
= 40
= 0.698132D50 = 5
= 0.416667Gs = 2.66
D = 0.67
y = 62.43
1 (H:V, worst case)radians
Figure 3.2 (Assumptions: very roundeddegrees 10" riprap)radiansinches (maximum from above PMP riprap calc)feet
feet (depth of flow from interior dike ditch
sizing calculations)
pounds/cubic foot (water)
Calculations:To
I'l
SF
D50
Thickness
- 0.418281= 0.203422= 0.188211- 0.121739= 1.386073
= -inches= 7_.5j inches
Calculation 388996-SW-01, Rev 3 Page 85 of 152

DP3-5 PMPGiven Data:
A1.00%
0.0100002:
0.463648 radiansDitch Sideslopes
01 (H:V, worst case)
Figure 3.2 (Assumptions: very rounded40 degrees 10" riprap)
D50
G,
D
Y
0.698132
6
0.52.66
radians
inchesfeet
S 1.95 feet (depth of flow from interior dike ditchsizing calculations)
= 62.43 pounds/cubic foot (water)
Calculations:To
13
SF
1.2173850.4933730.4317150.3521431.069619
D5h
Thickness = I'= l 6i inches9, inches
DP3-5 100-yearGiven Data:
SA
Ditch Sideslopes6
D50
G,
D
= 1.00%- 0.010000= 2:= 0.463648
= 40
= 0.698132= 6= 0.5= 2.66
= 0.81
= 62.43
radians
degrees
radiansinchesfeet
1 (H:V, worst case)
Figure 3.2 (Assumptions: very rounded10" riprap)
(maximum from above PMP riprap calc)
feet (depth of flow from interior dike ditchsizing calculations)
pounds/cubic foot (water)
Calculations:To
q'1
riSF
0.5056830.204940.18958
0.1227851.384124
D5o
Thickness= L 61 inches
9. inches
Calculation 388996-SW-01, Rev 3 Page 86 of 152

DP3-4 PMPGiven Data:
S =
=
Ditch Sideslopes =
1.00%0.010000
2 1 (H:V, worst case)8 = 0.463648 radians
Figure 3.2 (Assumptions: very roundedS = 40 degrees 10" riprap)
D50
G,
D
Y
0.698132
80.666667
2.66
radiansinchesfeet
=2.93 feet (depth of flow from interior dike ditchsizing calculations)
= 62.43 pounds/cubic foot (water)
Calculations:To
':3
SF
D5hThickness
1.8291990.5559940.4786290.4084931.014584
- L. .8; inches1,2 inches
DP3-4 100-yearGiven Data:
S =A =
Ditch Sideslopes =8 =
D50 =
G,
1.00%0.010000
20.463648
40
0.698132
80.666667
2.66
1 (H:V, worst case)radians
Figure 3.2 (Assumptions: very roundeddegrees 10" riprap)radians
inches (maximum from above PMP riprap calc)feet
feet (depth of flow from interior dike ditch
sizing calculations)
pounds/cubic foot (water)
D = 1.22
y = 62.43
Calculations:To
1:3
SF
D5hThickness
0.7616460.2315060.2134040.1413981.350534
-8 inches121; inches
Calculation 388996-SW-01, Rev 3 Page 87 of 152

DP3-3 PMPGiven Data:
S =
A =Ditch Sideslopes =
6 =
1.00%0.010000
20.463648 radians
1 (H:V, worst case)
Figure 3.2 (Assumptions: very rounded40 degrees 10" riprap)
D5o0.698132
80.666667
2.66
radiansinchesfeet
D =2.87 feet (depth of flow from interior dike ditchsizing calculations)
y = 62.43 pounds/cubic foot (water)
Calculations:To
13
riSF
D5hThickness
1.7917410.5446080.4702640.3981121.024279
- p 81 inches121 inches
DP3-3 100-yearGiven Da
Ditch SidesloI
ta:S = 1.00%A = 0.010000
es = 2:0 = 0.463648
= 40
= 0.698132D5o = 8
= 0.666667Gs = 2.66
D = 1.18
Y = 62.43
radians
degrees
radiansinchesfeet
feet
1 (H:V, worst case)
Figure 3.2 (Assumptions: very rounded10" riprap)
(maximum from above PMP riprap calc)
(depth of flow from interior dike ditchsizing calculations)
pounds/cubic foot (water)
Calculations:To
SF
0.7366740.2239160.2066220.1360211.360029
D5h
Thickness81 inches
121 inches
Calculation 388996-SW-01, Rev 3 Page 88 of 152

DP3-2 PMPGiven Data:
A =
1.00%0.010000
2:Ditch Sideslope 1 (H:V, worst case)a = 0.463648 radians
Figure 3.2 (Assumptions: very rounded4) = 40 degrees 10" riprap)
D5o
G,
D
Y
Calculations:To
ri
SF
D50
Thickness
Given Data:SA
Ditch Sideslopes6
4)
0.6981327
0.5833332.66
radiansinches
feet
=2.31 feet (depth of flow from interior dike ditchsizing calculations)
= 62.43 pounds/cubic foot (water)
= 1.442133
= 0.500964= 0.437519= 0.358873= 1.062721
- F 7i inches.10:5i inches
DP3-2 100-year
- 1.00%= 0.010000= 2= 0.463648
= 40
= 0.698132= 7= 0.583333= 2.66
radians
degrees
radiansinchesfeet
1 (H:V, worst case)
Figure 3.2 (Assumptions: very rounded10" riprap)
(maximum from above PMP riprap calc)D50
G,
D 0.94
Y 62.43
(depth of flow from interior dike ditchfeet sizing calculations)
pounds/cubic foot (water)
Calculations:To
13
SF
0.5868420.2038550.1886020.1220381.385516
D50
Thickness. .. 7 inches10.5; inches
Calculation 388996-SW-01, Rev 3 Page 89 of 152

DP3-1 PMPGiven Data:
SA
Ditch Sideslopes6
4)
D5o
G,
D
y
Calculations:To
13
rSSF
1.00%0.010000
20.463648
1 (H:V, worst case)radians
Figure 3.2 (Assumptions: very rounded40 degrees 10" riprap)
0.698132
90.752.66
radiansinchesfeet
=3.36 feet (depth of flow from interior dike ditchsizing calculations)
= 62.43 pounds/cubic foot (water)
= 2.097648= 0.566747= 0.486461= 0.418349= 1.005551
D 5 0
Thickness91 inches
13.51 inches
DP3-1 100-yearGiven Data:
S
Ditch Sideslopes
4)
D 5 0
G,
D
= 1.00%= 0.010000= 2= 0.463648
= 40
= 0.698132= 9= 0.75= 2.66
= 1.37
= 62.43
radians
degrees
radiansinchesfeet
feet
1 (H:V, worst case)
Figure 3.2 (Assumptions: very rounded10" riprap)
(maximum from above PMP riprap calc)
(depth of flow from interior dike ditchsizing calculations)
pounds/cubic foot (water)
Calculations:To
SF
D50
Thickness
0.855291
0.2310840.2130280.141098
1.35106
- L.
. 91 inches13.51 inches
Calculation 388996-SW-01, Rev 3 Page 90 of 152

DP3 PMPGiven Data:
S =A =
Ditch Sideslopes =
e =
1.00%0.010000
2:0.463648 radians
1 (H:V, worst case)
Figure 3.2 (Assumptions: very rounded40 degrees 10" riprap)
0.69813211
0.9166672.66
radiansinches
feet
D =4.05 feet (depth of flow from interior dike ditchsizing calculations)
y = 62.43 pounds/cubic foot (water)
Calculations:
To =
13 =
r]' =
SF =
D 5 0
Thickness =
2.5284150.5589270.4807710.4111761.012109
111 inches16.5. inches
DP3 100-yearGiven Data:
SA
Ditch Sideslopese
D50
Gs,
D
Y
= 1.00%- 0.010000= 2:= 0.463648
= 40
- 0.698132
= 11= 0.916667= 2.66
- 1.65
- 62.43
radiansFigure 3.2 (Assumptions: very rounded
degrees 10" riprap)
radiansinches (maximum from above PMP riprap calc)feet
feet (depth of flow from interior dike ditch
sizing calculations)
pounds/cubic foot (water)
1 (H:V, worst case)
Calculations:To
ri
SF
D50
Thickness
1.0300950.2277110.2100160.1387041.355272
16.5inches
inches
Calculation 388996-SW-01, Rev 3 Page 91 of 152

Honeywell Pond ClosureRock Slope Protection - Along a Side Slope
Ref: Development of Riprap Design Criteria by Riprap Testing in Flumes: Phase IIDivision of Low Level Waste Management and DecommissioningOffice of Nuclear Material Safety and SafeguardsU.S. Nuclear Regulatory CommissionNUREG/CR-4651, ORNL/TM-10100/V2Obtained from National Technical Information Service: U.S. Department of Commerce
Stephenson Method
1.0 Determine the Drn2
Use 7 1 3 Equation 3.15
D50 q(tan0)
6 nP6
Cg [(1 - np)(G,, -1)cosO(tano- tanO)Fl
Where:q the maximum flow rate per unit width
np = the rockfill porosity
g = the acceleration of gravityG, the relative density of the rock
0 = the angle of the slope measured from the horizontal4) = the angle of friction
C = the empirical factor (varies from 0.22 for gravel and pebbles to0.27 for crushed granite)
D50 the representative median stone size
2.0 Determine the Riprap Size and Layer Thickness
NUREG/CR-4651 recommends that the riprap thickness be a minimum of 2 times the D50.
Calculation 388996-SW-01, Rev 3 Page 92 of 152

Between A B-2 and DP1-8 (100-year)Given Data:o =
Average Width of Contributing Area =
q =np =
g =
G,
Sideslopes =
e =4, =
C =
1.28 cubic feet per second80.00 feet
0.016000 cubic feet per second/foot (maximum at A E-4)
50.00% (to be conservative)32.2 feet per second squared
2.663
0.32175140
0.6981320.220
1 (H:V)radiansdegrees (figure 3.2, Safety Factors Method)radians(to be conservative)
Calculations:D50
Minimum D50 Riprap Size
Minimum Riprap Layer Thickness
= 0.060014 feet- 0.720163 inches
Between A B-2 and DP1-8 (PMP)
1 inches2i inches
8 cubic feet per second)0 feet50 cubic feet per second/foot (maximum at A E-4)
Given Data:
Average Width of Contributing Ar
Sideslop
ea =
q =np =
g =
Gs =
es =
C =4, =
C =
13.180.0
0.16475
50.00322.6
0.3217.
0.69810.22
.2
363
51403220
(to be conservative)feet per second squared
1 (H:V)radiansdegrees (figure 3.2, Safety Factors Method)radians(to be conservative)
Calculations:D50
Minimum D50 Riprap Size
Minimum Riprap Layer Thickness
= 0.284045 feet= 3.408534 inches
V- L
41 inches_8I inches
Calculation 388996-SW-01, Rev 3 Page 93 of 152

Between A B-1 and DP1-7 (100-year)Given Data:
Q -Average Width of Contributing Area =
q =np =
g =
G,
Sideslopes =
e =C=
2.80 cubic feet per second80.00 feet
0.035000 cubic feet per second/foot (maximum at A E-4)
50.00% (to be conservative)32.2 feet per second squared
2.663
0.32175140
0.6981320.220
1 (H:V)radiansdegrees (figure 3.2, Safety Factors Method)radians(to be conservative)
Calculations:D5o
Minimum D50 Riprap Size
Minimum Riprap Layer Thickness
= 0.10113 feet= 1.213564 inches
= I 2i inches41 inches
Between A B-1 and DP1-7 (PMP)Given Data:
Average Width of Contributing Ar
Sideslop
Qea =
q =np =g =
G,
es =
e =
C =
31.8580.00
0.398125
50.00%32.2
2.663
0.32175140
0.6981320.220
cubic feet per secondfeetcubic feet per second/foot (maximum at A E-4)
(to be conservative)feet per second squared
1 (H:V)radiansdegrees (figure 3.2, Safety Factors Method)radians(to be conservative)
Calculations:D5o
Minimum D5o Riprap SizeMinimum Riprap Layer Thickness
= 0.511504 feet= 6.138049 inches
= F- S71, inches4 inches
Calculation 388996-SW-01, Rev 3 Page 94 of 152

Between A C-1 and DP1-5 (100-year)Given Data:
QAverage Width of Contributing Area =
q =np =
g =
G,
Sideslopes =
e
C =
2.80 cubic feet per second80.00 feet
0.035000 cubic feet per second/foot (maximum at A E-4)
50.00% (to be conservative)32.2 feet per second squared
2.663
0.32175140
0.6981320.220
1 (H:V)radiansdegrees (figure 3.2, Safety Factors Method)radians(to be conservative)
Calculations:D 50
Minimum D50 Riprap Size
Minimum Riprap Layer Thickness
= 0.10113 feet- 1.213564 inches
= 2' inches= .. . . . inches
Between A C-1 and DP1-5 (PMP)Given Data:
Average Width of Contributing Ar ea =
q =np =
Sideslop
Gs
es =
6 =
C =
35.8780.00
0.448375
50.00%32.2
2.663
0.32175140
0.6981320.220
cubic feet per secondfeetcubic feet per second/foot (maximum at A E-4)(to be conservative)feet per second squared
1 (H:V)radiansdegrees (figure 3.2, Safety Factors Method)radians(to be conservative)
Calculations:D5o
Minimum D50 Riprap Size
Minimum Riprap Layer Thickness
= 0.553686 feet= 6.644235 inches
inchesinches
Calculation 388996-SW-01, Rev 3 Page 95 of 152

Between A E-1 and DP1-3 (100-year)Given Data:
Q =Average Width of Contributing Area =
q =np =g =
G,
Sideslopes
e =
C =
5.17 cubic feet per second130.00 feet
0.039769 cubic feet per second/foot (maximum at A E-4)50.00% (to be conservative)
32.2 feet per second squared2.66
3: 1 (H:V)0.321751
400.698132
0.220
radiansdegrees (figure 3.2, Safety Factors Method)radians(to be conservative)
Calculations:D50
Minimum D50 Riprap SizeMinimum Riprap Layer Thickness
- 0.11012 feet= 1.321444 inches
Between A E-1 and DP1-3 (PMP)Given Data:
Q =
Average Width of Contributing Area =
q =np =
g =
G,
Sideslopes =
o =
C =
59.8130.0
0.4600(
50.0032
2.6
0.32175
0.69810.22
-- i2j inches4] inches
30 cubic feet per second)0 feet)0 cubic feet per second/foot (maximum at A E-4)
% (to be conservative).2 feet per second squared
363 1 (H:V)
51
3220
radiansdegrees (figure 3.2, Safety Factors Method)radians(to be conservative)
Calculations:D50
Minimum D50 Riprap SizeMinimum Riprap Layer Thickness
= 0.563216 feet- 6.758587 inches
- Li 71 inches14] inches
Calculation 388996-SW-01, Rev 3 Page 96 of 152

Between A E-7 and DP1 -2 (1 00-year)Given Data:
Q =
Average Width of Contributing Area =
q =np =
g =
G,
Sideslopes =
0 =
C =
4.4190.00
0.049000
50.00%32.2
2.66
cubic feet per secondfeetcubic feet per second/foot (maximum at A E-4)
(to be conservative)feet per second squared
30.321751
400.698132
0.220
1 (H:V)radiansdegrees (figure 3.2, Safety Factors Method)radians(to be conservative)
Calculations:
- 0.126561 feet= 1.518733 inches
2ý inches= . ... 41 inches
Minimum D50 Riprap Size
Minimum Riprap Layer Thickness
Between A E-7 and DP1-2 (PMP)Given Data:
Q =
Average Width of Contributing Area =
q =np =g =
G,
Sideslopes =
C =
C =
52.00 cubic feet per second90.00 feet
0.577778 cubic feet per second/foot (maximum at A E-4)
50.00% (to be conservative)32.2 feet per second squared
2.663: 1 (H:V)
0.321751 radians40 degrees (figure 3.2, Safety Factors Method)
0.698132 radians0.220 (to be conservative)
Calculations:D50
Minimum D50 Riprap SizeMinimum Riprap Layer Thickness
- 0.655657 feet= 7.867884 inches
= F 8 inches= •: 16 inches
Calculation 388996-SW-01, Rev 3 Page 97 of 152

Between A E-6 and DPI-1 (100-year)Given Data:
Q =
Average Width of Contributing Area =
q =np =
g =
G,
Sideslopes =
o =
C =
7.05 cubic feet per second220.00 feet
0.032045 cubic feet per second/foot (maximum at A E-4)
50.00% (to be conservative)32.2 feet per second squared
2.663: 1 (H:V)
0.321751 radians40 degrees (figure 3.2, Safety Factors Method)
0.698132 radians0.220 (to be conservative)
Calculations:D50
Minimum D50 Riprap SizeMinimum Riprap Layer Thickness
= 0.095356 feet= 1.14427 inches
2~1 inchesinches
Between A E-6 and DPI-1 (PMP)Given Data:
Q =
Average Width of Contributing Area =
q =np =g =
G,
Sideslopes =
e =
C, =
77.52220.00
0.352364
50.00%32.2
2.663
0.32175140
0.6981320.220
cubic feet per secondfeetcubic feet per second/foot (maximum at A E-4)(to be conservative)feet per second squared
1 (H:V)radiansdegrees (figure 3.2, Safety Factors Method)radians(to be conservative)
Calculations:D50
Minimum D50 Riprap Size
Minimum Riprap Layer Thickness
= 0.471516 feet= 5.658197 inches
- F 6 inches,12 inches
Calculation 388996-SW-01, Rev 3 Page 98 of 152

Between A E-5 and DP2-1 (100-year)Given Data:
Q -
Average Width of Contributing Areaq =
np
g =
G,
Sideslopes =
8 =
C =
3.64 cubic feet per second100.00 feet
0.036400 cubic feet per second/foot (maximum at A E-4)
50.00% (to be conservative)32.2 feet per second squared
2.66
30.321751
400.698132
0.220
1 (H:V)radiansdegrees (figure 3.2, Safety Factors Method)radians(to be conservative)
Calculations:D50
Minimum D50 Riprap SizeMinimum Riprap Layer Thickness
= 0.103809 feet- 1.245714 inches
= F . 21 inches. 4 inches
Between A E-5 and DP2-1 (PMP)Given Data:
QAverage Width of Contributing Ar
Sideslop
eaq =
np =
G ,
es =
e =
C =
42.90100.00
0.429000
50.00%32.2
2.663
0.32175140
0.6981320.220
cubic feet per secondfeetcubic feet per second/foot (maximum at A E-4)
(to be conservative)feet per second squared
1 (H:V)radiansdegrees (figure 3.2, Safety Factors Method)radians(to be conservative)
Calculations:D5o = 0.537619 feet
= 6.451424 inches
Minimum D50 Riprap SizeMinimum Riprap Layer Thickness
F 71 inches
14, inches
Calculation 388996-SW-01, Rev 3 Page 99 of 152

Between A E-4 and DP2-2 (100-year)Given Data:
Q =
Average Width of Contributing Area =
q =np =
g =
G,
Sideslopes =
0 =
=
C =
5.73 cubic feet per second130.00 feet
0.044077 cubic feet per second/foot (maximum at A E-4)
50.00% (to be conservative)32.2 feet per second squared
2.663
0.32175140
0.6981320.220
1 (H:V)radiansdegrees (figure 3.2, Safety Factors Method)radians(to be conservative)
Calculations:D50
Minimum D50 Riprap Size
Minimum Riprap Layer Thickness
= 0.117935 feet= 1.415223 inches
inches= . . 4 inches
Between A E-4 and DP2-2 (PMP)Given Da ta:
QAverage Width of Contributing Area
qnp
gGs
SideslopesC4)
C
62.95130.00
0.484231
50.00%32.2
2.663
0.32175140
0.6981320.220
cubic feet per secondfeetcubic feet per second/foot (maximum at A E-4)(to be conservative)feet per second squared
1 (H:V)radiansdegrees (figure 3.2, Safety Factors Method)radians(to be conservative)
Calculations:D50 0.582824 feet
= 6.993893 inches
Minimum D50 Riprap Size
Minimum Riprap Layer Thickness
F
- 117 1 inches
14. inches
Calculation 388996-SW-01, Rev 3 Page 100 of 152

Between A D-3 and DP3-1 (100-year)Given Data:
QAverage Width of Contributing Area
q
np =
g =Gs =
Sideslop
4.77 cubic feet per second100.00 feet
0.047700 cubic feet per second/foot (maximum at A E-4)
50.00% (to be conservative)32.2 feet per second squared
2.663 1 (H:V)
0.321751 radians40 degrees (figure 3.2, Safety Factors Method)
0.698132 radians0.220 (to be conservative)
6 =
C =
Calculations:D50 - 0.124313 feet
- 1.491751 inches
Minimum D50 Riprap Size
Minimum Riprap Layer Thickness
__ F 2 inches4; inches
Between A D-3 and DP3-1 (PMP)
Given Data:Q =
Average Width of Contributing Area =
q =np =g =
Gs
Sideslopes =
8 =
C =
55.25100.00
0.552500
50.00%32.2
2.663
0.32175140
0.6981320.220
cubic feet per secondfeetcubic feet per second/foot (maximum at A E-4)(to be conservative)feet per second squared
1 (H:V)radiansdegrees (figure 3.2, Safety Factors Method)radians(to be conservative)
Calculations:D50 = 0.636391 feet
= 7.636697 inches
= 81 inches= L .. .. 1j inches
Minimum D50 Riprap Size
Minimum Riprap Layer Thickness
Calculation 388996-SW-01, Rev 3 Page 101 of 152

Between A D-2 and DP3-3 (100-year)Given Data:
0 =
Average Width of Contributing Area =
q =rnp =
g =
G,
Sideslopes =
0 =
C =
1.48 cubic feet per second100.00 feet
0.014800 cubic feet per second/foot (maximum at A E-4)
50.00% (to be conservative)32.2 feet per second squared
2.663
0.32175140
0.6981320.220
1 (H:V)radiansdegrees (figure 3.2, Safety Factors Method)radians(to be conservative)
Calculations:D50
Minimum D50 Riprap Size
Minimum Riprap Layer Thickness
= 0.056974 feet- 0.683689 inches
11 inches2 inches
Between A D-2 and DP3-3 (PMP)Given Data:
Q =
Average Width of Contributing Area =
q =np =g =
G,
Sideslopes =
6 =4, =
C =
18.30100.00
0.183000
50.00%32.2
2.663
0.32175140
0.6981320.220
cubic feet per secondfeetcubic feet per second/foot (maximum at A E-4)
(to be conservative)feet per second squared
1 (H:V)radiansdegrees (figure 3.2, Safety Factors Method)radians(to be conservative)
Calculations:D5o = 0.304652 feet
= 3.65582 inches
Minimum D50 Riprap Size
Minimum Riprap Layer Thickness= V_
41 inches81 inches
Calculation 388996-SW-01, Rev 3 Page 102 of 152

Between A B-4 and DP3-6 (100-year)Given Data:
Q =
Average Width of Contributing Area =
q =np =
g =
G,
Sideslopes =6 =
4, =
C =
Calculations:D50 =
Minimum D50 Riprap Size =
Minimum Riprap Layer Thickness =
0.64 cubic feet per second80.00 feet
0.008000 cubic feet per second/foot (maximum at A E-4)
50.00% (to be conservative)32.2 feet per second squared
2.663 1 (H:V)
0.32175140
0.6981320.220
radiansdegrees (figure 3.2, Safety Factors Method)radians(to be conservative)
0.037806 feet0.453674 inches
r 1 inches21 inches
Between A B-4 and DP3-6 (PMP)Given Data:
QAverage Width of Contributing Area
Sideslop
q -np =
g =
G, -
es =
e =4, =
C =
7.1580.00
0.089375
50.00%32.2
2.663
0.32175140
0.6981320.220
cubic feet per secondfeetcubic feet per second/foot (maximum at A E-4)
(to be conservative)feet per second squared
1 (H:V)radiansdegrees (figure 3.2, Safety Factors Method)radians(to be conservative)
Calculations:D50
Minimum D50 Riprap Size
Minimum Riprap Layer Thickness
= 0.188935 feet= 2.267226 inches
F3 inches-6 inches
Calculation 388996-SW-01, Rev 3 Page 103 of 152

Between A B-3 and DP3-6 (100-year)Given Data:
Q =
Average Width of Contributing Area =
q =np =
g =
G,
Sideslopes =
6 =
C =
2.21 cubic feet per second70.00 feet
0.031571 cubic feet per second/foot (maximum at A E-4)
50.00% (to be conservative)32.2 feet per second squared
2.663
0.32175140
0.6981320.220
1 (H:V)radiansdegrees (figure 3.2, Safety Factors Method)radians(to be conservative)
Calculations:D50
Minimum D50 Riprap Size
Minimum Riprap Layer Thickness
= 0.094413 feet- 1.132957 inches
-2 inches= : 4A inches
Between A B-3 and DP3-6 (PMP)Given Data:
QAverage Width of Contributing Area
Sideslop
q
np =
g =
Gs
es =
C =
C =
22.6970.00
0.324143
50.00%32.2
2.663
0.32175140
0.6981320.220
cubic feet per secondfeetcubic feet per second/foot (maximum at A E-4)(to be conservative)feet per second squared
1 (H:V)radiansdegrees (figure 3.2, Safety Factors Method)radians(to be conservative)
Calculations:D5o = 0.445992 feet
= 5.351904 inches
61 inches= 12 inches
Minimum D50 Riprap Size
Minimum Riprap Layer Thickness
Calculation 388996-SW-01, Rev 3 Page 104 of 152

Worksheet for C1 (DPI-4) 100-year
Prrject Description
Friction Method Manning Formula
Solve For Normal Depth
Roughness Coefficient 0.024
Channel Slope 0.01000 ft/ft
Diameter 2.00 ft
Discharge 7.82 ft3/s
. .e .... . . . . .. . .. ...... . ... .uts
Normal Depth 1.16 ft
Flow Area 1.89 ft2
Wetted Perimeter 3.46 ft
Hydraulic Radius 0.55 ft
Top Width 1.97 ft
Critical Depth 0.99 ft
Percent Full 58.0 %
Critical Slope 0.01658 ft/ft
Velocity 4.13 ft/s
Velocity Head 0.27 ft
Specific Energy 1.43 ft
Froude Number 0.74
Maximum Discharge 13.18 ft3/s
Discharge Full 12.25 ft3/s
Slope Full 0.00407 ft/ft
Flow Type SubCritical
.GVF Input*Data _______
Downstream Depth 0.00 ft
Length 0.00 ft
Number Of Steps 0
.GVF Outpuit Data
Upstream Depth 0.00 ft
Profile Description
Profile Headloss 0.00 ft
Average End Depth Over Rise 0.00 %
Normal Depth Over Rise 58.05 %
Downstream Velocity Infinity ft/s
Bentley Systems, Inc. Haestad Methods SolBdotIL&d,4 Master V8i (SELECTseries 1) [08.11.01.03]9/4/2012 5:14:17 PM 27 Siemons Company Drive Suite 200 W Watertown, CT 06795 USA +1-203-755-1666 Page 1 of 2
Calculation 388996-SW-01, Rev 3 Page 105 of 152

Worksheet for C1 (DPI-4) 100-year
1 _F Output Data
Upstream Velocity
Normal Depth
Critical Depth
Channel Slope
Critical Slope
1Infinity ft/s
1.16 ft
0.99 ft
0.01000 ft/ft
0.01658 ft/ft
Bentley Systems, Inc. Haestad Methods SolBlotld;4*wMaster V8i (SELECTseries 1) [08.11.01.03]
27 Siemons Company Drive Suite 200 W Watertown, CT 06795 USA +1-203-755-1666 Page 2 of 29/4/2012 5:14:17 PM
Calculation 388996-SW-01, Rev 3 Page 106 of 152

Worksheet for C2 (DPI-6) 100-year
!Project Description
Friction Method
Solve For
!Input Data
Roughness Coefficient
Channel Slope
Diameter
Discharge
R sults .....
Normal Depth
Flow Area
Wetted Perimeter
Hydraulic Radius
Top Width
Critical Depth
Percent Full
Critical Slope
Velocity
Velocity Head
Specific Energy
Froude Number
Maximum Discharge
Discharge Full
Slope Full
Flow Type
IManning Formula
Normal Depth
0.024
0.01000 ft/t
1.25 ft
3.14 ft3
ft
/s
0.92
0.97
2.59
0.38
1.10
0.71
74.0
0.02087
3.23
0.16
1.09
0.60
3.76
3.50
0.00805
ftftZ
ft
ft
ft
ft
ft/ft
ft/s
ft
ft
ft3/s
ft3/s
ft/ft
SubCritical
G FInput Data ___.... -, -..... _.... . ,_
Downstream Depth 0.00 ft
Length 0.00 ft
Number Of Steps 0
ý6V-F but pcuit at a --,§ s~.~7?7~777 7 ~ 7 7~Upstream Depth 0.00 ft
Profile Description
Profile Headloss 0.00 ft
Average End Depth Over Rise 0.00 %
Normal Depth Over Rise 73.99 %
Downstream Velocity Infinity ft/s
Bentley Systems, Inc. Haestad Methods SolBtioddyetllwMaster V8i (SELECTseries 1) [08.11.01.03]27 Siemons Company Drive Suite 200 W Watertown, CT 06795 USA +1-203-755-1666 Page 1 of 29/4/2012 5:15:43 PM
Calculation 388996-SW-01, Rev 3 Page 107 of 152

Worksheet for C2 (DPI-6) 100-year
~GFOutput Data
Upstream Velocity
Normal Depth
Critical Depth
Channel Slope
Critical Slope
Infinity ft/s
0.92 ft
0.71 ft
0.01000 ft/ft
0.02087 ft/ft
Bentley Systems, Inc. Haestad Methods SoldtiottdpeAmMaster V8i (SELECTseries 1) [08.11.01.03]27 Siemons Company Drive Suite 200 W Watertown, CT 06795 USA +1-203-755-1666 Page 2 of 2914/2012 5:15:43 PM
Calculation 388996-SW-01, Rev 3 Page 108 of 152

Worksheet for C3 (DPI-8) 100-year
I-P ro!ie-c-t D esc6r ip t i-o -n
Friction Method
Solve For
[Input Data
Roughness Coefficient
Channel Slope
Diameter
Discharge
V•ieu Its -l
Normal Depth
Flow Area
Wetted Perimeter
Hydraulic Radius
Top Width
Critical Depth
Percent Full
Critical Slope
Velocity
Velocity Head
Specific Energy
Froude Number
Maximum Discharge
Discharge Full
Slope Full
Flow Type
,IVF Input Dat
Manning Formula
Normal Depth
_t
0.024
0.01000 ft/ft
1.00 ft
1.28 ft3/s
0.60 ft
0.49 ft2
1.76 ft
0.28 ft
0.98 ft
0.48 ft
59.5 %
0.02057 ft/ft
2.63 ft/s
0.11 ft
0.70 ft
0.66
2.08 ft3/s
1.93 ft3/s
0.00440 ft/ft
SubCritical
Downstream Depth
Length
Number Of Steps
P'VFOutputData
0.00 ft
0.00 ft
0
___ ~10.00
ft
0.00 ftUpstream Depth
Profile Description
Profile Headloss
Average End Depth Over Rise
Normal Depth Over Rise
Downstream Velocity
0.00 ft
0.00 %
59.51 %
Infinity ft/s
Bentley Systems, Inc. Haestad Methods SoIBfiottd;vwMasterV8i (SELECTseries 1) [08.11.01.03]27 Siemons Company Drive Suite 200 W Watertown, CT 06795 USA +1-203-755-1666 Page 1 of 29/4/2012 5:17:18 PM
Calculation 388996-SW-01, Rev 3 Page 109 of 152

__6_ Output Data
Upstream Velocity
Normal Depth
Critical Depth
Channel Slope
Critical Slope
Worksheet for C3 (DPI-8) 100-year
Infinity ft/s
0.60 ft
0.48 ft
0.01000 ft/ft
0.02057 ft/ft
Bentley Systems, Inc. Haestad Methods SolBfiotid~vituwMaster V8i (SELECTseries 1) [08.11.01.03]27 Siemons Company Drive Suite 200 W Watertown, CT 06795 USA +1-203-755-1666 Page 2 of 29/4/2012 5:17:18 PM
Calculation 388996-SW-01, Rev 3 Page 110 of 152

Froject Dscription
Friction Method
Solve For
Worksheet for C4 (DP3-2) 100-year
Manning Formula
Normal Depth
Roughness Coefficient
Channel Slope
Diameter
Discharge
L ; u -its .. . . .. _- .. . . . . . . . . . . ..
Normal Depth
Flow Area
Wetted Perimeter
Hydraulic Radius
Top Width
Critical Depth
Percent Full
Critical Slope
Velocity
Velocity Head
Specific Energy
Froude Number
Maximum Discharge
Discharge Full
Slope Full
Flow Type SubCritical
:OVF Input Data
Downstream Depth
Length
Number Of Steps
----------------------------------------------------- ------- J
0.024
0.01000 ft/ft
1.50 ft
4.18 ft3/s
0.96
1.19
2.77
0.43
1.44
0.78
63.7
0.01866
3.52
0.19
1.15
0.68
6.12
5.69
0.00540
ft
ft2
ft
ft
ft
ft
ft/ft
ft/s
ft
ft
ft3/s
ft3/s
ft/ft
0.00 ft
0.00 ft
0
[GVF Output Data,
Upstream Depth
Profile Description
Profile Headloss
Average End Depth Over Rise
Normal Depth Over Rise
Downstream Velocity
0.00 ft
0.00 ft
0.00 %
63.69 %
Infinity ft/s
Bentley Systems, Inc. Haestad Methods SolBkatlde4tt Master V8i (SELECTseries 1) [08.11.01.03]
27 Siemons Company Drive Suite 200 W Watertown, CT 06795 USA +1-203-755-1666 Page 1 of 29/4/2012 5:18:34 PM
Calculation 388996-SW-01, Rev 3 Page 111 of 152

Worksheet for C4 (DP3-2) 100-year
IGVF Output Data
Upstream Velocity
Normal Depth
Critical Depth
Channel Slope
Critical Slope
Infinity ft/s
0.96 ft
0.78 ft
0.01000 ft/ft
0.01866 ft/ft
Bentley Systems, Inc. Haestad Methods SolBodat1ljtwMaster V8i (SELECTseries 1) [08.11.01.03]27 Siemons Company Drive Suite 200 W Watertown, CT 06795 USA +1-203-755-1666 Page 2 of 291412012 5:18:34 PM
Calculation 388996-SW-01, Rev 3 Page 112 of 152

Worksheet for C5 (DP3-4) 100-year
IpojedtDescription
Friction Method
Solve For
ýInput Data
Roughness Coefficient
Channel Slope
Diameter
Discharge
lpýýults __
Manning Formula
Normal Depth
0.024
0.01000
2.00
8.38
Normal Depth
Flow Area
Wetted Perimeter
Hydraulic Radius
Top Width
Critical Depth
Percent Full
Critical Slope 0.'
Velocity
Velocity Head
Specific Energy
Froude Number
Maximum Discharge
Discharge Full
Slope Full 0.'
Flow Type SubCritical
GV F I h " tba~ta , '__-
Downstream Depth
Length
Number Of Steps
'GV OuputData
1.21
2.00
3.57
0.56
1.95
1.03
60.7
01685
4.20
0.27
1.49
0.73
13.18
12.25
00468
ft/ft
ft
ft3/s
ftft2
ft
ft
ft
ft
ft/ft
ft/s
ft
ft
ft3/s
ft3/s
ft/ft
__________ I
0.00 ft
0.00 ft
0
-iUpstream Depth
Profile Description
Profile Headloss
Average End Depth Over Rise
Normal Depth Over Rise
Downstream Velocity
0.00 ft
0.00 ft
0.00 %
60.71 %
Infinity ft/s
Bentley Systems, Inc. Haestad Methods SolBdottd•ibwMaster V8i (SELECTseries 1) [08.11.01.03]27 Siemons Company Drive Suite 200 W Watertown, CT 06795 USA +1-203-755-1666 Page 1 of 29/5/2012 12:33:23 PM
Calculation 388996-SW-01, Rev 3 Page 113 of 152

Worksheet for C5 (DP3-4) 100-year
OGF-_OutputData
Upstream Velocity
Normal Depth
Critical Depth
Channel Slope
Critical Slope
Infinity ft/s
1.21 ft
1.03 ft
0.01000 ft/ft
0.01685 ft/ft
Bentley Systems, Inc. Haestad Methods SolBiotai4dpa Master V8i (SELECTseries 1) 108.11.01.03]27 Siemons Company Drive Suite 200 W Watertown, CT 06795 USA +1-203-755-1666 Page 2 of 29/5/2012 12:33:23 PM
Calculation 388996-SW-01, Rev 3 Page 114 of 152

Worksheet for C6 (DP3) 100-year
[Prject Description
Friction Method
Solve For
!In"ut Data
Roughness Coefficient
Channel Slope
Diameter
Discharge
Manning Formula
Normal Depth
[Results :
Normal Depth
Flow Area
Wetted Perimeter
Hydraulic Radius
Top Width
Critical Depth
Percent Full
Critical Slope
Velocity
Velocity Head
Specific Energy
Froude Number
Maximum Discharge
Discharge Full
Slope Full
Flow Type SubCritical
[GVF Input.Data:
Downstream Depth
Length
Number Of Steps
-GVF Output Data
Upstream Depth
Profile Description
Profile Headloss
Average End Depth Over Rise
Normal Depth Over Rise
Downstream Velocity
0.024
0.01000
2.50
18.82
1.77
3.71
4.99
0.74
2.28
1.47
70.6
0.01690
5.08
0.40
2.17
0.70
23.90
22.22
0.00718
ft/ft
ft
ft3/s
ftft2
ft
ft
ft
ft
ft/ft
ft/s
ft
ft
ft2/s
ft3/s
ft/ft
0.00 ft
0.00 ft
0
0.00 ft
0.00 ft
0.00 %
70.63 %
Infinity ft/s
Bentley Systems, Inc. Haestad Methods SolBtdottdeFbwmMaster V8i (SELECTseries 1) [08.11.01.03]27 Siemons Company Drive Suite 200 W Watertown, CT 06795 USA +1-203-755-1666 Page 1 of 29/512012 12:34:15 PM
Calculation 388996-SW-01, Rev 3 Page 115 of 152

Worksheet for C6 (DP3) 100-year
LGF Output Data
Upstream Velocity
Normal Depth
Critical Depth
Channel Slope
Critical Slope
Infinity ft/s
1.77 ft
1.47 ft
0.01000 ft/ft
0.01690 ft/ft
Bentley Systems, Inc. Haestad Methods SolBlbottdp~Master V8i (SELECTseries 1) [08.11.01.03]
27 Siemons Company Drive Suite 200 W Watertown, CT 06795 USA +1-203-755-1666 Page 2 of 29/5/2012 12:34:15 PM
Calculation 388996-SW-01, Rev 3 Page 116 of 152

Friction Method
Solve For
nutData
Roughness Coefficient
Channel Slope
Diameter
Discharge
Results T_ IY _- I
Worksheet for C7 (DP3) 100-year
Manning Formula
Normal Depth
0.024
0.01000 ft/ft
2.50 ft
18.82 ft/s
Normal Depth
Flow Area
Wetted Perimeter
Hydraulic Radius
Top Width
Critical Depth
Percent Full
Critical Slope
Velocity
Velocity Head
Specific Energy
Froude Number
Maximum Discharge
Discharge Full
Slope Full
Flow Type SubCritical
ýG-VF Input Data____
Downstream Depth
Length
Number Of Steps
,GVF Output Data _ _ _ _
Upstream Depth
Profile Description
Profile Headloss
Average End Depth Over Rise
Normal Depth Over Rise
Downstream Velocity
1.77
3.71
4.99
0.74
2.28
1.47
70.6
0.01690
5.08
0.40
2.17
0.70
23.90
22.22
0.00718
ft
ft2
ft
ft
ft
ft
ft/ft
ft/s
ft
ft
ftI/s
ftI/s
ft/ft
0.00 ft
0.00 ft
0
0.00 ft
0.00 ft
0.00 %
70.63 %
Infinity ft/s
Bentley Systems, Inc. Haestad Methods SolBdnottI14wMasterV8i (SELECTseries 1) [08.11.01.03127 Siemons Company Drive Suite 200 W Watertown, CT 06795 USA +1-203-755-1666 Page 1 of 29/5/2012 12:34:59 PM
Calculation 388996-SW-01, Rev 3 Page 117 of 152

Worksheet for C7 (DP3) 100-year
16y -Output Data 117 1117]Upstream Velocity
Normal Depth
Critical Depth
Channel Slope
Critical Slope
Infinity ft/s
1.77 ft
1.47 ft
0.01000 ft/ft
0.01690 ft/ft
Bentley Systems, Inc. Haestad Methods SolBtIotl4•d4vMaster V8i (SELECTseries 1) [08.11.01.03]27 Siemons Company Drive Suite 200 W Watertown, CT 06795 USA +1-203-755-1666 Page 2 of 29/5/2012 12:34:59 PM
Calculation 388996-SW-01, Rev 3 Page 118 of 152

Worksheet for C8 (DP2) 100-year
tDescription
Friction Method
Solve For
i~putData
Roughness Coefficient
Channel Slope
Diameter
Discharge
Manning Formula
Normal Depth
0.024
0.01000
2.00
9.36
Normal Depth 1.31
Flow Area 2.18
Wetted Perimeter 3.77
Hydraulic Radius 0.58
Top Width 1.90
Critical Depth 1.09
Percent Full 65.5
Critical Slope 0.01736
Velocity 4.30
Velocity Head 0.29
Specific Energy 1.60
Froude Number 0.71
Maximum Discharge 13.18
Discharge Full 12.25
Slope Full 0.00584
Flow Type SubCritical
jG'VF Input Data _____
ft/ft
ftft3/s
ftft2
ft
ft
ft
ft
ft/ft
ft/s
ft
ft
ft3/s
ft3/s
ft/ft
Downstream Depth 0.00 ft
Length 0.00 ft
Number Of Steps 0
___V Output Dat
Upstream Depth
Profile Description
Profile Headloss
Average End Depth Over Rise
Normal Depth Over Rise
Downstream Velocity
0.00 ft
0.00 ft
0.00
65.45
Infinity ft/s
Bentley Systems, Inc. Haestad Methods SolBbotLicefiuMaster V8i (SELECTseries 1) [08.11.01.03127 Siemons Company Drive Suite 200 W Watertown, CT 06795 USA +1-203-755-1666 Page 1 of 29/5/2012 12:35:50 PM
Calculation 388996-SW-01, Rev 3 Page 119 of 152

Worksheet for C8 (DP2) 100-year
'GVF Output Data
Upstream Velocity
Normal Depth
Critical Depth
Channel Slope
Critical Slope
Infinity ft/s
1.31 ft
1.09 ft
0.01000 ft/ft
0.01736 ft/ft
Bentley Systems, Inc. Haestad Methods SoIBkoat~dPtkxrMaster V8i (SELECTseries 1) [08.11.01.03]
27 Siemons Company Drive Suite 200 W Watertown, CT 06795 USA +1-203-755-1666 Page 2 of 29/5/2012 12:35:50 PM
Calculation 388996-SW-01, Rev 3 Page 120 of 152

Worksheet for C9 (DPI) 100-year
iirPqject De scriptio n
Friction Method
Solve For
Input Data
Manning Formula
Normal Depth
Roughness Coefficient
Channel Slope
Diameter
Discharge
r u-- I; t. - = .s ....i Results i...
0.024
0.01000
3.00
34.47
Normal Depth
Flow Area
Wetted Perimeter
Hydraulic Radius
Top Width
Critical Depth
Percent Full
Critical Slope 0
Velocity
Velocity Head
Specific Energy
Froude Number
Maximum Discharge
Discharge Full
Slope Full C
Flow Type SubCritical
GVF Input Data-___ --
Downstream Depth
Length
Number Of Steps
GVF Output Data
Upstream Depth
Profile Description
Profile Headloss
Average End Depth Over Rise
Normal Depth Over Rise
Downstream Velocity
2.34
5.92
6.50
0.91
2.48
1.91
78.1
.01696
5.82
0.53
2.87
0.66
38.86
36.13
1.00910
ft/ft
ft
ft3/s
ft
ft2
ft
ft
ft
ft
ft/ft
ft/s
ft
ft
ft3/s
ft3/s
ft/ft
0.00
0.00
0
ft
ft
0.00 ft
0.00 ft
0.00 %
78.13 %
Infinity ft/s
Bentley Systems, Inc. Haestad Methods SoIBkaot1d;AswMaster V8i (SELECTseries 1) [08.11.01.03]27 Siemons Company Drive Suite 200 W Watertown, CT 06795 USA +1-203-755-1666 Page 1 of 29/5/2012 12:36:50 PM
Calculation 388996-SW-01, Rev 3 Page 121 of 152

iGF ýOutput Data-
Upstream Velocity
Normal Depth
Critical Depth
Channel Slope
Critical Slope
Worksheet for C9 (DP1) 100-year
Infinity ft/s
2.34 ft
1.91 ft
0.01000 ft/ft
0.01696 ft/ft
Bentley Systems, Inc. Haestad Methods SoIB~kot1dEwMaster V8i (SELECTseries 1) [08.11.01.03]27 Siemons Company Drive Suite 200 W Watertown, CT 06795 USA +1-203-755-1666 Page 2 of 29/5/2012 12:36:50 PM
Calculation 388996-SW-01, Rev 3 Page 122 of 152

Worksheet for C10 (DP3-6) 100-year
VFýroject Description
Friction Method
Solve For
[Inp"ut Data
Roughness Coefficient
Channel Slope
Diameter
Discharge
[ e ults
Normal Depth
Flow Area
Wetted Perimeter
Hydraulic Radius
Top Width
Critical Depth
Percent Full
Critical Slope
Velocity
Velocity Head
Specific Energy
Froude Number
Maximum Discharge
Discharge Full
Slope Full
Flow Type
Manning Formula
Normal Depth
0.024
0.01000 ft/ft
1.25 ft
2.21 ft3/s
0.72
0.73
2.16
0.34
1.24
0.59
57.7
0.01905
3.02
0.14
0.86
0.69
3.76
3.50
0.00399
ftft2
ft
ft
ft
ft
ft/ft
ft/s
ft
ft
ft3/s
ft3/s
ft/ft
SubCritical
iGVF Input Data __-L--ý2 __ _ _ _
Downstream Depth
Length
Number Of Steps
#Lý\FOutpu•t D ta:L ::t• C • C•C
Upstream Depth
Profile Description
Profile Headloss
Average End Depth Over Rise
Normal Depth Over Rise
Downstream Velocity
0.00 ft
0.00 ft
0
................ ....... __...... 7- T 7777C••
0.00 ft
0.00 ft
0.00 %
57.67 %
Infinity ft/s
Bentley Systems, Inc. Haestad Methods SolB16otId4E1eMaster V8i (SELECTseries 1) [OB.11.01.03]
27 Siemons Company Drive Suite 200 W Watertown, CT 06795 USA +1-203-755-1666 Page 1 of 29/4/2012 5:26:05 PM
Calculation 388996-SW-01, Rev 3 Page 123 of 152

Worksheet for CIO (DP3-6) 100-year
bGVF Output Data
Upstream Velocity
Normal Depth
Critical Depth
Channel Slope
Critical Slope
Infinity ft/s
0.72 ft
0.59 ft
0.01000 ft/ft
0.01905 ft/ft
Bentley Systems, Inc. Haestad Methods SoIBbottd14twMaster V8i (SELECTseries 1) (08.11.01.03]
27 Siemons Company Drive Suite 200 W Watertown, CT 06795 USA +1-203-755-1666 Page 2 of 29/4/2012 5:26:05 PM
Calculation 388996-SW-01, Rev 3 Page 124 of 152

Worksheet for C1 (DPI-4) PMP
Project-bescription
Friction Method
Solve For
Roughness Coefficient
Channel Slope
Diameter
Discharge
PResu Its,
Manning Formula
Normal Depth
Normal Depth
Flow Area
Wetted Perimeter
Hydraulic Radius
Top Width
Critical Depth
Percent Full
Critical Slope
Velocity
Velocity Head
Specific Energy
Froude Number
Maximum Discharge
Discharge Full
Slope Full
Flow Type
ýGVFlnput Data:
0.024
0.01000
4.50
87.84
3.11
11.74
8.84
1.33
4.15
2.75
69.2
0.01429
7.48
0.87
3.98
0.78
114.58
106.51
0.00680
ft/ft
ft
ft3/s
ftft2
ft
ft
ft
ft
ft/ft
ft/s
ft
ft
ft3/s
ft3/s
ft/ft
SubCritical
Downstream Depth 0.00 ft
Length 0.00 ft
Number Of Steps 0
,GVF Output Data . _ _
0.00 ftUpstream Depth
Profile Description
Profile Headloss
Average End Depth Over Rise
Normal Depth Over Rise
Downstream Velocity
0.00 ft
0.00 %
69.20 %
Infinity ft/s
Bentley Systems, Inc. Haestad Methods SolBtlotfdiridjwMaster V8i (SELECTseries 1) [08.11.01.03]27 Siemons Company Drive Suite 200 W Watertown, CT 06795 USA +1-203-755-1666 Page 1 of 29/5/2012 9:32:06 AM
Calculation 388996-SW-01, Rev 3 Page 125 of 152

Worksheet for C1 (DP1-4) PMP
IeVF Output Data
Upstream Velocity
Normal Depth
Critical Depth
Channel Slope
Critical Slope
IJ
Infinity ft/s
3.11 ft
2.75 ft
0.01000 ft/ft
0.01429 ft/ft
Bentley Systems, Inc. Haestad Methods SoIB13ntd•l;4*wMaster V8i (SELECTseries 1) [08.11.01.03]27 Siemons Company Drive Suite 200 W Watertown, CT 06795 USA +1-203-755-1666 Page 2 of 2915/2012 9:32:06 AM
Calculation 388996-SW-01, Rev 3 Page 126 of 152

Worksheet for C2 (DPI-6) PMP
- - - - - " : ..o r
Friction Method
Solve For
Roughness Coefficient
Channel Slope
Diameter
Discharge
,_esults -
Manning Formula
Normal Depth
Normal Depth
Flow Area
Wetted Perimeter
Hydraulic Radius
Top Width
Critical Depth
Percent Full
Critical Slope
Velocity
Velocity Head
Specific Energy
Froude Number
Maximum Discharge
Discharge Full
Slope Full
Flow Type
1QYF riout Nata_-
Downstream Depth
Length
Number Of Steps
{GVFOtutput Data
Upstream Depth
Profile Description
Profile Headloss
Average End Depth Over Rise
Normal Depth Over Rise
Downstream Velocity
0.024
0.01000
3.00
32.94
2.25
5.69
6.28
0.91
2.60
1.86
75.0
0.01660
5.79
0.52
2.77
0.69
38.86
36.13
0.00831
ft/ft
ft
ft3/s
ftft2
ft
ft
ft
ft
ft/ft
ft/s
ft
ft
ftf/s
ft3/s
ft/ft
SubCritical
0.00 ft
0.00 ft
0
___j
0.00 ft
0.00 ft
0.00 %
75.00 %
Infinity ft/s
Bentley Systems, Inc. Haestad Methods SoIBfotle44'wMaster V8i (SELECTseries 1) (08.11.01.03]27 Siemons Company Drive Suite 200 W Watertown, CT 06795 USA +1-203-755-1666 Page 1 of 2914/2012 5:16:24 PM
Calculation 388996-SW-01, Rev 3 Page 127 of 152

Worksheet for C2 (DP1-6) PMP
VF Output Data
Upstream Velocity
Normal Depth
Critical Depth
Channel Slope
Critical Slope
Infinity ft/s
2.25 ft
1.86 ft
0.01000 ft/ft
0.01660 ft/ft
Bentley Systems, Inc. Haestad Methods SolBlottd~erAvMaster V8i (SELECTseries 1) [08.11.01.03]27 Siemons Company Drive Suite 200 W Watertown, CT 06795 USA +1-203-755-1666 Page 2 of 29/4/2012 5:16:24 PM
Calculation 388996-SW-01, Rev 3 Page 128 of 152

[project Description
Friction Method
Solve For
Worksheet for C3 (DPI-8) PMP
Manning Formula
Normal Depth
[puPIt Data
Roughness Coefficient
Channel Slope
Diameter
Discharge
jesults
Normal Depth
Flow Area
Wetted Perimeter
Hydraulic Radius
Top Width
Critical Depth
Percent Full
Critical Slope
Velocity
Velocity Head
Specific Energy
Froude Number
Maximum Discharge
Discharge Full
Slope Full
Flow Type SubCritical
Downstream Depth
Length
Number Of Steps
0.024
0.01000
2.00
13.18
1.87
3.06
5.26
0.58
0.98
1.31
93.5
0.01993
4.31
0.29
2.16
0.43
13.18
12.25
0.01157
ft/ft
ft
ft3/s
ftft2
ft
ft
ft
ft
ft/ft
ft/s
ft
ft
ft3/s
ft2/s
ft/ft
.7]
0.00 ft
0.00 ft
0
19YF Output- Data
Upstream Depth
Profile Description
Profile Headloss
Average End Depth Over Rise
Normal Depth Over Rise
Downstream Velocity
0.00 ft
0.00 ft
0.00 %
93.54 %
Infinity ft/s
Bentley Systems, Inc. Haestad Methods SolBfatldofikwMaster V8i (SELECTseries 1) [08.11.01.03]27 Siemons Company Drive Suite 200 W Watertown, CT 06795 USA +1-203-755-1666 Page 1 of 29/412012 5:17:52 PM
Calculation 388996-SW-01, Rev 3 Page 129 of 152

IGVF Output Data
Upstream Velocity
Normal Depth
Critical Depth
Channel Slope
Critical Slope
Worksheet for C3 (DP1-8) PMP
Infinity ft/s
1.87 ft
1.31 ft
0.01000 ft/ft
0.01993 ft/ft
Bentley Systems, Inc. Haestad Methods SolBkjotldýjIsMaster V8i (SELECTseries 1) [08.11.01.03]27 Siemons Company Drive Suite 200 W Watertown, CT 06795 USA +1-203-755-1666 Page 2 of 29/4/2012 5:17:52 PM
Calculation 388996-SW-01, Rev 3 Page 130 of 152

oProject Description
Friction Method
Solve For
Worksheet for C4 (DP3-2) PMP
Manning Formula
Normal Depth
Inpu-t Data
Roughness Coefficient
Channel Slope
Diameter
Discharge
•Resu ts -
Normal Depth
Flow Area
Wetted Perimeter
Hydraulic Radius
Top Width
Critical Depth
Percent Full
Critical Slope
Velocity
Velocity Head
Specific Energy
Froude Number
Maximum Discharge
Discharge Full
Slope Full
Flow Type SubCritical
GV Iri-Lit-D- ta __
Downstream Depth
Length
Number Of Steps
0.024
0.01000
3.50
46.12
ft/ft
ftft3/s
2.47 ft
7.26 ft2
6.98 ft
1.04 ft
3.19 ft
2.12 ft
70.6 %
0.01543 ft/ft
6.35 ft/s
0.63 ft
3.10 ft
0.74
58.62 ft3/s
54.49 ft3/s
0.00716 ft/ft
0.00 ft
0.00 ft
0
§GVY u'tput Data~(<. ~__~ - <
Upstream Depth 0.00 ft
Profile Description
Profile Headloss 0.00 ft
Average End Depth Over Rise 0.00 %
Normal Depth Over Rise 70.58 %
Downstream Velocity Infinity ft/s
Bentley Systems, Inc. Haestad Methods SoIBtjottId~bwMaster V8i (SELECTseries 1) [08.11.01.03]
27 Siemons Company Drive Suite 200 W Watertown, CT 06795 USA +1-203-755-1666 Page 1 of 29/4/2012 5:19:17 PM
Calculation 388996-SW-01, Rev 3 Page 131 of 152

Worksheet for C4 (DP3-2) PMP
iGVF Output Data
Upstream Velocity
Normal Depth
Critical Depth
Channel Slope
Critical Slope
Infinity ft/s
2.47 ft
2.12 ft
0.01000 ft/ft
0.01543 ft/ft
Bentley Systems, Inc. Haestad Methods SolBfiotatldMaster V8i (SELECTseries 1) 108.11.01.03]27 Siemons Company Drive Suite 200 W Watertown, CT 06795 USA +1-203-755-1666 Page 2 of 29/4/2012 5:19:17 PM
Calculation 388996-SW-01, Rev 3 Page 132 of 152

Worksheet for C5 (DP3-4) PMP
PrectDes ription .
Friction Method
Solve For
,Input Data
Manning Formula
Normal Depth
........ -J
Roughness Coefficient 0.024
Channel Slope 0.01000 ft/ft
Diameter 4.50 ft
Discharge 87.67 ft3/s
FIResults.
Normal Depth 3.11 ft
Flow Area 11.72 ft2
Wetted Perimeter 8.83 ft
Hydraulic Radius 1.33 ft
Top Width 4.16 ft
Critical Depth 2.74 ft
Percent Full 69.1 %
Critical Slope 0.01428 ft/ft
Velocity 7.48 ft/s
Velocity Head 0.87 ft
Specific Energy 3.98 ft
Froude Number 0.79
Maximum Discharge 114.58 ft3/s
Discharge Full 106.51 ft3/s
Slope Full 0.00677 ft/ft
Flow Type SubCritical
[GVFInu Data
Downstream Depth 0.00 ft
Length 0.00 ft
Number Of Steps 0
r(-F:utput :Data.,'
Upstream Depth 0.00 ft
Profile Description
Profile Headloss 0.00 ft
Average End Depth Over Rise 0.00 %
Normal Depth Over Rise 69.10 %
Downstream Velocity Infinity ft/s
Bentley Systems, Inc. Haestad Methods SoIBkdoL1tt4=rbwMaster V8i (SELECTseries 1) [08.11.01.03]27 Siemons Company Drive Suite 200 W Watertown, CT 06795 USA +1-203-755-1666 Page 1 of 29/5/2012 9:32:58 AM
Calculation 388996-SW-01, Rev 3 Page 133 of 152

Worksheet for C5 (DP3-4) PMPIGVF_ out put Data ............
Upstream Velocity
Normal Depth
Critical Depth
Channel Slope
Critical Slope
Infinity ft/s
3.11 ft
2.74 ft
0.01000 ft/ft
0.01428 ft/ft
Bentley Systems, Inc. Haestad Methods SoIBkitod•AmvMaster V8i (SELECTseries 1) 108.11.01.03]27 Siemons Company Drive Suite 200 W Watertown, CT 06795 USA +1-203-755-1666 Page 2 of 29/5/2012 9:32:58 AM
Calculation 388996-SW-01, Rev 3 Page 134 of 152

Worksheet for C6 (DP3) PMP
-IjProect Description
Friction Method
Solve For
tInojut Data
Roughness Coefficient
Channel Slope
Diameter
Discharge
Normal Depth
Flow Area
Wetted Perimeter
Hydraulic Radius
Top Width
Critical Depth
Percent Full
Critical Slope
Velocity
Velocity Head
Specific Energy
Froude Number
Maximum Discharge
Discharge Full
Slope Full
Flow Type
GWF Input Data~
Downstream Depth
Length
Number Of Steps
GVFOutput Data
Manning Formula
Normal Depth
0.024
0.01000
6.00
207.34
4.47
22.57
12.49
1.81
5.23
3.94
74.4
0.01389
9.19
1.31
5.78
0.78
246.75
229.39
0.00817
ft/ft
ft
ftl/s
ft
ft2
ft
ft
ft
ft
ft/ft
ft/s
ft
ft
ft3/s
ft3/s
ft/ft
SubCritical
- ... •.00 f
0.00 ft
0.00 ft0
Upstream Depth
Profile Description
Profile Headloss
Average End Depth Over Rise
Normal Depth Over Rise
Downstream Velocity
0.00 ft
0.00 ft
0.00 %
74.44 %
Infinity ft/s
Bentley Systems, Inc. Haestad Methods SoIBfatldoudkftvMasterV8i (SELECTseries 1) [08.11.01.03]27 Siemons Company Drive Suite 200 W Watertown, CT 06795 USA +1-203-755-1666 Page 1 of 29/5/2012 9:33:35 AM
Calculation 388996-SW-01, Rev 3 Page 135 of 152

Worksheet for C6 (DP3) PMP
GFOutput Data
Upstream Velocity
Normal Depth
Critical Depth
Channel Slope
Critical Slope
i1Infinity ft/s
4.47 ft
3.94 ft
0.01000 ft/ft
0.01389 ft/ft
Bentley Systems, Inc. Haestad Methods SolBotedqeFflvMaster V~i (SELECTseries 1) 108.111.01.03]27 Siemons Company Drive Suite 200 W Watertown, CT 06795 USA +1-203-755-1666 Page 2 of 29/5/2012 9:33:35 AM
Calculation 388996-SW-01, Rev 3 Page 136 of 152

Worksheet for C7 (DP3) PMP
Project Description
Friction Method Manning Formula
Solve For Normal Depth
Irr -- -- -- - - - - - - - - --
Ilnput Data - - -- ~------- - - - - --- ~~ -- ~
Roughness Coefficient 0.024
Channel Slope 0.01000 ft/ft
Diameter 6.00 ft
Discharge 207.34 ft3/s
,FRe'ults
Normal Depth 4.47 ft
Flow Area 22.57 ft2
Wetted Perimeter 12.49 ft
Hydraulic Radius 1.81 ft
Top Width 5.23 ft
Critical Depth 3.94 ft
Percent Full 74.4 %
Critical Slope 0.01389 ft/ft
Velocity 9.19 ft/s
Velocity Head 1.31 ft
Specific Energy 5.78 ft
Froude Number 0.78
Maximum Discharge 246.75 ft3/s
Discharge Full 229.39 ft2/s
Slope Full 0.00817 ft/ft
Flow Type SubCritical
P FMnput Dataý _ _ _... . _ .... _ _
Downstream Depth 0.00 ft
Length 0.00 ft
Number Of Steps 0
GF otputData'....
Upstream Depth 0.00 ft
Profile Description
Profile Headloss 0.00 ft
Average End Depth Over Rise 0.00 %
Normal Depth Over Rise 74.44 %
Downstream Velocity Infinity ft/s
Bentley Systems, Inc. Haestad Methods SoIBtiatt•d4twMaster V8i (SELECTseries 1) [08.11.01.03]9/5/2012 9:34:24 AM 27 Siemons Company Drive Suite 200 W Watertown, CT 06795 USA +1-203-755-1666 Page 1 of 2
Calculation 388996-SW-01, Rev 3 Page 137 of 152

Worksheet for C7 (DP3) PMP _
iGIF Output Data
Upstream Velocity
Normal Depth
Critical Depth
Channel Slope
Critical Slope
Infinity ft/s
4.47 ft
3.94 ft
0.01000 ft/ft
0.01389 ft/ft
Bentley Systems, Inc. Haestad Methods SoIBteotId•vF~mRMaster V~i (SELECTseries 1) 108.11.01.03127 Siemons Company Drive Suite 200 W Watertown, CT 06795 USA +1-203-755-1666 Page 2 of 29/5/2012 9:34:24 AM
Calculation 388996-SW-01, Rev 3 Page 138 of 152

Project Description
Friction Method
Solve For
lInput Data. . .
Roughness Coefficient
Channel Slope
Diameter
Discharge
Reults
Normal Depth
Flow Area
Wetted Perimeter
Hydraulic Radius
Top Width
Critical Depth
Percent Full
Critical Slope
Velocity
Velocity Head
Specific Energy
Froude Number
Maximum Discharge
Discharge Full
Slope Full
Flow Type
,GVF Input Data
Worksheet for C8 (DP2) PMP
Manning Formula
Normal Depth
0.024
0.01000 ft/ft
4.50 ft
105.85 ft3/s
....... 1.... J
3.66
13.86
10.12
1.37
3.50
3.03
81.4
0.01570
7.63
0.91
4.57
0.68
114.58
106.51
0.00988
ftft2
ft
ft
ft
ft
ft/ft
ft/s
ft
ft
ft3/s
fna/s
ft/ft
SubCritical
_ _ _ _ _ _ _
Downstream Depth
Length
Number Of Steps
iGVF Output Data, %
Upstream Depth
Profile Description
Profile Headloss
Average End Depth Over Rise
Normal Depth Over Rise
Downstream Velocity
0.00 ft
0.00 ft
0
00 fi
0.00 ft
0.00 ft
0.00 %
81.41 %
Infinity ft/s
Bentley Systems, Inc. Haestad Methods SolBfiotld•eIbisMaster V8i (SELECTseries 1) [08.11.01.03]27 Siemons Company Drive Suite 200 W Watertown, CT 06795 USA +1-203-755-1666 Page 1 of 29/5/2012 9:37:47 AM
Calculation 388996-SW-01, Rev 3 Page 139 of 152

Worksheet for C8 (DP2) PMP
G'F Output Daqta
Upstream Velocity
Normal Depth
Critical Depth
Channel Slope
Critical Slope
Infinity ft/s
3.66 ft
3.03 ft
0.01000 ft/ft
0.01570 ft/ft
Bentley Systems, Inc. Haestad Methods SoIBfiottd~edbjrMaster V8i (SELECTseries 1) [08.11.01.03]27 Siemons Company Drive Suite 200 W Watertown, CT 06795 USA +1-203-755-1666 Page 2 of 29/5/2012 9:37:47 AM
Calculation 388996-SW-01, Rev 3 Page 140 of 152

Worksheet for C9 (DPI) PMP
Pr2oject Description
Friction Method
Solve For
Manning Formula
Normal Depth
Input Data
Roughness Coefficient
Channel Slope
Diameter
Discharge
I~uts
Normal Depth
Flow Area
Wetted Perimeter
Hydraulic Radius
Top Width
Critical Depth
Percent Full
Critical Slope
Velocity
Velocity Head
Specific Energy
Froude Number
Maximum Discharge
Discharge Full
Slope Full
Flow Type
LGV Input Data'
Downstream Depth
Length
Number Of Steps
0.024
0.01000 ft/ft
7.50 ft
390.99 ft3/s
5.78
36.53
16.07
2.27
6.31
5.12
77.1
0.01348
10.70
1.78
7.56
0.78
447.39
415.91
0.00884
ftft2
ft
ft
ft
ft
ft/ft
ft/s
ft
ft
ft3/s
ft3/s
ft/ft
SubCritical
0.00 ft
0.00 ft
0
Upstream Depth 0.00 ft
Profile Description
Profile Headloss 0.00 ft
Average End Depth Over Rise 0.00 %
Normal Depth Over Rise 77.06 %
Downstream Velocity Infinity ft/s
Bentley Systems, Inc. Haestad Methods SolBldot1e4vEfbwMaster V8i (SELECTseries 1) [08.11.01.03]27 Siemons Company Drive Suite 200 W Watertown, CT 06795 USA +1-203-755-1666 Page 1 of 291512012 12:37:25 PM
Calculation 388996-SW-01, Rev 3 Page 141 of 152

Worksheet for C9 (DPI) PMP
GVF Output Data
Upstream Velocity
Normal Depth
Critical Depth
Channel Slope
Critical Slope
Infinity ft/s
5.78 ft
5.12 ft
0.01000 ft/ft
0.01348 ft/ft
Bentley Systems, Inc. Haestad Methods SoIBdottdofi u=vMaster V8i (SELECTseries 1) 108.11.01.03]27 Siemons Company Drive Suite 200 W Watertown, CT 06795 USA +1-203-755-1666 Page 2 of 29/5/2012 12:37:25 PM
Calculation 388996-SW-01, Rev 3 Page 142 of 152

Worksheet for CIO (DP3-6) PMP
Project Description
Friction Method
Solve For
Input Data
Roughness Coefficient
Channel Slope
Diameter
Discharge
Results
Normal Depth
Flow Area
Wetted Perimeter
Hydraulic Radius
Top Width
Critical Depth
Percent Full
Critical Slope
Velocity
Velocity Head
Specific Energy
Froude Number
Maximum Discharge
Discharge Full
Slope Full
Flow Type
1GVF Inp~ut Data
Manning Formula
Normal Depth
-I
0.024
0.01000
2.50
22.69
2.10
4.40
5.80
0.76
1.83
1.62
84.0
0.01836
5.15
0.41
2.51
0.59
23.90
22.22
0.01043
ft/ft
ft
ft3/s
ftft2
ft
ft
ft
ft
ft/ft
ft/s
ft
ft
ft3/s
ft3/s
ft/ft
______ 2
SubCritical
Downstream Depth
Length
Number Of Steps
,-GV-F Output Data -- ----
0.00 ft
0.00 ft
0
0.00 ftUpstream Depth
Profile Description
Profile Headloss
Average End Depth Over Rise
Normal Depth Over Rise
Downstream Velocity
0.00 ft
0.00 %
84.03 %
Infinity ft/s
Bentley Systems, Inc. Haestad Methods SolBtottd•eFrwMaster V8i (SELECTseries 1) [08.11.01.03]27 Siemons Company Drive Suite 200 W Watertown, CT 06795 USA +1-203-755-1666 Page 1 of 29/412012 5:26:32 PM
Calculation 388996-SW-01, Rev 3 Page 143 of 152

Worksheet for C10 (DP3-6) PMP
IG\AF Output Data
Upstream Velocity
Normal Depth
Critical Depth
Channel Slope
Critical Slope
Infinity ft/s
2.10 ft
1.62 ft
0.01000 ft/ft
0.01836 ft/ft
Bentley Systems, Inc. Haestad Methods SolBtiotdd4eEillawMaster V8i (SELECTseries 1) [08.11.01.03]27 Siemons Company Drive Suite 200 W Watertown, CT 06795 USA +1-203-755-1666 Page 2 of 29/4/2012 5:26:32 PM
Calculation 388996-SW-01, Rev 3 Page 144 of 152

Honeywell Pond ClosureRock Slope Protection - Energy Dissipaters
Ref: Hydraulic Design of Energy Dissipators for Culverts and ChannelsHydraulic Engineering Circular No. 14, Third EditionFederal Highway AdministrationU.S. Department of TransportationPublication No. FHWA-NHI-06-086 July 2006
Riprap Basin (Culvert on a Mild Slope)
Given Data (from culvert calculations)D = Diameter or height of culvert barrel, ft
so = Slope of culvert, ft/ft
Q = Culvert Discharge, ft3/sYn = Normal Depth, ft
Vn = Velocity at Normal Depth, ft/sTW = Tailwater Depth, ft
Calculated DataY0 = Outlet Depth, ft
Ye = Equivalent Depth, ft
Yc = Basin Exit Depth, ft
A = Wetted Area, ft2
Ac = Basin Exit Wetted Area, ftd
V0 = Culvert Outlet Velocity, ft/sVc = Basin Exit Velocity, ft/sFr = Froude Numberhs = Dissipator pool depth, ft
D50 = Median Rock Size by Weight, ft
g = Gravitational Acceleration, ft/s 2
Co = Tailwater Parameter
hs = Depth of Scour, ftL = Length of Dissipator Pool, ft
LB = Overall Length of the Basin (pool plus apron), ftW = Basin Width at Culvert Opening, ft
WB = Basin Width at Basin Exit, ftT = Top Width of Water Surface at Basin Exit, ft
z = Basin Side Slope z:1 (H:V)
LB
DISSIPATOR POOL APRON
TOP OF RIPRAP
Figure 10.1. Profile of Riprap Basin
Calculation 388996-SW-01, Rev 3 Page 145 of 152

Figure 10.2. Half Plan of Riprap Basin
1.0 Compute the culvert outlet velocity, Vn, depth yn, and Froude Number
For subcritical flow (culvert on mild slope), use Figure 3.4 to obtain y0/DK = 1.0 for English Units
1.00
0.95
O..90
0.85
0.80
0.75
0.70
0.60
0.55Yo 05D
0.45
0.40
0.35
0.30
0.25
0-20
0.15
0.10
0.05
TWfJI
Figure 3.4. Dimensionless Rating Curves for the Outlets of Circular Culverts on Horizontal andMild Slopes (Simons, 1970)
Calculation 388996-SW-01, Rev 3 Page 146 of 152

Use Table B.2 to obtain the brink area ratio
Table B.2. Uniform Flow in Circular Sections Flowing Partly Full
y/ I 2 L~~n ((~ (72-42 2 ~n)
y/D AID R/D (S ) ( ) y/D A/DD2 R/D (p j) (j j)0.01 0.0013 0.0066 0.00007 15.04 0.51 0.4027 0.2531 0.239 1.4420.02 0.0037 0.0132 0.00031 10.57 0.52 0.4127 0.2562 0.247 0.4150.03 0.0069 0.0197 0.00074 8.56 0.53 0.4227 0.2592 0.255 1.3880.04 0.0105 0.0262 0.00138 7.38 0.54 0.4327 0.2621 0.263 1.362
0.05 0.0147 0.0325 0.00222 6.55 0.55 0.4426 0.2649 0.271 1.3360.06 0.0192 0.0389 0.00328 5.95 0.56 0.4526 0.2676 0.279 1.3110.07 0.0294 0.0451 0.00455 5.47 0.57 0.1626 0.2703 0.287 1.2860.08 0.0350 0.0513 0.00604 5.09 0.58 0.4724 0.2728 0.295 1.2620.09 0.0378 0.0575 0.00775 4.76 0.59 0.4822 0.2753 0.303 1.238
0.10 0.0409 0.0635 0.0097 449 0.60 0.4920 0.2776 0,311 1.2150.11 0.0470 0.0695 0.0118 4.25 0.61 0.5018 0.2799 0.319 1.1920.12 0.0534 0.0755 0.0142 4.04 0.62 0.5115 0.2821 0.327 1.1700.13 0.0600 0.0813 0.0167 3.86 0.63 0.5212 0.2842 0.335 1.1480.14 0.0668 0.0871 0.0195 3.69 0.64 0.5308 0.2862 0.343 1.126
0.15 0.0739 0.0929 0.0225 3.54 0.65 0.5405 0.2988 0.350 1.1050.16 0.0811 0.0985 0.0257 3.41 0.66 0.5499 0.2900 0.358 1.0840.17 0.0885 0.1042 0.0291 3.28 0.67 0.5594 0.2917 0.366 1.0640.18 0.0961 0.1097 0.0327 3.17 0.68 0.5687 0.2933 0.373 1.0440.19 0.0139 0.1152 0.0365 3.06 0.69 0.5780 0.2948 0.380 1.024
0.20 0.1118 0.1206 0.0406 2.96 0.70 0.5872 0.2962 0.388 1.0040.21 0.1199 0.1259 0.0448 2.87 0.71 0.5964 0.2975 0.395 0.9850.22 0.1281 0.1312 0.0492 2.79 0.72 0.6054 0.2987 0.402 0.9650.23 0.1365 0.1364 0.0537 2.71 0.73 0.6143 0.2998 0.409 0.9470.24 0.1449 0.1416 0.0585 2.63 0.74 0.6231 0.3008 0.416 0.928
0.25 0.1535 0.1466 0.0634 2.56 0.75 0.6319 0.3042 0.422 0,9100.26 0.1623 0.1516 0.0686 2.49 0.76 0.6405 0.3043 0.429 0.8910.27 0.1711 0.1566 0.0739 2.42 0.77 0.6489 0.3043 0.435 0.8730.28 0.1800 0.1614 0.0793 2.36 0.78 0.6573 0.3041 0.441 0.8560.29 0.1890 0.1662 0.0849 2.30 0.79 0.6655 0.3039 0.447 0.8380.30 0.1982 0.1709 0.0907 '2.25 0.80 0.6736 0.3042 0.453 0.8210.31 0.2074 0.1756 0.0966 2.20 0.81 0.6815 0.3043 0.458 0.8040.32 0.2167 0.1802 0.1027 I2.14 082 0.6893 0.3043 0.463 0.7870.33 0.2260 0.1847 0.1089 2.09 0.83 0.6969 0.3041 0.468 0.7700.34 0.2355 0.1891 0.1153 2.05 0.84 0.7043 0.3038 0.473 0.753
0.35 0.2450 0.1935 0.1218 2.00 0.85 0.7115 0.3033 0.453 0.7360.36 0.2546 0.1978 0.1284 1.958 0.86 0.7186 0.3026 0.458 0.720
_ _ (~n) (U001 2 X~n ((xn,;y/D &V RID (D-S-) (yon sf y/D A/D2 RID (D"'S'r) (yu/ S0.37 0.2642 0.2020 0.1351 1.915 0.87 0.7254 0.3018 0.485 0.7030.38 0.2739 0.2062 0.1420 1.875 0.88 0.7320 0.3007 0.488 0.6870.39 0.2836 0.2102 0.1490 1.835 0.89 0.7384 0.2995 0.491 0.670
0.40 0.2934 0.2142 0.1561 1.797 0.90 0.7445 0.2980 0.494 0.6540.41 0.3032 0.2182 0.1633 1.760 0.91 0.7504 0.2963 0.496 0.6370.42 0.3130 0.2220 0.1705 1.724 0.92 0.7560 0.2944 0.497 0.6210.43 0.3229 0.2258 0.1779 1.689 0.93 0.7612 0.2921 0.498 0.6040.44 0.3328 0.2295 0.1854 1.655 0.94 0.7662 0.2895 0.498 0.588
0.45 0.3428 0.2331 0.1929 1.622 0.95 0.7707 0.2865 0.498 0.5710.46 0.3527 0.2366 0.201 1.590 0.96 0.7749 0.2829 0.496 0.5530.47 0.3627 0.2401 0.208 1.559 0.97 0.7785 0.2787 0.94 0.5350.48 0.3727 0.2435 0.216 1.530 0.98 0.7817 0.2735 0.489 0.5170.49 0.3827 0.2468 0.224 1.500 0.99 0.7841 0.2666 0.483 0.496
0.50 0.3927 0.2500 0.232 1.471 1.00 0.7854 0.2500 0.63 .463y = depth or flow, m (ft)D diameter of pipe, rn (ft)A = area of flow, m
2 (ft2)
R= hydraulic radius, m (ft)Source: USBR (1974)
Q = discharge by Manning's Equation, m°/s (ft°Is)n = Manning's coefficientS = channel bottom and water surface slopex = units conversion = 1.49 for SI, 1 for CU
Calculation 388996-SW-01, Rev 3 Page 147 of 152

Obtain the wetted area by multiplying the brink area ratio by D2
Calculate Vo by dividing Q by the wetted areaCalculate ye
Calculate the Froude Number
Fr = V 0
(32.2 y,
2.0 Select a trial Dn and obtain h./y. from Equation 10.1
=0.86(D50-0.55 ( 0
Where
C()1.4 for - <i 0.75 ,orYe
CO4.0T for 0.75 <1-- < 1.0 ,or
o=2 for 1.0 <
Ye
Calculate hs by multiplying hs/ye by ye
Check to see that hs/D 50 is greater than or equal to 2 and that D5o/ye is greather than or equal to 0.1
Calculation 388996-SW-01, Rev 3 Page 148 of 152

3.0 Size the Basin as shown in Ficqures 10.1 and 10.2
Calculate the length of the dissipator pool
IL, = 10 hs
Check L, to ensure it meets minimum requirements
ý L, = 3Wo
Calculate the length of the entire basin (pool plus apron)
LB =15
Check LB to ensure it meets minimum requirements
LB min = 4Wo
Calculate the basin with at the basin exit
W B = o
4.0 Determine the Basin Exit Depth and Exit Velocity
Q =2 _ Ac [yc(W0 + Zyc V-g T WB+ 2zyc
Use a trial and error process to find yc, Tc, and A,Calculate Vc and verify it is within accpetable range
V - Qc A c
Evaluate the initial trial of riprap that satisfies all design requirements. Try the next larger riprap size available to
test if a smaller basin is feasible by repeating steps 2 through 4.
5.0 For the design discharge, determine if TW/vn_50.75
If TW/y0 O0.75, design is satisfied. No additional riprap is needed.
If TW/y0<0.75, additional riprap is needed downstream of the dissipater exit (see HEC-1 1)
Calculation 388996-SW-01, Rev 3 Page 149 of 152

C7 PMPGiven Data:
Dso
QYnVn
TWCalculations:
1.0
K,
KuQ/D2.5TW/D
yo/D
YoA/D
2
AVo
YeFr
D50
D50
D50/Ye
TW/Ye
Co
6.00
0.01
207.34
4.47
9.19
3.94
1
2.35
0.66
0.65
3.90
0.5405
19.46
10.65
3.12
1.06
4
0.33
0.11
1.26
Not Valid
Not Valid2.40
0.68
2.12
6.42
ftft/ftft3/sft
ft/sft
from Figure 3.4
ft
from table B.2ft
2
ft/s
ft
in
ft
Check D50 OK
TW/ye<0.750.75<TW/ye<1.01.0<TW/ye
2.0
hs/Yehsr
hs/D 5o3.0
Wo
L. min
LBmin
Ls
LB
WB
4.0
YcTo
Acz
o 2g(Ao;)'/Tc
[Yc(WB+ZYc)13/(WB+2zyc)
Vc
5.0TW/yo
ft
Check D50 OK
6.0018.00
24.00
21.20
31.80
27.20
ftft
ft
ft
ft
ft
= 1.1015
= 29.4394
= 34
= 2= 1335.089
= 1335.082
= 1335.035
= 6.10
ft
ft
ft2
ft/s
1.01 Additional Riprap Needed Downstream
Calculation 388996-SW-01, Rev 3 Page 150 of 152

C8 PMPGiven Data:
Dso
QYnVn
TWCalculations:
1.0K2
KuQ/D2.5
TW/Dyo/D
YoA/D
2
AVo
YeFr
2.0
4.50.01
105.85
3.66
7.63
3.03
1
2.46
0.67
0.65
2.93
0.5405
10.95
9.67
2.34
1.11
ftft/ftft3/sft
ft/sft
from Figure 3.4
ft
from table B.2ft
2
ft/s
ft
inD 5o
D50
D50 /Ye
TW/ye
Co
hs/Yehs
hs/D5o
Wo
L, min
LBmin
Ls,
LB
WB
3.0
= 3= 0.25
= 0.11
= 1.29
= Not Valid
= Not Valid= 2.40
= 0.83
= 1.94
= 7.76
= 4.50
= 13.50
= 18.00
= 19.40
= 29.10
= 23.90
= 0.781
- 19.71
= 19
= 2= 347.9572
= 347.9959
= 347.8983
= 5.57
ftCheck
TW/ye<0.750.75<TW/ye<1.01.0<TW/ye
ft
Check D50 OK
D50 OK
ft
ft
ft
ft
ft
ft
4.0
YcTc
Ac
zQ2g
(A.) 3/Tc
[yo(WB+Zy.)] 3/(WB+2zyc)
Vc
5.0TW/yo
ft
ft
ft2
ft/s
1.03 Additional Riprap Needed Downstream
Calculation 388996-SW-01, Rev 3 Page 151 of 152

C9 PMPGiven Data:
Dso
QYn
Vn
TWCalculations:
1.0K,,
KuQ/D2.5
TW/Dyo/D
YoA/D
2
AVo
YeFr
2.0D50D50
D50/Ye
TW/Ye
Co
7.5
0.01
390.99
5.78
10.7
5.12
1
2.54
0.68
0.68
5.10
0.5687
31.99
12.22
4
1.08
ft
ft/ft
ft3/s
ft
ft/s
ft
from Figure 3.4
ft
from table B.2ft
2
ft/s
ft
in
ft
Check D50 OK
TW/ye<0.750.75<TW/ye<1.01.0<TW/ye
50.42
0.11
1.28
Not ValidNot Valid
2.400.72
2.88
6.86
hs/Yeh,
hs/D 50
3.0Wo
Lsmin
LaBminLs
LB
WB
4.0
YcT,
A,
zQ2g
(Ac.)3/fc
[yo(W B+ZYo)] 3/(W B+2zyc)Vc
5.0TW/yo
ft
Check D50 OK
= 7.50 ft
= 22.50 ft
= 30.00 ft
= 28.80 ft
= 43.20 ft
= 36.30 ft
= 1.3938 ft
= 13.4804 ft
40 ft2
= 2= 4747.614
= 4747.634
= 4748.049
- 9.77 ft/s
= 1.00 Additional Riprap Needed Downstream
Calculation 388996-SW-01, Rev 3 Page 152 of 152

CH2MHiLL Calculation
Calculation No.: CALC-388996-SW-02 Revision No.: 0
Project: Honeywell Metropolis Works Facility (388996.HW.T6)
Engineering Discipline: Geotechnical Date: 916/12
Calculation Title & Description:Tite! Riprap Bedding Gradation Requirements
Descrirtion: This calculation determines riprap bedding gradation requirements for the riprap sizes used on the sideslopes and in the ditches on the project.
Revision Historv:
Revision No. Description Date Affected Pages
Final Calculation Package - Initial Issue0 916/12 n/a
Document Review & Approval:
Originator: David J. Curran, Jr., P.E. / Geotechnical EngineerNAME/POSIm1ON
SIGNATURE V/ ! (ZE•" - _
Checked: John H. Barker, PE. I Geotechnical EngineerNAMFJPOSIMN
.D'T /
•N~eF.•E DATE
Calculation 388996-SW-02, Rev 0 Page I of 15

1. Objective:
The objective of this calculation is to determine bedding material gradation requirements for riprap withD50 values of 6, 8, 10 and 14 inches.
2. Design Standards and Criteria:
The following design standards were used as main references in our analyses and development of ourrecommendations:
* NUREG-1623, Appendix D, Section 2.1.1 (Attachment A)* NUREG/CR-4620, Section 4.4 (Attachment B)* FHWA-IP-89-016, Section 4.2 (Attachment C)
3. Methodology and Assumptions:
The Filter Requirements Section (2.1.1) of Appendix D of NUREG-1623 indicates that filter sizing criteriaare presented in NUREG/CR-4620. The Filter Criteria Section (4.4) of NUREG/CR-4620 provides thefollowing recommendations:
" The filter blanket (bedding layer) should include gravel sizes ranging from 3/16 inches (4.76 mm)to an upper limit of approximately 3 to 3 ½ inches (76.2 to 88.9 mm).
* Filter thickness should be one-half the riprap layer thickness but not less than 6 to 9 inches.* D15 (bedding) < 10 x D85 (soil): This prevents migration of soil into bedding" D85 (bedding) > D15 (riprap) / 5: This prevents migration of bedding into riprap.
The onsite soil to be retained by the bedding is assumed to have a D85 = 0.03mm based on particle sizeanalyses of 2 samples (see Attachment D).
The Rock Gradation Section (4.2) of FHWA-IP-89-016 recommends that the D15 particle size for a riprapmaterial range from 0.4 x D50 to 0.6 x D50. Based on this recommendation, the riprap D15 particle size isassumed to be 0.5 x D50. Resulting values are:
" D15 (6 inch riprap) = 0.5 x 6 = 3.0 inches (76.2 mm)" D15 (8 inch riprap) = 0.5 x 8 = 4.0 inches (101.6 mm)* D15 (10 inch riprap) = 0.5 x 10 = 5.0 inches (127.0 mm)" D15 (14 inch riprap) = 0.5 x 14 = 7.0 inches (177.8 mm)
4. Results and Conclusions
To prevent soil migration into riprap bedding:
0 D15 (bedding) < 10 x 0.03mm => D15 (bedding) < 0.3 mm
To prevent riprap bedding migration into riprap:
* D85 (6 inch riprap bedding) > (3.0 inches)/5; D85 (6 inch riprap bedding) > 0.6 inches (15.2 mm)" D85 (8 inch riprap bedding) > (4.0 inches)/5; D85 (8 inch riprap bedding) > 0.8 inches (20.3 mm)* D85 (10 inch riprap bedding) > (5.0 inches)/5; D85 (10 inch riprap bedding) > 1.0 inches (25.4 mm)* D85 (14 inch riprap bedding) > (7.0 inches)/5; D85 (14 inch riprap bedding) > 1.4 inches (35.6 mm)
Calculation 388996-SW-02, Rev 0 Page 2 of 15

Minimum bedding thicknesses:
* 6, 8 and 10 inch riprap = 6 inches* 14 inch riprap = 7 inches* Based on construction considerations a minimum bedding thickness of 7 inches is recommended
in all areas.
Candidate materials:
* Illinois DOT Coarse Aggregate Gradations CA 2 and CA 4 (see Attachment E) are candidatematerials. Depending on the gradation of specific materials available, blending of 2 or morematerials may be required and a single material may work for all riprap sizes.
5. List of Attachments
A - NUREG-1623, Appendix D, Section 2.1.1B - NUREG/CR-4620, Section 4.4C - FHWA-IP-89-016, Section 4.2D - Particle Size Analyses for Onsite SoilsE - Illinois DOT Coarse Aggregate Gradations
6. Additional References
None
Calculation 388996-SW-02, Rev 0 Page 3 of 15

Attachment ANUREG-1623, APPENDIX D, SECTION 2.1.1
Calculation 388996-SW-02, Rev 0 Page 4 of 15

Rock mulches (rock liyefs where the average rock size'is relatively small) may provide apractical solution for stabilization of slopes and channels at many sites: The procedures fordesigning such rock layers are identical to those mentioned in the preceding paragraph. Studies byAbt et a]. (1988) have indicated that a rock/soil matrix (riprap layer with the rock voids filled withsoil) has similar stability characteristics as the riprap layer, alone. The staff, therefore, accepts theuse of a rock mulch, a rock/soil matrix, or a rocky soil. The design of a rock mulch or a rock/soilmatrix should be based on the D5. rock size and should follow the procedures given in Appendix D;the designs are similar because there is no clear-cut distinction between a riprap layer and a layer ofrock mulch. The design of a rocky soil cover should be based on the D75 particle size and shouldfollow the procedures given in Appendix A; the design follows the procedure for a soil cover,because the layer is predominantly soil, rather than rock.
Abt and Johnson (1991) utilized the data from the Abt et al. (1988) flume studies anddeveloped a comprehensive riprap design procedure for overtopping flow conditions. The Abt andJohnson procedure provides guidance for sizing angular-shaped riprap placed on slopes of tip to 20percenL From the flume tests, they developed an expression that determined the median rock size(D..) of the riprap layer as a function of the embankment slope and the unit discharge. Abt andJohnson recommended that the minimum rock layer thickness be about 2-D50s. As necessary, a flowconcentration factor may be integrated into the design.
2.1.1 Filter Requirements
It is generally recommended that a filter or bedding layer comprised of well-graded rockmaterial be placed on the cover or in locations where rock riprap is to be placed for erosionprotection. Locations recommended for filter placement include impoundment side slopes, toes ofslopes, transition areas, diversion ditches and channels, stilling areas, and flow impact areas. Thepurpose of the filter is to bed the riprap and prevent stone penetration into the cover and/or radonbarrier, prevent soil erosion from flow at the stone/soil interface, and to prevent the pooling ofprecipitation andlortributary runofffrom infiltrating into the cover and waste materials. Filter sizingcriteria are presented in NUREG/CR-4620 (Nelson, 1986).
The staff recognizes that the bedding layer for a typical reclaimed mill does not serve thesame classic purpose as a filter for prevention of piping of fines from the underlying soil. In manycases, there is no hydraulic gradient to cause piping. In such cases, it is recommended that ananalysis be performed to determine the need for a filter when median sione sizes of 2 inches or lessare to placed on flat slopes (2% or less) in arid regions. Assuming that there is no potential forpiping of fines and the interstitial flow velocities are insufficient to transport soil particles, a filterlayer may not be needed. Interstitial velocities should be based on the flow derived from theprobable maximum precipitation and subsequent probable maximum flood condition.
To determine the interstitial flow velocity, v,, at the soil/rock interface, the Leps (1973)procedure may be employed, as presented in NUREGICR-4620 as
VV = Wmo- io-54
D-3 NUREG-1623
Calculation 388996-SW-02, Rev 0 Page 5 of 15

where Vis the average velocity of water (inches/sec) in the voids of the rockfill, W is an empiricalconstant for a specific riprap or rock mulch material, m is the hydraulic mean radius and i is thehydraulic gradient The appropriate coefficients are presented in NUREGICR-4620. A procedurefor estimating flow through rock materials is presented by Abt et al. (1991).
When the computed interstitial velocity is less than 0.5 ft per second, a filter may not beneeded. When velocities are between 0.5 and 1.0 ft per second, the need for a filter layer will bedependent upon the type of soil material placed at the interface. A filter should be provided whenvelocities are 1.0 ft per second or greater.
2.12 Riprap Layer Thickness
The minimum layer thickness should be such that all stones are contained with the ripraplayer thickness to provide maximum resistance against erosive forces. The layer should not be lessthan 1.5 times the mean stone diameter (D.) or the D,,, whichever is greater (ACE, 1994). Thethickness previously determined should be increased by 50 percent when the riprap is placed underwater.
Care should be taken to select a layer thickness when placing median store sizes of less thanor equal to 3-inches. Minimum layer thicknesses may be dictated by standard rock placementpractices, indicating that riprap layers less than 6-inches thick may be difficult to place.
2.2 Desian Procedures
2.2.1 Design Procedure Using Safety Factors and Stephenson Methods
A step-by-step procedure for designing riprap for the top and side slopes of a reclaimed pileis presented below:
Step 1. Determine the drainage areas for both the top slope and the side slope. These drainageareas are normally computed on a unit-width basis.
Step 2. Determine time of concentration (t,).
The t% can be a difficult parameter to estimate in the design of a rock layer. Based on areview of the various methods for calculating t, the NRC staff concludes that a methodsuch as the Kirpich method, as discussed by Nelson et al. (1986), should be used. Thetk may be calculated using the formula:
tV (11.9L3/H)"385 (D-1)
I,
iii
If
I.
I
NUREG-1623 D-4
Calculation 388996-SW-02, Rev 0 Page 6 of 15

Attachment BNUREG/CR-4620, SECTION 4.4
Calculation 388996-SW-02, Rev 0 Page 7 of 15

56
Furthermore, Powledge and Dodge indicated that with slowly rising or lowconstant flow, erosion may start and remain at one low point causinggully-type erosion.
It is recommended that the slope transition areas, particularly alongthe embankment crest, be protected (i.e., riprap, rock mulch, etc.) atleast 8-10 feet up-grade and down-grade of the slope break. The slopetransitional area is vulnerable to sheet and concentrated flows. Designdischarges will often transition from subcritical to critical or super-critical flows resulting in a high potential for erosion. The recommendedprotection will provide an armoring that will help resist degradation,particularly from unexpected, concentrated flows.
4.4 FILTER CRITERIA
It is recommended that a layer or blanket of well-graded rock materialbe placed over the embankment or cover slope prior to riprap placement.Sizes of gravel in the filter blanket should be from 3/16 inch to an upperlimit of approximately 3 to 3 1/2 inches, depending on the gradation of theriprap. The filter thickness shall vary depending upon the riprapthickness and riprap design procedure, but should not be less than 6 to ginches. Filter thicknesses one-half the riprap layer thickness arerecommended. Suggested specifications for gradation of the filters are asfollows:
D15 (Filter)< 5 (4.35)
D85 (Base)
and
D15 (Filter)< 10 (4.36)
D8 5 (Base)
The criteria presented in Equation 4.35 will prevent migration of thebedding into the riprap. When the filter meets the criteria as specifiedin Equation 4.36, erosion of the radon barrier below the bedding shall beprevented (Sherard et al., 1984).
4.5 FLOW THROUGH RIPRAP ROCKFILL
When a riprap layer is used to stabilize a sloped cover, it is advan-tageous to determine the discharge through the rockfill. The analysis offlow through a riprap rockfill is complex and does not comply with Darcy's
Calculation 388996-SW-02, Rev 0 Page 8 of 15

Attachment CFHWA-IP-89-016, SECTION 4.2
Calculation 388996-SW-02, Rev 0 Page 9 of 15

4.2 ROCK GRADATION
The gradation of stones in riprap revetment affects the riprap's resistance toerosion. The stone should be reasonably well graded throughout the riprap layerthickness. Specifications should provide for two limiting gradation curves, and thestone gradation (as determined from a field test sample) should lay within these limits.The gradation limits should not be so restrictive that production costs would beexcessive. Table 2 presents suggested guidelines for establishing gradation limits.Table 3 presents six (6) suggested gradation classes based on AASHTO specifications.Form 3 (appendix C) can be used as an aid in selecting appropriate gradation limits.
It is recognized that the use of a four (4) point gradation as specified in table 2might in some cases be too harsh a specification for some smaller quarries. If this isthe case, the 85 percent specification can be dropped as is done in table 3. In mostinstances, a uniform gradation between D, 0 and Dim will result in an appropriate DOs.
Each load of riprap should be reasonably well graded from the smallest to themaximum size specified. Stones smaller than the specified 5 or 10 percent size shouldnot be permitted in an amount exceeding 20 percent by weight of each load.
Table 2. Rock riprap gradation limits.
Stone Size Stone Weight Percent ofRange* Range Gradation
(ft.) (lb) Smaller Than
1.5 D50 to 1.7 D5s 3.0 Wso to 5.0 W5s 100
1.2 D&O to 1.4 D50 2.0 W5 0 to 2.75 Wso 85
1.0 D50 to 1.15 D50 1.0 W6o to 1.5 W'0 50
0A D50 to 0.6 D5 0 0.1 Ws0 to 0.2 W50 15
36Calculation 388996-SW-02, Rev 0 Page 10 of 15

Attachment DD - PARTICLE SIZE ANALYSES FOR ONSITE SOILS
Calculation 388996-SW-02, Rev 0 Page 11 of 15

CLIENT REVIEW DRAFT - 10111/2010 ATTORNEY VVRK PRODUCT
U.S. SIEVE OPENING IN INCHES I U.S. SIEVE NUMBERS I HYDROMETER104 - 2i5 1 314 1123V43 4 6 81O141620 40 7010W4l)'0c
10 111 1 1 1NIil1 T 1 1f r I Hil IU I900
80 i ill1 - LITIIffLII li I-i I 'I I .11, I- l-X 1-, _ _
70I1....J IHi~i] .... Ii
SO 1TI -r, 1 111.~70 -1 :11R I I I__ T[I I ' I
50 I---LI t--
o, 1 ! [Ill- I I •1ii - i ! I I
11 ,1 1 Ht'i Iii I ' ii
20
100 10 1 0.1 0.01 0.0"GRAIN SIZ IN MILLIMETERS
COBBLES coarse I fine coarse! medium fine SILT OR CLAY
SPECIMEN IDENTIFICATION SIEVE % PASS SOIL CLASSIFICATION
Haring: GT-01 - -. - Cnh 10 BA,.n trace • snd an-d organic
Sample: ST-01 2 - - -00 (CL)Veplh: 9,0oi 1.0' 1 1/2 __ _
1 [ 100 %GRAVEL %SANOi %SILT I%CLAY
NOTES: 314 100 C, 3 74 _23
318 100
$4 100 MC% dyIpcd I PI
S10 ... 0.24.6 17.7
LOATO0Mtrpli, Jn 29..... 201 0
9200 j 9? 2.1PROJECT Honeywell/Metropolis Works JOB NO, L- 75,293LOCATION - M1et~reopois, Illn5ois DATE June 29. 2010
•' JSOIL DATA SHEETTesting Service Corporation
S..Carol Stream, IL 60188
Calculation 388996-SW-02, Rev 0 Page 12 of 15

CLIENT REVIEW DRAFT - 1011112010 ATT-ORNEY WORK PRODUCT
U.S. SIEVE OPENING IN INCHES I U.S. SIEVE NUMBERS I HYDROMETER
0 ; 2 1.5 13t41123,83 4 6 810 14162030 70'*1004O0100
I,1 1 p tlI I- T
50 it
40-- I: I I
to--
- I I
100 10 1 0.1 0. 0.GRAIN SIZE IN MILLhIIETERS
5 OB1 I_ SAND t SILT OR CLAY 1LEfine coarse medium" finI
SPECIMEN IDENTIFICATION SIEVE 1% PASS SOIL' CLASSIFICATION
•.• T*023 inuth i oO Srvwn silly CLAY, trace' sa~nd and organic .
Sample: ST-01 2 100 (CL)........
D e pth : 6 .0 '-8 .0 ' .. 1 112, 10 D
1 100 %GRAVEL %SAND %SILT *ACLW
NOTES: 3/4 100 0 1 78 .. 21
I4 100l I IC. jdy PC L P- PI 8 I l°° i
2c ) 1. 00 1100 1# 1o 9 0.1 0.11%0.0
PROJECT Honeywell/Metropolis Works JOB NO. L - 75,293LOCATION MRDATE June 29 2010
SEMlEIC O SOIL DATA SHEET
Testing Service Corporatione Carol Stream, IL 60188
Depth: 8.0-../ 11,2 10
Calculation 388996-SW-02, Rev 0 Page 13 of 15

Attachment ED - ILLINOIS DOT COARSE AGGREGATE GRADATIONS
Calculation 388996-SW-02, Rev 0 Page 14 of 15

Art- 1004_01 Coarse Aggregates
COARSE AGGREGATE GRADATIONS
'oad Sieve Size and Percent Passingqm 3 2 112 2. 1 112 1 /4 1/2 318 No. No- No- No- No-in. in. in. in. in. 3in. in. in. 4 8 16 50 2W• !
,A1 100 95t5 60/15 15515 353
100 9130±1D51 1± ±3___
A2 3 - 100 95±5 87511 50115 30t10 20t15 8±4093 595120 8t8 11:3
_A4_100 95ft5 85L10 601±5 ±0610 20315 8±4
1A0 9713 97±3" 30±15 3±3.A 6 1100 95`15 75`+15 43:113 1 25d15 8f:4
1A 7 r±100 9535 5±15 , 5t5
5A 8 100 974± 85010 55210 1015 33'A 9 100 9W 90115 30t125 1-2 10 61•2
•A10 100 9515 80115 501:10 30115, 94A11 100 9M:: 415-15"sm 616 3:13 ' "
A512 100 9515 85t10 601±10 35:±0
A 13 100 100 9280 2010 30115 3±3'r
-A 14- 90110 "nd 45Pc 20 3a1s3
7 0A 15 100 75915 75 22.2
A 16 100 9713 30015 2112 '3A 17 100 ±65120 420± 20110 10±5
•A 118 1030 95:15 75:125 55%25 10110 2±2
4A1 00 g05±55 60615 40115 20-t10 1(±5A 2- 100 9215 8 20±10 515 3.83
COARSE AGGREGATE GRADATIONS (metric)
3tad Sieve Size and Percent Passing
A,8 75 63 50 37.5 25 19 12.5 9.5 4.75 2.36 1.1S 300 75rmM mm MM Min a mm mn Min mm Mina mm Vn PMt
A 1 101 9597±3 6t515 301:A 2 100 9S15 75115 50±15 30±10 20±15 8±4
Al 3100 93V97 558120 M 3163;A4 100 9515 Mil0 60±115 40±010 20315 89±4
ýA 5 97±3 z -4 1025 7±3 5 3033
A6 100 955 1 0 75±15 4+13 25±15 8±4A17 100 95715 5015 22 5±5
A8 100 9713 85-11 55t -10 10-5 3:04 1A9 100 97±3 607±15 30515 10110 626A10 100 959 5 80515 50±150 _ 30±15 920 4
CA 11 100 9228 05±10 5 "' 6±6 313 41 __
CA12 100 9515 85110 60±110 35±10 9M4
*A 131 100 97+3 .80t10! 30t"15 3t3v
*A 14 90± 10 "• 45±120 3±-3
CA15 100 75:115 7+7 2:12
C* 16 100 97±13 30:t15 212 '
A17 1W0 65±20 45120 201+10 10±+5
18 100 95t5 75±125 55f125 10:110 2±12
*A 19i 100 951.5 60+t15 40-+15 20110 10:15
CA12 0. - -r - 100 92±18 120t"10 5t+5 W±3
1/ Subject to maximum percent allowed in Coarse Aggregate Quality table.
2/ Shall be 100 percent passing the 1 3/4 in. (45 mm) sieve.
738
Calculation 388996-SW-02, Rev 0 Page 15 of 15