Embed Size (px)
Citation preview
(0-5286-P2)
Presentation StructurePresentation Structure
• Research Objectives• Research Process• Findings• Next Steps
2
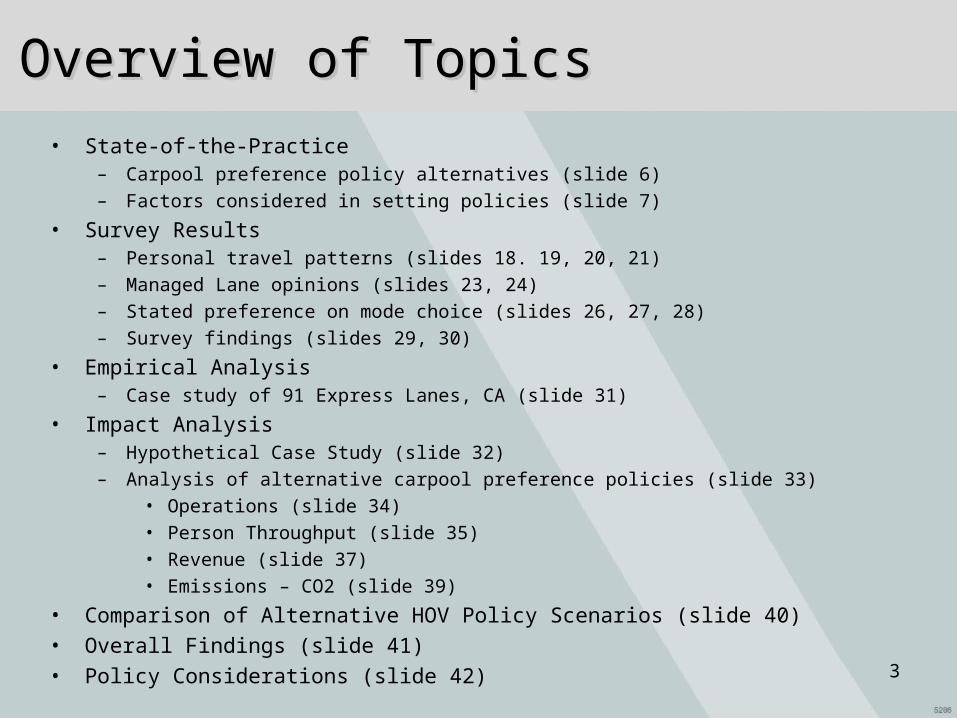
Overview of TopicsOverview of Topics
• State-of-the-Practice– Carpool preference policy alternatives (slide 6)
– Factors considered in setting policies (slide 7)
• Survey Results– Personal travel patterns (slides 18. 19, 20, 21)
– Managed Lane opinions (slides 23, 24)
– Stated preference on mode choice (slides 26, 27, 28)
– Survey findings (slides 29, 30)
• Empirical Analysis– Case study of 91 Express Lanes, CA (slide 31)
• Impact Analysis– Hypothetical Case Study (slide 32)
– Analysis of alternative carpool preference policies (slide 33)
• Operations (slide 34)
• Person Throughput (slide 35)
• Revenue (slide 37)
• Emissions – CO2 (slide 39)
• Comparison of Alternative HOV Policy Scenarios (slide 40)• Overall Findings (slide 41)• Policy Considerations (slide 42)
3
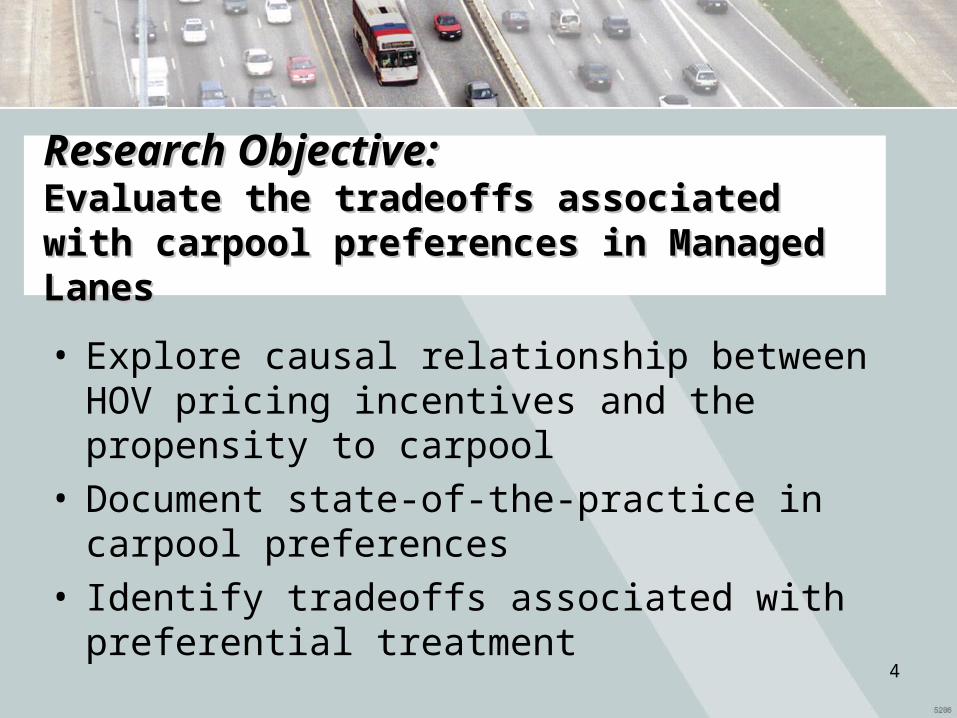
Research Objective:Research Objective: Evaluate the tradeoffs associated with carpool Evaluate the tradeoffs associated with carpool preferences in Managed Lanespreferences in Managed Lanes
• Explore causal relationship between HOV pricing incentives and the propensity to carpool
• Document state-of-the-practice in carpool preferences
• Identify tradeoffs associated with preferential treatment
4
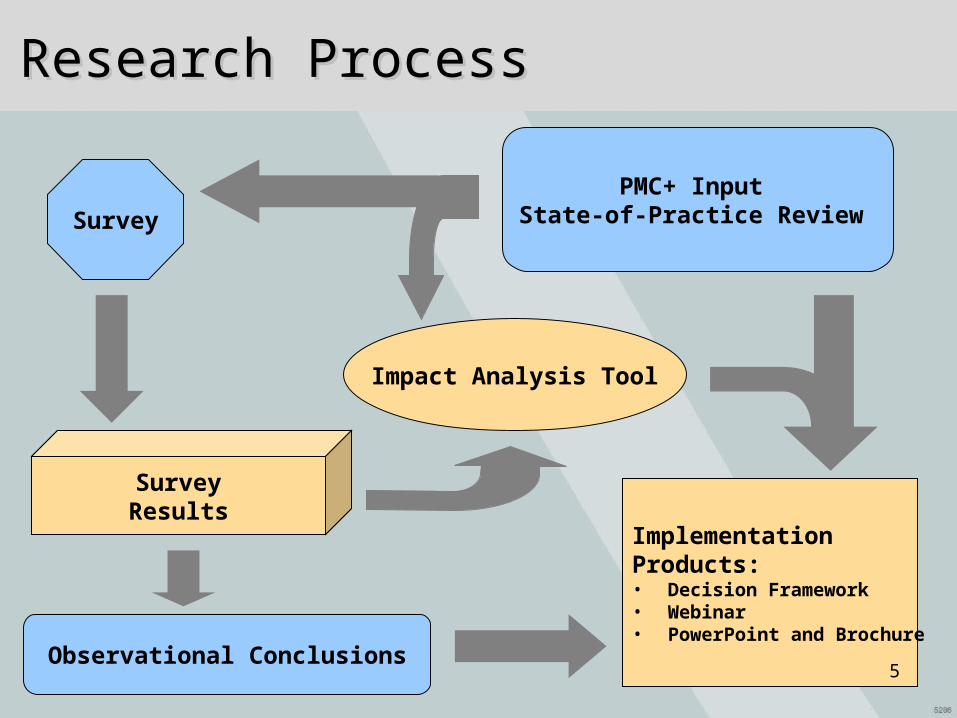
Survey
ImplementationProducts:• Decision Framework• Webinar• PowerPoint and Brochure
Observational Conclusions
PMC+ Input State-of-Practice Review
SurveyResults
Impact Analysis Tool
Research ProcessResearch Process
5
ETL
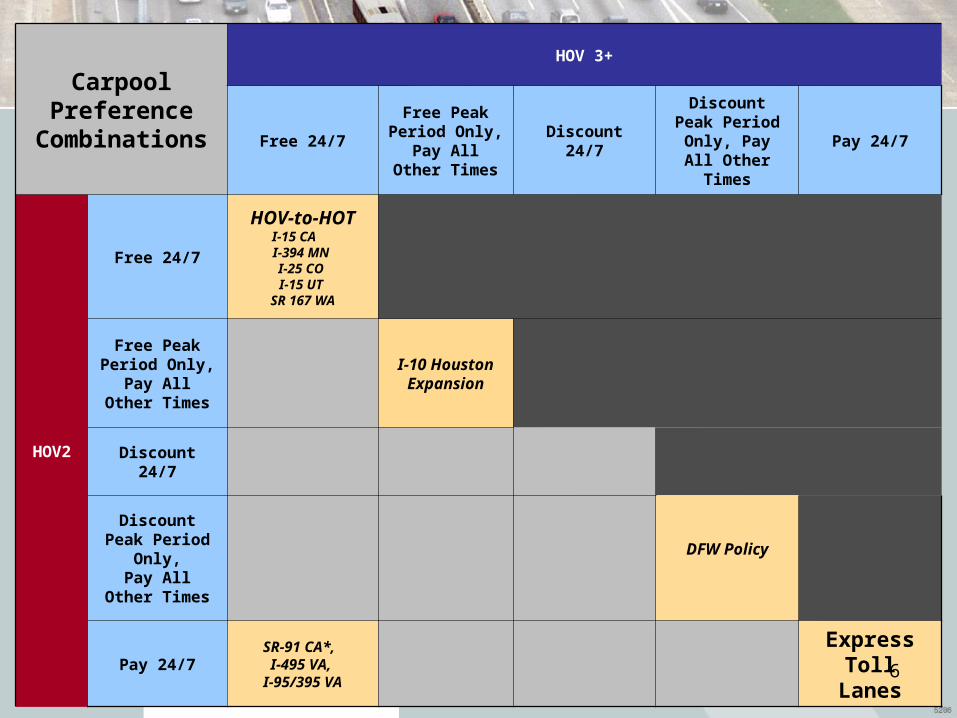
Carpool Preference
Combinations
HOV 3+
Free 24/7
Free Peak Period Only,
Pay All Other Times
Discount 24/7
Discount Peak Period Only, Pay All Other Times
Pay 24/7
HOV2
Free 24/7
HOV-to-HOTI-15 CA I-394 MN I-25 CO I-15 UT
SR 167 WA
Free Peak Period Only, Pay All Other
Times
I-10 Houston Expansion
Discount 24/7
Discount Peak Period
Only,Pay All Other
Times
DFW Policy
Pay 24/7SR-91 CA*, I-495 VA,
I-95/395 VA
Express Toll Lanes6
State-of-the-Practice ResultsState-of-the-Practice Results
• Limited information about carpool incentives in priced Managed Lanes
• Current facilities provide free access to HOV3+, many offer HOV2+ free
• Factors considered in setting policy:– Enforcement of carpools vehicles– Maximizing vehicular throughput– Uniformity and equity considerations
• Apparent disconnect between regional carpool program objectives and ML policies
7
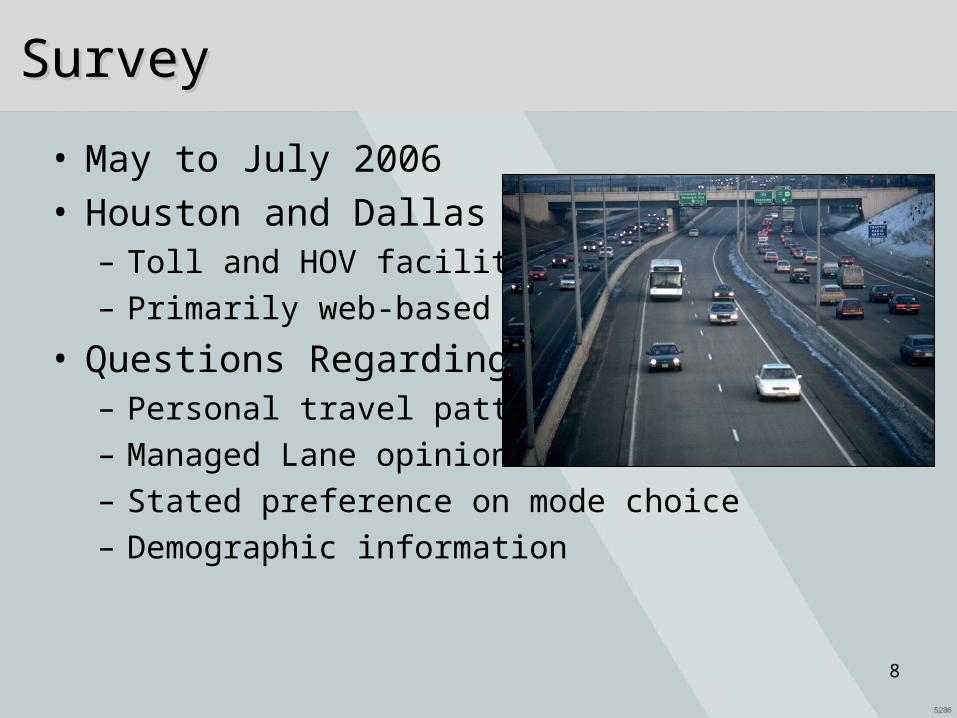
SurveySurvey
• May to July 2006• Houston and Dallas
– Toll and HOV facilities– Primarily web-based
• Questions Regarding– Personal travel patterns– Managed Lane opinions– Stated preference on mode choice– Demographic information
8
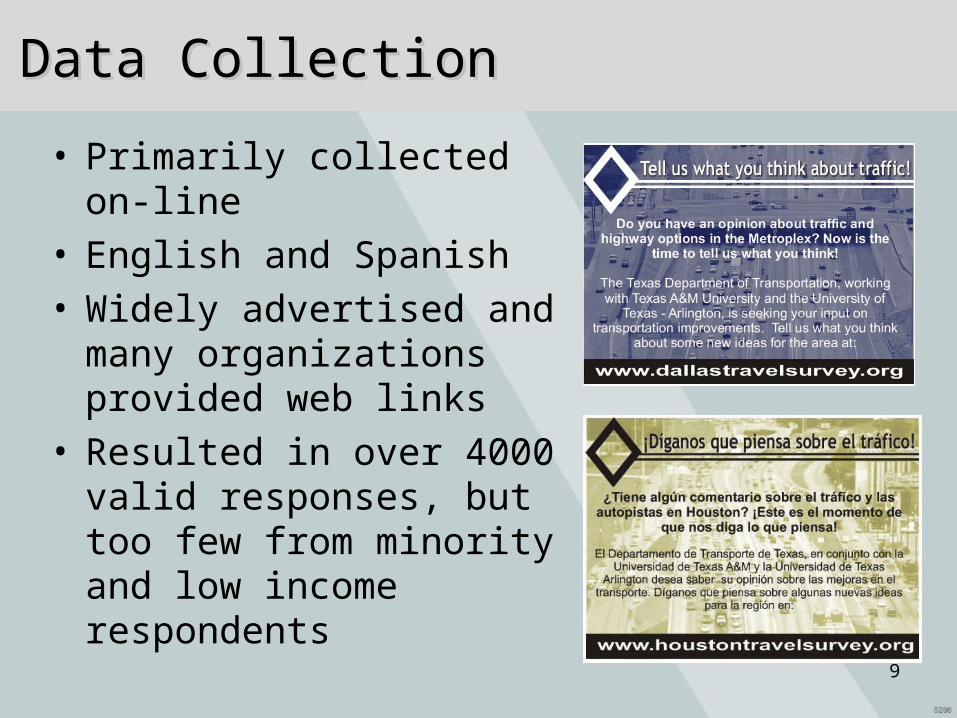
Data CollectionData Collection
• Primarily collected on-line• English and Spanish• Widely advertised and many
organizations provided web links
• Resulted in over 4000 valid responses, but too few from minority and low income respondents
9
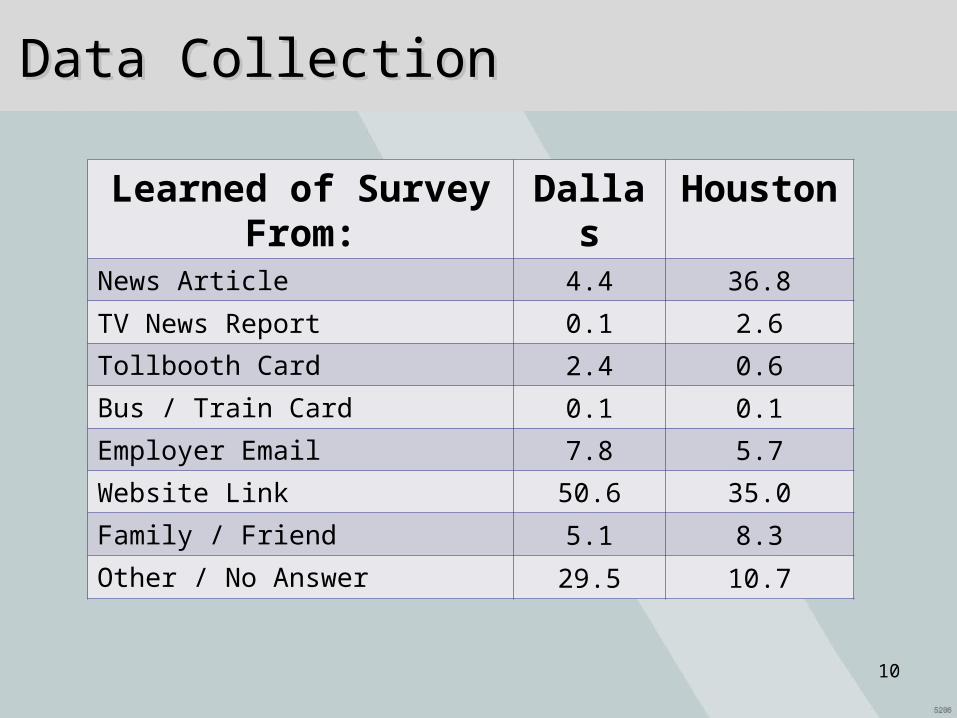
Data CollectionData Collection
Learned of Survey From:
Dallas Houston
News Article 4.4 36.8
TV News Report 0.1 2.6
Tollbooth Card 2.4 0.6
Bus / Train Card 0.1 0.1
Employer Email 7.8 5.7
Website Link 50.6 35.0
Family / Friend 5.1 8.3
Other / No Answer 29.5 10.7
10
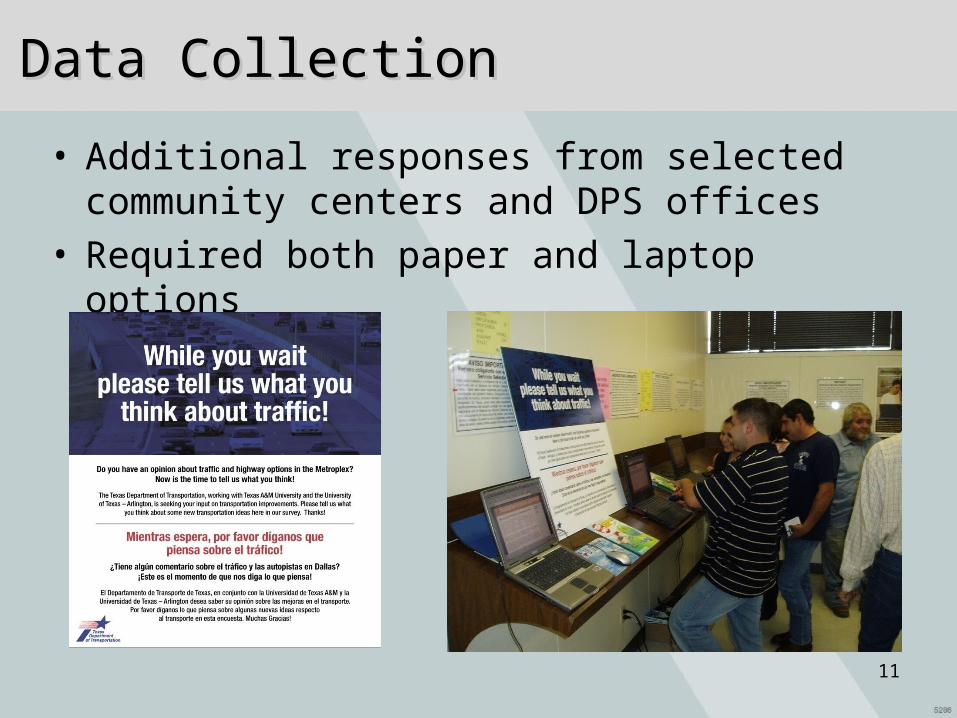
Data CollectionData Collection
• Additional responses from selected community centers and DPS offices
• Required both paper and laptop options
11
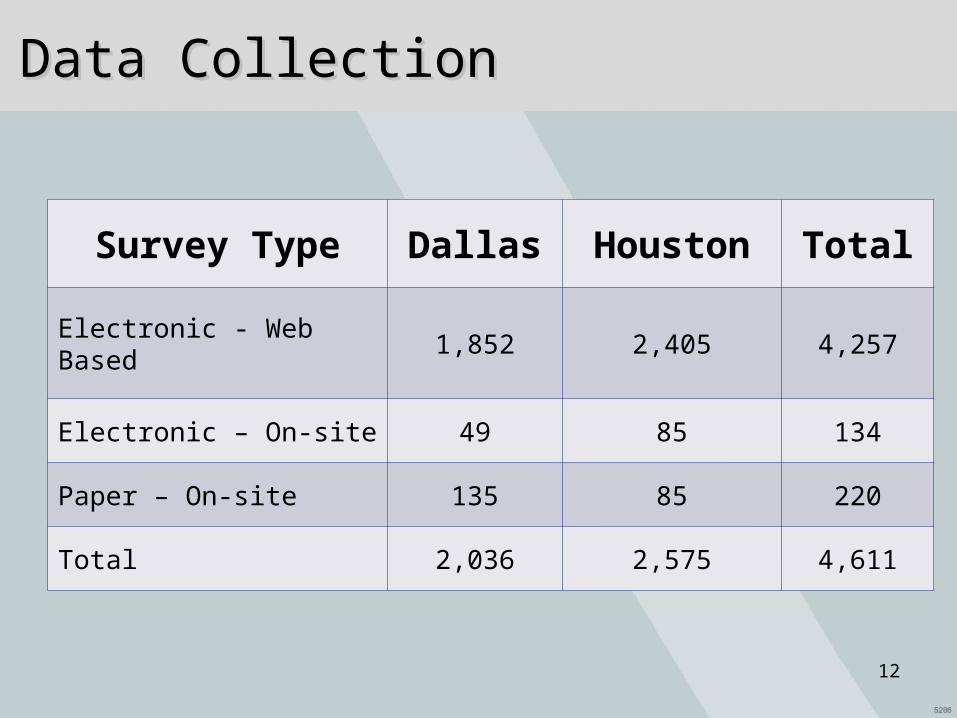
Data CollectionData Collection
Survey Type Dallas Houston Total
Electronic - Web Based 1,852 2,405 4,257
Electronic – On-site 49 85 134
Paper – On-site 135 85 220
Total 2,036 2,575 4,611
12
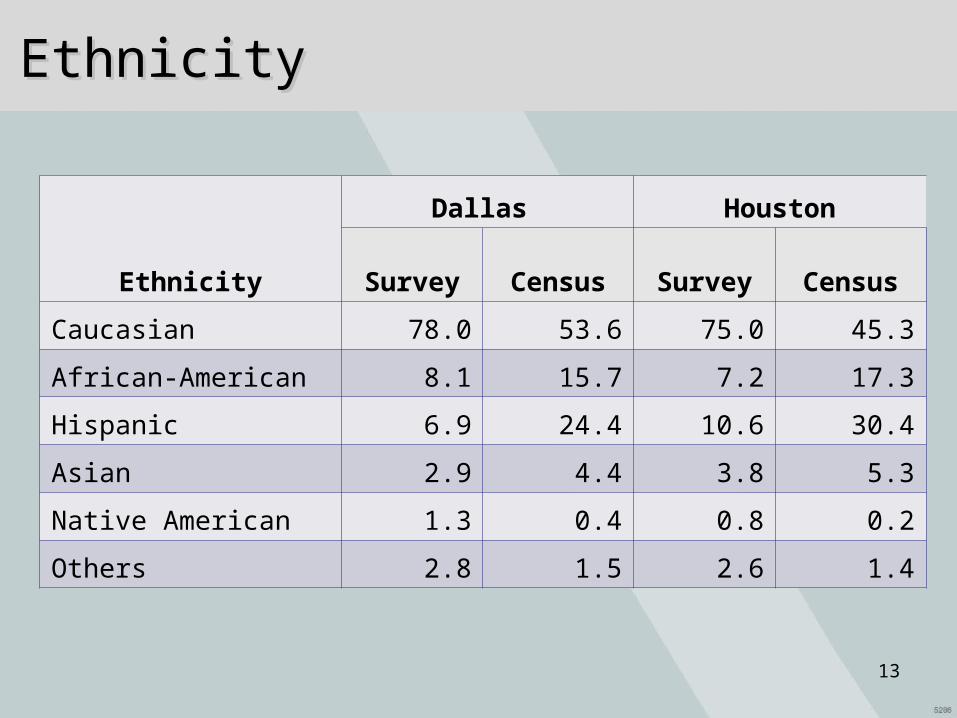
EthnicityEthnicity
Ethnicity
Dallas Houston
Survey Census Survey Census
Caucasian 78.0 53.6 75.0 45.3
African-American 8.1 15.7 7.2 17.3
Hispanic 6.9 24.4 10.6 30.4
Asian 2.9 4.4 3.8 5.3
Native American 1.3 0.4 0.8 0.2
Others 2.8 1.5 2.6 1.4
13
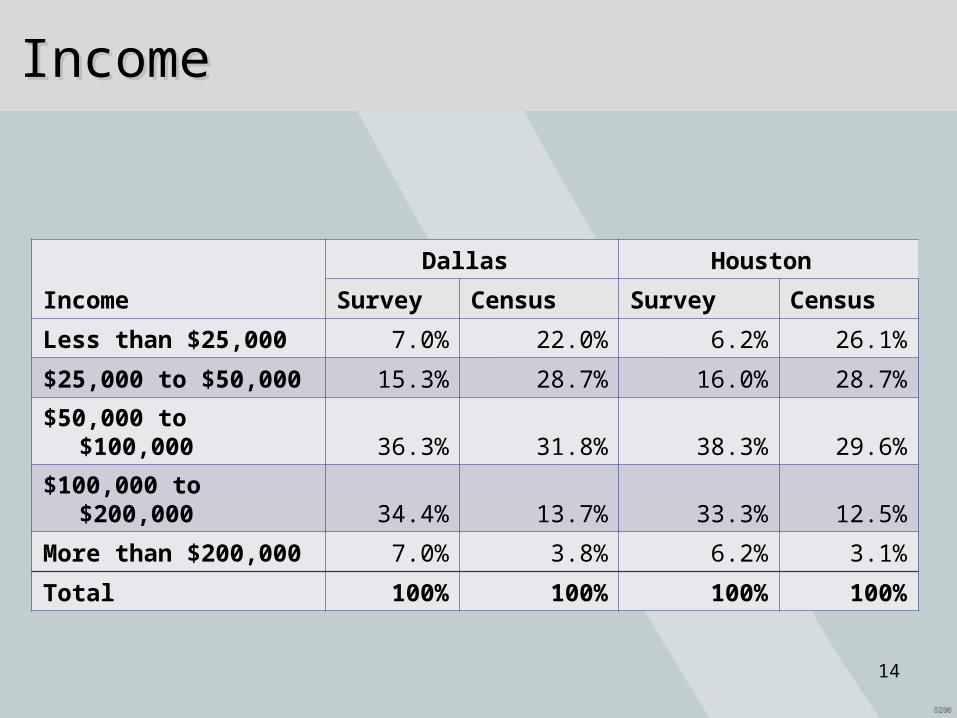
IncomeIncome
Income
Dallas Houston
Survey Census Survey Census
Less than $25,000 7.0% 22.0% 6.2% 26.1%
$25,000 to $50,000 15.3% 28.7% 16.0% 28.7%
$50,000 to $100,000 36.3% 31.8% 38.3% 29.6%
$100,000 to $200,000 34.4% 13.7% 33.3% 12.5%
More than $200,000 7.0% 3.8% 6.2% 3.1%
Total 100% 100% 100% 100%
14
The Bottom Line…The Bottom Line…
• Our sample:– Under-represented minority and low-income travelers– Over-represented toll road users
• Weighted our results to better represent Houston and Dallas traveler characteristics by:– 4 income groups– 4 ethnic groups– Toll versus non-toll road travelers
15
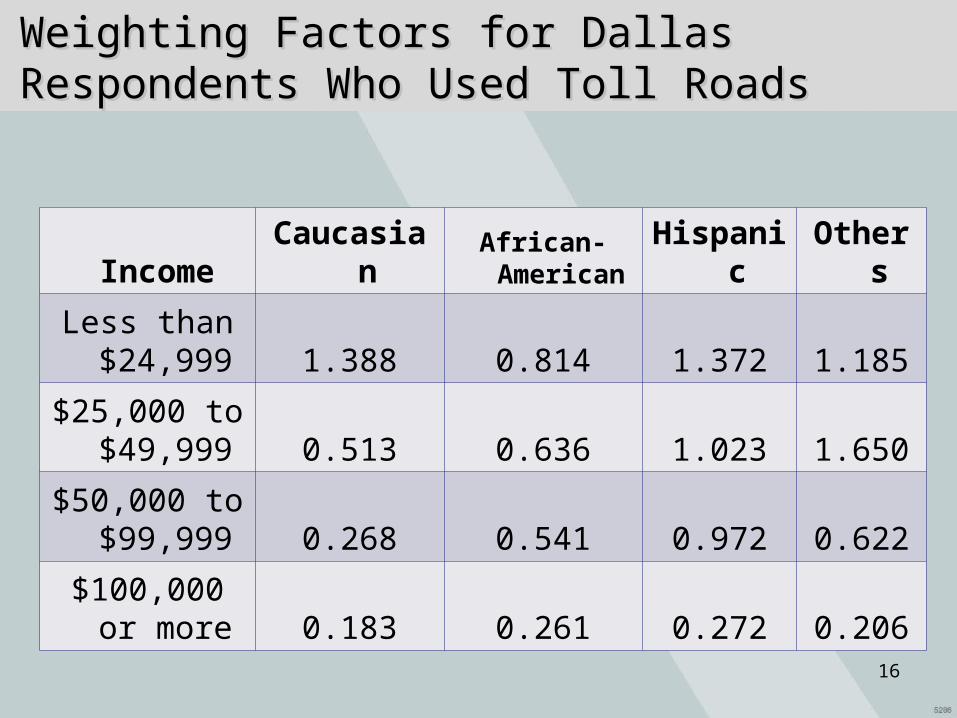
Weighting Factors for Dallas Respondents Who Weighting Factors for Dallas Respondents Who Used Toll RoadsUsed Toll Roads
Income CaucasianAfrican-American Hispanic Others
Less than $24,999 1.388 0.814 1.372 1.185
$25,000 to $49,999 0.513 0.636 1.023 1.650
$50,000 to $99,999 0.268 0.541 0.972 0.622
$100,000 or more 0.183 0.261 0.272 0.206
16
Reasons for Mode ChoiceReasons for Mode Choice
• Why Do People Carpool?• Why Don’t People Carpool?• Why Do People Use Transit?
17
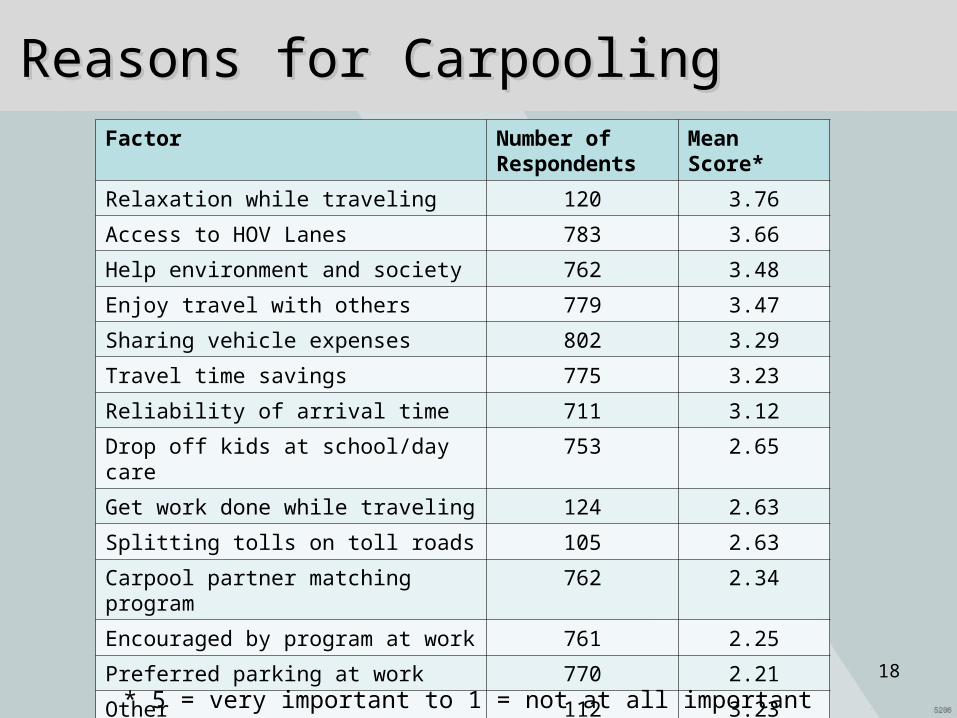
Reasons for CarpoolingReasons for CarpoolingFactor Number of
RespondentsMean Score*
Relaxation while traveling 120 3.76
Access to HOV Lanes 783 3.66
Help environment and society 762 3.48
Enjoy travel with others 779 3.47
Sharing vehicle expenses 802 3.29
Travel time savings 775 3.23
Reliability of arrival time 711 3.12
Drop off kids at school/day care 753 2.65
Get work done while traveling 124 2.63
Splitting tolls on toll roads 105 2.63
Carpool partner matching program 762 2.34
Encouraged by program at work 761 2.25
Preferred parking at work 770 2.21
Other 112 3.23
* 5 = very important to 1 = not at all important18
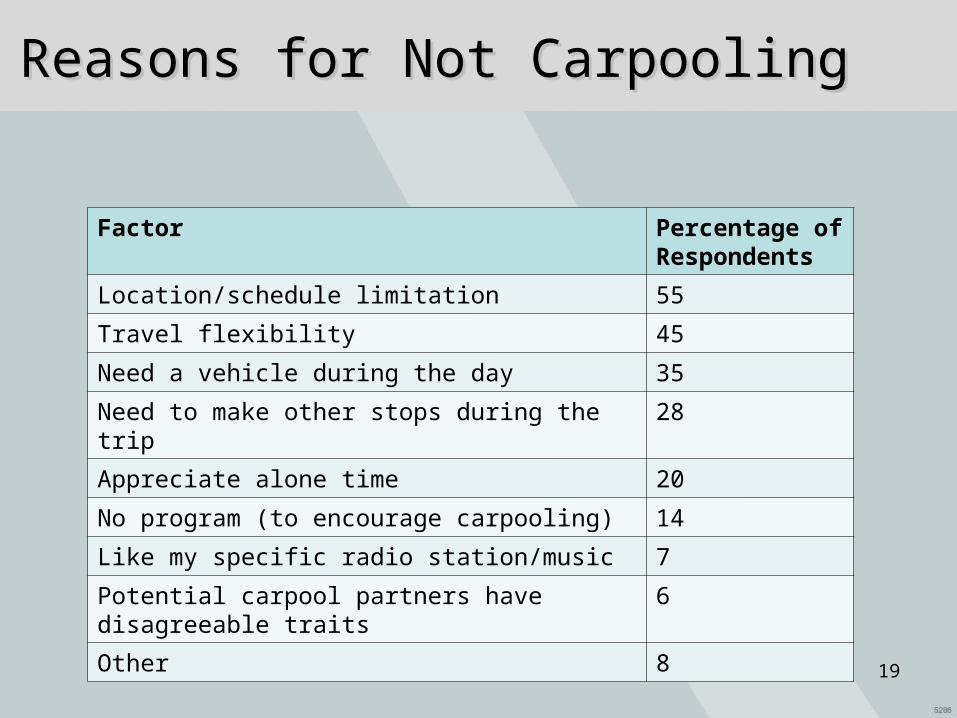
Reasons for Not CarpoolingReasons for Not Carpooling
Factor Percentage of Respondents
Location/schedule limitation 55
Travel flexibility 45
Need a vehicle during the day 35
Need to make other stops during the trip 28
Appreciate alone time 20
No program (to encourage carpooling) 14
Like my specific radio station/music 7
Potential carpool partners have disagreeable traits 6
Other 8
19
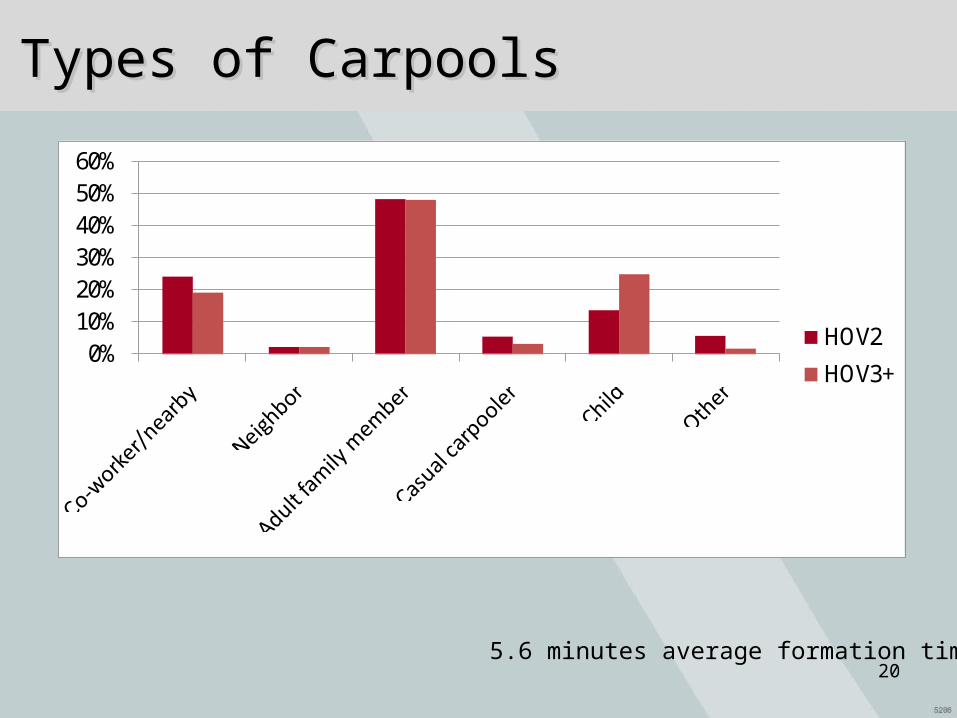
Types of CarpoolsTypes of Carpools
0%10%20%30%40%50%60%
HOV2
HOV3+
5.6 minutes average formation time20
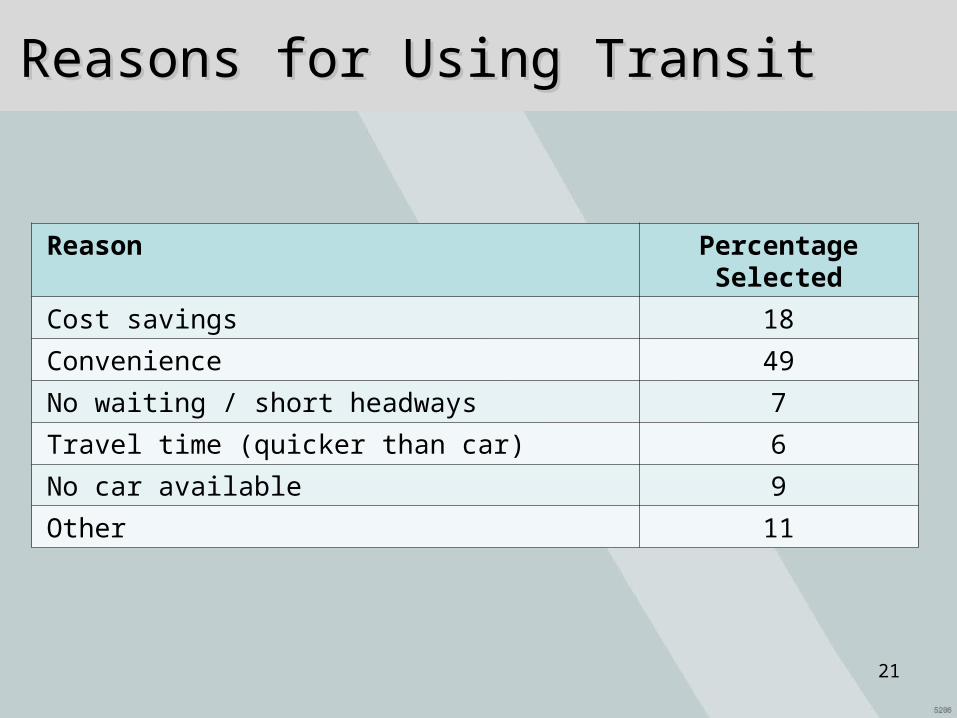
Reasons for Using TransitReasons for Using Transit
Reason Percentage Selected
Cost savings 18
Convenience 49
No waiting / short headways 7
Travel time (quicker than car) 6
No car available 9
Other 11
21
Interest in Managed LanesInterest in Managed Lanes
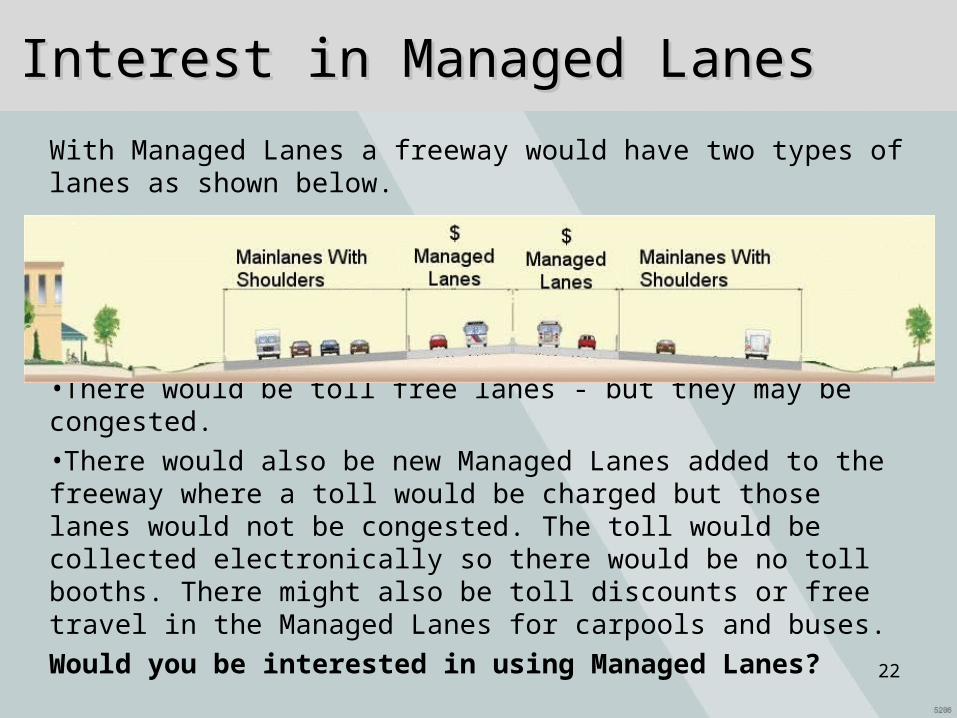
With Managed Lanes a freeway would have two types of lanes as shown below.
•There would be toll free lanes - but they may be congested.
•There would also be new Managed Lanes added to the freeway where a toll would be charged but those lanes would not be congested. The toll would be collected electronically so there would be no toll booths. There might also be toll discounts or free travel in the Managed Lanes for carpools and buses.
Would you be interested in using Managed Lanes?22
Data Analysis Data Analysis
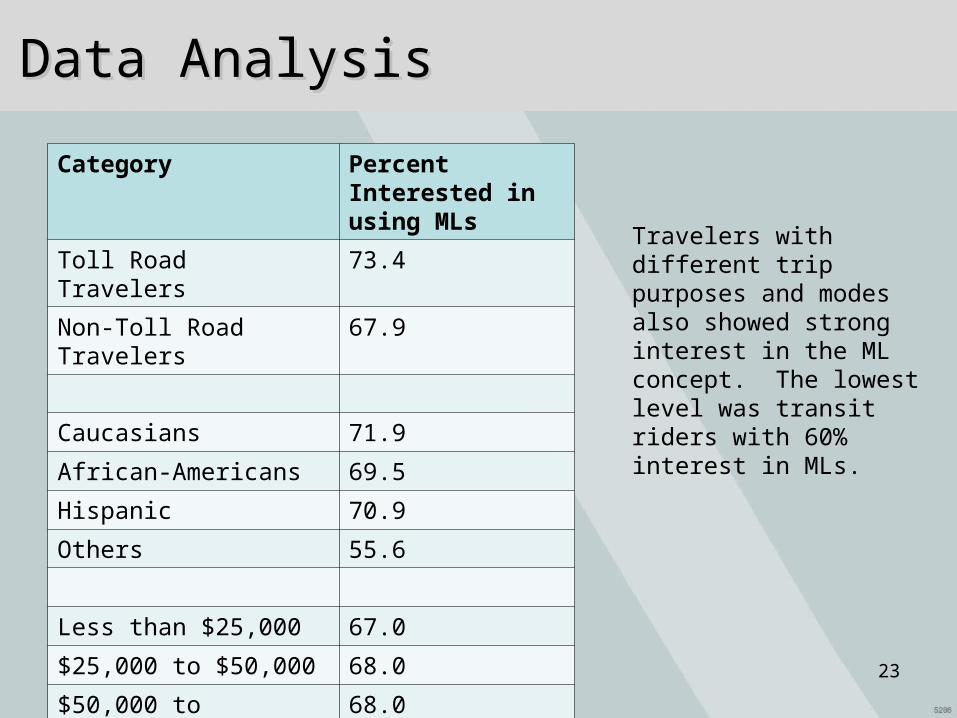
Category Percent Interested in using MLs
Toll Road Travelers 73.4
Non-Toll Road Travelers 67.9
Caucasians 71.9
African-Americans 69.5
Hispanic 70.9
Others 55.6
Less than $25,000 67.0
$25,000 to $50,000 68.0
$50,000 to $100,000 68.0
More than $100,000 78.3
Travelers with different trip purposes and modes also showed strong interest in the ML concept. The lowest level was transit riders with 60% interest in MLs.
23
Data AnalysisData Analysis
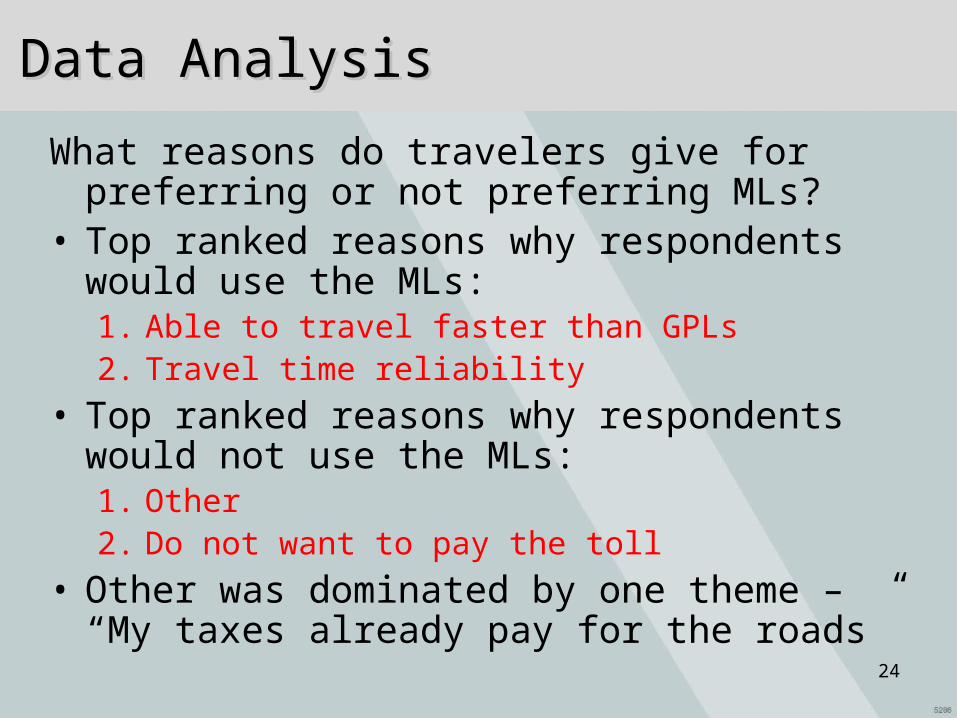
What reasons do travelers give for preferring or not preferring MLs?
• Top ranked reasons why respondents would use the MLs:1. Able to travel faster than GPLs2. Travel time reliability
• Top ranked reasons why respondents would not use the MLs:1. Other2. Do not want to pay the toll
• Other was dominated by one theme – “My taxes already pay for the roads”
24
Stated Preference QuestionsStated Preference Questions
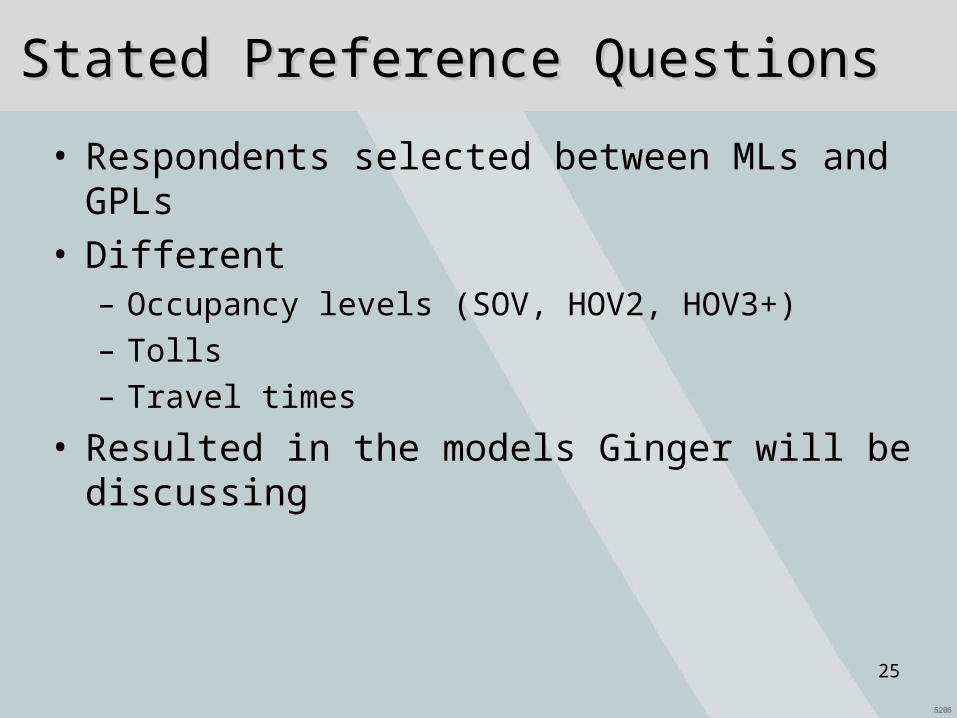
• Respondents selected between MLs and GPLs• Different
– Occupancy levels (SOV, HOV2, HOV3+)– Tolls– Travel times
• Resulted in the models Ginger will be discussing
25
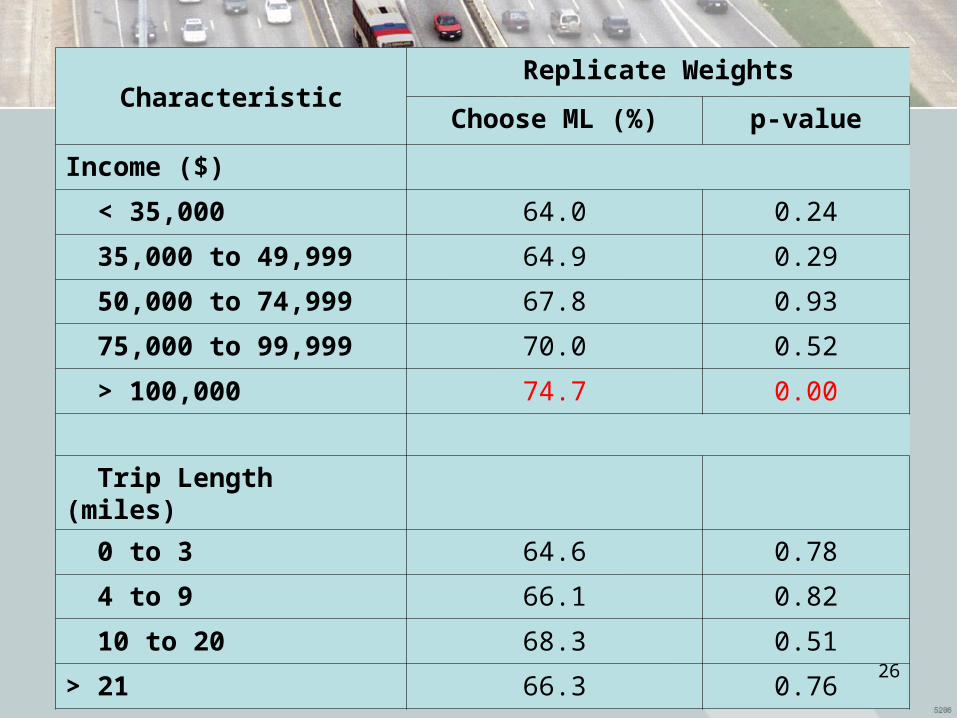
CharacteristicReplicate Weights
Choose ML (%) p-value
Income ($)
< 35,000 64.0 0.24
35,000 to 49,999 64.9 0.29
50,000 to 74,999 67.8 0.93
75,000 to 99,999 70.0 0.52
> 100,000 74.7 0.00
Trip Length (miles)
0 to 3 64.6 0.78
4 to 9 66.1 0.82
10 to 20 68.3 0.51
> 21 66.3 0.76 26
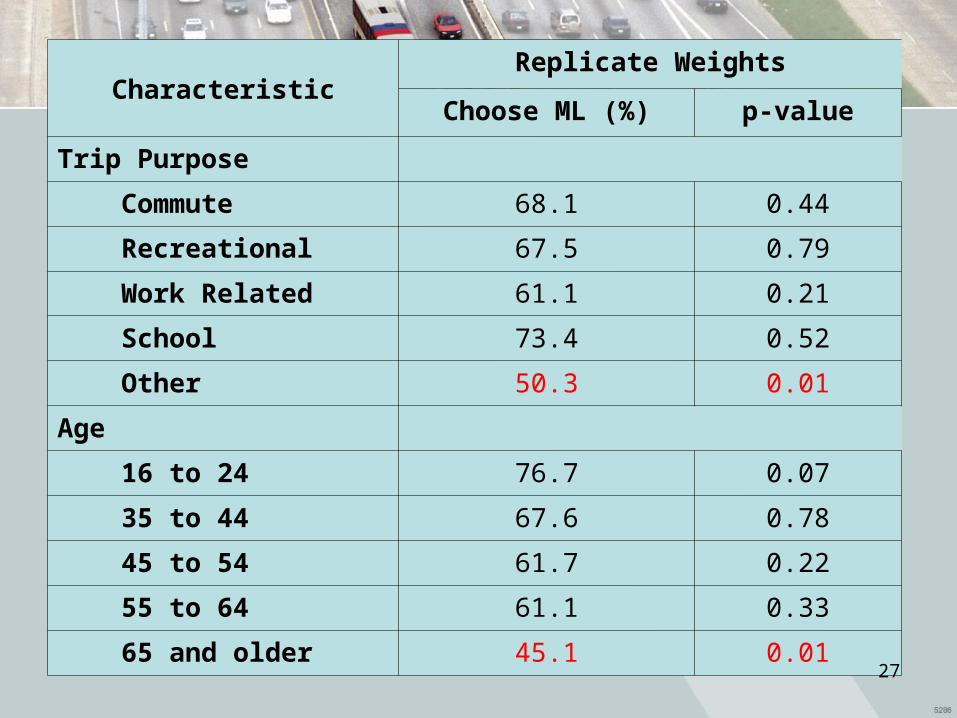
CharacteristicReplicate Weights
Choose ML (%) p-value
Trip Purpose
Commute 68.1 0.44
Recreational 67.5 0.79
Work Related 61.1 0.21
School 73.4 0.52
Other 50.3 0.01
Age
16 to 24 76.7 0.07
35 to 44 67.6 0.78
45 to 54 61.7 0.22
55 to 64 61.1 0.33
65 and older 45.1 0.0127
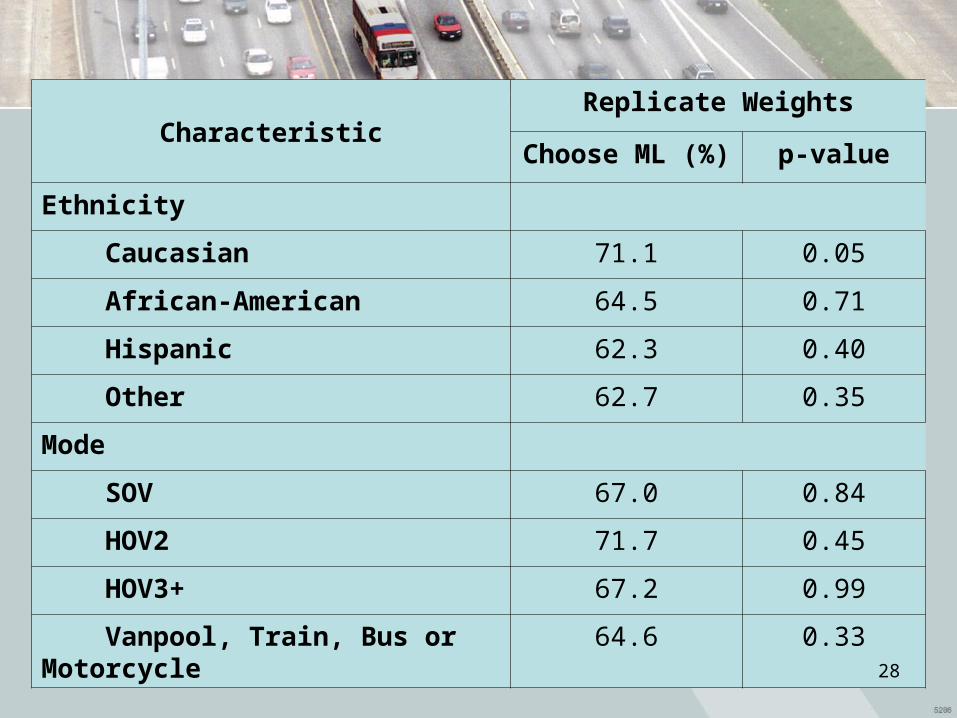
CharacteristicReplicate Weights
Choose ML (%) p-value
Ethnicity
Caucasian 71.1 0.05
African-American 64.5 0.71
Hispanic 62.3 0.40
Other 62.7 0.35
Mode
SOV 67.0 0.84
HOV2 71.7 0.45
HOV3+ 67.2 0.99
Vanpool, Train, Bus or Motorcycle
64.6 0.33
28
Survey ResultsSurvey Results
• With the planned ML in Texas, providing preferential treatment to HOVs is a significant issue.
• The web survey provided a cost-effective survey method, but required follow up for some groups.
• Overall, a lot of interest in MLs (approximately 70%).
29
Survey ResultsSurvey Results
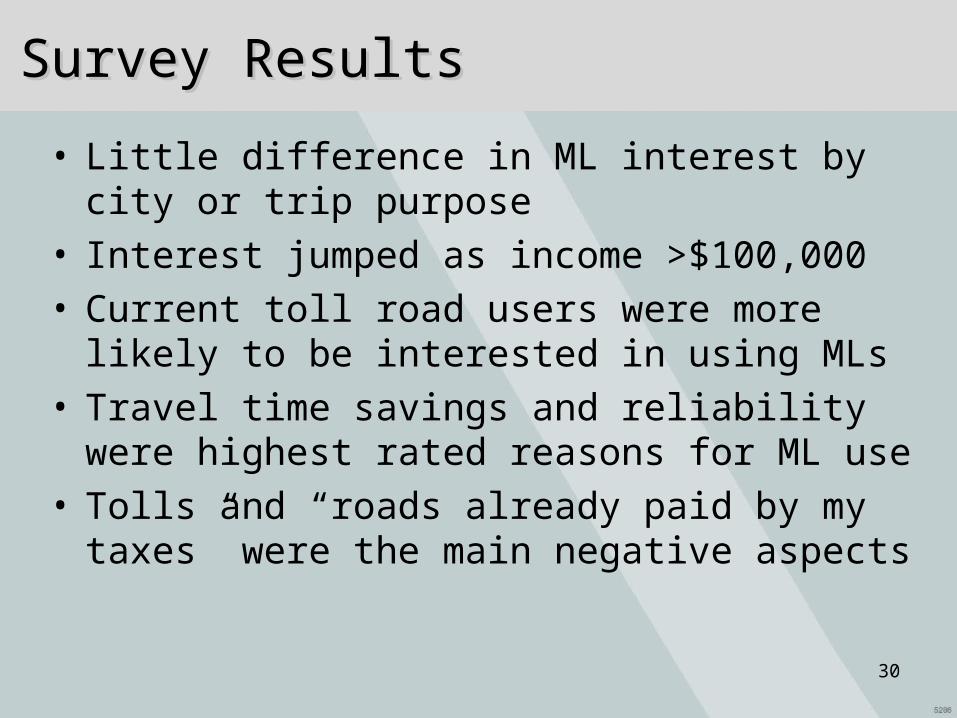
• Little difference in ML interest by city or trip purpose
• Interest jumped as income >$100,000 • Current toll road users were more likely to be
interested in using MLs• Travel time savings and reliability were highest
rated reasons for ML use• Tolls and “roads already paid by my taxes” were
the main negative aspects
30
Empirical ResultsEmpirical Results
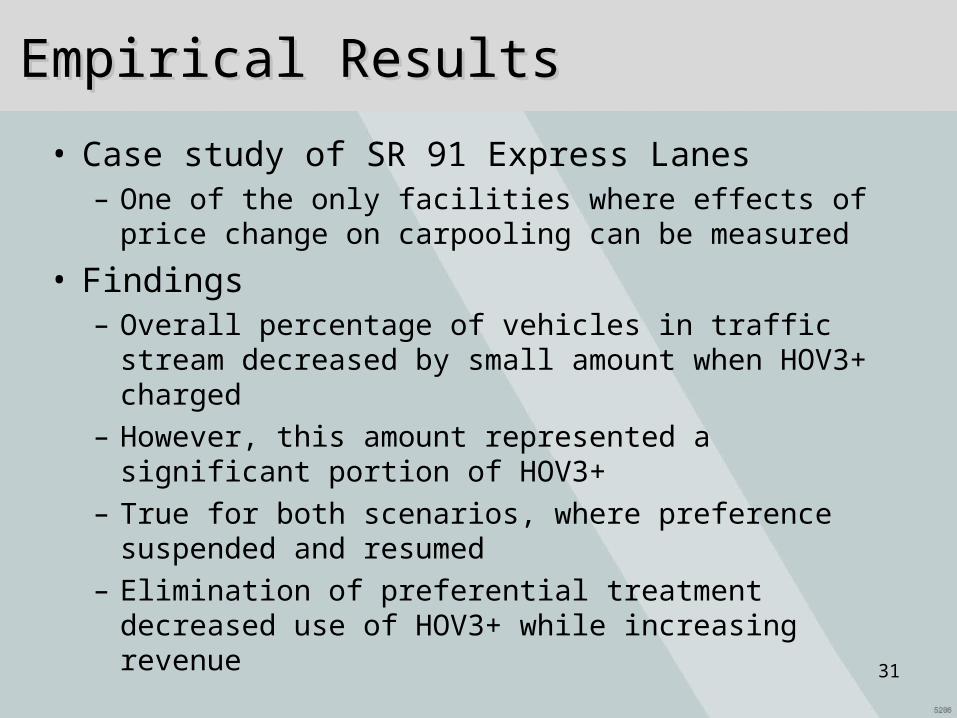
• Case study of SR 91 Express Lanes– One of the only facilities where effects of price change
on carpooling can be measured
• Findings– Overall percentage of vehicles in traffic stream
decreased by small amount when HOV3+ charged– However, this amount represented a significant portion
of HOV3+– True for both scenarios, where preference suspended
and resumed – Elimination of preferential treatment decreased use of
HOV3+ while increasing revenue31
Impact Analysis - ModelingImpact Analysis - Modeling
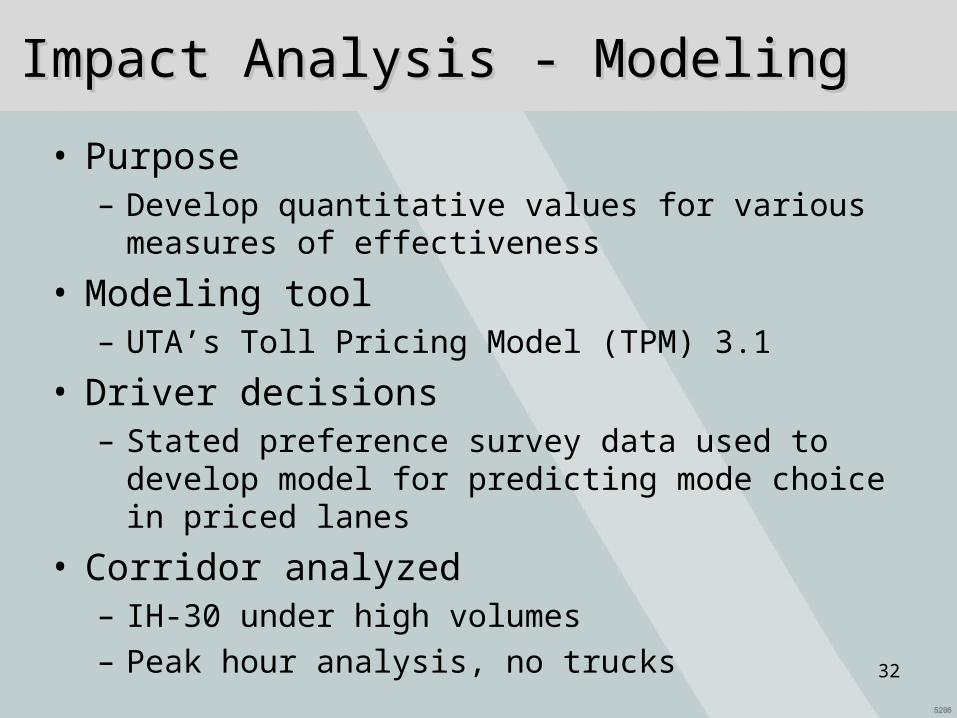
• Purpose– Develop quantitative values for various measures of
effectiveness
• Modeling tool– UTA’s Toll Pricing Model (TPM) 3.1
• Driver decisions– Stated preference survey data used to develop model
for predicting mode choice in priced lanes
• Corridor analyzed– IH-30 under high volumes– Peak hour analysis, no trucks
32
HOV Policy ScenariosHOV Policy Scenarios
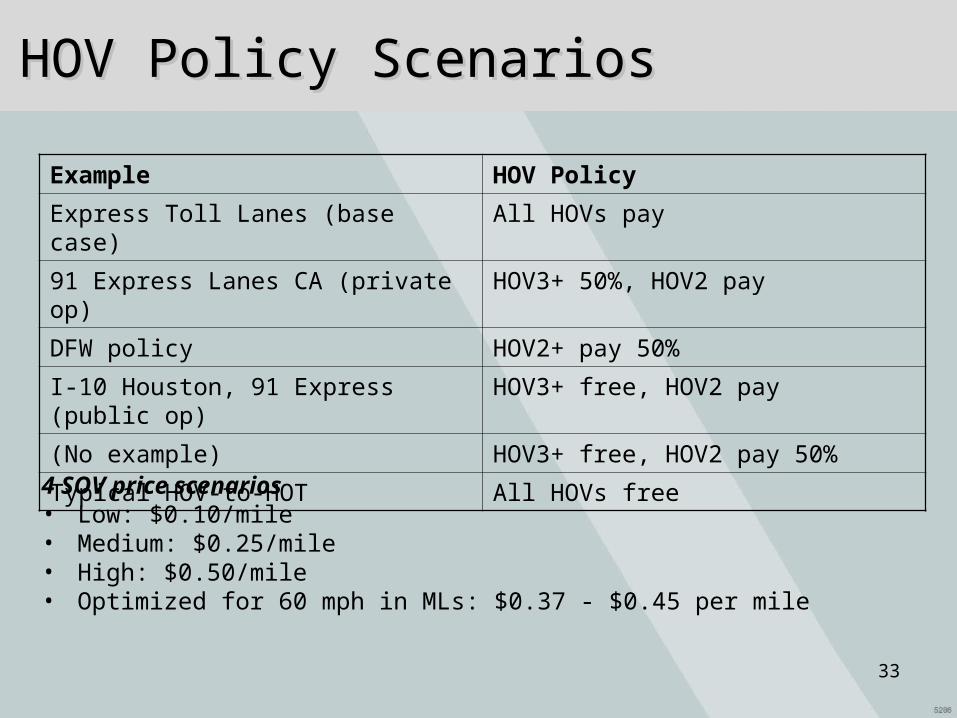
Example HOV Policy
Express Toll Lanes (base case) All HOVs pay
91 Express Lanes CA (private op) HOV3+ 50%, HOV2 pay
DFW policy HOV2+ pay 50%
I-10 Houston, 91 Express (public op) HOV3+ free, HOV2 pay
(No example) HOV3+ free, HOV2 pay 50%
Typical HOV-to-HOT All HOVs free
4 SOV price scenarios• Low: $0.10/mile• Medium: $0.25/mile• High: $0.50/mile• Optimized for 60 mph in MLs: $0.37 - $0.45 per mile
33
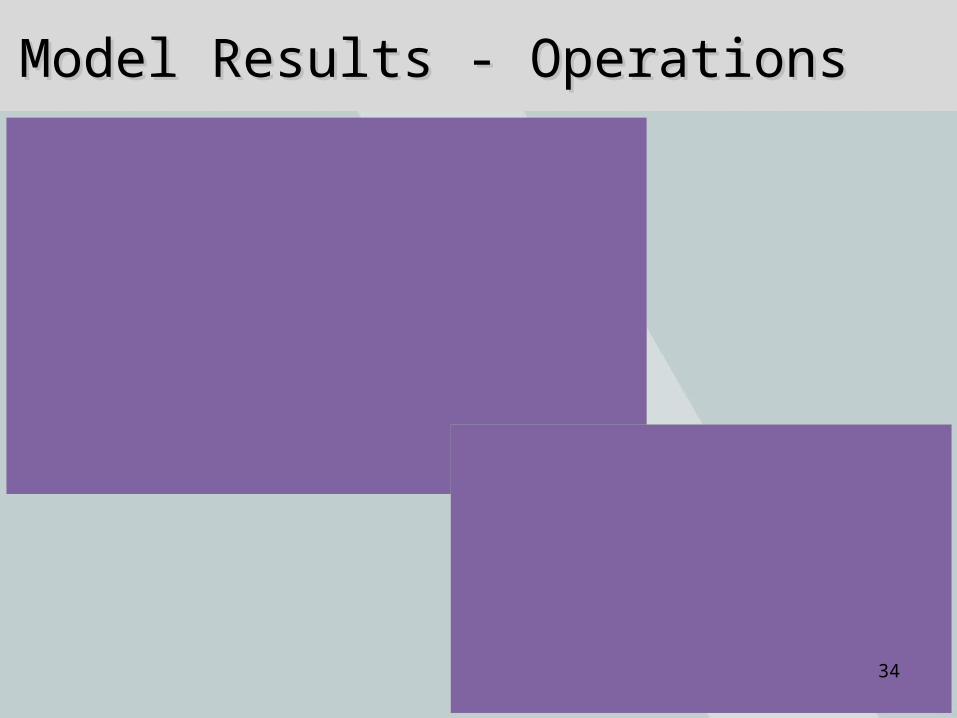
Model Results - OperationsModel Results - Operations
General Purpose Lane Average Speed (mph)
0
10
20
30
40
50
60
ETL AllPay
(BaseCase)
HOV3+50%
HOV2Pay
All HOV50% Toll
HOV 3+Free
HOV2Pay
HOV3+Free
HOV250%
All HOVFree
$0.10/mile
$0.25/mile
$0.50/mile
$0.37-$0.45/mile
Managed Lanes Average Speed (mph)
01020304050607080
ETL AllPay
(BaseCase)
HOV3+50%
HOV2Pay
All HOV50% Toll
HOV 3+Free
HOV2Pay
HOV3+Free
HOV250%
All HOVFree
$0.10/mile
$0.25/mile
$0.50/mile
$0.37-$0.45/mile
34
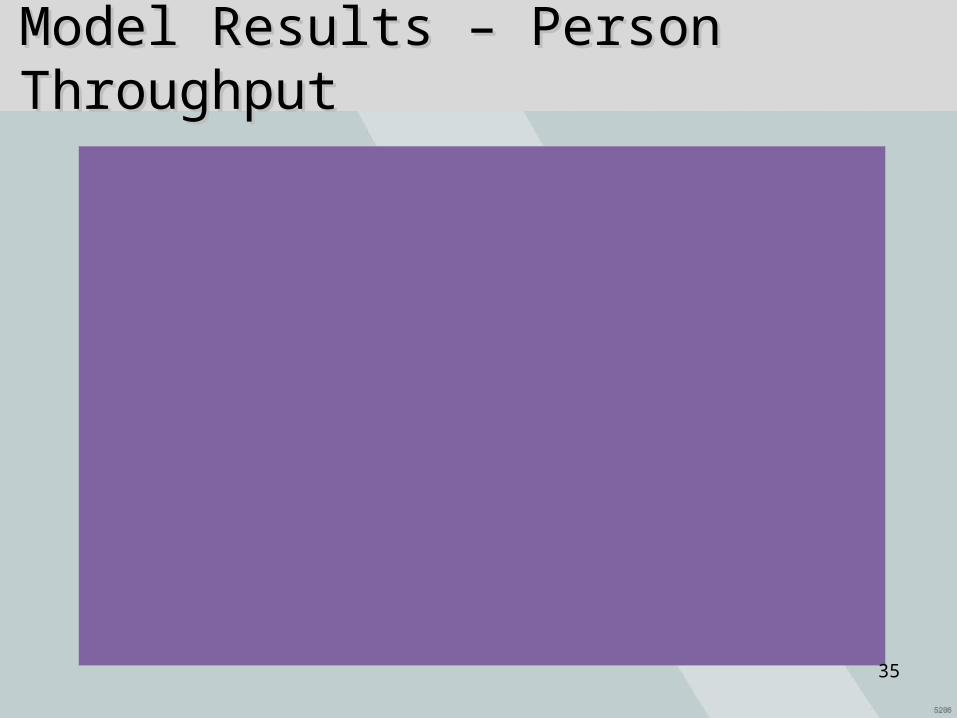
Model Results – Person ThroughputModel Results – Person Throughput
Percent Increase in Person Throughput
0%
50%
100%
150%
200%
250%
ETL All Pay(BaseCase)
HOV3+50% HOV2
Pay
All HOV50% Toll
HOV 3+Free HOV2
Pay
HOV3+Free HOV2
50%
All HOVFree
$0.10/mile
$0.25/mile
$0.50/mile
$0.37-$0.45/mile
Toll Rate
35
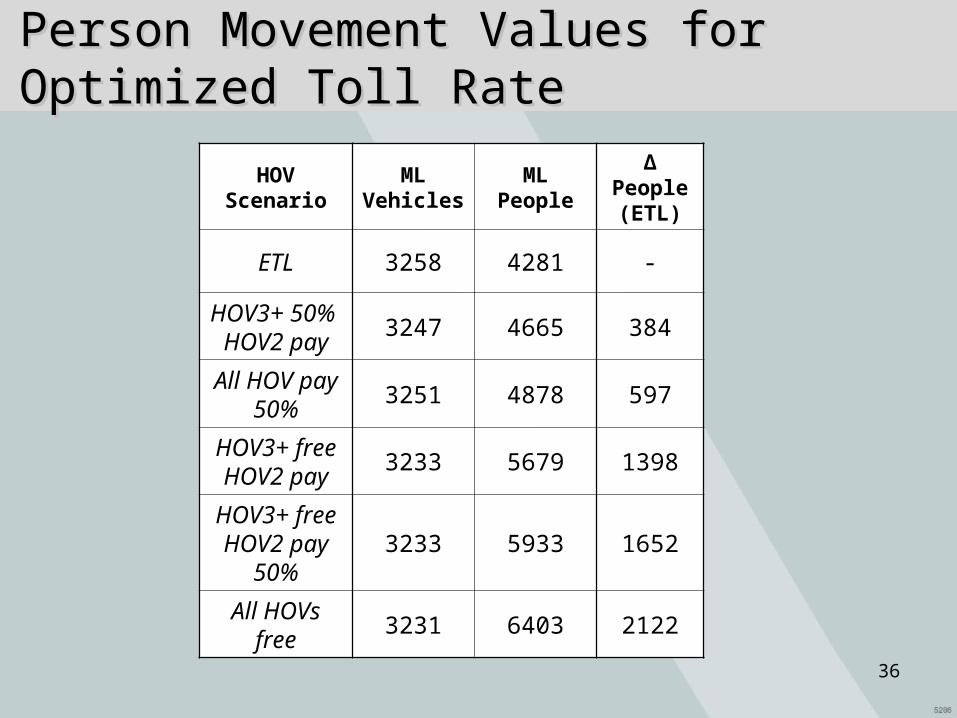
Person Movement Values for Optimized Person Movement Values for Optimized Toll RateToll Rate
HOV Scenario
ML Vehicles
ML People
Δ People (ETL)
ETL 3258 4281 -
HOV3+ 50% HOV2 pay
3247 4665 384
All HOV pay 50%
3251 4878 597
HOV3+ free HOV2 pay
3233 5679 1398
HOV3+ free HOV2 pay
50%3233 5933 1652
All HOVs free
3231 6403 2122
36
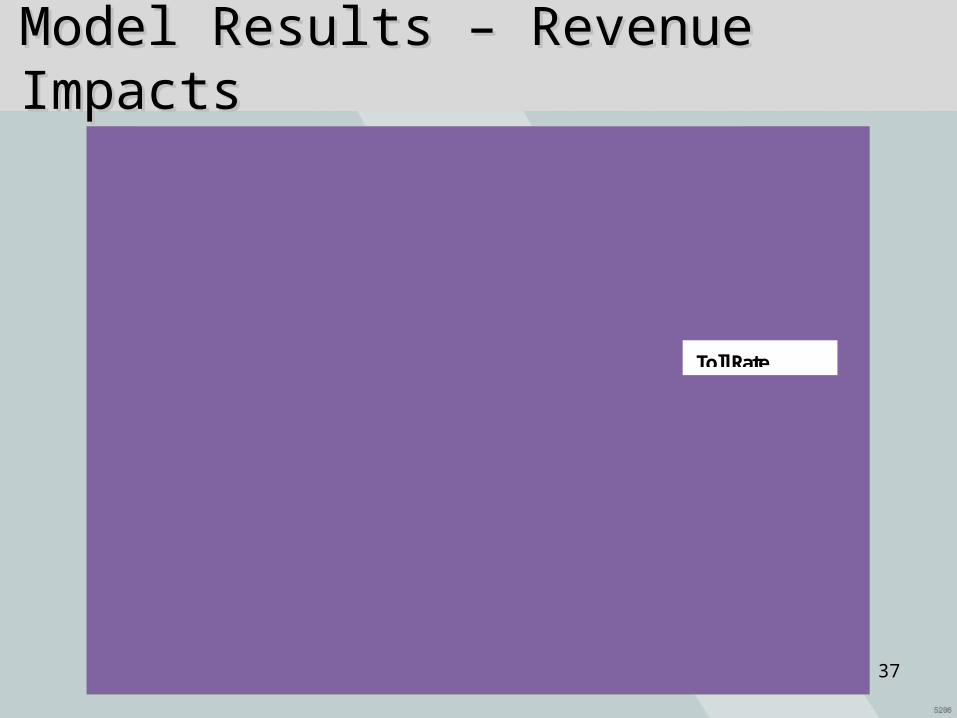
Model Results – Revenue ImpactsModel Results – Revenue Impacts
Revenue as a Percentage of Base Case (ETL)
0%
20%
40%
60%
80%
100%
120%
140%
ETL All Pay(BaseCase)
HOV3+50% HOV2
Pay
All HOV50% Toll
HOV 3+Free HOV2
Pay
HOV3+Free HOV2
50%
All HOVFree
$0.10/mile
$0.25/mile
$0.50/mile
$0.37-$0.45/mile
Toll Rate
37
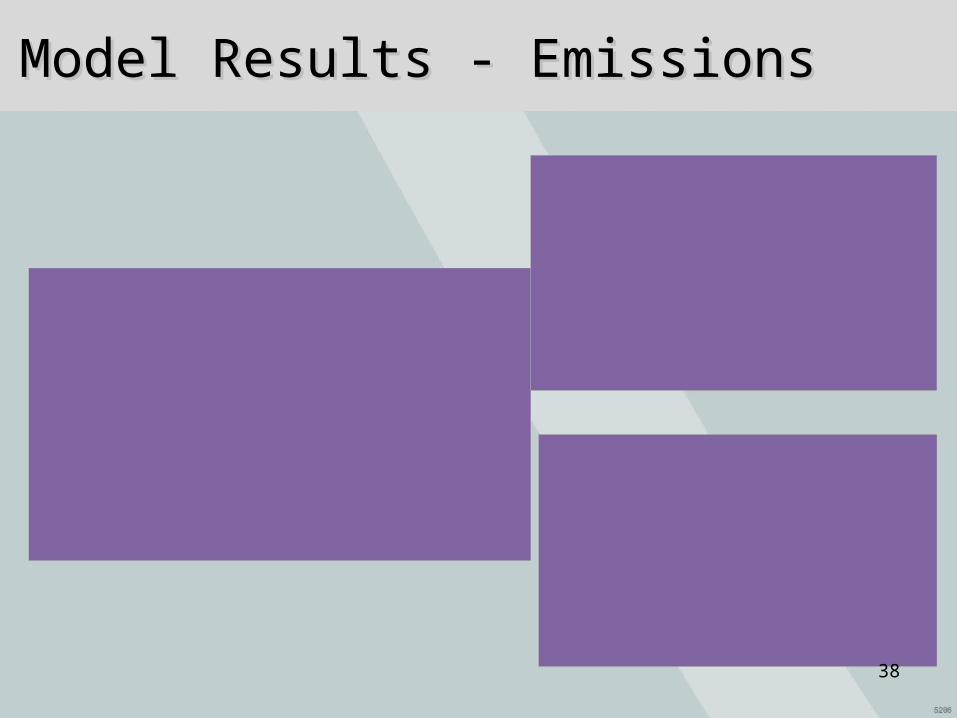
Model Results - EmissionsModel Results - Emissions
Percent Increase in NOx Emissions Over Base Case (ETL)
0%1%2%3%4%5%6%7%
ETL AllPay
(BaseCase)
HOV3+50%
HOV2Pay
All HOV50% Toll
HOV 3+Free
HOV2Pay
HOV3+Free
HOV250%
All HOVFree
$0.10/mile
$0.25/mile
$0.50/mile
$0.37-$0.45/mile
Percent Decrease in CO Emissions Over Base Case (ETL)
-2%-1%0%1%2%3%4%5%6%7%8%
ETL AllPay
(BaseCase)
HOV3+50%
HOV2Pay
All HOV50% Toll
HOV 3+Free
HOV2Pay
HOV3+Free
HOV250%
All HOVFree
$0.10/mile
$0.25/mile
$0.50/mile
$0.37-$0.45/mile
Percent Decrease in VOC Emissions Over Base Case (ETL)
-6%-4%-2%0%2%4%6%8%
ETL AllPay
(BaseCase)
HOV3+50%
HOV2Pay
All HOV50% Toll
HOV 3+Free
HOV2Pay
HOV3+Free
HOV250%
All HOVFree
$0.10/mile
$0.25/mile
$0.50/mile
$0.37-$0.45/mile
38
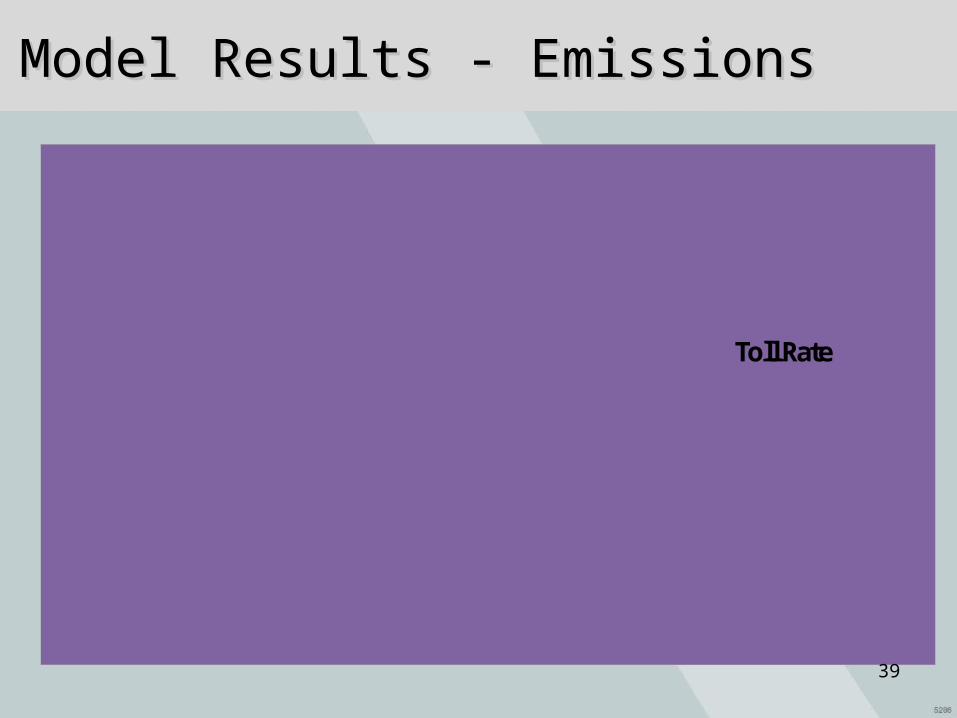
Model Results - EmissionsModel Results - Emissions
Percent Decrease in CO2 Emissions Over Base Case (ETL)
0%2%4%6%8%
10%12%14%16%18%
ETL AllPay
(BaseCase)
HOV3+50%
HOV2Pay
All HOV50% Toll
HOV 3+Free
HOV2Pay
HOV3+Free
HOV250%
All HOVFree
$0.10/mile
$0.25/mile
$0.50/mile
$0.37-$0.45/mile
Toll Rate
39
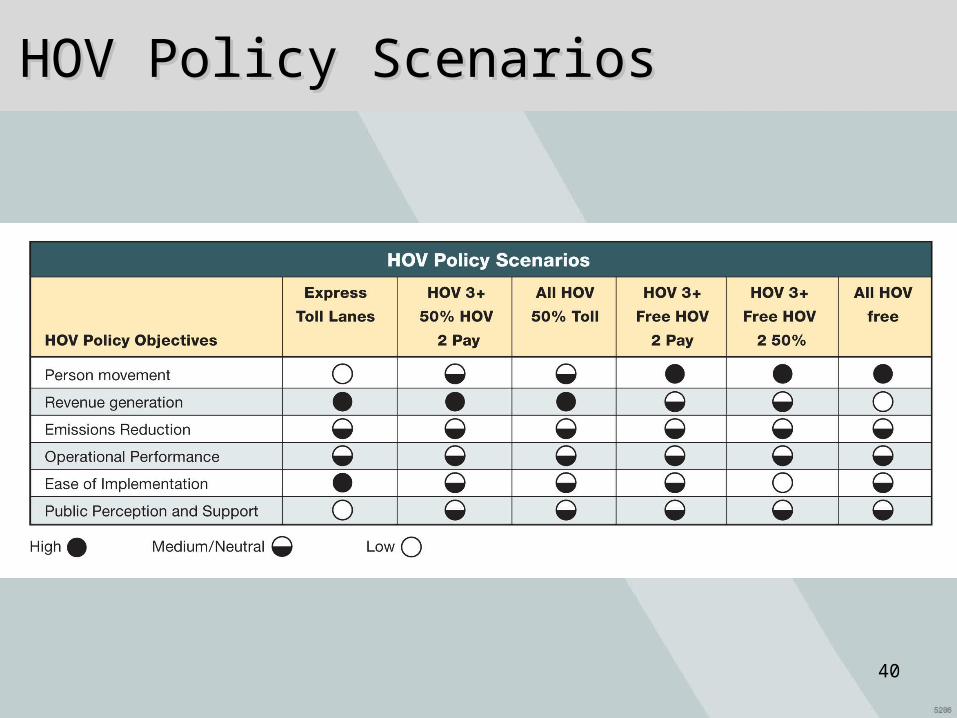
HOV Policy ScenariosHOV Policy Scenarios
40
Overall FindingsOverall Findings
• HOV preferences in Managed Lanes can influence carpooling behavior
• Family member carpools make up the vast majority of carpools– HOV access rates high in “fampool” responses
• Support for Managed Lanes is high in Texas cities that currently have both toll roads and HOV lanes, and “faster travel” and “travel time reliability” were the most important reasons for support
• There may be more to gain in person-moving capacity with policies that emphasize HOV preference
• The determination of the appropriate HOV policy in Managed Lanes depends upon individual project objectives
41
HOV Policy ConsiderationsHOV Policy Considerations
• Existing HOV policies• Regional ridesharing objectives• Facility performance objectives
42