Embed Size (px)
Citation preview
Simulation of Ultrasound Produced byConcentric RingTransducer Phased Array to Treat Urinary BladderUsingWaveform Diversity Method
* Ashraf T. Ibrahim and **Nour H [email protected] , [email protected].
Faculty of engineering, Alexandria University, Egypt.
ABSTRACTThe waveform diversity method is applied for the simulation of focused ultrasound produced by a concentric ring transducer phased array which is located in front of a urinary bladder having a tumor.The waveform diversity methodcomputes the output pressure in a certain volume. The pressure deposition due to the array used is converted to the therapeutic temperature for tumor treatments. Simulation and results show that the concentric ring transducer phased arrays producing pressure determined by waveform diversity method can be applied successfully for urinary bladder tumor treatments.
I.INTRODUCTIONPressure generated by ultrasound phased arrays are calculated by superposing the pressure produced by individual transducer sources. There are many methods to get pressure inside biological media such as Rayleigh–Sommerfield integral, the rectangular radiator method, and the spatial impulse response method. The analytical approaches for those methods are slow due to the large number of calculations [1].The waveform diversity method determines the excitation signals applied to the phased array elements and produces a beam pattern that closely matches the desired power distribution [2]. The optimization algorithm solves the covariance matrix of the excitationsignals through semidefinite programming subject to a seriesof quadratic cost functions and constraints on the control points. Section II discuss the soft ware used for analytical approach depending on the waveform diversity method. Section III explain the model under investigation and how the phased array is used . Section IV contain the pressure and temperaturedistributions while section V present conclusions.
II. ANALYTICAL APPROACHThe soft ware used for the pressurecalculation is performed on a 2.4 GHz Pentium4 PC(1 G byte RAM) running theWindows XP operating system. All routines are written in theC language, compiled by Microsoft VISUAL C/C+ Version7.0, and called by MATLAB 7.1 as MEX files.The main steps of using the waveform diversity method to calculate the pressure field generated by a concentric ring transducer phased array excited by continuous wave will be discussed as follows:i) Select the number of rings in the array , the width of all rings and the edge-to-edge spacing of the rings in meters.ii) Set up the coordinate grid.iii) Specify the layers facing the phased array as bolus , skin , muscle and bladder with tumor.iv)Finally,for a continuous-wave excitation, the pressure generated by a phased array at a spatial coordinate r and at time t is defined by, [3],as
p (r ,t )=∑m=1
M
pm (r ) wm(t)
(1)Where M is the number of array elements, pm(r) is the complex pressure produced by the mth array element at r when excitedby a sinusoidal signal with unit amplitude and zero phase, and wm(t) is a sinusoidal input multiplied by a complex weight that contains the phase and amplitude applied to the mth array generates a sequence of several beam patterns.Equation (1) becomes
p(r,n)=∑m=1
M
pm (r ) wm (n )=p (r ) w (n ) ,
n=1,2,…..,N (2)where p(r) is a 1 ×M row vector that is populated with thevalues pm(r) and w(n) is M × 1 column vector, whichrepresents the

excitation applied to the array for an individualbeam pattern indexed by n. Thus, p(r, n) describes a sequenceof N different beam patterns, and the ultrasound phased array repeatedly cycles through these multiple focus patterns during the hyperthermia treatment. The power depositions from theindividual beam patterns are computed with the plane-waveapproximation and then superposed, givingas [ 2 ]
Q (r )= αρc ∑n=1
N
p (r ,n ) p¿ (r , n)
(3)where Q(r) is the total power deposition, α is the absorptioncoefficient, ρ and c represent the density of the medium and thespeed of sound, respectively, and the superscript *represents theconjugate transpose. Substituting (2) into (3), the expression forthe power deposition becomes
Q(r)= αρc ∑n=1
N
p (r )w ( n ) w∗(n ) p∗(r )
= αρc
p (r ) Rp∗(r )
(4)where R is M ×M Hermitian matrix that is equivalent to the covariance matrix defined in [4]. The deterministic beam synthesisproblem is directly solved by sequentially assigning eachcolumn ofR1/2 to a complex array excitation w(n), whereR1/2is the Hermitian square root of R. The matrix R is rank deficient,so the number of distinct excitation signals is significantlyreduced through singular value decomposition. Here, the rankof the matrix R defines the number of discrete excitations N,and the singular value decomposition is defined as R = USV *,where U and V areM × N matrices with orthonormal columns,and S is a diagonalN × N matrix that contains the singular valuesof R. The reduced solution is then represented by
X = US1/2 (5)where S1/2 is the matrix square root of S, and each columnof the M × N matrix X contains a distinct array excitationw(n). Thus, the number of unique array excitations required toachieve the optimal covariance matrix R
is reduced from M,the number of array elements, to a much smaller number givenby N = rank(R).One objective function that is commonly deployed in hyperthermiaapplications attempts to deliver relatively uniformpower within the tumor region when minimizing the power depositionin normal tissue. The optimization problem solved here is as follows:
p(r0) Rp *(r0)-p(µ)Rp* (µ) >t , µ ε ΩN
p(v) Rp * (v) ≥ 0.9p(r0) Rp* (r0), v ε ΩT
p(v) Rp * (v) ≤ 1.1p(r0) Rp* (r0), v ε ΩT
R≥0
∑Rmm =γ (6)
where μ denotes one of the NNcontrol points in the normaltissue region ΩN, ν denotes one of the NTcontrol points in thetumor region ΩT, and r0 is a characteristic point within ΩT,i.e., r0 is a representative point in the tumor. The cost functionmaximizes the difference between the power at r0 and the powerat all normal tissue control points μ, given that this difference isnonnegative. The first constraint (combined with the restrictiont >0) guarantees that the power at r0 is always larger than thepower at μ. The second and the third constraints ensure thatthe power deposited at the tumor control points ν is not morethan 1.1 times and not less than 0.9 times the power at r0. Thefourth constraint defines the matrix R as a positive semidefiniteHermitian matrix. The fifth constraint indicates that the totalinput power is specified by the constant γ [5].The first fourconstraints are the same as in [4], and the fifth constraint in equation (6) specifies the total input power instead of an average uniformpower. The function p(r) = p(r)Rp *(r) is convex; therefore, the optimization problem in (6) can be solved with public domainsoftware for convex optimization, [6], [7].An ultrasound phased array generates a focus by adjustingthe phases of the excitation signals. For continuous-wave excitations,a single focus is produced by phase conjugation [8],where the negative of the phase of the complex pressure

transferfunction evaluated at the focus for each array element definesthe phase of the excitation signal for that element. With thisapproach, the phased array generates constructive interferenceat each focal spot.The pressures pm(r) generated by the individual array elementsat individual control points are computed with the fastnear-field method [9]. The pressure field in a 3-D volume foran array excitation w(n) is calculated with the angular spectrumapproach combined with the fast near-field method [10].The fast near-field method calculates the pressure generatedby the phased array in an input plane, and the angular spectrumapproach propagates the pressure in the 3-D volume. Eachsteady-state power deposition is computed according to equation (3), andthe contributions from N scans are then superposed.The temperature is simulated with the steady-state bioheat transfer equation (BHTE):
k∇2T (r )−W bC b T( r) +Q ( r) =0(7)
where K is the thermal conductivity of tissue, Cb is the specific heat of blood, Wb is the blood perfusion rate, and T is thetissue temperature increase relative to the baseline arterial bloodtemperature (37 C). Equation (7) is solved with an iterativefinite-difference scheme.[10]
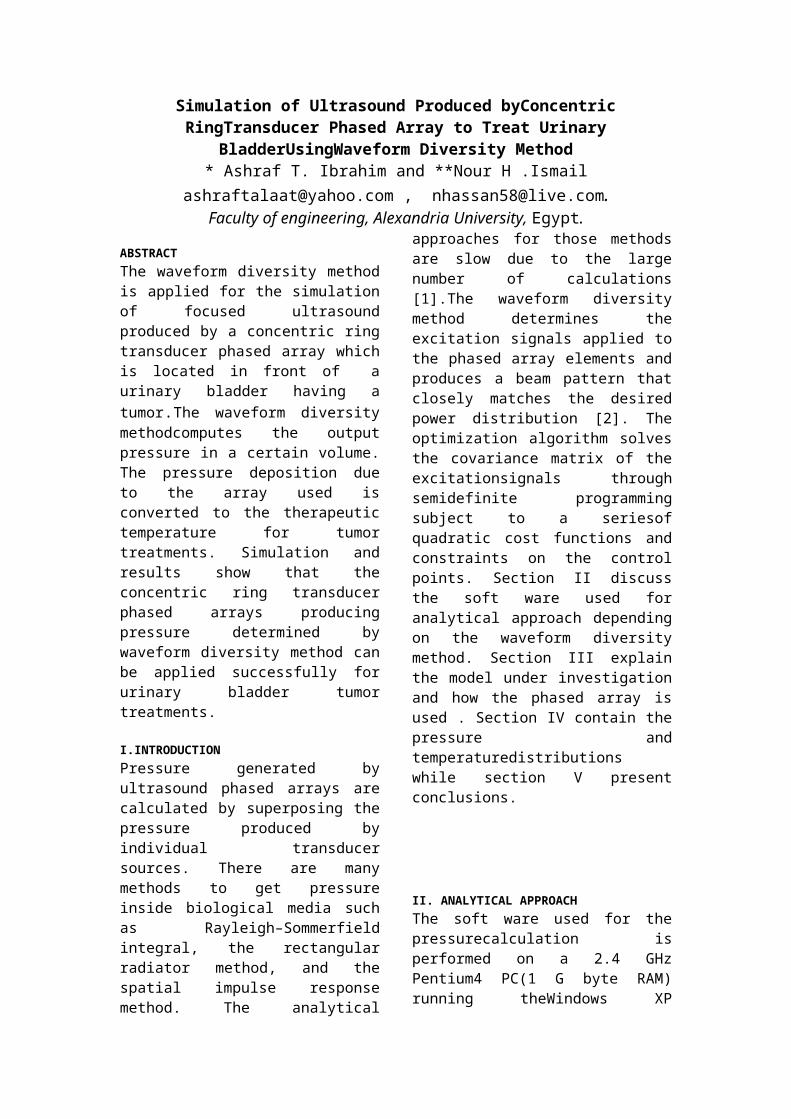
III. MODELING UNDER INVESTIGATIONThis section describe briefly the 10 elementsrings arrayshown in figure1(high=2mm , width =0.5mm,space between elements=0.00075m , f= 1MHz,the outer ring diameter=1.175 cm).Theurinarybladder model shown in figure 2 and thephased array in x-y plane is located parallelto the human body front of urinary bladder tumor .
IV.PRESSURE AND TEMPERATURE DISTRBUTIONSThe numerical analysis using the waveform diversity methodfor 10 rings element 2D planar phased is depicted in this section . The width of all rings =0.5e-3 m with a 7.5x10⁻⁴ m(𝞴/2) space between adjacentelements in both x and y directions.The array is located in the x-yplane at z=0 cm and centered at the origin
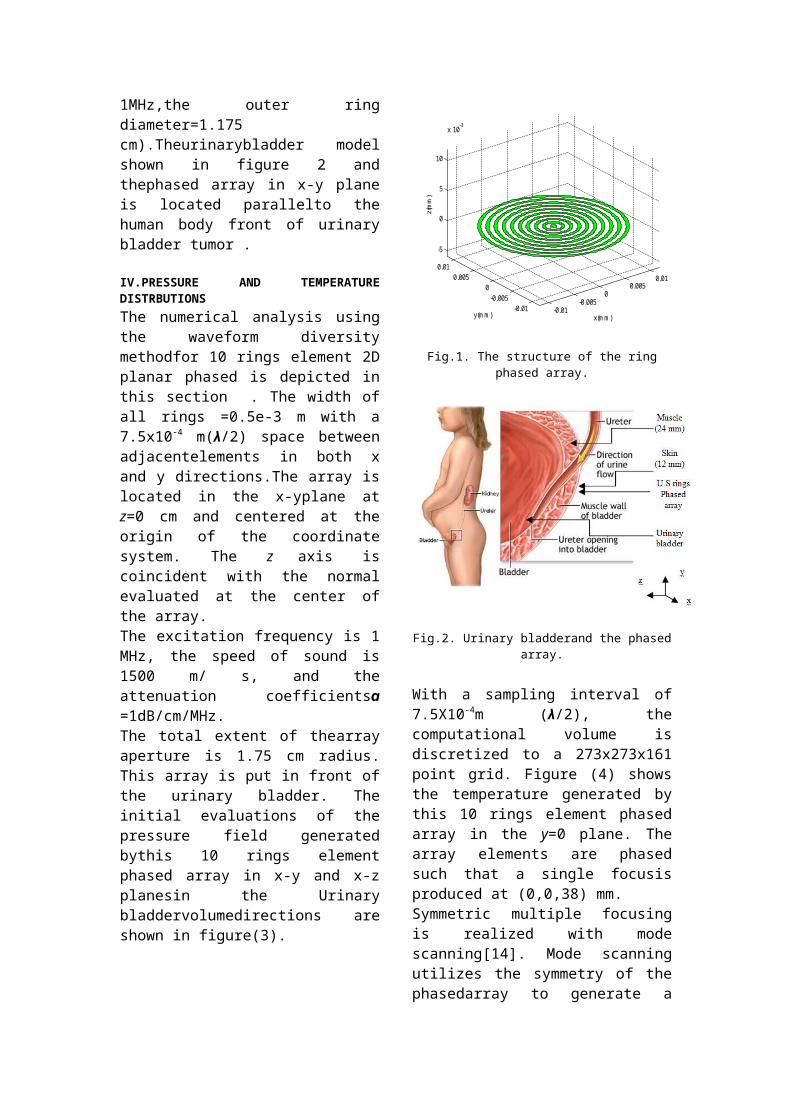
of the coordinate system. The z axis is coincident with the normal evaluated at the center of the array.The excitation frequency is 1 MHz, the speed of sound is 1500 m/ s, and the attenuation coefficients𝞪 =1dB/cm/MHz.The total extent of thearray aperture is 1.75 cm radius. This array is put in front of the urinary bladder. The initial evaluations of the pressure field generated bythis 10 rings element phased array in x-y and x-z planesin the Urinary bladdervolumedirections are shown in figure(3).
-0.01-0.005
00.005
0.01
-0.01-0.005
00.005
0.01
-5
0
5
10
x 10-3
z(m
m)
x(mm)y(mm)
Fig.1. The structure of the ring phased array.
Fig.2. Urinary bladderand the phased array.
With a sampling interval of 7.5X10⁻⁴m (𝞴/2), the computational volume is discretized to a 273x273x161 point grid. Figure (4) shows the temperature generated by this 10 rings element phased array in the y=0 plane. The array elements are
y

phased such that a single focusis produced at (0,0,38) mm.Symmetric multiple focusing is realized with mode scanning[14]. Mode scanning utilizes the symmetry of the phasedarray to generate a symmetric focal pattern while canceling along one or more planes of symmetry. A symmetricphased array is typically divided by thesesymmetric planes intotwo or four equal sections. The array elements in each sectionare indexed according to the planes of symmetry such that thedistances from each pair of elements to any point on the plane ofsymmetry are equal. The computational volume is also dividedinto an equal number of sections by these same planes of symmetry.The rotational signals are defined such that the phasesapplied to elements on opposite sides of each plane of symmetry are offset by π, which causes pressure cancelations alongthe planes of symmetry. A symmetric, focused power distribution is formed by applying rotational excitation signals to each symmetric group of elements and then calculating the phase ofeach group with phase conjugation or waveform diversity.The same array can be used for producing multi focus in the same tumor volume at 38mm and thetemperature distribution is shown in figure (5). In thermal therapy simulations, the power deposition is generally modeled by Equation(3). The resulting power deposition provides the input to the BHTE,[15],which simulates the temperature distribution. To show the influence of waveformdiversity method, simulation parameters on the calculatedtemperature, the bio-heat transfer model in Equation(4)isevaluated for the 10 rings arraywhich generates a multiple focus at 38 mmtumor volume. In these simulations, the temperature field is computed in a 38 mm volume, where theboundaries of the computational grid are maintained at37°C, the blood perfusion is 8 kg/m3 / s, the thermal conductivityis 0.55 W/m/ °C, and the specific heat of blood is4000 J /kg/ °C. The goal of each simulation is to elevate thetemperature at the focus to be close to 45°C (therapeutic temperature)[15]. The temperature fields are shown in figure 5.
V.CONCLUSIONS
The pressure and temperature distributions are obtained by thewaveform diversitymethod . Thesimulation results show that the peak tumor temperatures producedby spot scanning occur in the region of the tumor thatis proximal to the phased array, and significant intervening tissue heating is also generated.Thus, waveform diversity combined withmodescanning generates multiple focus patterns that maximizethe
-8 -6 -4 -2 0 2 4 6 8-20
-15
-10
-5
0
5
10
15
20
x (mm)
y (m
m)
p0 (Calculated with FNM at z =38 mm)
a- Pressure in x-y plan at z=38mm .
0 10 20 30 40 50 60
-8
-6
-4
-2
0
2
4
6
8
z (mm)
x (m
m)
WDM Pressure (y=0)
b- Pressure in x-z plan at z=38mmFig.3. The ultrasound pressure at z=38mm.
Fig.4. The temperature distribution in the treatment volume at (0,0,38)mm.
-15 -10 -5 0 5 10 150
5
10
15
20
25
30
35
40
45temperature at y = 0
x (mm)
tem
p (d
egre
e)
Fig.5. The temperature distribution in the treatment volume.
power delivered to the tumor when minimizing the powerin otherspecified locations, and this combination improves thetemperature localization relative to single focus spot scanning.The10 concentric rings phased array discussed in this paper is used successfully to produce pressure leads to temperature with therapeutic values efficient to treat tumors in bladder. Finally , the phased array can be considered as an efficient non- invasive method for tumor treatments without surgery.
REFERENCES
[1]Xiaozheng Zeng and Robert J. McGough"Optimal simulations of the angular spectrum approach" J. Acoust. Soc. Am. 125 (5), (May 2009).
[2]Xiaozheng (Jenny) Zeng, Jian Li Robert J. McGough''A Waveform Diversity Method for Optimizing 3-DPower Depositions Generated by Ultrasound Phased Array'' IEEE TRANSACTIONS ON BIOMEDICAL ENGINEERING, VOL. 57, NO. 1, JANUARY (2010).
[3] D. Liu and R. C. Wagg, “Propagation and backpropagation for ultrasonic wavefront design,” IEEE Trans. Ultrason. Ferroelectr. Freq. Control 44, 1–13 (1997).
[4] B. Guo and J. Li, “Waveform diversity based ultrasound system for hyperthermiatreatment of breast cancer,” IEEE Trans. Biomed. Eng., vol. 55,no. 2, pp. 822–826, Feb. (2008).
[5]P. Stoica, J. Li, X. Zhu, and B. Guo, “Waveform synthesis for diversity based transmit beam pattern design,” IEEE Trans.
Signal Process., vol. 56,no. 6, pp. 2593–2598, Jun. (2008).
[6] J. F. Sturm, “Using SeDuMi 1.02, a MATLAB toolbox for optimization over symmetric cones,” Optim. Methods Softw., vol. 11/12, pp. 625–653, (1999).
[7]K. C. Toh, M. J. Todd, andR.H. Tutuncu, “SDPT3—AMATLABsoftwarepackage for semidefinite programming,” Optim. Methods Softw., vol. 11, pp. 545–581, (1999).
[8] M. S. Ibbini and C. A. Cain, “A field conjugation method for directsynthesis of hyperthermia phased-array heating patterns,” IEEE Trans.Ultrason., Ferroelectr. Freq. Control, vol. 36, no. 2, pp. 3–9, Nov. (1989).
[9]R. J. McGough, “Rapid calculations of time-harmonic nearfield pressures produced by rectangular piston,” J. Acoust. Soc. Amer., vol. 115, no. 5,pp. 1934–1941, (2004).
[10] N.H. Ismail ,A. T. Ibrahim ''Temperature distribution in the human brain during ultrasound hyperthermia'' journal of electromagnetic waves and applicators,vol., 16,no.6 pp.803-811,(2002).
[11] Kraft M. Approach to the patient with respiratory disease. In: Goldman L, Schafer AI, eds.Goldman's Cecil Medicine.
[12] Kupeli E, Karnac D, Mehta AC. Flexible bronchoscopy. In: Mason RJ, Broaddus VC, Martin TR, et al., eds.Textbook of Respiratory Medicine.
[13] Reynolds HY. Respiratory structure and function: mechanisms and testing. In: Goldman L, Schafer AI, eds.Goldman’' Cecil Medicine.
[14] R. J. McGough, H. Wang, E. S. Ebbini, and C. A. Cain, “Mode scanning:Heating pattern synthesis with ultrasound phased arrays,” Int. J.Hyperthermia, vol. 10, no. 3, pp. 433–442, (1994).
[15] 31P. R. Stauffer, “Evolving technology for thermal therapy of cancer,” Int. J. Hyperthermia 21, 731C744 (2005).