Embed Size (px)
Citation preview

Beyond duration: Investigating the association between sleep parameters and the weight status of
children
Running head: Beyond duration: sleep parameters and weight status
Cassandra L. Pattinson1,2*, BPsySci, Simon S. Smith1,3, PhD, Sally L. Staton1,2, PhD, Stewart G. Trost1,
4, PhD, Karen J. Thorpe1,2, PhD
1Institute for Health and Biomedical Innovation, Centre for Children’s Health Research, Queensland
University of Technology, Victoria Park Rd, Kelvin Grove, Queensland, Australia, 4101.
2School of Psychology and Counselling, Queensland University of Technology, South Brisbane,
Queensland, Australia, 4059.
3Recover Injury Research Centre Faculty of Health and Behavioural Sciences, The University of
Queensland, Queensland, Australia
4School of Exercise and Nutrition Sciences, Centre for Children’s Health Research, Queensland
University of Technology, Queensland, Australia.
*Corresponding Author: Cassandra L. Pattinson, Centre for Children’s Health Research (CCHR),
Level 5, 62 Graham Street, South Brisbane, Queensland University of Technology, QLD, 4101,
Australia, Ph: +61 (07) 3069 7288, Fax: +61 (07) 3138 0486 Email: [email protected]
Manuscript word count: 4,981 words
Conflict of interests: The authors have no conflicts of interests to disclose
Author contributorship: Conceived and designed the study: SLS KJT SSS CLP SGT. Performed data
collection: CLP SLS. Supervised data collection: KJT. Analysed the data: CLP SSS KJT SLS. Wrote
the paper: CLP SSS KJT. Contributed to revision/editing of manuscript: SLS SGT

Beyond duration: sleep parameters and weight status2
Summary
This study examined the associations between sleep parameters and weight status in a large sample
of preschool aged (3 to 6 year old) children. Data from a sample of 1,111 children from the
Effective Early Educational Experiences for children (E4Kids) study were analysed. Cross-
sectional associations were examined and general linear modelling (GLM) conducted, with
adjustment for significant control variables, assessed the impact of night-sleep duration, total
sleep duration, napping frequency, sleep timing (onset, offset and midpoint), and severity of
sleep problems on standardised body mass index (BMI z-score). GLM was conducted for the
total sample and then, separately by gender. For the total sample, there was a significant
association between short sleep duration (≤10 hours) and increased BMI z-score. No other
sleep parameters were associated with BMI z-score in this sample. Analyses by gender
revealed that among girls, there were no associations between any sleep parameter and BMI
z-score. However, among boys short sleep duration and napping frequency were significantly
associated with weight status, even after adjustment for control variables. These results
indicate that the relationship between sleep and body mass is complex. Sleep duration
remains a significant independent predictor of body mass in young children. Furthermore, the
differential effect of napping frequency between genders is a significant parameter for further
investigation.
Key Words: Sleep, Body Mass Index, Preschool Children, Gender, Australia

Beyond duration: sleep parameters and weight status3
Beyond duration: Investigating the association between sleep parameters and the weight
status of children
Paediatric obesity is a significant public health concern with negative psychosocial and health
sequelae in childhood and across the life course (Dietz, 1998; Ebbeling et al., 2002). Globally, it is
estimated that 42 million children under the age of 5 are classified as overweight or obese
(Commission on Ending Childhood Obesity, 2014). In Australia, 23% of children aged between 2 and
4 years are classified as overweight or obese, with slight increases in prevalence observed through to
adolescence (Australian Bureau of Statistics, 2013). To date, intervention strategies have been
directed to the immediate problem of caloric intake and energy expenditure (e.g. Get Up & Grow
(AUS), Hip-Hop to Health (USA), MAGIC (UK) campaigns); however, the problem remains
significant. For this reason attention has turned to identifying other modifiable mechanisms
implicated in weight status. Sleep has emerged as a significant candidate for investigation.
Meta-analyses have identified an association between shortened sleep duration and increased risk of
obesity in children (Chen et al., 2008; Ruan et al., 2015). However, not all studies have found an
association between sleep duration and weight status in young children (e.g. Hiscock et al., 2011).
Furthermore, recent research suggests that alternative sleep parameters, including sleep midpoint and
timing of sleep onset or offset, potentially exert a greater influence on weight status than duration
alone (Anderson et al., 2016; Golley et al., 2013; Olds et al., 2011; Scharf and DeBoer, 2015; Thivel
et al., 2015). For example, Olds et al. (2011) report that children and adolescence classified as “late
bed - late rise” had decreased physical activity and increased weight status compared to those
classified as “early bed - early rise” despite these groups having similar sleep durations. Similarly, in
a study of “late” vs “normal” sleepers, later sleep midpoint was associated with higher weight status,
even though sleep duration did not differ (Thivel et al., 2015). In longitudinal analysis of younger
children (aged 4-5 years), both shorter night sleep duration and later sleep onset at age 4 was
associated with increased body mass between 4 and 5 years of age (Scharf and DeBoer, 2015). This

Beyond duration: sleep parameters and weight status4
may be indicative of early dysregulation of circadian timing, resulting in metabolic hormone
disruption (e.g. leptin and ghrelin) leading to increased body mass (Hart et al., 2013).
Considering the independent effect of a multiplicity of sleep parameters on the weight status of young
children may provide greater understanding of the mechanisms at play. Therefore, the aim of this
study was to investigate associations between multiple sleep parameters (daytime napping, night time
sleep duration, sleep timing and sleep problems) and weight status in a large sample of Australian
children aged 3 to 6 years (N=1,111). We hypothesized that sleep parameters indicative of poorer
sleep would be associated with increased body mass. Further, due to recent research indicating
significant gender differences associated with shortened sleep duration (Plancoulaine et al., 2015) and
subsequent increased BMI z-score (Tatone-Tokuda et al., 2012), we conducted exploratory analyses
stratified by gender.
Method
Participants
The children were participants in the Effective Early Educational Experiences for children (E4Kids), a
5-year Australian longitudinal study of the developmental impact of early childhood education and
care (ECEC) services. The sample and design of the study have been detailed elsewhere (Tayler et al.,
2016). Briefly, children and families were recruited in 2010 from childcare services across four
locations in two states: Queensland – Brisbane (metropolitan) and Mt Isa (remote), Victoria –
Melbourne (metropolitan) and Shepparton (rural). Stratified random sampling was used to capture the
range of licensed service types (Long Day Care, Kindergarten and Family Day Care) and ensure
representation of both high and low socioeconomic states (SES). Recruitment was focussed on
children aged between 3 and 5 years of age, with any child within identified ECEC rooms invited to
participate. Written informed consent was provided by main caregivers and children gave verbal
consent. Ethical approval was provided by both The University of Melbourne and Queensland
University of Technology Human Research Ethics Committees. A total of 2,488 children were

Beyond duration: sleep parameters and weight status5
recruited in 2010 from 140 services. These data are from the second year (2011) of the study, when
height and weight were collected for 1,945 children (78.2%). Parents of 1,288 children completed the
sleep items. Complete data were available for a total of 1,112 children.
Analyses were conducted to investigate if there were any significant differences between parents who
did and did not complete the main caregiver sleep items in 2011. Parents who did not complete the
items were significantly younger (M = 30.56 (.23)) than parents who completed (M = 32.20 (.14)) the
survey (t (1,129.56) = -6.11, p <.001). Furthermore, parents who completed the survey had
significantly higher relative advantage on SES (M = 1031.54 (2.1)) than parents who did not complete
(M = 1000.96 (2.16)) the survey (t (1281) = -10.13, p <.001). No other significant differences were
found between parents who completed or did not complete the study in 2011.
Weight Status
Height and weight were measured by trained fieldworkers to WHO standards (WHO Multicentre
Growth Reference Study Group, 2006) within the child’s ECEC service. Children were dressed in
light clothing and without shoes and were measured using calibrated stadiometers (SECA Leicester
Portable Height Measure) and floor scales (HD-316, Wedderburn Scales; Tanita Corporation, Tokyo,
Japan). Children were measured twice; if measurements differed (weight >0.1kg; height >0.5cm) a
third measurement was taken by the researcher with the mean of these measurements used to calculate
BMI. The WHO’s Anthro (version 3.2.2) and AnthroPlus (for children over 5.1 years) programs were
then used to transform raw anthropometric data into sex- and age-specific z scores. To ensure
comparability, weight status was reported using international cut-points (Cole et al., 2000; Cole and
Lobstein, 2012). Biologically implausible values (BIV) were identified using the WHO guidelines,
with one child identified and subsequently removed.
Sleep Parameters
The main caregiver reported their child’s typical night sleep; (1) “On a typical night, when does the
study child usually go to sleep?” – responses were indicated by a time between “before 5 pm” through
to “midnight or after midnight” presented in half hour increments, (2) “On a typical morning, when
Beyond duration: sleep parameters and weight status6
does the study child usually wake up?” - respondents indicated a time between “before 4am” through
to “after 10am” presented in half hour increments. The main caregiver also reported on their child’s
napping frequency and duration; (1) “Does the study child ever nap (sleep during the day)?” –
response category of yes/no, (2) “In a typical week, on how many days does the study child usually
nap?” – using an eight-item Likert scale response item from “only some weeks/less than 1 day per
week – 7 days per week”, (3) “On days when the study child naps, how long do they usually nap for?”
– responses was on a seven-point Likert scale from “0-15mins – more than 2hours”. Finally, the main
caregivers were also asked if their child “ever have problems with their sleep” and how severe they
thought these problems were: Mild / Moderate / Severe. Using the information collected the sleep
parameters were created as described in Table 1.
Control Variables
Child Factors
Child gender and date of birth were reported by the main caregiver. The main caregiver also
completed information about child temperament, using the Short Temperament Scale for Children
(Sanson et al., 1994). Inflexible (aka reactive) temperament was measured as temperament has been
shown to be associated with both increased weight status (Faith and Hittner, 2010) and decreased
sleep duration (Touchette et al., 2009) in young children. The question, “In the last 24 hours, how
often has your child had biscuits, doughnuts, cake, pie or chocolate?” was used to measure frequency
of discretionary food intake with dichotomous responses categories of “not at all” and “at least once”.
The main caregiver also provided information on the frequency of their child’s physical activity and
sedentary behaviour. A question from the home learning environment scale (Totsika and Sylva,
2004) was used as a proxy of physical activity (PA) frequency. This question asks parents to report the
days per week (0 – 7 days) that they participated in outdoor activities with their child like walking,
swimming or cycling. Furthermore, two questions from the social learning environment scale (Sylva
et al., 2004) in which parents reported the number of days per week (0 – 7 days) in which a child

Beyond duration: sleep parameters and weight status7
watches TV or movies either with an adult, or alone, were averaged to provide a measure of screen
time frequency.
Family and Environment Factors
The main caregiver provided information about their family’s demographic profile. This information
included the total family net income for the last 12 months. The main caregiver also indicated their
highest level of education currently completed. The main caregiver also reported the total years of
centre-based child care their child had received up until 2011. From the postcode of the family, SES
was determined using the index of relative socioeconomic advantage and disadvantage Socio-
Economic Indices for Areas (SEIFA) from the Australian Bureau of Statistics (ABS) 2006 Census
data (Australian Bureau of Statistics, 2008). The SEIFA includes measures of disadvantage (low
income, lack of post-school qualifications in people aged 15 years or older) and relative advantage
(e.g. tertiary education) of people residing in the area, with higher scores indicating greater advantage
with a corresponding lack of disadvantage. Parental control over child choices e.g. bed timing and
food eaten, was also measured. Six questions were summed (highest score = 30), with higher scores
indicative of greater parental control over activities.
Statistical Analyses
Analyses were conducted to examine the relationship between sleep parameters, child, family, and
environmental factors for 1,111 children. All statistical analyses were completed using the Statistical
Packages for Social Sciences (SPSS) version 23.0 software. The purposeful selection method (Bursac
et al., 2008; Hosmer et al., 2013) was used to determine the sleep parameters and control variables
which had a significant effect on BMI z-score. Correlation analysis identified the independent
variables (both explanatory and control) that were significantly associated with BMI z-score at the
selected p-value cut-off point of < .30. Then, an iterative process of variable selection was conducted.
Explanatory and control variables were entered into a General Linear Model (GLM) with BMI z-score
as the dependent variable. Variables were removed if they did not have a “significant effect” on the
model and were not a confounder. A significant effect was defined as having a p <.10 and not having

Beyond duration: sleep parameters and weight status8
a significant influence over any remaining variables within the model of greater than 15% (Bursac et
al., 2008; Hosmer et al., 2013). After the process of deleting and verifying the model, any variable
that had been excluded was then entered back into the model one at a time (Hosmer et al., 2013). Any
independent variables that had a significant effect were retained in the model. This process provided
the most parsimonious model with the significant independent and control variables retained and any
extraneous variables removed. From the final GLM analyses, any significant associations found
between BMI z-score and the sleep parameters were examined using post-hoc pairwise comparisons
using Sidak correction for multiple comparisons. Data were then stratified by gender and the models
analysed separately for boys (n = 576) and girls (n = 535), with the same process identified with each
sleep parameter and control variable examined for inclusion in the final GLM. Planned post-hoc
comparisons with Sidak corrections were utilised to examine any significant differences between
categorical sleep parameters and BMI z-score.
Results
Demographic information for the participating children and families are presented in Table 2.
Children were aged between 2.79 to 6.78 years and 1.9% of children were identified as being of
Aboriginal or Torres Strait Islander Origin. In this sample, 16.2% of the children were classified as
overweight or obese (Cole and Lobstein, 2012). Table 3 provides information about the measured
sleep parameters across the whole sample, and then by gender. Boys woke up slightly earlier (t
(1107.29) = -3.45, p = .001) and had shorter night-sleep durations (t (1109) = -2.94, p = .003) than
girls. Accordingly, boys typically had an earlier sleep midpoint time than girls in this sample (χ2 (1,
1111) = 6.14, p = .013).
The result of the correlational analysis examining the relationship between sleep parameters, control
variables, and BMI z-score are reported in Table S1. The only sleep parameter that was significantly
associated with BMI z-score was night sleep duration (r = -.07, p = .028). According to the
purposeful selection methodology (p < .30), napping frequency (r = .04, p = .154) was also included
in the second, iterative step of analyses. These analyses revealed that night sleep duration was the

Beyond duration: sleep parameters and weight status9
only sleep parameter significantly associated with BMI z-score to be included in the final model. The
significant control variables identified for inclusion in the final model were main caregiver education,
parent control, inflexible temperament, and SEIFA.
The overall model was significant F (6,1070) = 5.27, p <.001; partial ɳ2 = .029 (Table 4). An effect
size of .029 indicates a small effect of the model in accounting for change in BMI z-score (Cohen,
1988). Night sleep duration remained a significant independent predictor of BMI z-score, even after
controlling for SEIFA, inflexible temperament, parent control and main caregiver education. Post-hoc
pairwise comparisons using Sidak corrections indicated that there was a .22 mean unit increase in
BMI z-score for short sleepers (M = .77 ± .09) in comparison to normal sleepers (M = .55 ± .04).
Separate analyses of gender found that for girls, there were no significant correlations between any
sleep parameters and BMI z-score (see Table S2 for correlations). For boys (Table S3), sleep duration
and napping frequency were significantly associated with BMI z-score. Control variables identified to
interact with BMI z-score included; SEIFA, inflexible temperament, parent control, main caregiver
education, TV and PA frequency. The iterative process revealed that all variables made a significant
impact on the overall model. For example, although SEIFA and PA frequency were not associated
with BMI z-score, they did influence the other variables within the model, thus all variables were
included in the final model
The overall model was significant F (11,548) = 2.61, p = .003; partial ɳ2 = .050 (Table 4). After
adjusting for the covariates, night sleep duration and napping frequency remained significant
predictors of BMI z-score. Post-hoc pairwise comparisons with Sidak corrections indicated that, male
children classified as short sleepers had a .27 mean unit increase in BMI z-score compared to normal
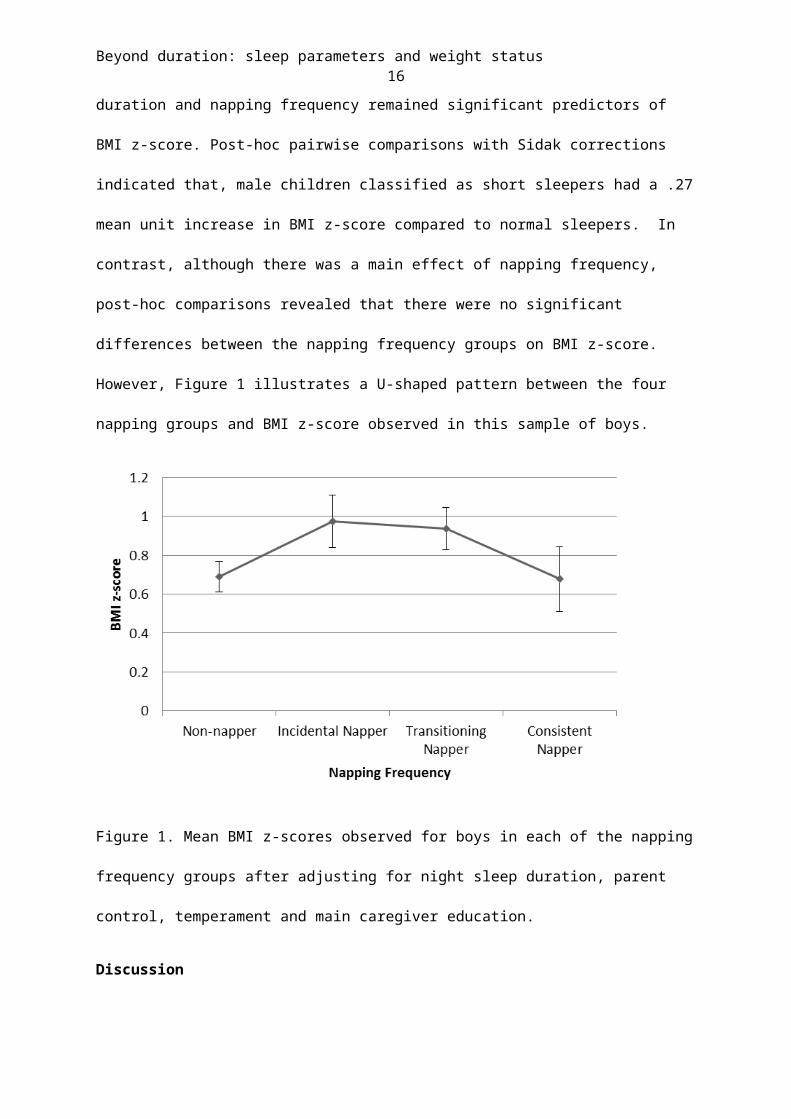
sleepers. In contrast, although there was a main effect of napping frequency, post-hoc comparisons
revealed that there were no significant differences between the napping frequency groups on BMI z-
score. However, Figure 1 illustrates a U-shaped pattern between the four napping groups and BMI z-
score observed in this sample of boys.
Beyond duration: sleep parameters and weight status10
Figure 1. Mean BMI z-scores observed for boys in each of the napping frequency groups after
adjusting for night sleep duration, parent control, temperament and main caregiver education.
Discussion
Poor sleep has been implicated in childhood weight gain, and has been suggested as a
potential modifiable mechanism to address unhealthy weight status. However, to date, large
scale studies examining the contribution of poor sleep to overweight and obesity have
primarily focussed on night-time sleep duration. This study aimed to advance knowledge
through investigation of the association of weight status with a broader range of sleep
parameters in a large sample of preschool aged children.
Consistent with previous research, our study identified a significant association between
shorter night-time sleep duration and increased BMI z-score (Scharf and DeBoer, 2015).
Children who slept fewer than 10 hours per night had an increase of 0.22 BMI z-score units
in comparison to children getting more than 10 hours of sleep per night. This finding lends
support to the recently updated international recommendations that preschool aged children

Beyond duration: sleep parameters and weight status11
achieve sleep durations of between 10 and 13 hours (Hirshkowitz et al., 2016). No other sleep
parameters were associated with weight status in this sample, including total sleep duration,
which is closely associated with night-sleep duration. The null finding may reflect an
interplay between night-sleep duration and napping, as evidenced in previous research (see
Thorpe et al., 2015).
Consistent with previous research, gender-specific differences of sleep parameters were
observed in the data (Chen et al., 2008; Tatone-Tokuda et al., 2012). After controlling for
significant confounding variables, night sleep duration and napping had independent effects
on BMI z-score for boys. In contrast, no sleep parameters were associated with BMI z-score
for girls. Some have hypothesised that such gender differences may be due to evolutionary
adaptive factors (Chen et al., 2008). Alternatively, gender-specific biological and/or social-
environmental differences may also play a role. In this study, boys had significantly shorter
night-sleep duration than did girls. Boys also had significantly earlier rise times than did girls.
These sleep patterns may reflect neurocognitive differences in maturation, e.g. gender-
specific differences in sleep architecture (Knutson, 2005). Alternatively, social-
environmental factors, such as differences in parental control and subsequent parenting
strategies between genders, may influence night sleep duration and other sleep parameters
(Plancoulaine et al., 2015; Tatone-Tokuda et al., 2012) with subsequent effects on weight
status.
The effect of napping and night sleep duration on BMI z-score across genders warrants
further investigation. All children in this study were recruited from licensed childcare
services, and previous research has shown that childcare sleep policies and practices can
affect both napping frequency (Staton et al., 2016), and night-time sleep duration, both

Beyond duration: sleep parameters and weight status12
concurrently and in the longer-term (Fukuda and Asaoka, 2004; Fukuda and Sakashita, 2002;
Staton et al., 2015). It may be that boys are particularly susceptible to these practices.
Even after accounting for significant control variables, the amount of variance explained in
our models, though statistically significant, was low. In the full sample, the model only
explained 3% of variance in total BMI z-score. This may indicate that sleep interacts with
weight status in indirect ways, and that more complex modelling of such interactions
informed by developmental physiology may be needed. Alternatively, this result may reflect
a genuinely modest contribution of sleep to overall weight status. the determinants of weight
status are complex, multifaceted and dynamic. Sleep parameters are one of a multiplicity of
factors contributing to weights status in our modern obesogenic environment. Further
research examining the associations between sleep duration, napping, and weight status in
young children is needed.
Strengths and Limitations
This study has a number of strengths. Firstly, it comprised a large population of children aged
between 3 and 6 years from a study which used stratified-random sampling to capture a wide
range of social and economic experiences of families using ECEC services in Australia.
Furthermore, BMI was directly measured by trained researchers using standardised
procedures, reducing the error that is associated with parent-report. One of the major
limitations of the study, however, is that sleep parameters were based on parent report.
Although parent-reported sleep duration is a commonly employed method in large-scale
studies and has been shown to be correlated with actigraphic recorded sleep duration (Iwasaki
et al., 2010), some research has indicated that parents can overestimate sleep duration by
more than one hour per night (Dayyat et al., 2011). Therefore, replication with objective

Beyond duration: sleep parameters and weight status13
measurement (such as actigraphy or polysomnography) may be necessary to improve
understanding of the relationships between sleep parameters and weight status.
Conclusion
In conclusion, shortened sleep duration was associated with increased BMI z-score in this
Australian preschool sample. The results indicated that children sleeping less than 10 hours
per night had higher BMI z, which lends support to the current international recommended
sleep guidelines for children in this age group. In boys, there was a significant independent
effect of both night-sleep duration and napping frequency on weight. It is recognised that
sleep is important in early childhood, and the potential for sleep to elicit better health
outcomes remains.

Beyond duration: sleep parameters and weight status14
References
Anderson, S.E., Andridge, R., Whitaker, R.C. Bedtime in Preschool-Aged Children and Risk for Adolescent Obesity. J. Pediatr., 2016, 176: 1–6.
Australian Bureau of Statistics 2033.0.55.001 - Census of Population and Housing: Socio-Economic Indexes for Areas (SEIFA), Austrlia - 2006. , Canberra, Australia , 2008.
Australian Bureau of Statistics 4364.0.55.003 - Australian Health Survey: Updated results, 2011-2012. , Canberra , 2013.
Bursac, Z., Gauss, C.H., Williams, D.K., Hosmer, D.W. Purposeful selection of variables in logistic regression. Source Code Biol. Med., 2008, 3: 1–8.
Chen, X., Beydoun, M.A., Wang, Y. Is Sleep Duration Associated With Childhood Obesity: A Systematic Review and Meta-analysis. Obesity, 2008, 16: 265–274.
Cohen, J. Statistical Power Analysis for the Behavioral Sciences. Lawrence Erlbaun Associates, Publishers, Hillsdale, New Jersey , 1988.
Cole, T.J., Bellizzi, M.C., Flegal, K.M., Dietz, W.H. Establishing a standard definition for child overweight and obesity worldwide: international survey. BMJ, 2000, 320: 1240.
Cole, T.J., Lobstein, T. Extended international (IOTF) body mass index cut-offs for thinness, overweight and obesity. Pediatr. Obes., 2012, 7: 284–294.
Commission on Ending Childhood Obesity Facts and figures on childhood obesity. , Geneva, Switzerland , 2014.
Dayyat, E.A., Spruyt, K., Molfese, D.L., Gozal, D. Sleep estimates in children: parental versus actigraphic assessments. Nat. Sci. Sleep, 2011, 3: 115–123.
Dietz, W.H. Health Consequences of Obesity in Youth: Childhood Predictors of Adult Disease. Pediatrics, 1998, 101: 518–525.
Ebbeling, C.B., Pawlak, D.B., Ludwig, D.S. Childhood obesity: public-health crisis, common sense cure. Lancet, 2002, 360: 473–482.
Faith, M.S., Hittner, J.B. Infant temperament and eating style predict change in standardized weight status and obesity risk at 6 years of age. Int J Obes, 2010, 34: 1515–1523.
Fukuda, K., Asaoka, S. Delayed bedtime of nursery school children, caused by the obligatory nap, lasts during the elementary school period. Sleep Biol. Rhythms, 2004, 2: 129–134.
Fukuda, K., Sakashita, Y. Sleeping pattern of kindergartners and nursery school children: Function of daytime nap. Percept. Mot. Skills, 2002, 94: 219–228.
Golley, R.K., Maher, C.A., Matricciani, L., Olds, T.S. Sleep duration or bedtime? Exploring the association between sleep timing behaviour, diet and BMI in children and adolescents. Int. J. Obes., 2013, 37: 546–551.

Beyond duration: sleep parameters and weight status15
Hart, C.N., Carskadon, M.A., Considine, R. V, Fava, J.L., Lawton, J., Raynor, H.A., Jelalian, E., Owens, J., Wing, R. Changes in Children’s Sleep Duration on Food Intake, Weight, and Leptin. Pediatrics, 2013, 132.:
Hirshkowitz, M., Whiton, K., Albert, S.M., Alessi, C., Bruni, O., DonCarlos, L., Hazen, N., Herman, J., Adams Hillard, P.J., Katz, E.S., Kheirandish-Gozal, L., Neubauer, D.N., O’Donnell, A.E., Ohayon, M., Peever, J., Rawding, R., Sachdeva, R.C., Setters, B., Vitiello, M. V, Ware, J.C. National Sleep Foundation’s updated sleep duration recommendations: final report. Sleep Heal. J. Natl. Sleep Found., 2016, 1: 233–243.
Hiscock, H., Scalzo, K., Canterford, L., Wake, M. Sleep duration and body mass index in 0–7-year olds. Arch. Dis. Child., 2011, 96: 735–739.
Hosmer, D.W., Lemeshow, S., Sturdivant, R.X. Applied Logistic Regression, Third Edition. Wiley Series in probability and statistics , 2013.
Iwasaki, M., Iwata, S., Iemura, A., Yamashita, N., Tomino, Y., Anme, T., Yamagata, Z., Iwata, O., Matsuishi, T. Utility of Subjective Sleep Assessment Tools for Healthy Preschool Children: A Comparative Study Between Sleep Logs, Questionnaires, and Actigraphy. J. Epidemiol., 2010, 20: 143–149.
Knutson, K.L. Sex Differences in the Association between Sleep and Body Mass Index in Adolescents. J. Pediatr., 2005, 147: 830–834.
Martin, S.K., Eastman, C.I. Sleep logs of young adults with self-selected sleep times predict the dim light melatonin onset. Chronobiol. Int., 2002, 19: 695–707.
Miller, A.L., Kaciroti, N., LeBourgeois, M.K., Chen, Y.P., Sturza, J., Lumeng, J.C. Sleep Timing Moderates the Concurrent Sleep Duration–Body Mass Index Association in Low-Income Preschool-Age Children. Acad. Pediatr., 2014, 14: 207–213.
Olds, T., Maher, C., Matricciani, L. Sleep duration or bedtime? Exploring the relationship between sleep habits and weight status and activity patterns. Sleep, 2011, 34: 1299–1307.
Plancoulaine, S., Lioret, S., Regnault, N., Heude, B., Charles, M.-A., Group, the E.M.C.S. Gender-specific factors associated with shorter sleep duration at age 3 years. J. Sleep Res., 2015, 24: 610–620.
Ruan, H., Xun, P., Cai, W., He, K., Tang, Q. Habitual Sleep Duration and Risk of Childhood Obesity: Systematic Review and Dose-response Meta-analysis of Prospective Cohort Studies. Sci. Rep., 2015, 5: 16160.
Sanson, A.V., Smart, D.F., Prior, M., Oberklaid, F., Pedlow, R. The Structure of Temperament from Age 3 to 7 years: Age, Sex and Sociodemographic Influences. Merrill. Palmer. Q., 1994, 40: 233–252.
Scharf, R.J., DeBoer, M.D. Sleep timing and longitudinal weight gain in 4- and 5-year-old children. Pediatr. Obes., 2015, 10: 141–148.
Staton, S.L., Smith, S.S., Hurst, C., Pattinson, C.L., Thorpe, K.J. Mandatory Nap Times and Group Napping Patterns in Child Care: An Observational Study. Behav. Sleep Med., 2016, 1–15.
Staton, S.L., Smith, S.S., Pattinson, C.L., Thorpe, K.J. Mandatory naptimes in child care and children’s nighttime sleep. J. Dev. Behav. Pediatr., 2015, 36: 235–242.
Beyond duration: sleep parameters and weight status16
Sylva, K., Melhuish, E., Sammons, P., Siraj-Blatchford, I., Taggart, B. The effective provision of pre-school education (EPPE) project : Final report: A longitudinal study funded by the DfES 1997-2004. Institute of Education, University of London/Department of Education and Skills/Sure Start , 2004.
Tatone-Tokuda, F., Dubois, L., Ramsay, T., Girard, M., Touchette, E., Petit, D., Montplaisir, J.Y. Sex differences in the association between sleep duration, diet and body mass index: a birth cohort study. J. Sleep Res., 2012, 21: 448–460.
Tayler, C., Cloney, D.S., Adams, R., Ishimine, K., Thorpe, K., Nguyen, T.K.C. Assessing the effectiveness of Australian early childhood education and care experiences: study protocol. BMC Public Health, 2016, 16: 352.
Thivel, D., Isacco, L., Aucouturier, J., Pereira, B., Lazaar, N., Ratel, S., Doré, E., Duché, P. Bedtime and Sleep Timing but not Sleep Duration Are Associated With Eating Habits in Primary School Children. J. Dev. Behav. Pediatr. JDBP, 2015, 36: 158–65.
Thorpe, K., Staton, S., Sawyer, E., Pattinson, C., Haden, C., Smith, S. Napping, development and health from 0 to 5 years: A systematic review. Arch. Dis. Child., 2015, 100: 615–622.
Totsika, V., Sylva, K. The Home Observation for Measurement of the Environment Revisited. Child Adolesc. Ment. Health, 2004, 9: 25–35.
Touchette, É., Petit, D., Tremblay, R.E., Montplaisir, J.Y. Risk factors and consequences of early childhood dyssomnias: New perspectives. Sleep Med. Rev., 2009, 13: 355–361.
WHO Multicentre Growth Reference Study Group WHO Child Growth Standards based on length/height, weight and age. Acta Paediatr. Suppl., 2006, 450: 76–85.

Beyond duration: sleep parameters and weight status17
Table 1. Definition of the sleep parameters assessed in this study.
Sleep Parameter Description Variable Type
Sleep onset Typical time that sleep commences. Continuous
Sleep offset Typical time that sleep ends. Continuous
Night-sleep
duration
Calculated using the duration of time between typical sleep
onset and offset. Night-time sleep duration was then
categorised into long (>10 hours) and short sleepers (≤10
hours) consistent with previous research and also with the
National Sleep Foundations recommended 10 hours of sleep
for children in preschool age range (Hirshkowitz et al., 2016).
Categorical
(2 levels)
Total-sleep
duration
Calculated by summing napping duration per week with night
time sleep duration. Nap duration per week (Miller et al.,
2014) is calculated by multiplying nap duration by days
napped per week which is then divided by 7 days.
Continuous
Sleep midpoint Calculated as a proxy for circadian timing (Martin and
Eastman, 2002) using the midpoint of the time between sleep
onset and offset, then transformed using a median split into
late sleep midpoint (>1:15am) and early sleep midpoint
(≤1:15am), this is consistent with previous research (Thivel
et al., 2015).
Categorical
(2 levels)
Napping
frequency
As a significant number (848; 76.7%) of children who had
ceased napping, the distribution of napping duration per week
was extremely skewed. Therefore, children were classified
into four napping frequency groups: Non-nappers; Incidental
Nappers (<1 per week); Transitioning nappers (1 – 3 days per
week); Consistent Nappers (4 – 7 days per week).
Categorical
(4 levels)
Sleep problems The responses on the 2 sleep problem questions were
dichotomised into: “no problem/mild’ versus
“moderate/severe”.
Categorical
(2 levels)

Beyond duration: sleep parameters and weight status18
Table 2. Demographic Information of the 2011 E4Kids Sample included in the final analysis.
Characteristic Descriptive Sample Size (n)
Child age in years, Mean (SD) 4.86 (0.63) 1111
Child gender (% Boys) 51.8 576
Child ever breastfed? (% Yes) 91.9 1024
Child is Aboriginal and/or Torres Strait Islander origin (%) 1.9 1100
Child diagnosed as having intellectual disability or
development delay6.2 1110
Child BMI z-score, Mean (SD) 0.55 (.96) 1111
Child weight status (IOTF):
Non-overweight 83.8 931
Overweight 12.7 141
Obese 3.5 39
Family Characteristics
Gender of Main Caregiver completing the survey in 2011 (%
Female)92.7 1106
Main Caregiver born in Australia (%) 80.4 1102
SEIFA (relative advantage and disadvantage), Mean (SD) 1036.15 (73.58) 1095
Main Caregiver Education 1100
High school or did not complete high school (%) 17.5 193
Technical certificate or diploma (%) 26.4 290
University bachelors or postgraduate degree (%) 56.1 617

Beyond duration: sleep parameters and weight status19
Table 3. Information about the measured sleep parameters.
Whole
Sample Boys Girls Diffa
Sleep Parameter M (SD) M (SD) M (SD) t
Sleep Onset 19:47 (00:37) 19:47 (00:36) 19:48 (00:37) -0.54
Sleep Offset 6:48 (00:37) 6:44 (00:39) 6:52 (00:35) -3.45**
Night sleep duration (Hrs) 11.00 (.62) 10.96 (.63) 11.07 (.60) -2.94*
Total sleep duration (Hrs) 11.13 (.63) 11.10 (.64) 11.17 (.62) -1.94
% % χ2
Sleep Midpoint ≤1:15am 59.9 63.4 56.1 6.14*
Sleep problems
(moderate/severe) 3.9 3.6
4.1 0.16
Napping Frequency 1.02
Non-napper 65.2 64.1 66.3
Incidental 11.7 11.5 11.9
Transitioning 17.3 18.1 16.4
Consistent 5.9 6.3 5.5
aDiff refers to the difference between boys and girls on each of the sleep parameters using
independent-samples t-tests (t) and chi-square (χ2) analyses were appropriate.
*p <.05**p = .001

Beyond duration: sleep parameters and weight status20
Table 4. General Linear Model of Night Sleep Durations effect on BMI when controlling for
significant confounding variables
Variable β 95% CI ɳ2p p
Whole Sample (N = 1077)
Night Sleep Duration .222 .034 - .409 .005 .020
Main caregiver education .004 .094
School or did not finish schoola .047 -.116 - .209 .000 .572
Tertiary Study (i.e. Diploma)a .155 .015 - .296 .004 .030
Parent control .035 .014 - .056 .010 .001
Inflexible -.088 -.149 - .028 .008 .004
SEIFA -.001 -.001 - .000 .002 .122
Boys (N = 560)
Night Sleep Duration .268 .007 - .529 .007 .044
Napping Frequency .015 .045
Non napperb .011 -.344 - .366 .000 .950
Incidental napperb .297 -.119 - .712 .004 .162
Transitioning napperb .259 -.125 - .643 .003 .186
Main caregiver education .006 .187
School or did not finish school a .146 -.089 - .382 .003 .223
Tertiary Study (i.e. Diploma) a .173 -.028 - .374 .005 .091
Parent Control .036 .005 - .067 .009 .023
Inflexible -.061 -.147 - .026 .003 .169
SEIFA -.001 -.002 - .001 .001 .379
Screen time frequency -.041 -.094 - .012 .004 .126
PA frequency -.016 -.058 - .027 .001 .471
a The referent group for main caregiver education is parents with bachelors/postgraduate degree.
bThe referent group for napping are consistent nappers

Beyond duration: sleep parameters and weight status21
Acknowledgments: The sampling derives from an Australian longitudinal study of ECEC
effectiveness, Effective Early Educational Experiences for Children (E4Kids). E4Kids is a project of
the Melbourne Graduate School of Education at The University of Melbourne and is conducted in
partnership with the Queensland University of Technology. E4Kids is funded by the Australian
Research Council Linkage Projects Scheme (LP0990200), the Victorian Government Department of
Education and Early Childhood Development, and the Queensland Government Department of
Education and Training. E4Kids is conducted in academic collaboration with the University of
Toronto Scarborough, the Institute of Education at the University of London and the Royal Children’s
Hospital in Melbourne. The E4Kids team would like to sincerely thank the ECEC services, directors,
teachers/staff, children and their families for their participation in this study.

Beyond duration: sleep parameters and weight status22
Supplementary Material

Table S1. Correlations between BMI z-score, sleep parameters and control variables (N = 1,111)Variables 1 2 3 4 5 6 7 8 9 10 11 12 13 14 15 16
1 BMI z-score
2 Sleep midpoint .009
3 Sleep onset .019 .702**
4 Sleep offset -.010 .666** .503**
5 Sleep duration -.066* .001 -.296** .351**
6 Total sleep duration -.011 .000 -.389** .493** .547**
7 Napping frequency .043 .029 .137** -.086** -.195** .157**
8 Sleep problems .030 .045 .131** .007 -.085** -.122** -.017
Child Factors
9 Inflexible temperament -.084** -.084** -.130** -.024 .053 .083** -.051 -.113**
10 Discretionary food intake -.034 -.007 .022 -.038 -.051 -.075* -.006 -.025 -.025
11 Screen Time Frequency .001 .109** .132** -.002 -.112** -.103** .085** .025 -.083** .121**
12 PA Frequency -.012 -.071* -.067* -.006 .022 .063* .010 -.018 .106** .008 .036
Family and Environment Factors13 Years centre based care .033 .000 .069* -.042 -.067* -.057 .105** -.022 -.012 -.022 .032 -.022
14 SEIFA -.065* -.122** -.116** -.085** .053 .021 -.016 -.058 -.025 .041 -.055 .060* .132**
15 Main caregiver education -.058 -.054 -.055 -.040 .049 .020 .037 -.055 .031 .079** -.036 .086** .146** .321**
16 Family net income -.042 -.086** -.089** -.131** -.008 -.035 .039 -.050 .014 .002 -.055 .034 .150** .429** .305**
17 Parent Control .087** -.096** -.149** -.039 .099** .101** -.017 .004 .069* .006 -.119** -.049 -.022 .020 .016 .028
* Correlation is significant at the p < 0.05 level ** Correlation is significant at the p < 0.01 level
Table S2. Correlations between BMI z-score, sleep parameters and control variables for girls (N = 535)

Beyond duration: sleep parameters and weight status 24
Variables 1 2 3 4 5 6 7 8 9 10 11 12 13 14 15 16
1 BMI z-score
2 Sleep midpoint .027
3 Sleep onset .035 .697**
4 Sleep offset .041 .665** .507**
5 Sleep duration -.023 -.105* -.381** .225**
6 Total sleep duration .018 -.039 -.436** .460** .547**
7 Napping frequency -.011 .033 .100* -.039 -.088* .203**

Beyond duration: sleep parameters and weight status 25
8 Sleep problems .040 .082 .237** .093* -.109* -.156** .006
Child Factors
9 Inflexible temperament -.080 -.125** -.199** -.062 .073 .114** -.050 -.138**
10 Discretionary food intake -.090* .008 .016 .002 -.014 -.036 -.043 -.029 .023
11 Frequency of TV watching .044 .128** .134** -.002 -.098* -.130** .054 .054 -.083 .104*
12 Frequency of physical activity .029 .011 -.036 .078 .091* .103* -.019 -.054 .122** -.012 .037
Family and Environment Factors
13 Years centre based care .040 -.034 .077 -.033 -.017 -.062 .097* -.007 .042 -.012 .062 .002
14 SEIFA -.087* -.114** -.145** -.089* .089* .050 -.021 -.077 -.088* .103* -.071 .025 .117**
15 Main caregiver education -.032 -.063 -.060 -.065 .058 .022 .056 -.051 -.022 .066 -.046 .047 .175** .339**
16 Family net income -.099* -.056 -.086 -.119** .011 -.010 .056 -.050 -.009 .016 -.017 -.062 .154** .404** .289**
17 Parent Control .072 -.063 -.088* .019 .124** .090* -.024 .009 .089* -.030 -.140** -.050 .018 -.027 .016 .008
* Correlation is significant at the p < 0.05 level ** Correlation is significant at the p < 0.01 level

Beyond duration: sleep parameters and weight status 26
Table S3. Correlations between BMI z-score, sleep parameters and control variables for boys (N = 576)Variables 1 2 3 4 5 6 7 8 9 10 11 12 13 14 15 16
1 BMI z-score
2 Sleep midpoint .004
3 Sleep onset .007 .709**
4 Sleep offset -.035 .665** .504**
5 Sleep duration -.088* .077 -.233** .432**
6 Total sleep duration -.026 .028 -.348** .516** .548**
7 Napping frequency .083* .030 .172** -.119** -.274** .120**
8 Sleep problems .024 .006 .023 -.072 -.068 -.092* -.038
Child Factors
9 Inflexible temperament -.076 -.058 -.072 -.008 .031 .050 -.049 -.092*
10 Discretionary food intake .016 -.023 .028 -.073 -.082* -.112** .028 -.022 -.067
11 Frequency of TV watching -.047 .102* .134** .013 -.117** -.071 .110** -.003 -.074 .139**
12 Frequency of physical activity -.053 -.145** -.095* -.069 -.029 .031 .035 .018 .097* .027 .030
Family and Environment Factors
13 Years centre based care .021 .037 .062 -.044 -.100* -.048 .110** -.036 -.055 -.030 -.002 -.048
14 SEIFA -.056 -.123** -.087* -.072 .033 .002 -.015 -.038 .038 -.014 -.050 .088* .143**
15 Main caregiver education -.082 -.046 -.050 -.020 .043 .019 .019 -.060 .079 .092* -.028 .123** .120** .304**
16 Family net income .005 -.114** -.091* -.141** -.022 -.056 .023 -.048 .038 -.011 -.093* .126** .147** .454** .322**
17 Parent Control .087* -.116** -.208** -.071 .093* .124** -.015 .002 .065 .042 -.113** -.054 -.068 .054 .016 .044
* Correlation is significant at the p < 0.05 level ** Correlation is significant at the p < 0.01 level