Embed Size (px)
Citation preview
Content Area Mathematics Grade Level 7th Grade
Course Name/Course Code
Standard Grade Level Expectations (GLE) GLE Code
1. Number Sense, Properties, and 1. Proportional reasoning involves comparisons and multiplicative relationships among ratios MA10-GR.7-S.1-GLE.1
Colorado’s District
Sample
Curriculum Project
Colorado Teacher-Authored Instructional Unit Sample
Unit Title: R U Proportional?Mathematics
7th Grade
INSTRUCTIONAL UNIT AUTHORS
Ellicott School DistrictMarci BraithwaiteAnja CentennialDiane GardunoNatasha KneceBetty SimmonsDonte Stewart
Lake County School DistrictKarl RemsenJeff Spencer
BASED ON A CURRICULUM OVERVIEW SAMPLE AUTHORED BY
Aspen School DistrictSarah Beesley
Byers School DistrictTerrell Price
Montrose County School DistrictTeresa Brown
This unit was authored by a team of Colorado educators. The template provided one example of unit design that enabled teacher-authors to organize possible learning experiences, resources, differentiation, and assessments. The unit is intended to support teachers, schools, and districts as they make their own local decisions around the best instructional plans and practices for all students.DATE POSTED: DECEMBER 31, 2015

Colorado Teacher-Authored Sample Instructional Unit
Operations 2. Formulate, represent, and use algorithms with rational numbers flexibly, accurately, and efficiently MA10-GR.7-S.1-GLE.2
3. Patterns, Functions, and Algebraic Structures
1. Properties of arithmetic can be used to generate equivalent expressions MA10-GR.7-S.2-GLE.1
2. Equations and expressions model quantitative relationships and phenomena MA10-GR.7-S.2-GLE.2
5. Data Analysis, Statistics, and Probability
1. Statistics can be used to gain information about populations by examining samples MA10-GR.7-S.3-GLE.1
2. Mathematical models are used to determine probability MA10-GR.7-S.3-GLE.2
7. Shape, Dimension, and Geometric Relationships
1. Modeling geometric figures and relationships leads to informal spatial reasoning and proof MA10-GR.7-S.4-GLE.1
2. Linear measure, angle measure, area, and volume are fundamentally different and require different units of measure
MA10-GR.7-S.4-GLE.2
Colorado 21st Century Skills
Critical Thinking and Reasoning: Thinking Deeply, Thinking Differently
Information Literacy: Untangling the Web
Collaboration: Working Together, Learning Together
Self-Direction: Own Your Learning
Invention: Creating Solutions
Mathematical Practices:
1. Make sense of problems and persevere in solving them.2. Reason abstractly and quantitatively.3. Construct viable arguments and critique the reasoning of others.4. Model with mathematics.5. Use appropriate tools strategically.6. Attend to precision.7. Look for and make use of structure.8. Look for and express regularity in repeated reasoning.
Unit Titles Length of Unit/Contact Hours Unit Number/Sequence
R U Proportional? 5 weeks 3
7th Grade, Mathematics Unit Title: R U Proportional? Page 2 of 17
Invention

Colorado Teacher-Authored Sample Instructional Unit
Unit Title R U Proportional? Length of Unit 5 weeks
Focusing Lens(es) RelationshipsInterpret
Standards and Grade Level Expectations Addressed in this Unit
MA10-GR.7-S.1-GLE.1
Inquiry Questions (Engaging- Debatable):
A store is having a 25% off sale and if you have a coupon you can take an additional 25% off, Does that make the item half off? (MA10-GR.7-S.1-GLE.1-EO.d)*
Unit Strands Ratios and Proportional Relationships, Geometry, Personal Financial Literacy
Concepts Constant of proportionality, unit rate, ratio, proportional relationships, ratio tables, coordinate graphs, proportional context, rate of increase, equations
GeneralizationsMy students will Understand that…
Guiding QuestionsFactual Conceptual
The constant of proportionality (unit rate) describes the ratio between two quantities in a particular context. (MA10-GR.7-S.1-GLE.1-EO.c.ii)
What is a proportion?How is the constant of proportionality calculated? What are the different ways the constant of
proportionality is represented?
Why is it important to keep track of the order of proportionality when analyzing relationships?
Why can the constant of proportionality be expressed in two ways?
Why is the unit ratio equivalent to the constant of proportionality?
Mathematicians verify proportional relationships by examining ratio tables and coordinate graphs. (MA10-GR.7-S.1-GLE.1-EO.c.i, c.ii)
How can you determine if two ratios are in a proportional relationship by using a ratio table?
How is the constant of proportionality visible in the graph of a proportional relationship?
Why can you determine from only two points and origin whether something is a proportional relationship?
Any point (x,y) on the graph y=kx satisfies a proportional relationship with the constant of proportionality k. (MA10-GR.7-S.1-GLE.1-EO.c.iii)
How can you represent proportional relationships by equations?
Why is k the constant of proportionality in the equation y=kx?
Mathematicians interpret the points (x,y), (0,0) and (1,r) in relation to a proportional context, where r is the unit rate. (MA10-GR.7-S.1-GLE.1-EO.c.iv)
How can you tell if an equation for a proportional relation will be above or below the line y=x when graphed?
Why is the point (1, r) a point on the equation y = xr and how does that relate to r being the unit rate?
7th Grade, Mathematics Unit Title: R U Proportional? Page 3 of 17

Colorado Teacher-Authored Sample Instructional Unit
The constant of proportionality determines the rate of increase (or decrease) of proportional relationships. (MA10-GR.7-S.1-GLE.1-EO.c)
How can you use a graph to directly comparing multiple constants of proportionality?
How do the graphs of y = x compare to the graphs of y= 2x, y = 3x, y=(1/2)x and y = (1/3)x?
When describing the relationship among the orientation of a line, unit rate, and the labels of quantities for the x- and y-axes, Why is important to be careful to specify the units of each before stating a generalization about the proportional relationship?
Key Knowledge and Skills:My students will…
What students will know and be able to do are so closely linked in the concept-based discipline of mathematics. Therefore, in the mathematics samples what students should know and do are combined.
Compute unit rates associated with ratios of fractions, including ratios of lengths, areas and other quantities measured in like or different units. (MA10-GR.7-S.1-GLE.1-EO.a) Decide whether two quantities are in a proportional relationship, including by testing for equivalent ratios in a table or graphing on a coordinate plane and observing whether
the graph is a straight line through the origin. (MA10-GR.7-S.1-GLE.1-EO.c.i) Identify the constant of proportionality (unit rate) in tables, graphs, equations, diagrams, and verbal descriptions of proportional relationships. (MA10-GR.7-S.1-GLE.1-EO.c.ii) Represent proportional relationships by equations. (MA10-GR.7-S.1-GLE.1-EO.c.iii) Explain what a point (x, y) on the graph of a proportional relationship means in terms of the situation, with special attention to the points (0, 0) and (1, r) where r is the unit
rate. (MA10-GR.7-S.1-GLE.1-EO.c.iv) Use proportional relationships to solve multistep ratio and percent problems. (MA10-GR.7-S.1-GLE.1-EO.d) Estimate and compute unit cost of consumable (to include unit conversations if necessary) sold in quantity to make purchase decisions based on cost and practicality. (MA10-
GR.7-S.1-GLE.1-EO.d.i) * Solve problems involving percent of a number, discounts, taxes, simple interest, percent increase, and percent decrease. (MA10-GR.7-S.1-GLE.1-EO.d.ii) *
Critical Language: includes the Academic and Technical vocabulary, semantics, and discourse which are particular to and necessary for accessing a given discipline.EXAMPLE: A student in Language Arts can demonstrate the ability to apply and comprehend critical language through the following statement: “Mark Twain exposes the hypocrisy of slavery through the use of satire.”
A student in ______________ can demonstrate the ability to apply and comprehend critical language through the following statement(s):
The constant of proportional can be represented in an equation of the form y= kx where k is the constant of proportionality, on a graph where the constant of proportionality is represented in the steepness of the line, and in a ratio table as unit rates.
Academic Vocabulary: Compute, identify, represent, explain, estimate, solve, unit cost, practicality, discount, taxes, percent increase, percent decrease, simple interest, consumables, tables, percent
Technical Vocabulary: Constant of proportionality, unit rate, ratio, proportional relationships, ratio tables, coordinate graphs, proportional context, rate of increaseproportion, equations,
*Denotes a connection to Personal Financial Literacy (PFL)
Unit Description: Through participation in this unit, students will be able to develop a stronger understanding of personal financial literacy by applying ratios and
7th Grade, Mathematics Unit Title: R U Proportional? Page 4 of 17

Colorado Teacher-Authored Sample Instructional Unitpercents to real-world situations. Learning experiences will include practice with calculations involving tax, tips, miles per gallon, rate of pay and simple interest. Concepts include proportional and non-proportional relationships, unit rate and unit cost, slope and the connection between y=kx and graphs of proportional relationships.
Unit Generalizations
Key Generalization: The constant of proportionality (unit rate) describes the ratio between two quantities in a particular context.
Supporting Generalizations:
Any point (x,y) on the graph y=kx satisfies a proportional relationship with the constant of proportionality k.
Mathematicians verify proportional relationships by examining ratio tables and coordinate graphs
Mathematicians interpret the points (x,y), (0,0) and (1,r) in relation to a proportional context, where r is the unit rate.
The constant of proportionality determines the rate of increase (or decrease) of proportional relationships.
Performance Assessment: The capstone/summative assessment for this unit.Claims: (Key generalization(s) to be mastered and demonstrated through the capstone assessment.)
The constant of proportionality (unit rate) describes the ratio between two quantities in a particular context.
Stimulus Material:(Engaging scenario that includes role, audience, goal/outcome and explicitly connects the key generalization)
You are an entrepreneur and the school district is asking for proposals to run their concession stand at school events. Your seventh grade class would like to raise money each year for a class trip, so you decide to submit a proposal. The proposal will need to include a detailed business plan that includes:
scale drawing for the design of the concession stand wholesale unit prices for each item you intend to sell additional expenses (e.g., big box membership, mileage to big box store) proposed markup percentage rate of pay for employees projected profit per school event
Product/Evidence:(Expected product from students)
Students will need to create a detailed business plan that includes each of the aspects outlined in the stimulus material. Students should describe any assumptions they make (e.g., we will use our parents big box membership), clearly show all calculations, and justify any conclusions (e.g., students will need to volunteer for the concession stand to be profitable).
Differentiation:(Multiple modes for student expression)
http://blog.foodservicewarehouse.com/start-concession-business/ (description of how to create a business plan for concessions)Students can explore which types of events are most profitable (e.g., basketball games, choir concerts). Students can interview a concession stand owner to learn about expenses and income and write an article about what they learn.
Texts for independent reading or for class read aloud to support the content
7th Grade, Mathematics Unit Title: R U Proportional? Page 5 of 17

Colorado Teacher-Authored Sample Instructional UnitInformational/Non-Fiction Fiction
Holes by Louis SacharKing Archimedes and his crown (golden crown)
Ongoing Discipline-Specific Learning Experiences1. Description: Think/work like a mathematician –
Expressing mathematical reasoning by constructing viable arguments, critiquing the reasoning of others
[Mathematical Practice 3]
Teacher Resources:
http://schools.nyc.gov/Academics/CommonCoreLibrary/TasksUnitsStudentWork/default.htm (lesson plans contains exemplars that could be replicated for students to critique the reasoning of others)
http://map.mathshell.org/materials/index.php (samples and examples of student work to critique the validity of others)
www.exemplars.com/resources/rubrics/assessment-rubrics (standards-based math rubric for the students to assess other’s work)
Student Resources:
N/A
Skills: Construct and communicate a complete and concise response, justify a conclusion using correct vocabulary, interpret and critique the validity of other’s conclusions and reasoning, and identify errors and present correct solutions
Assessment: Students analyze and defend their solutions for each major learning experience. Careful attention should be paid to precise use of vocabulary and symbols. Periodically throughout the unit, students can also be provided with flawed solutions and asked to identify, describe, and correct the flaw.
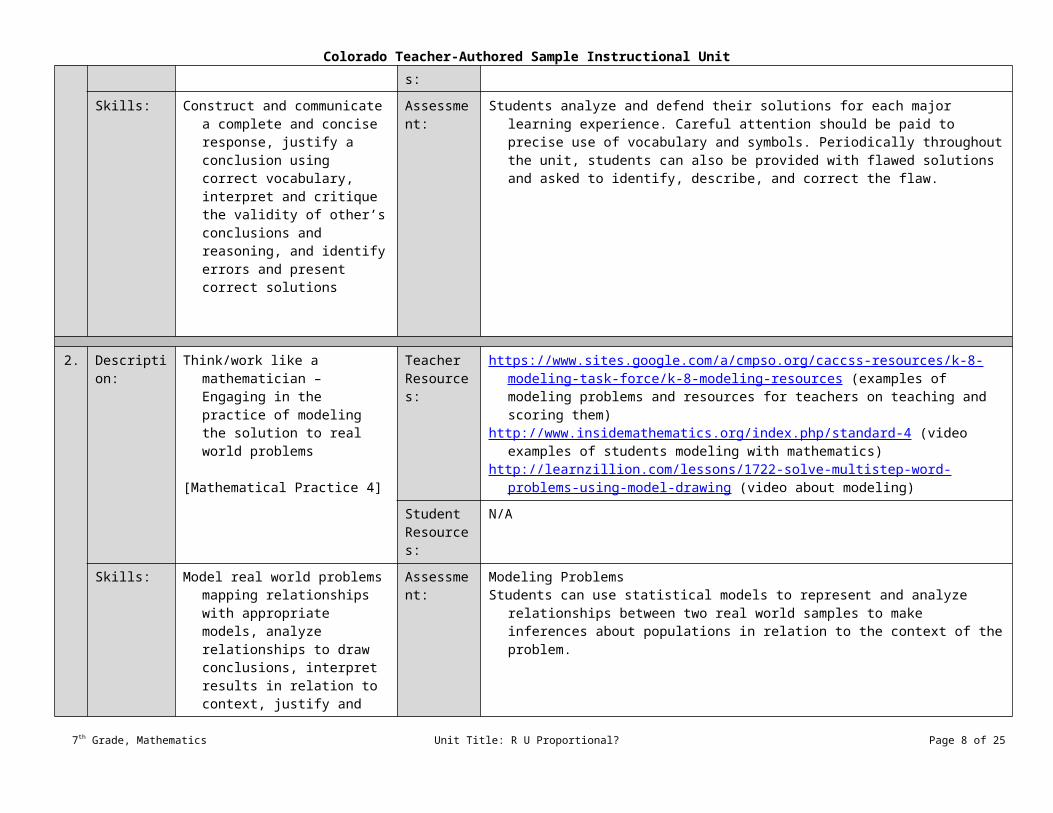
2. Description: Think/work like a mathematician – Engaging in the practice of modeling the solution to real world problems
[Mathematical Practice 4]
Teacher Resources:
https://www.sites.google.com/a/cmpso.org/caccss-resources/k-8-modeling-task-force/k-8-modeling-resources (examples of modeling problems and resources for teachers on teaching and scoring them)
http://www.insidemathematics.org/index.php/standard-4 (video examples of students modeling with mathematics)
http://learnzillion.com/lessons/1722-solve-multistep-word-problems-using-model-drawing (video about modeling)
Student Resources:
N/A
Skills: Model real world problems mapping relationships with appropriate models, analyze relationships to
Assessment: Modeling Problems Students can use statistical models to represent and analyze relationships between two real
world samples to make inferences about populations in relation to the context of the
7th Grade, Mathematics Unit Title: R U Proportional? Page 6 of 17

Colorado Teacher-Authored Sample Instructional Unitdraw conclusions, interpret results in relation to context, justify and defend the model, and reflect on whether results make sense
problem.
3. Description: Mathematicians fluently add, subtract, multiply, and divide rational numbers
Teacher Resources:
N/A
Student Resources:
http://www.mangahigh.com/en_us/games (math games for building fluency with rational numbers)
http://coolmath-games.com/ (math games for building fluency with rational numbers)http://hotmath.com/games.html(math games for building fluency with rational numbers)
Skills: Add, subtract, multiply and divide rational numbers, the culmination of fluency skills extended to negative numbers
Assessment: Fluency ProblemsStudents can build fluency through consistent practice with all four operations on rational
numbers.
Prior Knowledge and ExperiencesStudent familiarity with the adding, subtracting, multiplying and dividing rational numbers will support then in this unit but these skills will be extended and reinforced throughout this unit. It is also helpful if students have some degree of comfort with graphing on a coordinate grid, finding equivalent ratios and understanding a ratio as a comparison of two values.
Learning Experience # 1
The teacher may provide a list of items that need to be purchased and advertisements from a variety of stores so that students can determine the cheapest purchase price per unit for each item by calculating the unit costs.
Enactive: Students can be provided a comparison of a product that comes in two different sizes for different prices by using play money and manipulatives to determine the price per item/ounce.
Iconic: Students can draw a picture of how they determined the price per item/ounce of an item.Symbolic: Students can use a ratio table to calculate a variety of costs depending on the amount purchased including the unit costs for each of the items.
Teacher Notes: The teacher may want to show students how their enactive and iconic strategies can be shown in a ratio table to prepare them for the symbolic part of the learning experience. For example, students may find the price per apple of a bag of 24 apples for $16 by calculating the price for 12 apples, then 6, 3, and finally 1 apple by breaking apart the $16. The teacher can show these equivalent ratios to students in a ratio table. A misconception the students may exhibit when calculating unit cost is to calculate the amount of an item per dollar instead of the price per item. This can lead to a great conversation about how this is still a unit rate but not the unit cost.
7th Grade, Mathematics Unit Title: R U Proportional? Page 7 of 17
Colorado Teacher-Authored Sample Instructional UnitGeneralization Connection(s): The constant of proportionality (unit rate) describes the ratio between two quantities in a particular context.
Mathematicians verify proportional relationships by examining ratio tables and coordinate graphs.
Teacher Resources: http://schools.nyc.gov/NR/rdonlyres/41C0F04C-0BD6-491F-9BF0-16485EC080BE/0/NYCDOEG7MathProportionalReasoning_Final.pdf (proportional reasoning tasks focused on unit rates)
http://www.internet4classrooms.com/common_core/compute_unit_rates_associated_ratios_fractions_ratios_proportional_relationships_seventh_7th_grade_math_mathematics.htm (practice computing unit rates)
https://aos98.files.wordpress.com/2013/12/grade-7-unit-2.pdf (lesson plan with example problems for unit rate)http://www.eduplace.com/math/mathsteps/6/e/6.rates.ideas.html (possible questions to develop the idea of unit rates with
students)
Student Resources: http://www.khanacademy.org/math/cc-sixth-grade-math/cc-6th-ratios-prop-topic/cc-6th-rates/v/finding-unit-rates (video and practice problems on unit rates)
https://learnzillion.com/lessons/868-find-the-best-deal-by-comparing-unit-rates (reinforcement video about unit rate)
Assessment: Students mastering the concept and skills of this lesson should be able to answer questions such as:Given a quantity and cost, what is the unit rate for a product?Why is finding a unit rate important?When would you want to calculate the unit rate?What is special about a unit rate versus a ratio?
Differentiation:(Multiple means for students to access content and multiple modes for student to express understanding.)
Access (Resources and/or Process) Expression (Products and/or Performance)
http://www.mathinterventions.org/files/uploads/Unit_Rates-1.pdf (partially completed ratio tables for finding unit rates)
Students can calculate unit rates for items in partially completed ratio tables.
Extensions for depth and complexity: Access (Resources and/or Process) Expression (Products and/or Performance)
http://www.yummymath.com/tag/unit-rate/ (lessons related to unit rates)
Students can explore other uses of unit rates and create a visual of how unit rates are used in a variety of ways.
Key Knowledge and Skills: Compute unit rates associated with ratios of fractions, including ratios of lengths, areas and other quantities measured in like or different units.
Estimate and compute unit cost of consumable (to include unit conversions if necessary) sold in quantity to make purchase decisions based on cost and practicality.
Critical Language: Unit rate, unit cost, cost per, price per, relationship
Learning Experience #2
The teacher may provide two vehicles going to the same place but with different miles per gallon and/or price per gallon of fuel (ex: diesel versus unleaded) so that students can describe how unit rates can be used to efficiently calculate equivalent
7th Grade, Mathematics Unit Title: R U Proportional? Page 8 of 17

Colorado Teacher-Authored Sample Instructional Unit
rates.Enactive: The teacher may provide students with several cars to rent from the same rental company. Each student may collaborate with another student to make a guess as to
which car they would rent based on the miles per gallon and the price of gas. Iconic/Symbolic: Students can use a ratio table and graph to determine which vehicle is the most cost effective and justify their solution using each representation.
Teacher Notes: This learning experience builds on the unit price work from learning experience 1. Students in the first learning experience were given a cost per weight or item and had to find a unit rate. In this learning experience students are given the unit rate (miles per gallon and price per gallon) and use the unit rate to make calculations. Class discussions can center on the similarity and differences between the two learning experiences and how it is easier and more efficient to calculate with unit rates. Students can also be given opportunity to discuss how the unit rate appears in the ratio table and on the graph (e.g., both as point in the table and graph (1, r) and as the change within the table and graph). Although the concept of slope is discussed throughout this unit in relation to proportional relationships by focusing on the constant of proportionality slope is not formally introduced till 8 th grade when students explore the broader idea of linear relationships.
Generalization Connection(s): The constant of proportionality (unit rate) describes the ratio between two quantities in a particular contextAny point (x,y) on the graph y=kx satisfies a proportional relationship with the constant of proportionality kMathematicians verify proportional relationships by examining ratio tables and coordinate graphs
Teacher Resources: https://aos98.files.wordpress.com/2013/12/grade-7-unit-2.pdf (ratio and proportions lessons)http://downloadily.com/read/gauging-gas-mileage-grade-los-angeles-unified-school-district-6198798.html (gauging gas mileage)http://www.fueleconomy.gov/feg/pdfs/guides/FEG2015.pdf (2015 Fuel Economy Guide, can be used to make various ratio tables
and practice problems)http://www.mathworksheetsland.com/8/7graph.html (graphing proportional relationships practice)
Student Resources: http://www.virtualnerd.com/middle-math/ratios-proportions-percent/ratios-rates/rate-to-unit-rate-conversion (How do you convert a rate to a unit rate?)
Assessment: Students mastering the concept and skills of this lesson should be able to answer questions such as: Why might someone want to know how many miles per gallon a vehicle gets?How are miles per gallon and price per gallon important when planning a road trip?Why are unit rates helpful when making calculations?Where can you find a unit rate in a table, graph?
Differentiation:(Multiple means for students to access content and multiple modes for student to express understanding.)
Access (Resources and/or Process) Expression (Products and/or Performance)
Teachers may keep one variable constant. (i.e. miles per gallon, both Diesel vehicles).
Students can compare vehicles using either miles per gallon or price per gallon.
7th Grade, Mathematics Unit Title: R U Proportional? Page 9 of 17

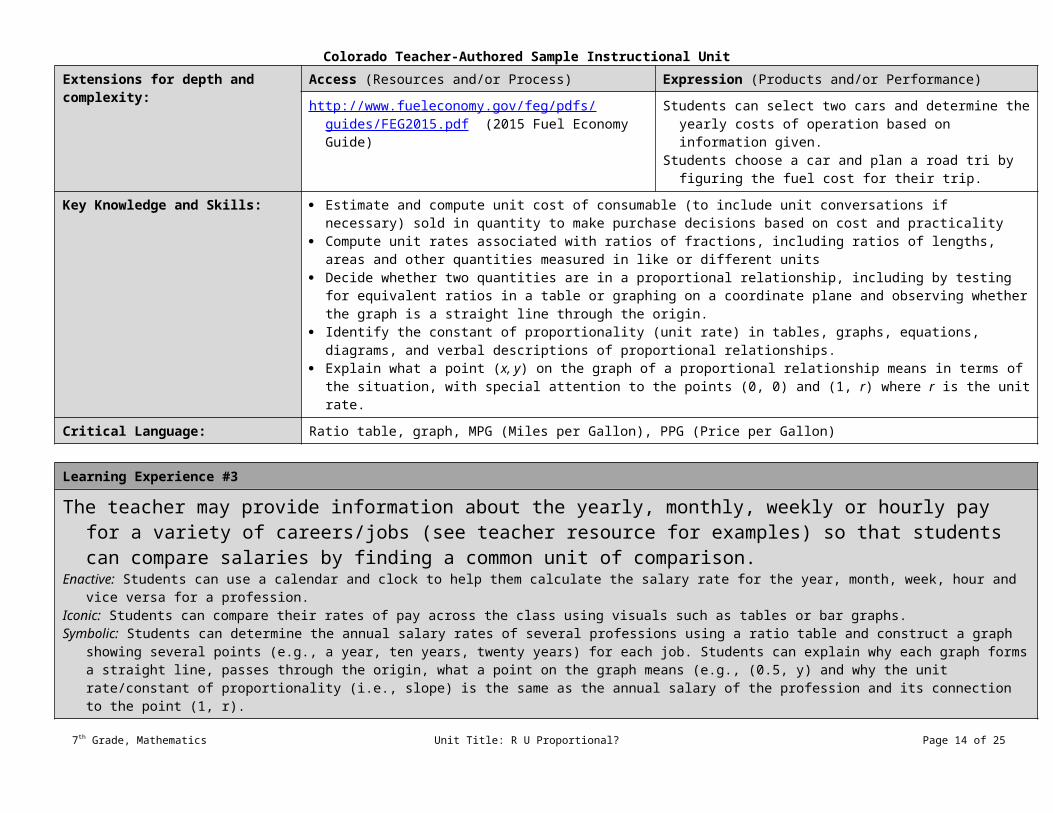
Colorado Teacher-Authored Sample Instructional UnitExtensions for depth and complexity: Access (Resources and/or Process) Expression (Products and/or Performance)
http://www.fueleconomy.gov/feg/pdfs/guides/FEG2015.pdf (2015 Fuel Economy Guide)
Students can select two cars and determine the yearly costs of operation based on information given.
Students choose a car and plan a road tri by figuring the fuel cost for their trip.
Key Knowledge and Skills: Estimate and compute unit cost of consumable (to include unit conversations if necessary) sold in quantity to make purchase decisions based on cost and practicality
Compute unit rates associated with ratios of fractions, including ratios of lengths, areas and other quantities measured in like or different units
Decide whether two quantities are in a proportional relationship, including by testing for equivalent ratios in a table or graphing on a coordinate plane and observing whether the graph is a straight line through the origin.
Identify the constant of proportionality (unit rate) in tables, graphs, equations, diagrams, and verbal descriptions of proportional relationships.
Explain what a point (x, y) on the graph of a proportional relationship means in terms of the situation, with special attention to the points (0, 0) and (1, r) where r is the unit rate.
Critical Language: Ratio table, graph, MPG (Miles per Gallon), PPG (Price per Gallon)
Learning Experience #3
The teacher may provide information about the yearly, monthly, weekly or hourly pay for a variety of careers/jobs (see teacher resource for examples) so that students can compare salaries by finding a common unit of comparison.
Enactive: Students can use a calendar and clock to help them calculate the salary rate for the year, month, week, hour and vice versa for a profession.Iconic: Students can compare their rates of pay across the class using visuals such as tables or bar graphs. Symbolic: Students can determine the annual salary rates of several professions using a ratio table and construct a graph showing several points (e.g., a year, ten years, twenty
years) for each job. Students can explain why each graph forms a straight line, passes through the origin, what a point on the graph means (e.g., (0.5, y) and why the unit rate/constant of proportionality (i.e., slope) is the same as the annual salary of the profession and its connection to the point (1, r).
Teacher Notes: Students may notice that an hourly unit rate can be used to calculate the yearly unit rate but when you change the units the rates are no longer equivalent. This can be demonstrated by creating an hourly versus yearly graph. It is important to understand the need to compare equivalent units when looking at unit rates, for example dollars/per hour is different than dollars/per week.
The symbolic part of this learning experience is key to the rest of the unit. It is the culmination of several ideas that were explored in the two previous leaning experiences but are formalized in this learning experience and will be extended and practiced in the next learning experience.
Generalization Connection(s): The constant of proportionality (unit rate) describes the ratio between two quantities in a particular context. Mathematicians verify proportional relationships by examining ratio tables and coordinate graphs. Mathematicians interpret the points (x,y), (0,0) and (1,r) in relation to a proportional context, where r is the unit rate.
Teacher Resources: http://www.payscale.com/index/US/Industry (examples of salaries (annual and hourly) for thousands of professions)
7th Grade, Mathematics Unit Title: R U Proportional? Page 10 of 17

Colorado Teacher-Authored Sample Instructional Unithttp://www.commoncoresheets.com/Math/Ratios/Identifying%20Constant%20of%20Proportionality%20(Graphs)/English/
Create.php?CSS=7rp2b (constant of proportionality worksheet)
Student Resources: www.desmos.com (online graphing tool)
Assessment: Students mastering the concept and skills of this lesson should be able to answer questions such as:When given a unit rate, how would you create a table that shows the proportional relationship between two quantities?When given a table of data that is proportional, how could you find a constant of proportionality?How can you create a graph of a data set that show a proportional relationship, what information do you need?Why are the units important to consider when comparing rates (e.g., salary per week versus salary per year)?
Differentiation:(Multiple means for students to access content and multiple modes for student to express understanding.)
Access (Resources and/or Process) Expression (Products and/or Performance)
http://itools.subhashbose.com/grapher/index.php?nplot_type=ptmode&nr=5&nStrip=&go (resource for plotting points on a graph)
www.desmos.com (online graphing tool)
Students can create coordinate graphs of salaries using an online graphing tool.
Extensions for depth and complexity: Access (Resources and/or Process) Expression (Products and/or Performance)
http://en.wikipedia.org/wiki/List_of_minimum_wages_by_country (wage information for a number of countries)
Students can determine the countries with both the highest and lowest weekly and hourly wages and discuss implications for each country.
Key Knowledge and Skills: Decide whether two quantities are in a proportional relationship, including by testing for equivalent ratios in a table or graphing on a coordinate plane and observing whether the graph is a straight line through the origin
Identify the constant of proportionality (unit rate) in tables, graphs, equations, diagrams, and verbal descriptions of proportional relationships
Critical Language: Origin, ratio, proportion, unit rate, constant of proportionality, proportional relationship,
Learning Experience #4
The teacher may provide a variety of real life scenarios involving the relationship of two quantities so that students can determine if the two quantities vary in direct proportion to each other.
Enactive/Iconic: Students can create a table of values for each situation and graph the relationships to determine if the relationships are proportional. For proportional relationships students can interpret the meaning of the points (0,0), (x,y), and (1,r) in relationship to the context.
Symbolic: Students can determine the constant of proportionality (e.g., unit rate) of each proportional relationship from either the table or graph and write an equation to represent the proportional relationship.
Teacher Notes: The Shell Center lesson under teacher resources provides a variety of real life scenarios and can be used as the basis for this lesson.Learning experience 4 extends the work in the previous learning experiences by asking students to write equations to represent
proportional relationships. Students began using variables to represent relationships as early as 3rd grade but writing an equation to represent a varying relationship may still be difficult for students. You may want to begin by using arrow language to help
7th Grade, Mathematics Unit Title: R U Proportional? Page 11 of 17

Colorado Teacher-Authored Sample Instructional Unitstudents understand how they move from one quantity to another. After a few examples students should begin to realize that the constant of proportionality is always being multiplied by the first quantity to find the second quantity in a proportional relationship, i.e., y = mx.
Generalization Connection(s): The constant of proportionality (unit rate) describes the ratio between two quantities in a particular context. Mathematicians interpret the points (x,y), (0,0) and (1,r) in relation to a proportional context, where r is the unit rate.The constant of proportionality determines the rate of increase (or decrease) of proportional relationships.
Teacher Resources: http://map.mathshell.org/materials/lessons.php?taskid=483&subpage=concept (Shell center lesson for determining proportional and non-proportional relationships)
http://mathincontext.eb.com/content/books/overviews/expressions_and_formulas.pdf (arrow language section C)http://www.internet4classrooms.com/grade_level_help/distinguish_proportional_relationships_math_seventh_7th_grade.htm
(proportional relationships)https://drive.google.com/file/d/0B7NmSVDaZQPtR056Ti1mOG4tTDQ/edit?usp=sharing&pli=1 (Interpreting graphs of proportional
relationships)https://drive.google.com/file/d/0B7NmSVDaZQPtS3FwclplWkpDYnc/edit?usp=sharing&pli=1 (identifying proportional and non-
proportional relationships in graphs)
Student Resources: https://www.youtube.com/watch?v=HwlLoCFBL5g (video for plotting equivalent ratios and graphing)https://www.youtube.com/watch?v=VyhRv_MuxvA (video about equal Ratios for different size screens)
Assessment: Students mastering the concept and skills of this lesson should be able to answer questions such as: What properties do proportional relationships have? How can you tell if a relationship is not proportional? How can you tell from the graph (table) if a relationship is directly proportional?
Differentiation:(Multiple means for students to access content and multiple modes for student to express understanding.)
Access (Resources and/or Process) Expression (Products and/or Performance)
www.desmos.com (online graphing tools) Students can use an online graphing tool to help them plot data more efficiently
Extensions for depth and complexity: Access (Resources and/or Process) Expression (Products and/or Performance)
https://drive.google.com/file/d/0B7NmSVDaZQPtaFppZ2huYmo0b3M/edit?usp=sharing&pli=1 (equations of graphs of proportional relationships involving fractions)
Students can explore proportional relationships whose constant of proportionality is a rational number.
Key Knowledge and Skills: Decide whether two quantities are in a proportional relationship, including by testing for equivalent ratios in a table or graphing on a coordinate plane and observing whether the graph is a straight line through the origin.
Identify the constant of proportionality (unit rate) in tables, graphs, equations, diagrams, and verbal descriptions of proportional relationships.
Explain what a point (x, y) on the graph of a proportional relationship means in terms of the situation, with special attention to the
7th Grade, Mathematics Unit Title: R U Proportional? Page 12 of 17

Colorado Teacher-Authored Sample Instructional Unitpoints (0, 0) and (1, r) where r is the unit rate.
Represent proportional relationships by equations
Critical Language: Equivalent, proportional, non-proportional, ordered pair, relationships, equivalent ratios, X –axis, Y –axis, intercept, rrigin (0,0), quadrant, ratio, unit rate
Learning Experience #5
The teacher may provide a list with different monetary scenarios (e.g., interest, income, sales tax, tips) so that students can determine taxes, tips, simple interest, markups, and markdowns.
Enactive: Students can choose items from a menu and determine their bill including adding in a percentage of the total for both a tip and tax. Iconic: Students can create ratio tables for several tipping percentages (i.e., a tip calculator) for pre-determined amounts to help calculate a total restaurant bill. Symbolic: Students can calculate the tax rate and/or tipping percentage when provided the subtotal or total and the final amount paid.
Teacher Notes: The teacher may want to show students restaurant bills demonstrating tax and tip calculations, as well as multiple menus with examples of senior and child discounts.
Generalization Connection(s): The constant of proportionality determines the rate of increase [or decrease] of proportional relationships
Teacher Resources: https://www.illustrativemathematics.org/illustrations/106 - (calculating tips and tax)http://www.getdining.com/images/310_Menu_1.pdf (Chili’s menu)http://www.olivegarden.com/print-menu/pronto-lunch (Olive Garden menu)
Student Resources: http://www.funbrain.com/penguin/ (calculating tax and tips game)https://learnzillion.com/lessons/327-solve-problems-with-taxes-using-proportions - (video on calculating tax using ratios)
Assessment: Students mastering the concept and skills of this lesson should be able to answer questions such as: How do you determine your final bill at a restaurant?How would you explain the similarities and differences of tips and taxes on a restaurant bill?
Differentiation:(Multiple means for students to access content and multiple modes for student to express understanding.)
Access (Resources and/or Process) Expression (Products and/or Performance)
N/A Students can focus only on adding tips to a bill using friendly numbers.
Extensions for depth and complexity: Access (Resources and/or Process) Expression (Products and/or Performance)
N/A Students can create their own restaurant menus with prices and daily specials (simpler amounts) and then share their menus so that students can calculate a bill off of the student-created menus.
Key Knowledge and Skills: Use proportional relationships to solve multistep ratio and percent problems Solve problems involving percent of a number, discounts, taxes, simple interest, percent increase, and percent decrease
Critical Language: Tax rate, percent, tip
7th Grade, Mathematics Unit Title: R U Proportional? Page 13 of 17
Colorado Teacher-Authored Sample Instructional Unit
Learning Experience #6
The teacher may provide a list with different monetary scenarios (e.g., whole sale prices and sale prices) so that students can calculate percent increases and percent decreases.
Iconic: Students can create ratio tables to find the cost of items if they have a 30%, 50% or 80% markup (percent increase) and compare the amount a stores earns on each item when the store offers a 10%, 20%, or 30% discount (percent decrease).
Symbolic: Students can determine the discount or markup (percent decrease/percent increase) when provided the retail price and purchase price or the wholesale price and retail price.
Teacher Notes: The teacher may want to explain to students how businesses earn money (markups) and why they offer discounts (increase sales). Students will also need to gain familiarity with critical language such as whole-sale price, retail price, and sale price.
Generalization Connection(s): The constant of proportionality determines the rate of increase [or decrease] of proportional relationships
Teacher Resources: http://www.mathgoodies.com/lessons/percent/change.html (description of percent increase/decrease)http://www.skillsyouneed.com/num/percent-change.html (description of percent increase/decrease)http://illuminations.nctm.org/Lesson.aspx?id=2974 (lesson on discounts)https://learnzillion.com/lesson_plans/5843-apply-taxes-tips-and-discounts-using-a-proportion-and-scale-factor (lesson using scale
factor to think about discounts, taxes, tips)http://smallbusiness.chron.com/explaining-percent-markup-76288.html (explanation of markup)
Student Resources: N/A
Assessment: Students mastering the concept and skills of this lesson should be able to answer questions such as: Why would you be interested in understanding the concepts of markups and markdowns as a business owner?What is a percent increase/decrease and how does it compare to the constant of proportionality?
Differentiation:(Multiple means for students to access content and multiple modes for student to express understanding.)
Access (Resources and/or Process) Expression (Products and/or Performance)
N/A Students can calculate just the discounts focus on just the markups or discounts and use friendly
Extensions for depth and complexity: Access (Resources and/or Process) Expression (Products and/or Performance)
N/A Students can describe why a store still earns money if an item has a 30% markup and they give a 30% discount.
Key Knowledge and Skills: Use proportional relationships to solve multistep ratio and percent problems Solve problems involving percent of a number, discounts, taxes, simple interest, percent increase, and percent decrease
Critical Language: Tax rate, percent, tip, markdown, markup, interest
7th Grade, Mathematics Unit Title: R U Proportional? Page 14 of 17

Colorado Teacher-Authored Sample Instructional UnitLearning Experience #7
The teacher may provide students with a variety of starting amounts and interest rates so that students can compare different simple interest rates over various periods of time.
Iconic: Students can create graphs and ratio tables demonstrating the different interest rates.Symbolic: Students can describe what (0,0), (x,y), and (1, r) mean in relation to the simple interest rate problems.
Teacher Notes: The teacher may want to explain why interest is used (banks pay clients for being able to use their money). The teacher may also want to add an explanation of students paying interest on a loan. The teacher may choose to describe how to determine the rate of change (increase and decrease) given changes in investment accounts or loans.
Generalization Connection(s): Mathematicians verify proportional relationships by examining ratio tables and coordinate graphsMathematicians interpret the points (x,y), (0,0) and (1,r) in relation to a proportional context, where r is the unit rate.
Teacher Resources: https://cherylfayejackson.wordpress.com/exemplary-lesson-plans/percent-and-proportional-relationships/ (series of lesson plans that address all areas of the use of multi-step ratio and percent problems)
https://drive.google.com/file/d/0B7NmSVDaZQPtMjZOVnJYdWpFZDA/edit (simple interest lesson plan)
Student Resources: http://www.webmath.com/simpinterest.html (simple interest calculator)http://www.math-play.com/Simple-Interest/Simple-Interest.html (simple interest game)
Assessment: Students mastering the concept and skills of this lesson should be able to answer questions such as:How would you explain how to calculate simple interest?How could you represent simple interest over time in a table?How would you explain how simple interest can benefit someone?How could you determine the percent increase (rate of return) of your savings account over a certain amount of time?How could you graph the percent increase in your savings account?
Differentiation:(Multiple means for students to access content and multiple modes for student to express understanding.)
Access (Resources and/or Process) Expression (Products and/or Performance)
N/A Students can calcuate simple amounts for interest calculations such as 10% interest on $1000.
Students can draw a fraction bar labeled with “hops” explaining how much interest increases.
7th Grade, Mathematics Unit Title: R U Proportional? Page 15 of 17

Colorado Teacher-Authored Sample Instructional UnitExtensions for depth and complexity: Access (Resources and/or Process) Expression (Products and/or Performance)
http://www.winthemoneygame.com/simple-vs-compound-interest-activity-lesson/ (Compound Interest resource)
Students can explain the difference between simple versus compound interest.
Key Knowledge and Skills: Use proportional relationships to solve multistep ratio and percent problems Solve problems involving percent of a number, discounts, taxes, simple interest, percent increase, and percent decrease
Critical Language: Simple/compound, interest, commissions, percent increase/decrease, percent error
Learning Experience #8 scaled drawings
The teacher may provide a scenario of a contest for planning a new garden, mini-golf course, or playground for their town so that students can create a scale drawing and determine ratios of lengths, areas, and other quantities.
Enactive: Students can walk around a nearby playground or their school and locate themselves on a scale drawing of that location. Iconic: Students can create scaled drawings, compare them to their peers’ drawings, and evaluate multiple students’ drawings. Symbolic: Students can represent the scale of their drawing using a ratio table or graph and compare the sizes of various parts of their scale drawing to their peer’s drawings (e.g.,
area of a flower patch, length of put on golf course)
Teacher Notes: Teachers may want to address common student misconceptions such as students having difficulties calculating measures on a plan by asking, “How do you convert 1 meter in real life to a measurement on the plan?” Teachers may want to show a completed garden (see page 24 of the Shell Center lesson below) to get a starting point for their drawings.
Generalization Connection(s): The constant of proportionality (unit rate) describes the ratio between two quantities in a particular contextThe constant of proportionality determines the rate of increase (or decrease) of proportional relationships
Teacher Resources: http://map.mathshell.org/materials/download.php?fileid=1376 (Shell Center lesson for drawing a Garden to Scale)https://www.engageny.org/resource/grade-7-mathematics-module-1 (EngageNY - Module 1 - Topic D - Lessons 16-22 - ratios of
scale drawings)https://www.nsa.gov/academia/_files/collected_learning/middle_school/pre-algebra/understanding_proportions.pdf ( worksheets
and/or notes on scale drawings)http://illuminations.nctm.org/Search.aspx?view=search&type=ls&kw=scale%20drawing&cc=2116 (A variety of lessons linked to
working with scale)
Student Resources: http://www.transum.org/software/SW/Starter_of_the_day/Students/Scale_Area_Volume.asp (comparing ratios of lengths, areas and other quantities)
Assessment: Students mastering the concept and skills of this lesson should be able to answer questions such as: Given a map and its scale, how far apart are two points on the map?Why is it important to know how to identify the scale factor of a given situation?How does the ratio of areas compare to the ratio of the sides of a rectangular figure?
Differentiation: Access (Resources and/or Process) Expression (Products and/or Performance)
7th Grade, Mathematics Unit Title: R U Proportional? Page 16 of 17

Colorado Teacher-Authored Sample Instructional Unit(Multiple means for students to access content and multiple modes for student to express understanding.)
N/A Students can create scale maps using a simplified scale and with only a few items.
Extensions for depth and complexity: Access (Resources and/or Process) Expression (Products and/or Performance)
http://www.learnnc.org/lp/pages/3511?ref=search (interior design: Designing My Dream Room)
http://www.ehow.com/list_6579859_scale-drawing-activities-middle-school.html (EHow.com Hallway Recreations Middle School)
Students can create their own dream bedroom with real measurements to scale.
Students can create original scale maps of their surroundings.
Key Knowledge and Skills: Compute unit rates associated with ratios of fractions, including ratios of lengths, areas and other quantities measured in like or different units. (MA10-GR.7-S.1-GLE.1-EO.a) 7.rp.1
Decide whether two quantities are in a proportional relationship, including by testing for equivalent ratios in a table or graphing on a coordinate plane and observing whether the graph is a straight line through the origin. (MA10-GR.7-S.1-GLE.1-EO.c.i) 7.rp.2.a
Identify the constant of proportionality (unit rate) in tables, graphs, equations, diagrams, and verbal descriptions of proportional relationships. (MA10-GR.7-S.1-GLE.1-EO.c.ii) 7.rp.2.b
Critical Language: Scaled drawings, proportional, ratios, reduction, enlargement/magnification, scale factor
7th Grade, Mathematics Unit Title: R U Proportional? Page 17 of 17