Embed Size (px)
Citation preview
CP5074 – SNA –UNIT 2
UNIT II
MODELING AND VISUALIZATION
Visualizing Online Social Networks - A Taxonomy of Visualizations - Graph Representation - Centrality- Clustering - Node-Edge Diagrams - Visualizing Social Networks with Matrix-Based Representations- Node-Link Diagrams - Hybrid Representations - Modelling and aggregating social network data – Random Walks and their Applications –Use of Hadoop and Map Reduce - Ontological representation of social individuals and relationships.
2.1 VISUALIZING ONLINE SOCIAL NETWORKSVisualizations of online social networks were developed according to the attributes of network
sociality to present their network structure. Visualization of online social networks can be
analyzed according to their attributes of sociality, including Web communities, email groups,
digital libraries, and Web 2.0 services.
2.1.1 Web Communities: Different social network services were created on the Web to help people maintain their social relationships.
The SixDegrees.com website was an early representative created on the basis of the Web interaction model during 1997 and 2001.
o Various social network websites and Web-based dating services have been
established to provide people more convenient ways to build up their social relationships and communities. In addition, many social network websites are developed with interactive visualization interfaces to facilitate people connecting their communities and maintaining social relationships.
In 2003, Club Nexus was established based on the friendship network data of Stanford students and allowed them to explicitly list their friends by their profiles.
o For example, students registered on Club Nexus were provided with the profiles of their year in school, major, residence, gender, personalities, hobbies and interests to facilitate interacting with their online social networks.
In addition to listing actors with their profiles for social network analysis, a modern visualization of social networks, Vizster, was contributed with customized techniques to visualize social relationships and community structures in 2005.
o Vizster was developed based on node-edge network layouts for exploring connectivity in large graph structures, supporting visual search and analysis, and automatically identifying and visualizing community structures
The visualization techniques are mainly introduced to deal with the complex social relationships based on human-centric or user-centric views. As the development of Semantic
1

CP5074 – SNA –UNIT 2
Web, a project called FOAF (Friend-of-a-friend) was proposed to visualize such human-centric social relationships based on Semantic Web social metadata. With XML/RDF format, the FOAF relations can be explicitly defined for further social network analysis and visualization.
Microsoft Research Asia proposed a novel object-level search service, called Entity Cube, to help people discover real-world entities, such as people, locations, and organizations, and explore their social relationships.
Web entities are summarized from billions of Web pages with a modest presence.
2.3 GRAPH REPRESENTATIONGraph theory is the study of graphs, which are mathematical structures used to model pair wise
relations between objects. Many fundamental concepts and metrics in social network analysis are
derived from graph theory, because graph theory formally represents social networks with
structural properties. Some fundamental concepts related to graph theory are:
Node degree:
The degree of a node in a graph is the number of edges incident to the node. If there are loops in the graph, the degree of a node will be counted twice. Therefore, the maximum number of unique edges in a graph can be obtained when the loops are excluded.
- Undirected graph
- Directed Graph
where N is the number of nodes.
Node density:
It is a graph in which the number of edges is close to the maximal number of
edges. - Undirected graph
- Directed Graph where E is the number of edges
Path length:
The path length is the number of edges in the sequence that a walk follows. In a path, all nodes
and edges appear only once in the sequence. Therefore, the path length can be defined as the
distances between pairs of nodes in a network graph, and average path length is the average of
these distances between all pairs of nodes.
2

CP5074 – SNA –UNIT 2
Component size:
When the component size is concerned, a connected graph needs to be discovered first since the
component size is counted by the number of connected nodes in a graph. A graph is connected if
all pairs of nodes are reachable, and for each pair of two nodes, one of them is reachable from
the other.
On the other hand, if a graph is not connected, the graph can be partitioned into several connected subgraphs where each component size can be calculated by the number of connected nodes in each subgraph.2.3.1 CENTRALITY
Centrality is a measure indicating the importance of node in the network. The measure of
centrality is thus used to give a rough indication of the social power of a node based on how well
they connect the network. HITS and PageRank are two most famous representatives using
centrality for ranking. HITS analyze the important nodes based on calculating Authorities
(indegrees) and Hubs (out-degrees). PageRank calculates node values based on out-degrees.
The three most popularly adopted methods to measure the centrality of a social network are listed below:
Degree Betweenness Closeness
Degree centrality:
Degree centrality is defined as the number of edges incident upon a node, and thus it is usually the first way to calculate the nodes that are most potential to determine other nodes. For calculating degree centrality, the nodes that have direct connections to a large number of nodes are considered. If the edges in a graph are directed, the in-degree centrality is differentiated from the out-degree centrality.
Betweenness centrality:
Betweeness centrality is another key metrics for computing the extent to which a node lies
between other nodes in the network. Betweenness centrality is to measure the connectivity of the
neighbors of a node and to give a higher value for nodes which bridge clusters. Besides, this
3

CP5074 – SNA –UNIT 2
measure reflects the number of nodes which a node is connecting indirectly through the direct
links.
A lies between no other vertices B lies between A and 3 other vertices : C, D, E C lies between 4 pair of vertices (A, D), (A,E), (B,D), (B,E)
Closeness centrality:
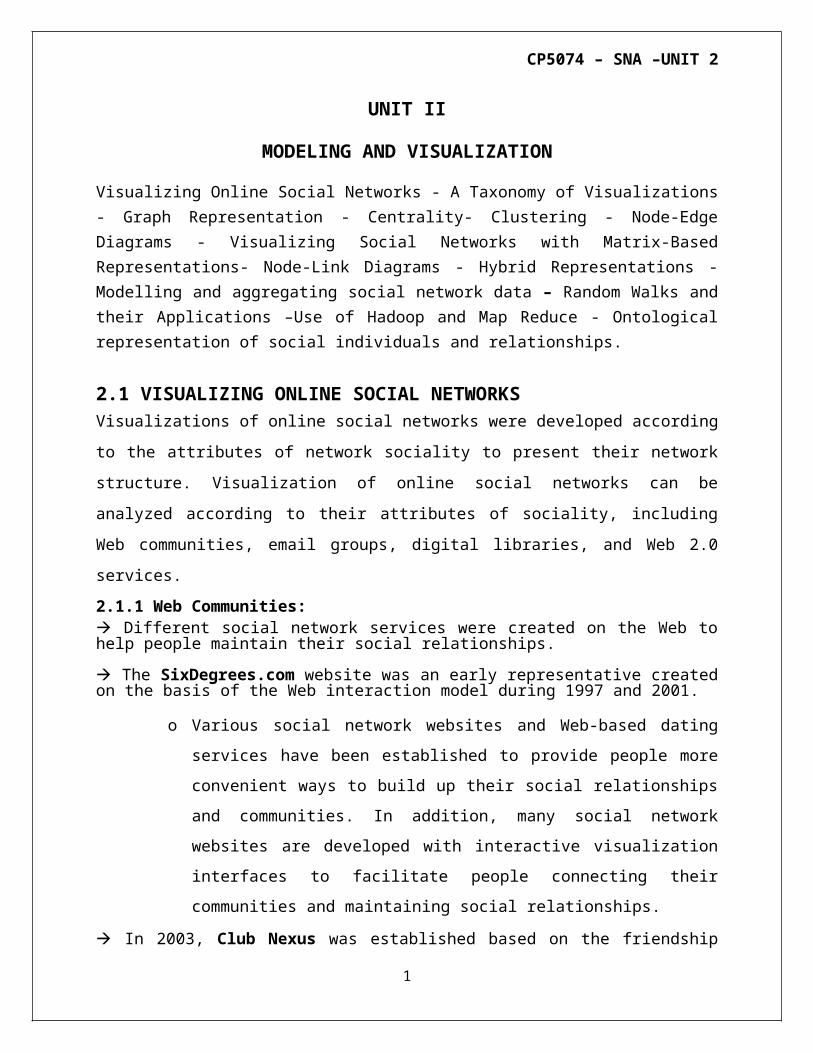
The measure of closeness centrality is to take into account how distant a node is to the other
nodes in the network.. Nodes that are ranked high with closeness centrality can be seen as the
nodes that are more likely to act as information distributors in the social network. A node is considered important if it is relatively close to all other nodes. Farness of a node is the sum of its distances to all other nodes. Closeness if the inverse of the farness.
= 1 / Σ ≠ ( , )
2.3.2 CLUSTERINGAlso called community, it refers to a group of nodes having denser relations with each other than with the rest of the network.
Clustering coefficient:
Clustering coefficient is to measure the degrees of nodes to decide which nodes in a graph tend
to be clustered together. Thus, the clustering coefficient measure is to quantify how close its
neighbors are to being a complete graph. As the nodes grouped in the real-world social network
tend to have relatively high density of ties, the clustering coefficient is also utilized for small
world analysis.
4

CP5074 – SNA –UNIT 2
Example :
Measure of triad closures in graph is relative to connected triples.
Three nodes form a Connected Triple (CT)
From any one node to any of others –(A, B,C) , (B,C,D)
Three nodes form a Triad Closure ( TC)
Each pair of nodes has a direct link –(A,B,C)
Clustering coefficient = 3 * TC / CT
For the above diagram
TC=1
CT = ((A,B,C) + (B,A,C) + (A,C,B) )+ (A,C,D) + (B,C,D) = 3+1+1 = 5
Clustering coefficient = 3 *1 / 5 = 3 / 5 = 0.6
2.3.3 NODE- EDGE – DIAGRAMA node-edge diagram is an intuitive way to visualize social networks. With the node-edge
visualization, many network analysis tasks, such as component size calculation, centrality
analysis, and pattern sketching, can be better presented in a more straightforward manner.
different layouts have their own pros and cons to display the network graph depending on the
size, complexity, and structure of the social network. There are three kinds of layouts: Random layout Force –directed layout Tree layout
Random Layout Random layout is to put the nodes at random geometric locations in the graph.
It may not yield very clear visualization results, particularly when the number of nodes
5
CP5074 – SNA –UNIT 2
immensely increases, e.g. more than thousands of nodes
Since a random layout algorithm can efficiently draw the social network graph in linear time, O(N), sometimes it can be usable to visualize very large network graphs.
Force-Directed Layout Also known as a spring layout, this simulates the graph as a virtual physical system.
The edges act as spring and the nodes act as repelling objects.
There exists gravitational attraction or magnetic repulsion between each node in the graph.
Generally, an initial random layout will be yielded first, and then the force-directed algorithms will run iteratively to adjust the positions of nodes until all graph nodes and attractive forces between the adjacent nodes run to convergence.
Since a force-directed layout may take hundreds of iterations to obtain a stable layout, the running time is at least O(N log N) or O(E), where N is the number of nodes and E is the number of edges.
The running cost of a force-directed layout is much higher than that of a random layout, especially when the number of nodes is large. It is therefore not suitable for graphs larger than hundreds of nodes.
Tree Layout:A basic tree layout is to choose a node as the root of tree, and the nodes connected to the root become children of the root node. Nodes that are at more levels away from the root become the grand-children of the root and so on. It can display a more structural layout than graph layouts by considering more contextual information. Tree layout was proposed for better visualization.The tree visualizations utilize the idea of focus + context to better the visualization effects with animation techniques and help users to obtain both global and local views of a social network in a 2D display.
2.4 VISUALIZING SOCIAL NETWORKS WITH MATRIX-BASED REPRESENTATIONSMatrices or node-link diagrams both have advantages and drawbacks for visualizing social networks.2.4.1 Matrix or Node-Link DiagramMatrix and node-link diagrams have different properties making them suitable representations for different tasks and datasets. Node-link diagrams are more effective for very small (under 20
6

CP5074 – SNA –UNIT 2
vertices) and sparse networks whereas matrices outperform them otherwise except when the task is to follow paths in the network.
Advantages of matrices: Matrices provide powerful overview visualization. Matrices do not suffer from node overlapping. Matrices do not suffer from link crossing each other. Matrices show all possible pairs of vertices. Matrices are particularly appropriate for directed and dense networks.
Advantages of node-link diagrams1. These representations are familiar to a wide audience; they constitute a powerful
communication tool.
2. For small or sparse networks, node-link diagrams were more effective than matrices.
3. The space used by matrices is larger than the space to display node-link diagrams. Therefore, node-link diagrams provide a compact representations.
4. Node-link diagrams are more appropriate to perform a number of path-related tasks
2.4.2 Matrix + Node-Link Diagrams Matrix Explorer designed to combine advantages of both representations and to support the visual exploration of social networks. Following are the steps to combine matrices and node-link diagrams.
Initiate the exploration Explore interactively and iteratively Find a consensus in the data or validate an hypothesis Present the findings
Initiate the exploration Readable representation of a network and its associated low rendering time of matrices
provide suitable representations to initiate the exploration. Persons are nodes or rows/columns, email exchanges between two persons are
represented by a link or a cell filled with black in the matrix. The node-link representation, using a traditional force-directed layout, makes it difficult
to identify specific nodes or links. From matrix representation, each black dot represents a connection between a row and a
column (i.e. an email exchange between two persons); the gray background shows the lack of connection.
There is a majority of gray in the matrix showing that many actors did not exchange email with each other.
In addition to the clusters, the analyst can observe a cross pattern: vertical and horizontal lines constituted of black dots with an approximate length of half the matrix.
This patterns is associated with the administrative service, dealing with travels of the
7

CP5074 – SNA –UNIT 2
whole institutions and thus, communicating with many persons in the network.
Explore Interactively
Both the matrix and node-link representations support the analysis of the network at different
levels of details. For instance, if an analyst is looking for an overview of the network to identify
its main communities, the matrix is the best option. Then, when a more detailed analysis is
required, to identify actors bridging two communities for example, node-link diagrams
constitute a better alternative.
With Matrix Explorer, we provide multiple views of the network and provide a number of tools
to interactively manipulate matrix and node-link representations. Selecting a visual pattern in
the matrix and visualizing its equivalent in the node-link diagram also ease the understanding
and learning of matrix representations, making them accessible to less expert users. Set of tools
available for manipulating matrix and node link representations are listed below: Interactive specification of visual attributes Interactive layout and reordering Automatic layout and reordering techniques Computer-assisted layout and reordering techniques Interactive filtering. Interactive clustering Overview CDetail techniques to navigate in both representations
Find a Consensus in the Data
Different techniques to reorder the matrix may lead to different cluster sets. To help analysts find a consensus and validate hypotheses, some support is needed. MatrixExplorer allows analysts to find consensus in the data through simple interactions.
For example, by associating visual variables such as colors to different cluster sets and by
reordering the matrix several times, analysts can identify clusters appearing clearly in multiple
orders as more valid. In addition, to mark the uncertainty of attribution of an actor to a given
cluster, Matrix Explorer also provides a technique to indicate the degree of membership of the
element to a given cluster. Analysts can mark elements less likely to belong to a cluster with a
lighter color. Finally, we support overlapping clusters and multiple sets of clusters: elements may
belong to multiple clusters at the same time.
8

CP5074 – SNA –UNIT 2
Present Findings
While matrix representations may prove effective when exploring large networks, node-link
diagrams are essential to communicate findings to a wide audience. node-link diagrams may be
created for presenting results with different filters and possibly different aggregations. To ease
this process. Matrix Explorer allows users to generate pictures while performing the exploration.
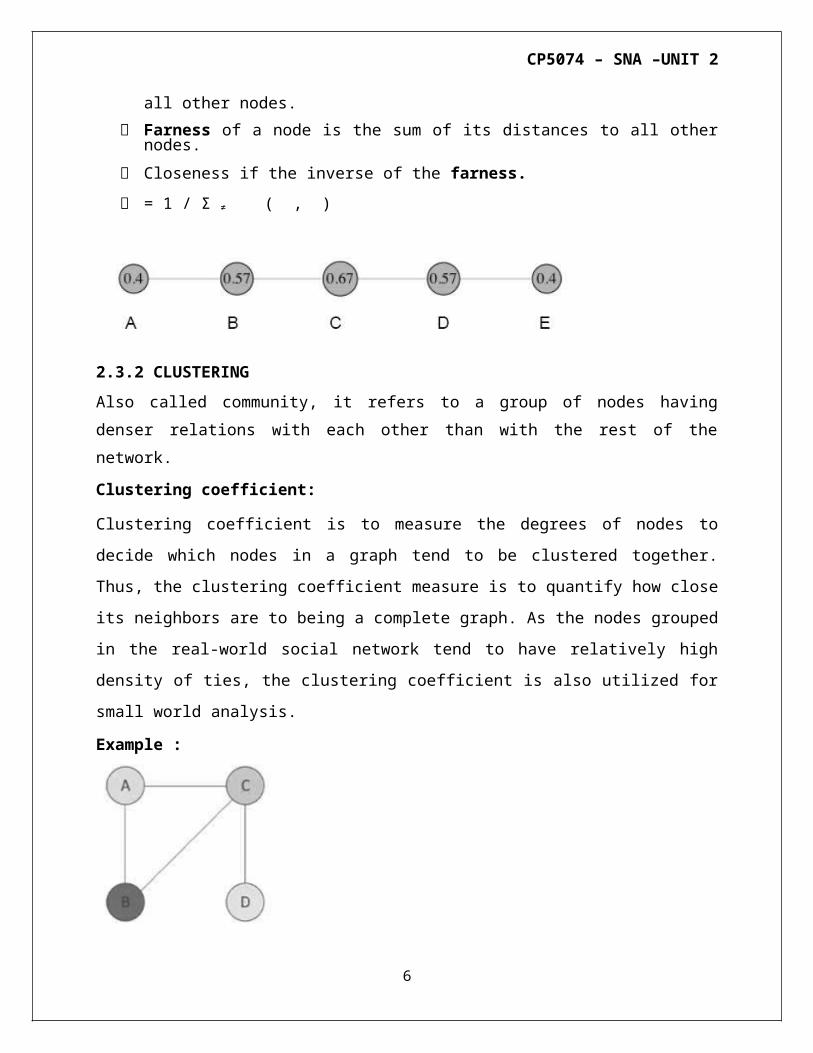
2.5 NODE LINK DIAGRAM Jacob Moreno was the first pioneer of social network visualization. More than 70 years
ago, he published visual depictions of social friendship in schools, using these visualizations to support his findings.
The principle of node-link diagrams is to graphically represent actors of the network bynodes and connections by links.
Node-link diagrams are the most commonly used representation of graphs and networks.It is well illustrated by Freeman in his survey and history of social network visualization.
Node-link representations are widely used and familiar to a very large audience, makingthem a powerful communication tool. However, their readability and the message they convey greatly depends on the positions of their nodes.
2.6 HYBRID REPRESENTATIONSProviding both matrix and node-link diagrams to the user has a number of advantages but also drawbacks.
It requires a large amount of display space.
At least two display monitors are required to comfortably use Matrix Explorer;
Switching from one representation to the other may induce high cognitive load to the user.
Two hybrid representations were developed namely,
MatLink and NodeTrix
9

CP5074 – SNA –UNIT 2
2.6.1 AUGMENTING MATRICESThe principle of MatLink is to augment a standard matrix representation with links on its borders. These links provides a dual encoding of the connections between actors. Two types of links are added to the representations:
static links (in white on the figure) and interactive links (in a darker shade).
When a row or column is selected, these links show a shortest path to any other row or column placed under the cursor.
Assessing the Readability of MatLink
MatLink introduced specific tasks of social network analysis: find a cut point, find a clique and find communities (strongly connected groups).
By the way MatLink significantly improve standard matrix representations.
The only task for which node-link diagrams still perform better is the identification of cut points. With MatLink, this task requires to identify specific visual patterns of the links.
Using MatLink for Navigating in the MatrixTo improve readability of matrices, Matlink supports navigation. Since matrices display actors in rows and columns, they require far more space than node-link diagrams to represent a network. In MatLink, all links connected to a given actor are displayed when this actor is selected. Thus, a direct visual feedback is provided on the number of neighbors and the curvature of the links provides an indication of their distance in the matrix.
Three techniques that provide users with effective tools to navigate in large matrices with MatLink were listed below:
Melange: folds the space between two far away nodes as if it was a piece of paper. Users may see side by side parts of the matrix that are far away.
Bring-and-go: neighbors of an actor closer as if their links were elastic, by moving the cursor over one of the neighbor and releasing the mouse, the view and the node travel to its previous location.
Link Sliding : allows users to locks their cursor to a given link and travel very fast to its destination
2.6.2 MERGING MATRIX AND NODE-LINK DIAGRAM Node-link diagrams or matrices perform differently according to the types of visualizednetworks. NodeTrix is a hybrid visualization merging node-link diagrams and matrices. The
10

CP5074 – SNA –UNIT 2
principle of NodeTrix is to represent the global network as a node-link diagram and the locally dense subparts as matrices.
Interactive ExplorationNodeTrix developed a number of interactions based on traditional drag-and-drop of objects with the mouse cursor for ease creation, exploration and edition of matrices. Matrix representations have the advantage of placing actors of the network linearly (in rows and in columns), thus it becomes easy to identify the community members connected to external actors. To add or remove actors from the matrix, users simply select the node or row/column representing an actor and drag it in or out of the matrix. Other interactions include the possibility to merge two matrices or split them to get back to the original node-link representation.
Drawback:Making it impossible to place an actor in two different communities.
Presenting Findings:NodeTrix can be used for both exploration and communication because matrices can be expanded showing detailed information on actors and connections showing higher-level connection patterns.
2.7 MODELLING AND AGGREGATING SOCIAL NETWORK DATA The most common kind of social network data can be modeled by a graph where the
nodes represent individuals and the edges represent binary social relationships. (Less commonly, higher-arity relationships may be represented using hyper-edges, i.e. edges connecting multiple nodes.)
Additionally, social network studies build on attributes of nodes and edges, which can be formalized as functions operating on nodes or edges.
A number of different, proprietary formats exist for serializing such graphs and attribute data in machine-processable electronic documents.
The most commonly encountered formats are those used by the popular network analysis packages Pajek and UCINET. These are text-based formats which have been designed in
a way so that they can be easily edited using simple text editors.
Unfortunately, the two formats are incompatible. Further, researchers in the social sciences often represent their data initially using Microsoft Excel spreadsheets, which can be exported in the simple CSV (Comma Separated Values) format.
11

CP5074 – SNA –UNIT 2
. The GraphML format represents an advancement over the previously mentioned formats in terms of both interoperability and extensibility.
GraphML originates from the information visualization community where a shared format greatly increases the usability of new visualization methods.
GraphML is therefore based on XML with a schema defined in XML Schema. This has the advantage that GraphML files can be edited, stored, queried, transformed etc. using generic XML tools.
Common to all these generic graph representations is that they focus on the graph structure, which is the primary input to network analysis and visualization.
Attribute data when entered electronic form is typically stored separately from network data in Excel sheets, databases or SPSS tables.
2.8 RANDOM WALKS AND THEIR APPLICATIONS A Random Walk in synthesis:Given an indirected graph and a starting point, select a neighbour at randomMove to the selected neighbour and repeat the same process till a termination condition is verifiedThe random sequence of points selected in this way is a random walk of the graph
Important parameters of random walk:Access time or hitting time: Hij is the expected number of steps before node j is visited, starting from node iCommute time: i j i: Hij + Hji
Cover time: Starting from a node/distribution the expected number of steps to reachevery node.
Applications of Random Walks on GraphsRanking Web PagesHITS on citation networkClustering using random walk
2.9 USE OF HADOOP AND MAP REDUCE12
CP5074 – SNA –UNIT 2
Map reduceData-parallel programming model for clusters of commodity machinesPioneered by Google - Processes 20 PB of data per dayPopularized by open-source Hadoop project - Used by Yahoo!, Facebook, Amazon, …
Map Reduce used forAt Google:1. Index building for Google Search2. Article clustering for Google News3. Statistical machine translationAt Yahoo!:1. Index building for Yahoo! Search2. Spam detection for Yahoo! MailAt Facebook:1. Data mining2. Ad optimization3. Spam detection
In research:Analyzing Wikipedia conflicts (PARC)Natural language processing (CMU)Bioinformatics (Maryland)Particle physics (Nebraska)Ocean climate simulation (Washington)
Map Reduce Goals1. Scalability to large data volumes:Scan 100 TB on 1 node @ 50 MB/s = 24 daysScan on 1000-node cluster = 35 minutes
2. Cost-efficiency:Commodity nodes (cheap, but unreliable)Commodity networkAutomatic fault-tolerance (fewer admins)Easy to use (fewer programmers)
TYPICAL HADOOP CLUSTER:
13

CP5074 – SNA –UNIT 2
40 nodes/rack, 1000-4000 nodes in cluster1 GBps bandwidth in rack, 8 GBps out of rackNode specs (Yahoo! terasort): 8 x 2.0 GHz cores, 8 GB RAM, 4 disks (= 4 TB?)
ChallengesCheap nodes fail, especially if you have many - Mean time between failures for 1 node = 3 years - MTBF for 1000 nodes = 1 day - Solution: Build fault-tolerance into systemCommodity network = low bandwidth - Solution: Push computation to the dataProgramming distributed systems is hard - Solution: Users write data-parallel “map” and “reduce” functions, system handles workdistribution and faults
Hadoop Components:Distributed file system (HDFS) - Single namespace for entire cluster - Replicates data 3x for fault-toleranceMapReduce framework - Executes user jobs specified as “map” and “reduce” functions - Manages work distribution & fault-tolerance
Hadoop Distributed File System:Files split into 128MB blocksBlocks replicated across several data nodes (usually 3)Namenode stores metadata (file names, locations, etc)Optimized for large files, sequential reads
14

CP5074 – SNA –UNIT 2
Files are append-only
MapReduce Programming Model:Data type: key-value recordsMap function:
Reduce function:
Example: Word Count:
Word Count Execution:
15

CP5074 – SNA –UNIT 2
An Optimization: The CombinerLocal aggregation function for repeated keys produced by same map• For associative ops. like sum, count, max• Decreases size of intermediate data
Word Count with Combiner
MapReduce Execution Details:• Mappers preferentially placed on same node or same rack as their input block – Push computation to data, minimize network use• Mappers save outputs to local disk before serving to reducers – Allows having more reducers than nodes – Allows recovery if a reducer crashes
16

CP5074 – SNA –UNIT 2
Fault Tolerance in MapReduce:If a task crashes: – Retry on another node• OK for a map because it had no dependencies• OK for reduce because map outputs are on disk – If the same task repeatedly fails, fail the job or ignore that input blockIf a node crashes: – Relaunch its current tasks on other nodes – Relaunch any maps the node previously ran• Necessary because their output files were lost along with the crashed nodeIf a task is going slowly (straggler): – Launch second copy of task on another node – Take the output of whichever copy finishes first, and kill the other one
2.10 ONTOLOGICAL REPRESENTATION OF SOCIAL INDIVIDUALS AND RELATIONSHIPS
2.10.1 ONTOLOGICAL REPRESENTATION OF SOCIAL INDIVIDUALS (i) The Friend-of-a-Friend (FOAF) ontology that we use in our work is an OWL based format for representing personal information
(ii) FOAF started as experimentation with Semantic Web technology. (iii) The idea of FOAF was to provide a machine processable format for representing the kind of information that made the original Web successful, namely the kind of personal information described in homepages of individuals. (iv) Thus FOAF has a vocabulary for describing personal attribute information typically found on homepages such as name and email address of the individual, projects, interests, links to work and school homepage etc.(v) FOAF profiles contain a description of friends the using the individuals same vocabulary that is used to describe the individual himself.(vi) FOAF became the center point of interest in 2003 with the spread of Social Networking Services such Friendster, Orkut, LinkedIn etc.
Drawbacks:
1. The information is under the control of the database owner 2. Centralized systems do not allow users to control the information
they provide on their own terms.(vii) FOAF profiles are created and controlled by the individual user and shared
17

CP5074 – SNA –UNIT 2
in a distributed fashion. FOAF profiles are typically posted on the personal website of the user and linked from the home page user switch the HTML META tag. (viii) An advantage of FOAF in terms of sharing FOAF data is the relative stability of the ontology. The number of FOAF users means that the maintainers of the ontology are obliged to keep the vocabulary and its semantics stable.
18

CP5074 – SNA –UNIT 2
For example, the SIOC (Semantically Enabled Online Communities) project aims at connecting discussions across various types of for a Usenet, discussion boards, blogs, mailing lists etc by exposing the postings according to a shared ontology.
The key concepts of this ontology are the sioc:User account that is used to create a sioc:Post, which is part of a sioc:Forum at a certain sioc:Site. A sioc: User is not a subclass of foaf :Person (as a person may have multiple accounts), but related to the description of a person using the sioc:account of property. While FOAF has a rich ontology for characterizing individuals—especially with respect to their online presence—, but it is rather poor as a vocabulary for describing relationships.
2.10.2 ONTOLOGICAL REPRESENTATION OF SOCIAL RELATIONSHIPS
Ontological representations of social networks such as FOAF need to be extended with a framework for modeling and characterizing social relationships for two principle reasons:
(1) To support the automated integration of social information on a semantical basis and (2) To capture established concepts in Social Network Analysis.
Characteristics of social relationships Sign: A relationship can represent both positive and negative attitudes such as like
or hate. The positive or negative charge of relationships is the subject of balance theory
Strength: Tie strength itself is a complex construct of several characteristics of social relations. Tie strength lists the following: Frequency/frequent contact , Reciprocity, Trust/enforceable trust, Complementarity, Accommodation/adaptation, Indebtedness/imbalance, Collaboration, Transaction investments, Strong history, Fungible skills, Expectations, Social capital
Provenance: A social relationship may be viewed differently by the individual participants of the relationship, sometimes even to the degree that the tie is unreciprocated. Similarly, outsiders may provide different accounts of the relationship, which is a well-known bias in SNA.
Relationship history: Social relationships come into existence by some event involving two individuals
Relationship roles: A social relationship may have a number of social roles associated with it, which we call relationship roles. For example, in a student/professor relationship within a university setting there is one individual playing the role of professor, while another individual is playing the role of a student. Both the relationship and the roles may be limited in their interpretation
19

CP5074 – SNA –UNIT 2
and use to a certain social context.Ideally, all users of all these services would agree to a single shared typology of social relations and shared characterizations of relations. However, this is neither feasible nor necessary. What is required from such a representation is that it is minimal in order to facilitate adoption and that it should preserve key identifying characteristics such as the case of identifying properties for social individuals.
Conceptual model
Social relations could be represented as n-ary predicates; however, n-ary relations are not supported directly by the RDF/OWL languages. There are several alternatives to n-ary relations in RDF/ OWL
In all cases dealing with n-ary relations we employ the technique that is known as reification: we represent the relation as a class, whose instances are concrete relations of that type.
One may recall that RDF itself has a reified representation of statements: the rdf :Statement object represents the class of statements.
This class has three properties that correspond to the components of a statement, namely rdf: subject, rdf :predicate, rdf :object.
These properties are used to link the statement instance to the resources involved in the statement.
In other words relationships become subclasses of the rdf :Statement class. Common is that the new Relationship class is related to a general Parameter class by the hasParameter relationship. Relationship types such as Friendship are subclasses of the Relationship class, while their parameters (such as strength or frequency) are subtypes of the Parameter class.
Two alternatives:The first scheme borrows from the design of OWL-S for representing service parameters, as used in the specification of the profile of a Web Service. Here, parameters are related by the valued-by metaproperty to their range. For example in an application Strength may be a subclass of Parameter valued-by integers. The disadvantage of this solution is that specifying values requires two statements or the introduction of a constructed property.
20

CP5074 – SNA –UNIT 2
The second alternative differs in that the “native “representing meth parameters: the generic Parameter class is defined as a subclass of rdf :Property. This model has the advantage that it becomes more natural to represent parameter values and restrictions on them. The disadvantage is that this solution is not compliant with OWL.
DL Social relations are socially constructed objects: they are constructed in social environments by assigning a label to a common pattern of interaction between individuals.
Cognitive structuring, works by applying the generic pattern we associate with such a relationship to the actual state-of-affairs we observe. For example, a student/professor relationship at the Free University of Amsterdam is defined by the social context of the university and this kind of relationship may not be recognizable outside of the university.
The below figure shows descriptions and Situations ontology design pattern that provides a model of context and allows to clearly delineate these two layers of representation.
Fig. The Descriptions and Situations ontology design pattern
D&S is a generic pattern for modeling non-physical objects whose intended meaning results from statements, i.e. it emerges in combination with other entities. For example, a norm, a plan, or a social role is usually represented as a set of statements and not as a concept.
D&S is an ontology-design pattern in the sense that it is used as a template for creating domain ontologies in complex areas. D & S has been successfully applied in a wide range of real-life ontology engineering projects from representing Service Level Agreements (SLAs) to the descriptions of Web Services.
21