Embed Size (px)
Citation preview

A DETAILED METALLOGENIC STUDY OF THE MCFAULDS LAKE CHROMITE
DEPOSITS, NORTHERN ONTARIO
(Thesis Format: Monograph)
by
Jordan Elliot Laarman
CHAPTER 1: INTRODUCTION
1.1 McFaulds Lake Chromite Deposits 1
1.2 Thesis Objective 1
1.3 Location and Climate 2
1.4 Previous Work 4
1.5 Methods 5
1.5.1 XRF (X-Ray Fluorescence spectrometry) and ICP-MS (Inductively Coupled Plasma-Mass Spectrometry) 6
1.5.2 Full Spectrum PGE analysis 6
1.5.3 Electron Microprobe Analysis 7
1.5.4 Laser Ablation ICP-MS 7
CHAPTER 2: GEOLOGICAL SETTING
2.1 Oxford-Stull Domain 9
2.1.1 McFaulds Lake Greenstone Belt 12
2.2 Deformation 20

CHAPTER 3: PETROGRAPHY
3.1 Introduction 25
3.2 Footwall granodiorite 30
3.3 Dunite-harzburgite 33
3.4 Oikocrystic harzburgite 35
3.5 Disseminated chromite 38
3.6 Chromitite 43
3.6.1 Heavily disseminated chromite 43
3.6.2 Intermittent chromitite beds 43
3.6.3 Semi-massive chromite 45
3.6.4 Massive chromite 53
3.7 Magmatic Breccia 58
3.8 Heterogeneous pyroxenite 63
3.9 Pyroxenite-olivine pyroxenite 63
3.10 Gabbro-leucogabbro 70
3.11 Hangingwall mafic metavolcanic 74
CHAPTER 4: GEOCHEMISTRY
4.1 Introduction 75
4.2 Whole rock geochemistry 75

4.2.1.1 Major oxides 75
iv 4.2.1.2 Up section major oxide variation 78
4.2.1.2.1 Black Label: DDH BT-09-31 78
4.2.1.2.2 Black Thor: DDH BT-08-10 & BT-09-17 81
4.2.1.2.3 Big Daddy: DDH FW-08-19 86
4.2.1.3 Binary major oxide variations 88
4.2.1.3.1 Black Label (Fig. 4.12) 88
4.2.1.3.2 Black Thor (Fig. 4.13) 88
4.2.1.3.3 Big Daddy (Fig. 4.14) 92
4.2.2 Trace element earth geochemistry 94
4.2.2.1 Primitive mantle-normalized multielement plots 94
4.2.2.1.1 Black Label 94
4.2.2.1.2 Black Thor 96
4.2.2.1.3 Big Daddy 99
4.2.2.2 (La/Sm)cn vs. (Gd/Yb)cn 99
4.3 Full spectrum PGE analysis 101
4.3.1 Primitive mantle normalized PGE plots of host rocks 101
4.3.2 Primitive mantle normalized PGE plot of chromitite 103
4.4 Mineral chemistry of host silicates 105
4.4.1 Olivine 105
4.4.2 Pyroxene 105
4.4.3 Amphibole 109
4.4.4 Phlogopite 116
4.4.5 Chlorite 120
CHAPTER 5: MINERALIZATION
5.1 Introduction 130
5.2 Metal assay variation 130
5.2.1 Up section wt. % Cr2O3, Pt, Pd, Ni and Cu ppm variation 130
5.2.1.1 Black Label (Figs. 5.1 and 5.2) 131
5.2.1.2 Black Thor (Figs. 5.3, 5.4, 5.5 and 5.6) 133
5.2.1.3 Big Daddy (Fig. 5.7) 137
5.2.2 Binary metal assay variation 139
5.3 Chromite mineral chemical variation 143
5.3.1 Up section mineral chemistry of chromite 145
5.3.1.1 Black Label 151
5.3.1.2 Black Thor BT-08-10 160
5.3.1.3 Black Thor BT-09-17 161
5.3.1.4 Big Daddy 176
5.3.2.1 Black Label binary chromite chemistry 199
5.3.2.2 Black Thor BT-08-10 binary chromite chemistry 204
5.3.2.3 Black Thor BT-09-17 binary chromite chemistry 209
5.3.2.4 Big Daddy binary chromite chemistry 213
5.4 Laser ablation ICP-MS analysis of chromite 222
5.4.1 Chromite/Chromite in MORB trace element plots 222
5.4.2 Binary trace element variation 224

vCHAPTER 6: DISCUSSION
6.1 Introduction 230
6.2 Tectonic discrimination of chromite 230
6.2.1 The Cr# vs. Mg# plot 230
6.2.2 The Ternary Cr-Fe3+-Al plot 233
6.3 Origin of chromite: An Evaluation of Irvine’s 1975 model 233
6.4 Silicate Inclusions in Chromite 239
6.5 Origin of chromite: Irvine’s 1977 magma mixing model 249
6.6 Evidence for magmatic differentiation by double diffusive convection: The electron microprobe results 255
6.6.1 Magmatic differentiation 255
6.6.2 Double diffusive convection mineralization 257
6.6.3 Formation of massive chromite by post-cumulus growth 261
6.7 Evaluation of the conduit model 264
6.8 Retrogression of chromite with hydration of the intrusion 267
CHAPTER 7: CONCLUSIONS 274
7.1 Conclusions 274
7.2 Summary 277
REFERENCES 281
APPENDIX 1:

Core logs for DDH BT-09-31, BT-08-10, BT-09-17 and FW-08-19 296
APPENDIX 2: Sample List – BT-08-10 315
BT-09-31 & BT-09-17 320
FW-08-19 326
APPENDIX 3: Whole rock geochemistry & Full Spectrum PGE 330
APPENDIX 4: Silicate mineral chemistry data -337 Olivine 338 Orthopyroxene 342 Clinopyroxene 344 Amphibole 350 Phlogopite 377 Chlorite 385
APPENDIX 5: Chromite mineral chemistry data - 401 BT-09-31 402 BT-08-10 423 BT-09-17 439 FW-08-19 442
APPENDIX 6: Chromite laser ablation data
459

List of Figures
viFigure 1.1 Location map of the McFaulds Lake chromite deposits
3 Figure 2.1 Geological map of the Superior Geological Province
10 Figure 2.2 Aeromagnetic map of the Oxford-Stull Domain
11 Figure 2.3 Simplified geological map of the McFaulds Lake area
13 Figure 2.4 Geological map of the Ring of Fire Intrusion 15 Figure 2.5 Generalized stratigraphic column of the Ring of Fire Intrusion 15 Figure 2.6 Geology of the Blackbird chromite deposit 17 Figure 2.7 Geology of the Big Daddy chromite deposit 18 Figure 2.8 Geology of the Black Label and Black Thor chromite deposits 19 Figure 2.9 Quartz monzonite diapirism at the Koitelainen Intrusion 21 Figure 2.10 Drill section through Big Daddy DDH FW-08-19 23 Figure 2.11 Drill section through Black Thor DDH BT-08-10 23 Figure 2.12 Dextral strike-slip faults in the Black Thor chromitites 24 Figure 3.1 Drill section of Black Label DDH BT-09-31 26 Figure 3.2 Drill section of Black Thor DDH BT-08-10 27 Figure 3.3 Drill section of Black Thor DDH BT-09-17 28 Figure 3.4 Drill section of Big Daddy DDH FW-08-19 29 Figure 3.5 Photograph of granodiorite drill core 32 Figure 3.6 Photograph of dunite drill core
32 Figure 3.7 Photomicrograph of dunite with disseminated chromite-a
34 Figure 3.8 Photomicrograph of dunite with disseminated chromite-b
34 Figure 3.9 Pyroxene replacement of dunite in drill core-a
36

viiFigure 3.10 Pyroxene replacement of dunite in drill core-b
36 Figure 3.11 Pyroxene replacement of dunite in drill core-c
37 Figure 3.12 Photograph of oikocrystic harzburgite drill core
37 Figure 3.13 Photomicrograph of tremolitization of pyroxene
39 Figure 3.14 Photomicrograph of primary olivines and pyroxenes in talc
39 Figure 3.15 Photograph of disseminated chromite in dunite 40 Figure 3.16 Photomicrograph of interstitial chromite 40 Figure 3.17 Photomicrograph of net-textured chromite in dunite 41 Figure 3.18 Photomicrograph of interstitial chromite in oikocrystic harzburgite 41 Figure 3.19 Photograph of kaemmererite vein alteration 42 Figure 3.20 Photomicrograph of talc-rimmed olivines in net-textured chromite 42 Figure 3.21 Photograph of an intermittent chromite bed 44 Figure 3.22 Photograph of alternating intermittent chromite beds 44 Figure 3.23 Photograph of cumulus pyroxene interbanded with chromite 46 Figure 3.24 Photograph of net-textured semi-massive chromite 46 Figure 3.25 Photomicrograph of chain-like net-textured chromite 47 Figure 3.26 Photomicrograph of silicate inclusions in chromites 47 Figure 3.27 Photomicrograph of the incomplete annealing of a chromite grain 49 Figure 3.28 Photomicrograph of the concentric annealing of chromite grains 49 Figure 3.29 Backscatter image of multiple silicate inclusions in chromite
50 Figure 3.30 Backscatter image of minerals within a silicate inclusion
50 Figure 3.31 Photomicrograph of silicate inclusions in igneous amphibole
51 Figure 3.32 Backscatter image of silicate inclusions in igneous amphibole
51

viiiFigure 3.33 Photomicrograph of the incomplete annealing of chromite around a phlogopite grain
52 Figure 3.34 Photomicrograph of chromite with interstitital phlogopite
52 Figure 3.35 Photograph of Black Thor massive chromite
54 Figure 3.36 Photograph of Big Daddy massive chromite
54 Figure 3.37 Photograph of oikocrystic pyroxene patches in massive chromite 55 Figure 3.38 Photograph of chicken-track texture of pyroxene in chromite 55 Figure 3.39 Photomicrograph of tremolitized oikocrystic pyroxene in massive chromite 56 Figure 3.40 Photomicrograph of interstitial chlorite in massive chromite 56 Figure 3.41 Photomicrograph of chlorite in brittle failure of massive chromite 56 Figure 3.42 Photograph of Black Label massive chromite 57 Figure 3.43 Photomicrograph of interstitial carbonate in massive chromite 59 Figure 3.44 Photograph of occluded silicate in chromite 59 Figure 3.45 Photograph of silicate layering in massive chromite 60 Figure 3.46 Photograph of deformation fabrics in chromite 60 Figure 3.47 Photomicrograph of adcumulus fracturing in massive chromite 61 Figure 3.48 Photograph of magmatic breccias 61 Figure 3.49 Photograph of sulphides in magmatic breccias 62 Figure 3.50 Photograph of heterogeneous olivine pyroxenite 64 Figure 3.51 Photograph of filter pressed layers in heterogeneous pyroxenite
64 Figure 3.52 Photograph of pyroxenite
65 Figure 3.53 Photograph of original bronzite in pyroxenite
65 Figure 3.54 Photomicrograph of pyroxenite
67

ixFigure 3.55 Photograph of disseminated chromite in pyroxenite
67 Figure 3.56 Photomicrograph of disseminated chromite in pyroxenite
68 Figure 3.57 Green aphyric ultramafic units in pyroxenite
68 Figure 3.58 Photograph of gabbro
71 Figure 3.59 Photomicrograph of green tremolite with surrounding biotite in gabbro 71 Figure 3.60 Photomicrograph of titanite alteration in gabbro 72 Figure 3.61 Photomicrograph of igneous amphibole in gabbro 72 Figure 3.62 Photograph of leucogabbro 73 Figure 4.1 Plot of Mg % vs. depth from assays of Black Label DDH BT-09-31 79 Figure 4.2 Plot of Fe % vs. depth from assays of Black Label DDH BT-09-31 79 Figure 4.3 Plot of Ca % and Al % vs. depth from assays of Black Label DDH BT-09-31 80 Figure 4.4 Plot of Mg % vs. depth from assays of Black Thor DDH BT-08-10 82 Figure 4.5 Plot of Fe % vs. depth from assays of Black Thor DDH BT-08-10 82 Figure 4.6 Plot of Ca % and Al % vs. depth from assays of Black Thor DDH BT-08-10 83 Figure 4.7 Plot of Mg % vs. depth from assays of Black Thor DDH BT-09-17 84 Figure 4.8 Plot of Fe % vs. depth from assays of Black Thor DDH BT-09-17 84 Figure 4.9 Plot of Ca % and Al % vs. depth from assays of Black Thor DDH BT-09-17 85 Figure 4.10 Plot of Ni, Fe %, Mg and Al % vs. depth from assays of Big Daddy DDH FW-08-19 87 Figure 4.11 Plot of Ca % vs. depth from assays of Big Daddy DDH FW-08-19 87 Figure 4.12 Binary plots of Cr vs. Mg, Cr vs. Al, Cr vs. Fe, Al vs. Mg, Fe vs. Mg
and Ca vs. Mg from assays of Black Label DDH BT-09-31.
89
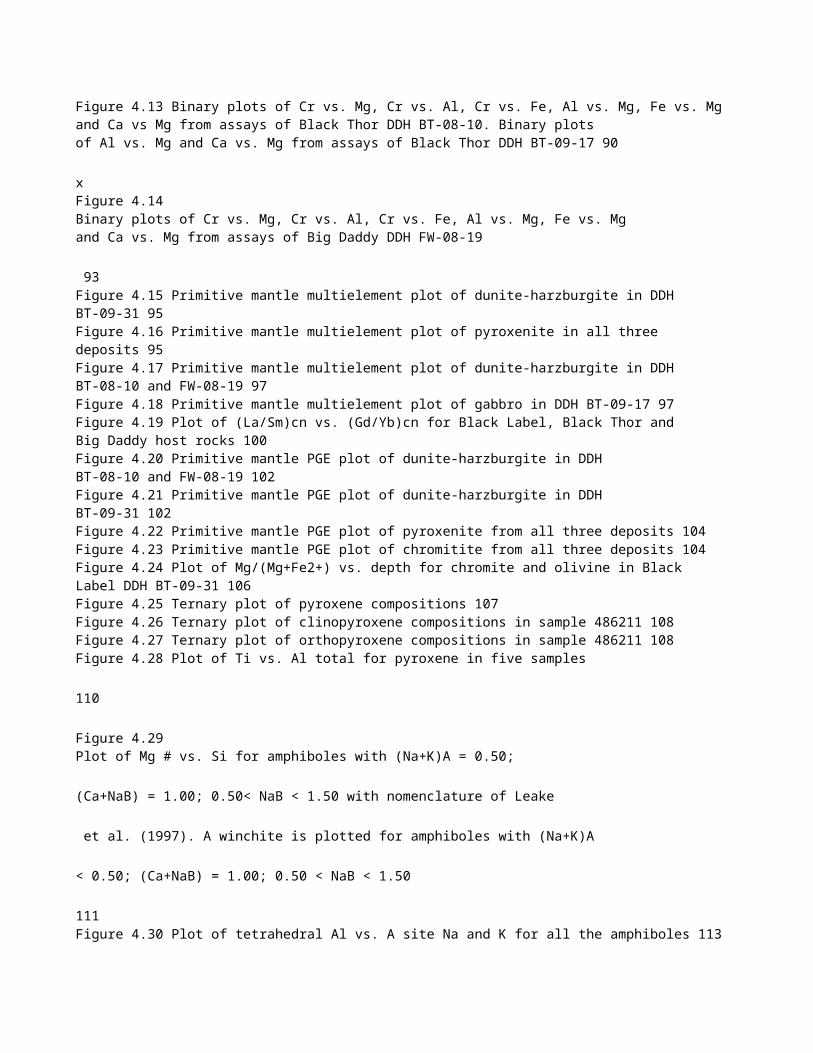
Figure 4.13 Binary plots of Cr vs. Mg, Cr vs. Al, Cr vs. Fe, Al vs. Mg, Fe vs. Mg and Ca vs Mg from assays of Black Thor DDH BT-08-10. Binary plots of Al vs. Mg and Ca vs. Mg from assays of Black Thor DDH BT-09-17 90
xFigure 4.14 Binary plots of Cr vs. Mg, Cr vs. Al, Cr vs. Fe, Al vs. Mg, Fe vs. Mg and Ca vs. Mg from assays of Big Daddy DDH FW-08-19
93 Figure 4.15 Primitive mantle multielement plot of dunite-harzburgite in DDH BT-09-31 95 Figure 4.16 Primitive mantle multielement plot of pyroxenite in all three deposits 95 Figure 4.17 Primitive mantle multielement plot of dunite-harzburgite in DDH BT-08-10 and FW-08-19 97 Figure 4.18 Primitive mantle multielement plot of gabbro in DDH BT-09-17 97 Figure 4.19 Plot of (La/Sm)cn vs. (Gd/Yb)cn for Black Label, Black Thor and Big Daddy host rocks 100 Figure 4.20 Primitive mantle PGE plot of dunite-harzburgite in DDH BT-08-10 and FW-08-19 102 Figure 4.21 Primitive mantle PGE plot of dunite-harzburgite in DDH BT-09-31 102 Figure 4.22 Primitive mantle PGE plot of pyroxenite from all three deposits 104 Figure 4.23 Primitive mantle PGE plot of chromitite from all three deposits 104 Figure 4.24 Plot of Mg/(Mg+Fe2+) vs. depth for chromite and olivine in Black Label DDH BT-09-31 106 Figure 4.25 Ternary plot of pyroxene compositions 107 Figure 4.26 Ternary plot of clinopyroxene compositions in sample 486211 108 Figure 4.27 Ternary plot of orthopyroxene compositions in sample 486211 108 Figure 4.28 Plot of Ti vs. Al total for pyroxene in five samples
110
Figure 4.29 Plot of Mg # vs. Si for amphiboles with (Na+K)A = 0.50;
(Ca+NaB) = 1.00; 0.50< NaB < 1.50 with nomenclature of Leake
et al. (1997). A winchite is plotted for amphiboles with (Na+K)A
< 0.50; (Ca+NaB) = 1.00; 0.50 < NaB < 1.50
111 Figure 4.30 Plot of tetrahedral Al vs. A site Na and K for all the amphiboles 113
xiFigure 4.31 Plot of tetrahedral Al – A site Na and K vs. octahedral Al+2Ti+Cr for all the amphiboles
113 Figure 4.32 Plot of Mg # vs. Si for amphiboles with CaB = 1.50; (Na+K)A > 0.50; Ti < 0.50; AlVI =Fe3+ with nomenclature of Leake et al. (1997) 114 Figure 4.33 Plot of Mg/(Mg+Fe2+) vs. depth (m) for pargasite-edenite in Black Label DDH BT-09-31 115 Figure 4.34 Plot of Mg # vs. Si for amphiboles with CaB = 1.50; (Na+K)A < 0.5 with nomenclature of Leake et al. (1997). 117 Figure 4.35 Plot of wt. % Al2O3 vs. wt. % TiO2 for phlogopite compositions 118 Figure 4.36 Ternary Ba-K-Na plot for phlogopites 119 Figure 4.37 Plot of wt. % MgO vs. depth for phlogopite in Black Label DDH BT-09-31 121 Figure 4.38 Plot of wt. % Cr2O3 vs. depth for phlogopite in Black Label DDH BT-09-31 122 Figure 4.39 Plot of wt. % Cr2O3 vs. wt. % MgO for phlogopite 123 Figure 4.40 Plot of wt. % Cr2O3 vs. wt. % TiO2 for phlogopite 123 Figure 4.41 Classification of McFaulds Lake chlorites after Hey (1954) 124 Figure 4.42 Classification of chlorites in DDH BT-09-31 after Hey (1954) 125 Figure 4.43 Classification of chlorites in DDH BT-08-10 and BT-09-17 after Hey (1954) 126 Figure 4.44 Plot of wt. % Cr2O3 vs. wt. % Al2O3 for chlorite 128 Figure 4.45 Plot of wt. % Cr2O3 vs. wt. % MgO for chlorite 128 Figure 5.1 Plot of Cr2O3, Fe and Pt + Pd vs. depth from assays of Black Label DDH BT-09-31
132 Figure 5.2 Plot of Ni and Cu vs. depth from assays of DDH BT-09-31
132 Figure 5.3 Plot of Cr2O3, Fe and Pt + Pd vs. depth from assays of Black Thor
DDH BT-08-10
134

xiiFigure 5.4 Plot of Ni and Cu vs. depth from assays of DDH BT-08-10
134
Figure 5.5 Plot of Cr2O3, Fe and Pt + Pd vs. depth from assays of Black Thor DDH BT-09-17
135 Figure 5.6 Plot of Ni and Cu vs. depth from assays of DDH BT-09-17
135 Figure 5.7 Plot of Cr2O3, Fe and Pt + Pd vs. depth from assays of Big Daddy DDH FW-08-19 138 Figure 5.8 Binary plots of Ti, V, Zn, Mn and Ni vs. Cr from assays of Black Label DDH BT-09-31 140 Figure 5.9 Binary plots of Ti, V, Zn, Mn and Ni vs. Cr from assays of Black Thor DDH BT-08-10 141 Figure 5.10 Binary plots of Ti, V, Zn, Mn and Ni vs. Cr from assays of Big
Daddy DDH FW-08-19 142 Figure 5.11 Backscatter image of massive chromite with sample points shown 144 Figure 5.12 Backscatter image of sample 486044, chromite #1 with sample
points shown 146 Figure 5.13 Plot of chromite evolution in Black Thor sample 486044, chromite
#1 146 Figure 5.14 Backscatter image of sample 486044, chromite #2 with sample
points shown 147 Figure 5.15 Plot of chromite evolution in Black Thor sample 486044, chromite
#2 147 Figure 5.16 Backscatter image of sample 486129 with sample points shown 148 Figure 5.17 Plot of chromite evolution in Black Thor sample 486129 148 Figure 5.18 Plot of major oxide variation from disseminated to massive
chromite in the chromite cores of the first fifty samples analysed in
Black Thor DDH BT-08-10
150 Figure 5.19 Variation of wt. % major oxide with height up section (down hole)
in Black Thor DDH BT-08-10 for chromite cores of first fifty samples
analysed 150

xiiiFigure 5.20 Plot of Cr2O3 wt. % vs. depth for Black Label DDH BT-09-31 152
Figure 5.21 Plot of MgO wt. % vs. depth for Black Label DDH BT-09-31 with various zones and pulses shown
153 Figure 5.22 Plot of Cr/(Cr+Al+Fe3+) vs. depth for Black Label DDH BT-09-31 154 Figure 5.23 Plot of Mg/(Mg+Fe2+) vs. depth for Black Label DDH BT-09-31 155 Figure 5.24 Plot of FeO wt. % vs. depth for Black Label DDH BT-09-31 156 Figure 5.25 Plot of Cr/Fe vs. depth for Black Label DDH BT-09-31 157 Figure 5.26 Plot of Al2O3 wt. % vs. depth for Black Label DDH BT-09-31 158 Figure 5.27 Plot of Fe2O3 wt. % vs. depth for Black Label DDH BT-09-31 159 Figure 5.28 Plot of Cr/Fe vs. depth for Black Thor DDH BT-08-10 162 Figure 5.29 Plot of MgO wt. % vs. depth for Black Thor DDH BT-08-10 with various zones and pulses shown 163 Figure 5.30 Plot of Mg/(Mg+Fe2+) vs. depth for Black Thor DDH BT-08-10 164 Figure 5.31 Plot of Cr2O3 wt. % vs. depth for Black Thor DDH BT-08-10 165 Figure 5.32 Plot of Cr/(Cr+Al+Fe3+) vs. depth for Black Thor DDH BT-08-10 166 Figure 5.33 Plot of FeO wt. % vs. depth for Black Thor DDH BT-08-10 167 Figure 5.34 Plot of Al2O3 wt. % vs. depth for Black Thor DDH BT-08-10 168 Figure 5.35 Plot of Fe2O3 wt. % vs. depth for Black Thor DDH BT-08-10 169 Figure 5.36 Plot of Cr2O3 wt. % vs. depth for Black Thor DDH BT-09-17 170 Figure 5.37 Plot of MgO wt. % vs. depth for Black Thor DDH BT-09-17 171 Figure 5.38 Plot of Cr/(Cr+Al+Fe3+) vs. depth for Black Thor DDH BT-09-17 172 Figure 5.39 Plot of Mg/(Mg+Fe2+) vs. depth for Black Thor DDH BT-09-17 173 Figure 5.40 Plot of Cr/Fe vs. depth for Black Thor DDH BT-09-17
175 Figure 5.41 Plot of Al2O3 wt. % vs. depth for Black Thor DDH BT-09-17
177 Figure 5.42 Plot of FeO wt. % vs. depth for Black Thor DDH BT-09-17
178
xivFigure 5.43 Plot of Fe2O3 wt. % vs. depth for Black Thor DDH BT-09-17
179 Figure 5.44 Plot of Cr2O3 wt. % vs. depth for the first part of Big Daddy DDH FW-08-19 180 Figure 5.45 Plot of MgO wt. % vs. depth for the first part of Big Daddy DDH FW-08-19 181 Figure 5.46 Plot of Cr/(Cr+Al+Fe3+) vs. depth for the first part of Big Daddy DDH FW-08-19 182 Figure 5.47 Plot of Mg/(Mg+Fe2+) vs. depth for the first part of Big Daddy DDH FW-08-19 183 Figure 5.48 Plot of Cr/Fe vs. depth for the first part of Big Daddy DDH FW-08-19 184 Figure 5.49 Plot of Al2O3 wt. % vs. depth for the first part of Big Daddy DDH FW-08-19 186 Figure 5.50 Plot of FeO wt. % vs. depth for the first part of Big Daddy DDH FW-08-19 187 Figure 5.51 Plot of TiO2 wt. % vs. depth for the first part of Big Daddy DDH FW-08-19 188 Figure 5.52 Plot of Fe2O3 wt. % vs. depth for the first part of Big Daddy DDH
FW-08-19 189 Figure 5.53 Plot of Cr2O3 wt. % vs. depth for Big Daddy DDH FW-08-19 190 Figure 5.54 Plot of MgO wt. % vs. depth for Big Daddy DDH FW-08-19
with various zones and pulses shown 191 Figure 5.55 Plot of Cr/(Cr+Al+Fe3+) vs. depth for Big Daddy DDH FW-08-19 192 Figure 5.56 Plot of Mg/(Mg+Fe2+) vs. depth for Big Daddy DDH FW-08-19 193 Figure 5.57 Plot of Cr/Fe vs. depth for Big Daddy DDH FW-08-19
195 Figure 5.58 Plot of FeO wt. % vs. depth for Big Daddy DDH FW-08-19
196 Figure 5.59 Plot of Al2O3 wt. % vs. depth for Big Daddy DDH FW-08-19
197 Figure 5.60 Plot of Fe2O3 wt. % vs. depth for Big Daddy DDH FW-08-19
198

xvFigure 5.61 Binary plot of Cr2O3 vs. MgO wt. % for Black Label DDH BT-09-31 with paths of chromite evolution shown 200 Figure 5.62 Black Label Layers 1 and 2 of DDH BT-09-31 200 Figure 5.63 Binary plot of Al2O3 vs. MgO wt. % for Black Label DDH BT-09-31 202 Figure 5.64 Binary plot of FeO vs. MgO wt. % for Black Label DDH BT-09-31 202 Figure 5.65 Binary plot of TiO2 vs. Fe2O3 wt. % for Black Label DDH BT-09-31 203 Figure 5.66 Binary plot of TiO2 vs. Cr2O3 wt. % for Black Label DDH BT-09-31 203 Figure 5.67 Binary plot of TiO2 vs. FeO wt. % for Black Label DDH BT-09-31 205 Figure 5.68 Binary plot of ZnO vs. Cr2O3 wt. % for Black Label DDH BT-09-31 205 Figure 5.69 Binary plot of NiO vs. Cr2O3 wt. % for Black Label DDH BT-09-31 206 Figure 5.70 Binary plot of Cr2O3 vs. MgO wt. % for Black Thor DDH BT-08-10 with paths of chromite evolution shown 207 Figure 5.71 Binary plot of Al2O3 vs. MgO wt. % for Black Thor DDH BT-08-10 207 Figure 5.72 Binary plot of FeO vs. MgO wt. % for Black Thor DDH BT-08-10 208 Figure 5.73 Binary plot of TiO2 vs. Cr2O3 wt. % for Black Thor DDH BT-08-10 208 Figure 5.74 Binary plot of ZnO vs. Cr2O3 wt. % for Black Thor DDH BT-08-10 210 Figure 5.75 Binary plot of NiO vs. Cr2O3 wt. % for Black Thor DDH BT-08-10 210

xviFigure 5.76 Binary plot of MnO vs. Cr2O3 wt. % for Black Thor DDH BT-08-10 211
Figure 5.77 Binary plot of Cr2O3 vs. MgO wt. % for Black Thor DDH BT-09-17 with paths of chromite evolution shown
212
Figure 5.78 Binary plot of Al2O3 vs. MgO wt. % for Black Thor DDH BT-09-17 212
Figure 5.79 Binary plot of FeO vs. MgO wt. % for Black Thor DDH BT-09-17 214
Figure 5.80 Binary plot of TiO2 vs. Cr2O3 wt. % for Black Thor DDH BT-09-17 214
Figure 5.81 Binary plot of ZnO vs. Cr2O3 wt. % for Black Thor DDH BT-09-17 215
Figure 5.82 Binary plot of NiO vs. Cr2O3 wt. % for Black Thor DDH BT-09-17 215
Figure 5.83 Binary plot of MnO vs. Cr2O3 wt. % for Black Thor DDH BT-09-17 215
Figure 5.84 Binary plot of Cr2O3 vs. MgO wt. % for Big Daddy DDH FW-08-19 with paths of chromite evolution shown 217
Figure 5.85 Binary plot of Al2O3 vs. MgO wt. % for Big Daddy DDH FW-08-19 217
Figure 5.86 Binary plot of FeO vs. MgO wt. % for Big Daddy DDH FW-08-19 219
Figure 5.87 Binary plot of TiO2 vs. Cr2O3 wt. % for Big Daddy DDH FW-08-19 219
Figure 5.88 Binary plot of ZnO vs. Cr2O3 wt. % for Big Daddy DDH FW-08-19 220

Figure 5.89 Binary plot of NiO vs. Cr2O3 wt. % for Big Daddy DDH FW-08-19 220
Figure 5.90 Binary plot of MnO vs. Cr2O3 wt. % for Big Daddy DDH
FW-08-19 221
xviiFigure 5.94 Chromite in MORB trace element plot of Black Label DDH BT-09-31 223 Figure 5.95 Chromite in MORB trace element plot of Black Thor DDH BT-08-10 223 Figure 5.96 Chromite in MORB trace element plot of Big Daddy DDH FW-08-19 225 Figure 5.97 Binary plots of Cr vs. Ti, V, Zn, Mn, Ni, Co, Sc and Ga ppm for Black Label DDH BT-09-31 226 Figure 5.98 Binary plots of Cr vs. Ti, V, Zn, Mn, Ni, Co, Sc and Ga ppm for Black Thor DDH BT-08-10 227 Figure 5.99 Binary plots of Cr vs. Ti, V, Zn, Mn, Ni, Co, Sc and Ga ppm for Big Daddy DDH FW-08-19 229 Figure 6.1 Cr # vs. Mg # plot of McFaulds Lake chromites with other layered intrusion and komatiite chromites of the world 231 Figure 6.2 Cr # vs. Mg # plot of McFaulds Lake chromites with other chromite deposits of the world 231 Figure 6.3 Ternary Cr-Fe3+-Al plot of the McFaulds Lake chromites with other layered intrusion and komatiite chromites of the world 234 Figure 6.4 The annealing process from Hulbert and Von Gruenewaldt (1985) 241 Figure 6.5 Phase Relations in the System Olivine-Silica-Chromite as determined by Irvine (1977) 251 Figure 6.6 Differing primitive mantle trace element patterns of dunite and pyroxenite 253 Figure 6.7 Differing primitive mantle PGE patterns of dunite and pyroxenite 253 Figure 6.8 Double diffusive convection model 258 Figure 6.9 Double diffusive convection cells in a magma chamber
258 Figure 6.10 Step-wise double diffusive chromite-PGE mineralization
260
Figure 6.11 Figure showing thickness, grade and wt. % Cr in the 36 m-thick ore
zone at Big Daddy 265 Figure 6.12 Residual gravity map with chromitite zones plotted 268
xviiiList of Tables Table 3.1 Summary of drill holes 31 Table 4.1 Major oxide wt. % in DDH samples 76

1CHAPTER 1
INTRODUCTION
1.1 McFaulds Lake Chromite Deposits Three new chromite deposits have been discovered in the McFaulds Lake area of the “Ring of Fire” District in the James Bay Lowlands region of northern Ontario. The largest Black Thor deposit is up to 46 m thick with 40 % Cr2O3 in massive chromitite that extends along strike for 2.6 km. These new discoveries of high grade chromite have associated PGE enrichment and are only exceeded by deposits such as the Bushveld Complex in South Africa, the Great Dyke of Zimbabwe and Kazakhstan for global chromium resources. Historically, the main source of chromite has been in South Africa, however this new resource will allow North America to sustain itself. Mining is planned with a 30 year mine life predicted. This operation will have a major impact on the economic development of Northern Ontario. These new chromite deposits are classified with the group of stratiform magmatic Cr/PGE ores in layered complexes (Duke, 1988). Better understanding of their formation will facilitate stratigraphic correlation, thus instrumental in defining an exploration vector. The occurrence of multiple zones of basal massive vs. disseminated styles of mineralization indicates primary magmatic cumulate concentration of the chromite.
1.2 Thesis Objective The objective of this project is to investigate the origin of the McFaulds Lake chromite deposits. The chromite deposits have undergone an igneous crystallization history that has in turn been modified by a pervasive hydration overprint. Therefore the origin of the chromite deposits involves both a study of the magmatic crystallization of the chromite and the retrogressive hydration that has since modified the grade of the ores. The study provides a detailed geochemical profile of chromite in three deposits: the Black Label, Black Thor and Big Daddy chromitites. It involves petrographic analysis of primary igneous chromite and associated hydrous silicate mineralogy; whole rock

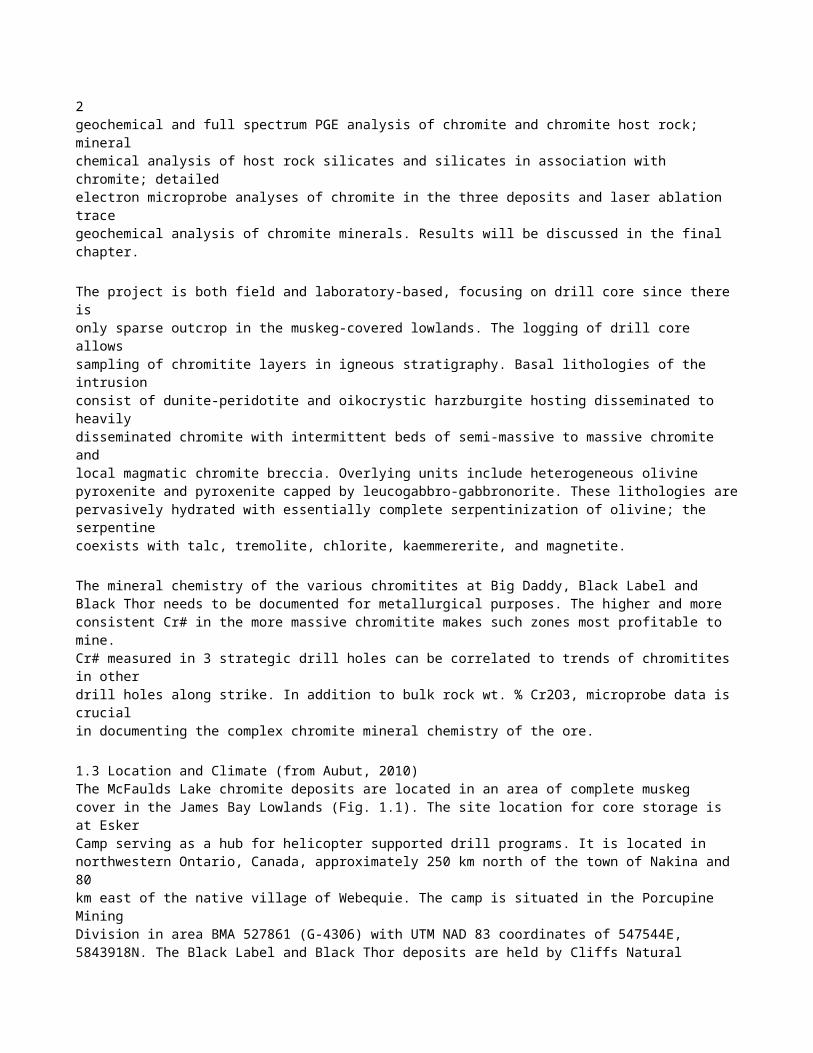
2geochemical and full spectrum PGE analysis of chromite and chromite host rock; mineral chemical analysis of host rock silicates and silicates in association with chromite; detailed electron microprobe analyses of chromite in the three deposits and laser ablation trace geochemical analysis of chromite minerals. Results will be discussed in the final chapter.
The project is both field and laboratory-based, focusing on drill core since there is only sparse outcrop in the muskeg-covered lowlands. The logging of drill core allows sampling of chromitite layers in igneous stratigraphy. Basal lithologies of the intrusion consist of dunite-peridotite and oikocrystic harzburgite hosting disseminated to heavily disseminated chromite with intermittent beds of semi-massive to massive chromite and local magmatic chromite breccia. Overlying units include heterogeneous olivine pyroxenite and pyroxenite capped by leucogabbro-gabbronorite. These lithologies are pervasively hydrated with essentially complete serpentinization of olivine; the serpentine coexists with talc, tremolite, chlorite, kaemmererite, and magnetite.
The mineral chemistry of the various chromitites at Big Daddy, Black Label and Black Thor needs to be documented for metallurgical purposes. The higher and more consistent Cr# in the more massive chromitite makes such zones most profitable to mine. Cr# measured in 3 strategic drill holes can be correlated to trends of chromitites in other drill holes along strike. In addition to bulk rock wt. % Cr2O3, microprobe data is crucial in documenting the complex chromite mineral chemistry of the ore.
1.3 Location and Climate (from Aubut, 2010) The McFaulds Lake chromite deposits are located in an area of complete muskeg cover in the James Bay Lowlands (Fig. 1.1). The site location for core storage is at Esker Camp serving as a hub for helicopter supported drill programs. It is located in northwestern Ontario, Canada, approximately 250 km north of the town of Nakina and 80 km east of the native village of Webequie. The camp is situated in the Porcupine Mining Division in area BMA 527861 (G-4306) with UTM NAD 83 coordinates of 547544E, 5843918N. The Black Label and Black Thor deposits are held by Cliffs Natural Resources Inc. while the Big Daddy deposit is 75 % owned by Cliffs and 25 % owned by KWG Resources Inc.
The James Bay Lowlands area has a typical continental climate with extreme temperature fluctuations from the winter to summer seasons. During the summer months

3Figure 1.1. Location map of the McFaulds Lake chromite deposits. Source from www.kwgresources.com.

4this can be moderated by the maritime effects of James and Hudson Bays. Summer temperatures range between 10ºC and 35ºC, with a mean temperature of 13ºC in July. Winter temperatures usually range between -10ºC and -55ºC with an average January temperature of -23ºC. Lakes typically freeze-up in mid-October and break-up is usually in mid-April. The region usually receives approximately 610 mm of precipitation per year, with about 1/3 originating as snow during the winter months. On a yearly basis the area averages about 160 days of precipitation per year.
1.4 Previous Work Previous work relevant to this thesis include several investigations that provide petrographic and microprobe data in private company reports, NI-43-101 reports are available on both the Black Label-Black Thor and Big Daddy deposits (Aubut, 2010, 2012; Barrie, 2010; Gowens, 2009; Karagas, 2009; Metsaranta, 2010, 2011, 2012; Scoates, 2008a, 2008b, 2009a, 2009b; Tuchscherer, 2010). The junior companies involved in this early phase of work before being bought out by Cliffs Natural Resources Inc. include: Freewest Resources Inc. which held Black Label-Black Thor, Spider Resources Inc. who owned 25 % of Big Daddy and KWG Resources Inc. still owns 25 % of Big Daddy. The drilling of Black Label-Black Thor was carried out by Freewest Resources Inc. while Big Daddy was first drilled by Spider-KWG. The drilling history relevant to the drill holes of this study is as follows: In November 2008, DDH BT-08-10 was drilled as one of the first holes that cored Black Label-Black Thor. Subsequent drilling programs containing DDH BT-08-17 and BT-09-31 were drilled in the winter of 2008-2009. DDH FW-08-19 was drilled as one of the first nineteen drill holes at Big Daddy in the winter of 2008. Drilling continued in 2008 for DDH FW-08-05 to FW-0823 and up to FW-09-60 into 2009. The drill program for Black Label-Black Thor continued in 2009 to DDH BT-09-113. The 2010 Black Thor holes drilled under Cliffs’ operation include DDH BT-10-114 to BT-10-174. The 2011 Black Label-Black Thor drill holes include DDH BT-11-175 to BT-11-203. Big Daddy drilling under Cliffs’ operation occurred in fall-winter 2011-2012 for DDH FW-11-61 to FW-11-112.
During the early 2008-2009 drill programs by Freewest and Spider-KWG, several technical reports were written on the petrography and preliminary whole rock assays of the host rocks and chromitites to Black Label-Black Thor and Big Daddy (Scoates,

52008b, 2009a, b). This preliminary work involved the first classification of the host rocks and chromitites for drilling purposes and included considerable detailed petrographic descriptions supplemented with hand sample and thin section photographs, as well as core logging notes that proved useful for the petrography chapter of this thesis. Scoates (2008a) cites several whole rock analyses similar to the whole rock geochemistry reported in this thesis.
As a component of the 2008 Freewest drill program, XRF, XRD and SEM-EDS analyses were performed on 27 samples from three drill holes. Sixty-nine single element determinations were performed by Karagas (2009). These analyses provided the initial framework for the undertaking of electron microprobe work reported in this thesis. Other technical reports that proved useful included the technical draft drill report to Freewest by Tuchscherer et al. (2010), an NI-43-101 on Black Label-Black Thor by Aubut (2010) of the Sibley Basin Group, and NI-43-101 reports on Big Daddy by Gowens (2009) of Micon International Ltd. and by Aubut (2012). Whole rock geochemical and metal assay data was provided by Spider-KWG and Freewest for the 3 strategic drill holes chosen for this study. Barrie (2010) reported on PGE mineralogy of the Black Thor deposit. Tuchscherer (2010) compiled a map of the Black Label-Black Thor zones on the basis of drill core information and a similar map was also provided by Spider-KWG. Metsaranta (2010, 2011 and 2012) has several reports for Summary of Field Work of the Ontario Geological Survey and these were considered in the writing of the geology chapter.
1.5 Methods The four holes drilled by Freewest Resources and Spider-KWG Resources, including BT-08-10, BT-09-17, BT-09-31 and FW-08-19 were logged by the author. Representative lithologies were sampled for petrographic, whole rock XRF (X-ray Fluoresence Spectrometry) and ICP-MS (Inductively Coupled Plasma – Mass Spectrometry), electron microprobe mineral, laser ablation ICP-MS and full spectrum PGE analyses. Details of the logging and number of samples analysed are found in the following chapters. Polished thin sections of 30 µm thickness were made for petrographic and mineral chemical analysis, 100 µm thick slides were made for the laser ablation work.
61.5.1 XRF (X-Ray Fluorescence Spectrometry) and ICP-MS (Inductively Coupled Plasma-Mass Spectrometry) The samples chosen for XRF and ICP-MS were first slabbed and polished thin sections were made for preliminary examination of texture and mineralogy utilizing both transmitted and reflected light microscopy. The rock samples were later crushed into powders and analysed by XRF and ICP at Activation Laboratories in Ancaster, Ontario. Sample preparation included the crushing to a nominal minus 10 mesh (1.7 mm), mechanically split (riffled) and then pulverized to 95 % minus 150 mesh (105 microns). In preparation for XRF whole rock geochemical analysis, the samples were homogenized by lithium metaborate/tetraborate fusion. The resulting molten beads were rapidly digested in a weak nitric acid solution and then were analysed by XRF and ICP. A base metal suite and sulphide sulphur were determined on an aquia regia extraction with an ICP/OES (Inductively Coupled Plasma-Optical Emission Spectroscopy) finish. For the aquia regia extraction, a combination of concentrated hydrochloric and nitric acids were used to leach total sulphide, oxide and silicate. A partial extraction was also analysed by ICP-MS for lower detection limits. ICP-MS analysis was also employed on samples for trace elements and REE. In preparation, these samples were again reduced by lithium metaborate/tetraborate fusion into beads that were digested in weak nitric acid to be analysed by ICP-MS.
1.5.2 Full spectrum PGE analysis The same samples analysed by XRF and ICP were analysed for full spectrum PGE along with six other samples. Nickel sulphide fire assay was carried out on 50 g samples. The samples were fired at 1100 degrees C whereby nickel sulphide droplets scavenged the PGE and formed buttons at the bottom of the crucible. The nickel sulphide buttons were dissolved in concentrated HCl and the resulting residues which contained all the PGE and Au were collected on a filter paper. This residue undergoes 2 irradiations and 3 separate counts to measure all the PGE and Au. An INAA (Instrumental Neutron Activation Analysis) finish was later performed on the samples. Elements of Os, Ir, Ru, Rh, Pt, Pd, Au and Re were analysed with the respective detection limits of 2, 0.1, 5, 0.2, 5, 2 and 0.5 ppb.

71.5.3 Electron Microprobe Analysis Electron microprobe analysis was performed on over 300 samples mostly by R.L. Barnett Geoanalytical Consulting Ltd using a JEOL Model 733 electron microprobe equipped with five wavelength spectrometers and using the Tracor Northern Automation System. A subset of the 300 samples was further analysed by Jim Renaud of Renaud Geological Consulting Ltd using a similar JEOL Model 733 microprobe. Thin sections were carbon coated to prevent charging during analysis. Samples were analysed with an accelerating voltage of 45 kV, a beam current of 10 nÅ and an electron beam width of 2 µm. Standards from the Smithsonian Institute were used to calibrate for Si, Ti, Al, Cr, Fe, Mn, Mg, Zn and Ni. Ferrous/ferric recalculations were later made for Fe.
1.5.4 Laser Ablation ICP-MS Laser ablation ICP-MS was performed on 37 samples at the Geological Survey of Canada facility in Ottawa, Ontario under the supervision of Simon Jackson. Analyses were made on 100µm thick polished thin sections. The thick sections were necessary to reduce spalling and allow longer ablation times to improve detection limits. Before analysis in Ottawa, an internal standard of FeOT was needed for calibration to correct for variable ablation yield. Accordingly, polished chromites were analysed by microprobe for FeOT before the LA ICP-MS analysis. After the microprobe work, the carbon coating was removed from the sections so as to not interfere with the LA analyses. Scans were made and circles drawn on the thin sections for select chromite grains prior to and in order to speed up the choice of grains for ablating. The laser ablation was conducted on a Photon-Machines Analyte 193 excimer laser ablation system (.=193 nm) with a Helex ablation cell and an Agilent 7700x quadrupole ICP-MS. The software package used for data reduction was GLITTERTM. The analyses were conducted using a 69 µm or an 86 µm spot size, a 14 Hz frequency, 40 % of 5 mJ energy during a total acquisition of 100 seconds (~40 seconds for the gas blank and ~60 seconds for the chromite). In addition to the trace elements analysed (Sc45, Ti47, Ti49, V51, Mn55, Co59, Ni60, Zn66, Ga69, Ga71), other elements (Mg25, Al27, Si29, Ca42, Cr53, Fe57, Cu63, Cu65, Ge73, As75, Sr88, Y89, Zr90, Zr91, Nb93, Mo95, Mo98, Ru99, Ru101, Ru102, Rh103, Ru104, Pd105, In115, Sn118, Sb121, La139, Ce140, Yb174, Hf178, Ta181, W182, Os189, Ir191, Os192, Ir193, Pt195, Pb206, Pb207, Pb208, Th232, U238) were monitored during chromite ablation to control the nature of the ablated

8material by identifying contaminants like the presence of included phases. Care was taken in selecting isotopes where there was no interference with argides and where there was acceptable range in uncertainty. For those elements where there were two isotopes, the isotopes that were chosen that had a lower range of uncertainty were Ti49, Ga71, Zr91, Mo95 and Pb206. For other elements with two isotopes, isotopes chosen on a basis of no interference with argides were Ru102, Ir193, Os192, and Cu63. Standards used for calibration include GSE-1G and Po726 for sulphide. The standards GOR 128 and BCR2G were used for quality control standard and blanks.
9CHAPTER 2 GEOLOGICAL SETTING
2.1 Oxford-Stull Domain The McFaulds Lake chromite deposits are hosted in the Ring of Fire Intrusion, located in the McFaulds Lake Greenstone Belt in Northern Ontario. Regionally, this greenstone belt is located in the Oxford-Stull Domain of the former Sachigo Subprovince in the greater Archean Superior Province (Fig. 2.1). The Neoarchean 2870-2707 Ma. Oxford-Stull Domain is interpreted to form an intracratonic rift setting separating the Mesoarchean North Caribou Terrane from the more northerly Hudson Bay Terrane (Stott et al. 2010).
The Oxford-Stull Domain is a WNW-ESE striking granite-greenstone terrane that is bounded to the north by the North Kenyon Fault and to the south by the Stull-Wunnummin and Gods Lake Narrows shear zones. The latter are known to host several lode gold occurrences (Tuchscherer et. al, 2009; Fig. 2.2). A larger SSW-NNE oriented unknown fault also cross-cuts the terrane in the region of the Ring of Fire Intrusion (Vaillancourt, 2003). These same faults control the emplacement of other mafic intrusions in the region, including the Highbank Lake-Fishtrap Lake intrusive complex and the Winiskisis Channel gabbros (Metsaranta and Houlé, 2012). The eastern extension of the terrane is the La Grande Domain in Quebec which hosts chromite occurrences in the Menarik Complex (Stott et al., 2010; Houlé, 2000; fig. 2.1).
The Big Trout Lake Complex, which is 50 km to the ESE, is a layered intrusion in the Sachigo Greenstone Belt that may have formed in a similar setting to the Ring of Fire Intrusion. It consists of a basal peridotite zone overlain by an anorthosite to quartz gabbro and finally monzodiorite. The peridotite intruded as two distinct magmas in 5 pulses: 1 pulse forming lower peridotite followed by 4 pulses forming upper peridotite higher in stratigraphy. The peridotite is generally olive green due to its high olivine

10Figure 2.1. Geological map of the Superior Geological Province. The Oxford-Stull Domain is found within the large dashed box. Another near-contemporaneous chromite deposit is the Menarik Complex in the La Grande Domain (outlined in small box). From Houle, Lesher and Metsaranta (2012).

Figure 2.2. Aeromagnetic map of the Oxford-Stull Domain showing emplacement of intrusios along large WNW-ESE striking crustal faults. The Ring of Fire Intrusion is outlined in the box. From James Bay Resources Ltd. Website.
11
12content, contains poikilitic orthopyroxene with interlayers of chromitite and magmatic sulphides occurring at the base of the pulses. The one pulse of lower peridotite has a trend of increasing olivine content with stratigraphic height due to the presence of poikilitic orthopyroxene in its lower portion. Chromitite layers increase towards the base. It is distinguished from the other pulses by greater increasing (MgO+FeO)/Al2O3 with SiO2/Al2O3 that parallels lesser increasing (MgO+FeO)/Al2O3 with SiO2/Al2O3 for the successive pulses (Borthwick, 1984).
The Oxford-Stull Domain is made up of granitoids and greenstones that form dome and keel structures where the supracrustal greenstone belts (keels) wrap around central granitoid batholiths (domes). The batholith in the Winisk Lake-Muketei River area is an unnamed quartz monzonite to trondhjemite with sinuous bodies of quartz diorite in the Muketei River Area (Thurston et al., 1979). Such quartz monzonite diapirs have been described in other parts of the world such as in the 2.8 Ga Kiviaapa Dome to the Koitelainen Intrusion and associated chromite deposits in Finland (Mutanen and Huhma, 2001 and Mutanen, 1997). Metsaranta and Houlé (2010) describe the pluton in the Muketei River Area as a foliated biotite tonalite to granodiorite with cross-cutting tonalite to quartz diorite bodies indicating multiple intrusive ages. Since there is the presence of both biotite and amphibole varieties of tonalite, TTG (tonalite-trondhjemitegranodiorite) suites in the North Caribou Terrane form from varying degrees of combined melting of garnet-amphibolite subducting slabs and hornblende-dominated fractional crystallization (Wyman et al., 2011). This batholith is the basement to the Ring of Fire Intrusion. The granodiorite has a determined age of 2773.4±0.9Ma (Mungall et al., 2010). Observation of drill core has shown it to be younger than the intrusion (see petrography chapter). However, there are biotite xenoliths in the granodiorite that are possibly from an older basement crust. The basement Kiviaapa batholith to the Koitelainen Intrusion has been described by Mutanen (1997) to be a biotite-plagioclase mica gneiss. There may be a similar foliated basement TTG to the Ring of Fire Intrusion.
2.1.1 McFaulds Lake Greenstone Belt Volcanism began in the McFaulds Lake Greenstone Belt with the eruption of various successions of mafic to felsic dominanted volcanics defining five different packages (Fig. 2.3).

1315
[
Figure 2.3. Simplified geological map of the McFaulds Lake area showing distribution of the supracrustal packages. From Metsaranta and Houlé (2012).

14The Muketei River supracrustal package is both footwall and hangingwall to the synvolcanic Ring of Fire Intrusion. Locally, lower mafic volcanic and gabbros have been found in the footwall to the Blackbird and Black Horse chromitites to the east of the granodiorite contact. Volcanism began ca. 2770.7±0.8 Ma with the eruption of footwall mafic volcanics (Mungall, Azar and Hamilton, 2011). Although geochemistry has not been determined, the mafic volcanics are probably ocean floor MORB volcanics similar to such MORB basalts of the Hayes River Group in the western part of the Oxford-Stull Domain. The mafic volcanics locally show pillowed facies with intercalated cherty iron formation (Metsaranta and Houlé, 2011).
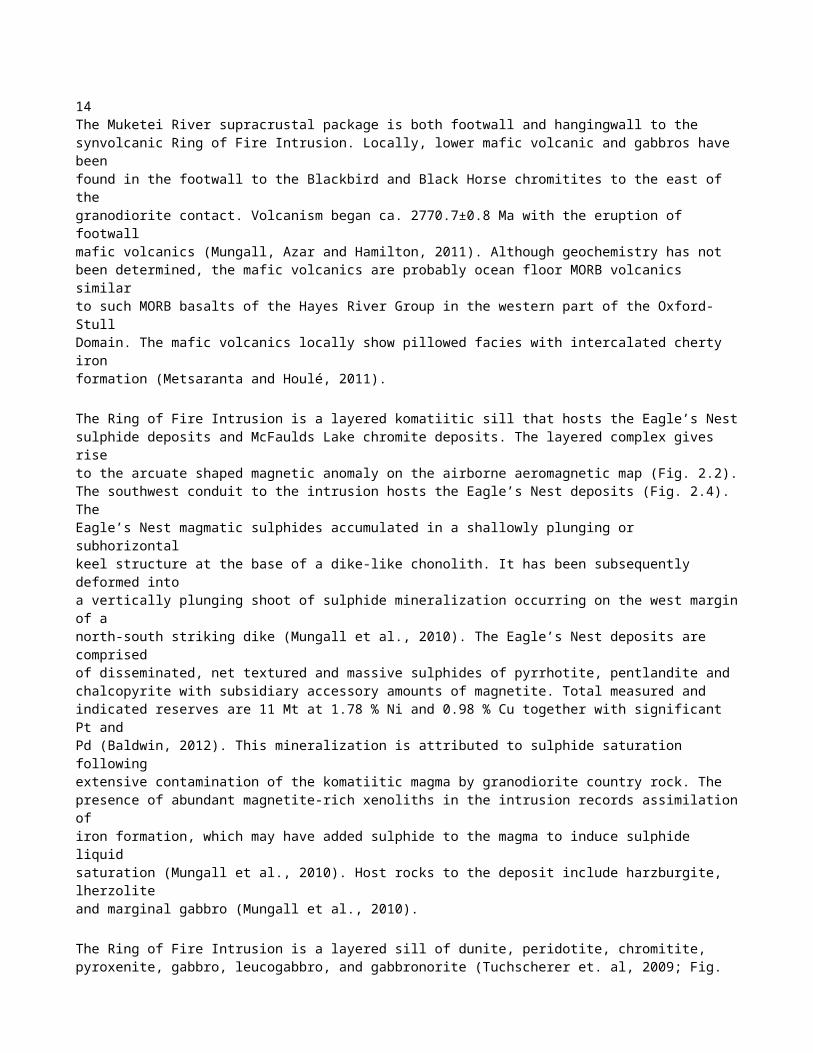
The Ring of Fire Intrusion is a layered komatiitic sill that hosts the Eagle’s Nest sulphide deposits and McFaulds Lake chromite deposits. The layered complex gives rise to the arcuate shaped magnetic anomaly on the airborne aeromagnetic map (Fig. 2.2). The southwest conduit to the intrusion hosts the Eagle’s Nest deposits (Fig. 2.4). The Eagle’s Nest magmatic sulphides accumulated in a shallowly plunging or subhorizontal keel structure at the base of a dike-like chonolith. It has been subsequently deformed into a vertically plunging shoot of sulphide mineralization occurring on the west margin of a north-south striking dike (Mungall et al., 2010). The Eagle’s Nest deposits are comprised of disseminated, net textured and massive sulphides of pyrrhotite, pentlandite and chalcopyrite with subsidiary accessory amounts of magnetite. Total measured and indicated reserves are 11 Mt at 1.78 % Ni and 0.98 % Cu together with significant Pt and Pd (Baldwin, 2012). This mineralization is attributed to sulphide saturation following extensive contamination of the komatiitic magma by granodiorite country rock. The presence of abundant magnetite-rich xenoliths in the intrusion records assimilation of iron formation, which may have added sulphide to the magma to induce sulphide liquid saturation (Mungall et al., 2010). Host rocks to the deposit include harzburgite, lherzolite and marginal gabbro (Mungall et al., 2010).
The Ring of Fire Intrusion is a layered sill of dunite, peridotite, chromitite, pyroxenite, gabbro, leucogabbro, and gabbronorite (Tuchscherer et. al, 2009; Fig. 2.5). This ultramafic complex is up to 500 metres thick and has been traced for over 15 kilometres along strike (Aubut, 2012; Fig. 2.4). The Blackbird chromite deposit occurs within the main dunite sequence near the Eagle’s Nest deposit. This deposit comprises a

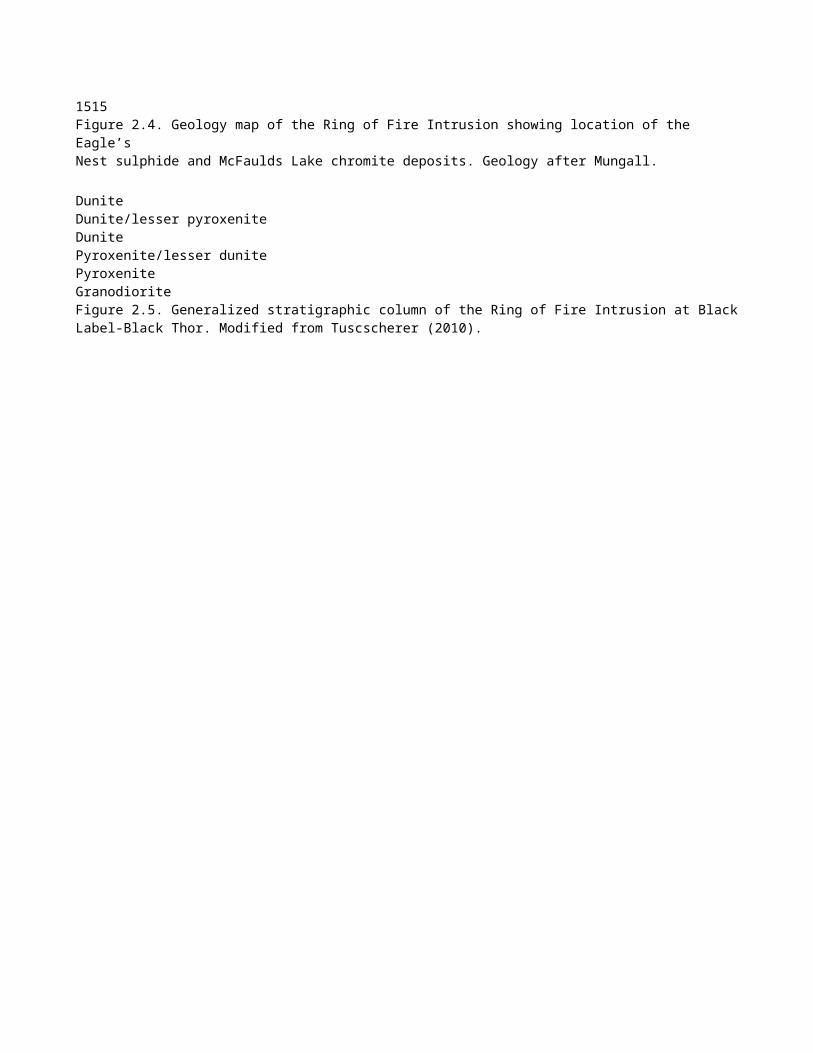
1515Figure 2.4. Geology map of the Ring of Fire Intrusion showing location of the Eagle’s Nest sulphide and McFaulds Lake chromite deposits. Geology after Mungall.
Dunite Dunite/lesser pyroxenite Dunite Pyroxenite/lesser dunite Pyroxenite Granodiorite Figure 2.5. Generalized stratigraphic column of the Ring of Fire Intrusion at Black Label-Black Thor. Modified from Tuscscherer (2010).

16series of steeply dipping chromitite lenses that have been overturned and young to the east (Fig. 2.6). Cr/(Cr+Al) ratios of chromite cores show little variability with an average value of 0.68 for all five zones in the Blackbird deposit (Azar and Mungall, 2010). Detailed electron microprobe analysis of chromite cores reveals Cr/(Cr +Al) atomic ratios from 0.63-0.77 and Mg/(Mg + Fe2+) atomic ratios from 0.12-0.62 (Azar, 2010). Generally Cr/(Cr +Al) is positively correlated with the Mg-number. The chromitites have been hypothesized to have formed as a result of assimilation of banded iron formation by a picritic ultramafic magma (Mungall, 2008).
The Black Horse and Big Daddy chromite deposits occur 5 km north of Blackbird and 3 km south of Black Thor. The Big Daddy deposit was the first chromite deposit discovered in the area and has a measured and indicated resource of 37.4 Mt at 28.5 % Cr2O3 (Aubut, 2012). This deposit is stratiform between lower dunite and overlying pyroxenite (Fig. 2.7). Various types of chromite mineralization have been observed including disseminated chromite (1 to 20% chromite), semi-massive chromite and massive >80% chromite. The main chromitite layer is up to 60 m thick and has been traced over 1.4 km along strike (Aubut, 2012). The chromite is present as fine euhedral grains typically 100 to 200 µm within peridotite and in the higher grade portions within dunite. Chromite may be intensely fractured, with internal veinlets and spherical inclusions of silicate gangue (SGS Minerals Services, 2009 in Aubut, 2012).
The Black Creek and Black Label-Black Thor mineralization occurs 3 km northeast of Big Daddy. The Black Label deposits occur below the main dunite layer that hosts the Big Daddy deposit and so was an earlier mineralizing event (Fig. 2.8). The Black Label Chromite Zone has been drilled for over 2.2 km along strike. It is cross-cut by a pyroxenitic body to the north. Chromite is generally fine grained and disseminated in peridotite, locally forming chromite-bearing magmatic breccias and semi-massive bands to massive chromitite bands. Silicate fragments, in the form of rip up clasts and as ovoid blebs indicate chromite concentration in a highly dynamic magmatic environment. Fine-grained disseminated sulphides are locally associated with the chromitite bands (Aubut, 2010).
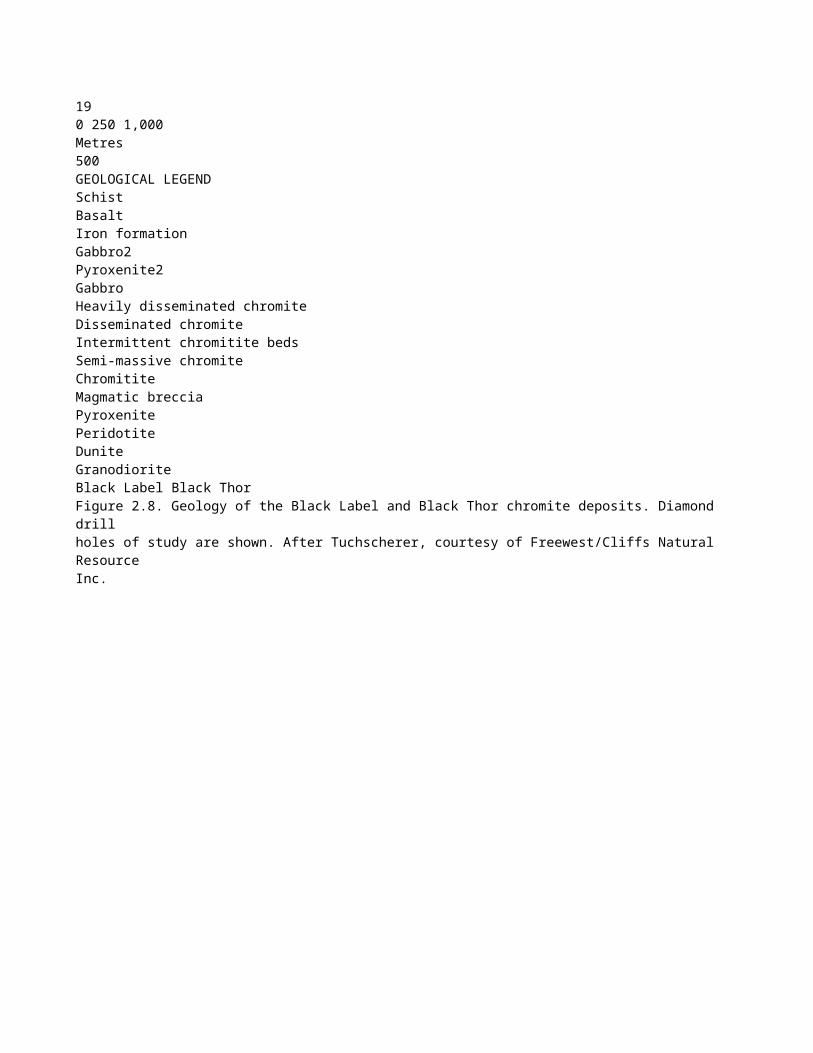
The Black Thor deposit has been traced along strike 2.6 km. It is the most extensive chromite bearing body in the region. It has a measured and indicated resource

17Figure 2.6. Geology of the Blackbird chromite deposit showing distribution of chromitite lenses. From Azar and Mungall (2010).

FW-08-19 18FW-08-19 18Figure 2.7. Geology of the Big Daddy chromite deposit. The chromite is between dunite and pyroxenite in orange. Diamond drill hole of study is shown. Map courtesy of KWG Resources Inc.

190 250 1,000 Metres 500 GEOLOGICAL LEGEND Schist Basalt Iron formation Gabbro2 Pyroxenite2 Gabbro Heavily disseminated chromite Disseminated chromite Intermittent chromitite beds Semi-massive chromite Chromitite Magmatic breccia Pyroxenite Peridotite Dunite Granodiorite Black Label Black Thor Figure 2.8. Geology of the Black Label and Black Thor chromite deposits. Diamond drill holes of study are shown. After Tuchscherer, courtesy of Freewest/Cliffs Natural Resource Inc.

20of 111.9 Mt at 30.9 % Cr2O3 (Cliffs Natural Resources Inc., 2012 Annual Report, p. 54). It strikes SW/NE and has an overturned sub-vertical dip ranging between 70 and 85 degrees NW. The zone typically contains two chromitite layers (lower and upper) that can range in thickness from 10’s of meters to over 100 m (i.e. DDH BT-09-37; Aubut, 2010). These layers are separated by a band of disseminated chromite in peridotite/dunite. Host lithologies consist of serpentinized peridotite, serpentinized dunite, dunite, and pyroxenite. The chromite is present as fine to heavily disseminated chromite in dunite/peridotite, intermittent chromite beds and semi-massive to massive chromitite. Because of its lateral continuity and uniformity the Black Thor chromite mineralization was likely deposited in a quiescent magmatic environment (Aubut, 2010). The leucogabbro at the top of the Big Daddy-Black Thor stratigraphy grades into the mafic volcanics of the Muketei River package. Hydration of the Ring of Fire Intrusion caused retrogression of the olivine and pyroxene to greenschist facies serpentine, talc, tremolite, chlorite, kaemmererite with trace to minor associated magnetite, sausserite, zoisite and titanite.
Overlying intermediate volcanics have been age dated at 2737±7 Ma (Rayner and Stott, 2005). The volcanics are composed of fine-grained tuff, rare coarse-tuff breccias and more flow-like lithologies (Metsaranta and Houlé, 2011). These volcanics are host to the McFaulds Lake VMS deposits. Intrusion of the mafic-dominated Thunderbird intrusion to the east of the Ring of Fire Intrusion was coeval with intermediate to felsic volcanism. This intrusion is one of a series of mafic intrusions in the area that are composed of gabbro-anorthosite-ferrogabbro±pyroxenite (Metsaranta and Houlé, 2011). An age of 2734.5±1.0 Ma has been determined for the ferrogabbro (Mungall et al., 2010). Significant V-Ti-Fe mineralization has been discovered In the Thunderbird intrusion.
2.2 Deformation The Muketei River supracrustal package overlying the Ring of Fire Intrusion is overturned by the doming of the basement granodiorite batholith. An age of 2696±3 Ma has been determined from granodiorite within the core of the batholith (Rayner and Stott, 2005). The central granodiorite represents the age of “Kenoran” diapiric plutonism. Quartz monzonite diapirism is inferred to occur proximal to other intrusions such as the Koitelainen Intrusion and associated chromite deposits in Finland (Fig. 2.9). The Ring of

21Figure 2.9. Quartz monzonite diapirism occurred in the vicinity of the Koitelainen Intrusion and associated chromite deposits in Finland. This is a similar scenario to the granodiorite diapirism in the vicinity of the Ring of Fire Intrusion. From Mutanen (1997).

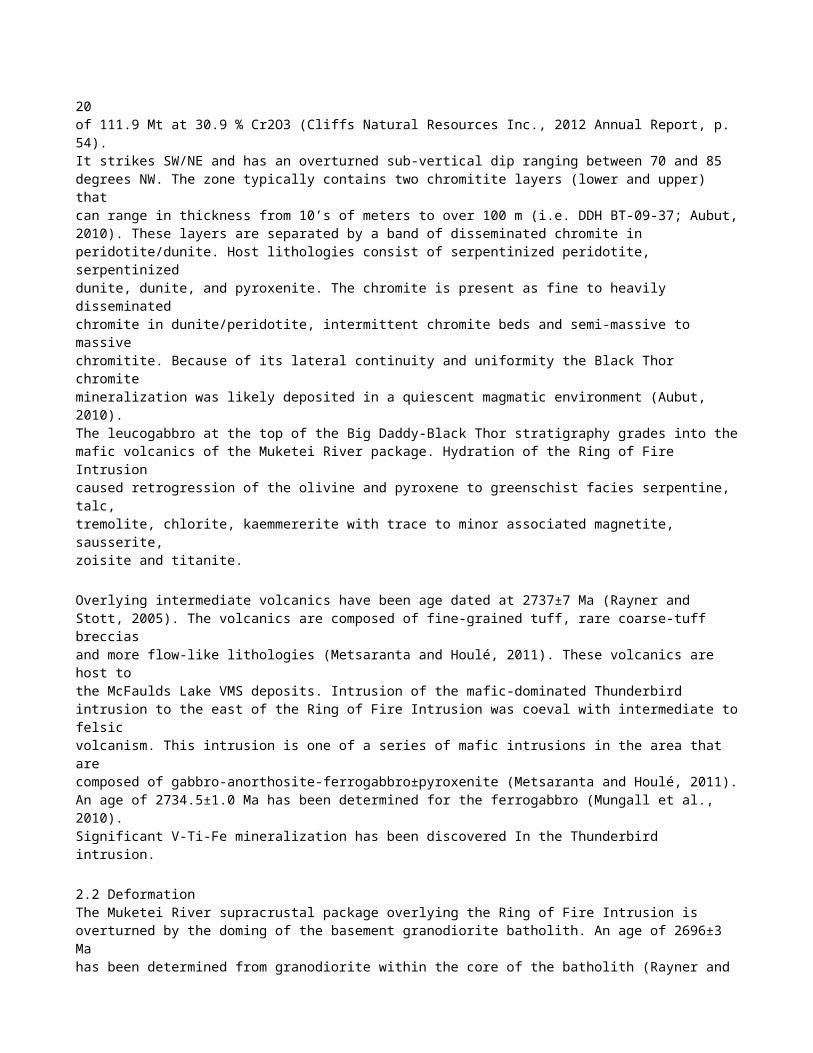
22Fire Intrusion hosting the chromitite dips steeply to the east as at Big Daddy or is overturned steeply to the west as at Black Label and Black Thor (Figs. 2.10 and 2.11). There is dextral strike-slip displacement of stratigraphic units in the intrusion (Fig. 2.12). The highest chromite layer in the eastern part of the Black Thor stratigraphy intersected in DDH BT-09-37 is a major zone of questionable provenance. This chromitite unit does not have a western extension and is bounded by mylonite. Late faults transecting the deposits give rise to incoherent fault gouges, fault breccias, coherent cataclastic breccias and ductile phyllonitic and mylonitic shear zones (Poulsen, 2010). Foliation fabrics are developed in serpentinized units. Late aphanitic green and grey to brown micaceous to amphibole and feldspar-bearing lamprophyric dikes commonly intrude along these areas of structural weakness.
23Figure 2.10. Drill section through Big Daddy DDH FW-08-19 showing the intrusion is plunging to the east, looking northeast.
Figure 2.11. Drill section through Black Thor DDH BT08-10 showing the intrusion is plunging to the west, looking northeast.

24Figure 2.12. Dextral strike-slip faults offset some of the Black Thor chromitites such as the Upper-Upper zone chromitite in the northeast part of the Black Thor sequence. From Poulsen (2010).
25CHAPTER 3
PETROGRAPHY
3.1 Introduction This petrographic study of the McFaulds Lake chromite deposits entails both host lithologies to the chromite as well as the different styles of chromite mineralization. In order to define the host rock igneous stratigraphy, 13 drill holes were logged and photographs taken of key textures. Logging commenced in September 2009 and at this time 3 strategic holes were selected, one from each of the 3 deposits Black Label, Black Thor and Big Daddy. Detailed sampling resulted in selecting 600 samples of representative drill core. These are Black Label DDH BT-09-31, Black Thor BT-08-10 and BT-09-17 and Big Daddy FW-08-19 (Figs. 3.1 to 3.4; see figures 2.7 and 2.8 for drill plan, Appendix 1 for core logs and Appendix 2 for sample #s). Thirteen additional drill holes were logged over the summer of 2010 at McFaulds Lake, these were sited on the same section line as the initial strategic holes chosen for study. All three strategic holes were re-examined at this time to better detail the textures of the lithologies hosting the chromitite intervals. DDH BT-09-17 was re-examined in the summer of 2011 to characterize the uppermost chromitite hosted in leucogabbro. From June 2011 to March 2012, 53 drill holes were logged in conjunction with infill drill programs performed by Cliffs Natural Resources Inc. on the Black Label, Black Thor and Big Daddy chromite deposits. Further textures of lithologies and mineralization were documented and photographed to supplement the petrographic analysis. The petrographic investigation of the lithologies was carried out in April/May 2011 and in the summer-fall of 2012. Finally, textures of granodiorite and lamprophyres were investigated on a drill program for the Black Horse chromitite for KWG/Bold Ventures Inc. in the spring of 2013. Lithologies and chromitites in order of stratigraphy are as follows:

-
30Hangingwall mafic metavolcanic Gabbro-leucogabbro Pyroxenite-olivine pyroxenite Heterogeneous pyroxenite Magmatic breccias Massive chromite Semi-massive chromite Intermittent chromitite beds Heavily disseminated chromite Chromitite Disseminated chromite Oikocrystic harzburgite Dunite-harzburgite Footwall granodiorite
The characteristics of the lithologies from various drill holes that represent the three deposits are described below. The thin section descriptions from the 4 drill holes are supported by microprobe analyses. A list of all the drill holes with collar information are in Table 3.1.
3.2 Footwall granodiorite Granodiorite forms the footwall rock to the west of the Ring of Fire Intrusion. The lithology is a massively textured, coarse-grained, quartz-rich hornblende granodiorite. There is up to 30 modal % coarse 1 cm hornblende or finer biotite, about 20 modal % quartz and 40-50 modal % feldspar with equal proportions of plagioclase and orthoclase (Fig. 3.5). The feldspars form tabular crystals up to 1 cm in size. Pink granodiorite commonly grades into more salt and pepper quartz diorite. This phase comprises 20 % quartz, 40 % feldspar and 30 % biotite or hornblende. Rounded quartz to tabular feldspar phenocrysts are up to 0.7 cm, sheafy interstitial hornblende is up to 1 cm sized crystals.
As observed in DDH BT-09-62, the dunite at the contact with granodiorite is highly silicified suggesting assimilation of silica at the contact with the intrusion. Close examination of the granodiorite contact with the ultramafic intrusion demonstrates the granodiorite is likely younger than the intrusion and not older basement gneiss. At the Black Horse chromitite (DDH FNCB-13-031 at 412.50 m), 0.4 cm acicular actinolite

33occurs as randomly oriented crystals in pyroxenite in contact with granodiorite. Actinolite growth in the bordering pyroxenite suggest thermal metamorphism due to heat from intruding granodiorite. Coarse rounded blue quartz crystals occur near the granodiorite contact. These quartz crystals are similar to silicified ultramafic occurring at the contact in DDH BT-09-62 at Black Label. The blue quartz may be a silica overprint from the granodiorite intrusion, rather than an assimilation texture.
Notably, the western granodiorite typically exhibits a fresh, undeformed equigranular texture in contrast to gneissic basement. Also, several small granodiorite dikes have been observed cross-cutting the dunite in DDH FNCB-13-033. As seen in DDH FNCB-13-031, FNCB-13-030 and FNCB-13-032, there is a bull quartz zone in a shear zone bordered by biotite and then chlorite alteration into pyroxenite. This is analogous to the occurrence of younger granodiorite along a major fault zone such as the late post-tectonic stocks to the Destor Porcupine Fault Zone in the Abitibi Greenstone Belt (Kishida, 1984). Biotite alteration of pyroxenite suggests potassic metasomatic fluids from the granodiorite. Also, biotite xenoliths observed in the granodiorite (eg. at 514.33m in DDH FNCB-13-031) are possible assimilated basement TTG inclusions by the granodiorite. Such xenoliths are probably similar to those observed in the quartz monzonite diapir to the Koitelainen Intrusion in Finland (Fig. 2.9). For geochemistry, on the CaO/(Na2O+K2O) vs. SiO2 plot from Feng and Kerrich (1992), a single granodiorite sample from Azar (2010) plots in the field of the syntectonic tonalite-granodioritegranite-quartz monzodiorite series (TGGM) of the Round Lake Batholith to the Larder Lake Group in the Abitibi Greenstone Belt. These are in contrast to the older synvolcanic TTG which have higher CaO/(Na2O+K2O) and SiO2 contents.
3.3 Dunite-harzburgite At Black Thor and Black Label, dunite is composed of totally serpentinized olivine. Serpentinization of the dunite results in: 1) a light green colour of a highly weathered unit; 2) a variation of aqua green to dark green colour with foliated dark blue/black iowaite vein alteration; 3) a uniform dark/black; 4) or a uniform apple green colour (Lesher and Houle, 2011) – see figs. 3.6, 3.7). Ultra fine magnetite is ubiquitous in the serpentine (Fig. 3.8). Notably, the primary meso to adcumulate textures are well preserved. Fine to medium grained round cumulus olivines form massive cumulates

35cross-cut by serpentine-carbonate veins and scattered magnetite veinlets. Often there is very fine cumulus chromite interstitial to olivine forming “olivine-chromite heteradcumulate.” Interstitial magnetite occurs as a result of replacement of primary cumulus chromite in heteradcumulate and may signify chromite replacement to magnetite during serpentinization.
With increasing orthopyroxene, the dunite becomes harzburgite. The harzburgite is similarly serpentinized, characteristically dark grey to green in colour. Intercumulus anhedral pyroxene envelopes the olivine, most commonly occurring as an olivine-rich meso to orthocumulate. Compositionally the harzburgite zones from near total olivine to an 85:15 olivine to pyroxene ratio. Often there is increasing metasomatic pyroxene after the primary pyroxene which gives patchy replacement of olivine. This is evident by textures of medium to coarse patchy encroachment of pyroxene on protolith textures of fine, often white talc-altered, round cumulus olivines in holes BT-11-197 and FW-11-87 (Figs. 3.9, 3.10 and 3.11). This leads to the talc/tremolite replacement on the rinds of olivine observed in sample 486234 at 183.4 m in DDH BT-09-31. Notably, metasomatic pyroxene was probed and results are presented by the mineral chemistry of pyroxene in the geochemistry chapter.
3.4 Oikocrystic harzburgite Oikocrystic harzburgite occurs above the main dunite sequence and below the chromitites of the Black Label deposit and occasionally within the Black Thor sequence. Serpentinized, fine cumulus olivine is surrounded by coarse, up to 1.5 cm diameter, pyroxene oikocrysts that account for 35 modal % of the rock (Fig. 3.12). Oikocrystic harzburgite often occurs in dunite-peridotite sequences above previous pyroxenite, such as in DDH FW-09-34. The occurrence of common intercumulus minerals suggests the presence of larger amounts of pore liquid material surrounding the cumulus olivine. Jackson (1961), in his observation of the Stillwater Intrusion in Wager and Brown (1967), noted that in areas where the amount of pore material was greatest, there was a higher rate of crystal accumulation in the basin. Therefore, the intercumulus textures must have formed in a more dynamic system which suggests the Black Label harzburgites and chromitites formed under faster rates of crystallization. Like dunite, the oikocrystic harzburgite occasionally contains interstitial very fine cumulus chromite.

38In thin section, the serpentinized olivine is enveloped by talcose and tremolitized, replaced pyroxene. Incipient to pervasive replacement by highly birefringent tremolite occurs along the cleavage planes of the pyroxenes (Fig. 3.13). Electron microprobe analysis of the tremolite shows Cr-bearing tremolite and non Cr-bearing tremolite. The rarer Cr-bearing tremolites indicate chromite replacement to magnetite during hydration supplied Cr content to the enveloping orthopyroxene. The few primary olivines, pleochroic brown orthopyroxenes and igneous amphiboles microprobed have grains yielding Fo #s of 83-90 for cumulus olivine and Mg #s of 0.87-0.99 for cumulus orthopyroxene (Fig. 3.14).
3.5 Disseminated chromite In the chromite mineralized dunite, fine grained cumulus olivine is bordered by very fine, interstitial, cumulus chromite (Fig. 3.15). There is typically 5 to 10 modal % disseminated chromite that occurs as interstitial chromite and thin bands. Up to 15 modal % light grey intercumulus pyroxene accompanies the olivine. The interstitial chromite often concentrates to form mm-scale layers. In thin section, minute equant intercumulus chromites rim larger serpentinized cumulus olivine, thereby showing that it is second to crystallize after olivine (Fig. 3.16). Intercumulus chromite is ofter associated with and altered to brown platy chlorite grains after orthopyroxene (Fig. 3.17). Only rarely is chromite included in olivine. The interstitial chromite is included within intercumulus pyroxene indicating chromite crystallization before pyroxene (Fig. 3.18). The concentric growth of fine cumulus chromite around olivine clearly demonstrates crystallization next after olivine prior the pyroxene. Pyroxene crystallized as oikocrysts around the chromite that rims the olivine. The order of crystallization for both dunite and oikocrystic harzburgite is: cumulus olivine . cumulus chromite . intercumulus orthopyroxene.
Some of the intercumulus orthopyroxene has been hydrated to chlorite. This chlorite has been confirmed by electron microprobe to be either chromian chlorite or kaemmererite (for Cr2O3 of over 7 wt. %; Fig. 3.19). Orthopyroxene has also been hydrated to talc as many of the olivines are surrounded by talc rims and then chromite (Fig. 3.20). The talc was originally primary intercumulus pyroxene.
433.6 Chromitite 3.6.1 Heavily disseminated chromite As with weak disseminated chromite described above, heavily disseminated chromite also occurs interstitial to cumulus olivine. Heavily disseminated chromite accounts for 25 to 40 modal %. At basal contacts with the massive chromitite there is usually an increase in chromite to 50 modal %. The interstitial chromite is either disseminated or weakly layered/foliated. The host generally is harzburgite with cumulus olivines within intercumulus pyroxene. Intercumulus pyroxene minerals is darker grey and commonly metasomatically replaces the cumulus olivine in patches throughout the unit (Figs. 3.9 to 3.11). The olivine and pyroxene is pervasively serpentinized, tremolitized and replaced by talc. Talc after the intercumulus pyroxene continues to replace olivine until olivine is completely ghostly-grey talc-altered. The presence of talc suggests there were CO2 fluids involved in the hydration of the pyroxene.
3.6.2 Intermittent chromitite beds Intermittent chromitite beds generally, but not always, occur between disseminated and semi-massive to massive chromite sequences. These beds range from 10 to up to 30 cm in thickness. Intermittent silicate layers form up to 50 cm to 1 m intervals of dunite, or pyroxenite, often with disseminated chromite. Disseminated chromite in intervening silicate layers generally contain 25 to 30 modal % chromite. Hole DDH BT-10-128 intersected large-scale, 3 m thick, massively textured intermittent chromitite beds separated by metre-scale sections of pyroxenite. These beds have contacts and internal bands that well display primary igneous layering. The igneous layers are later deformed, however, the primary layering often does not reflect the foliation and plunge of the chromite ore shoots. The chromite textures are well preserved, in contrast to the silicate lithologies. Chromite is not easily replaced, is denser and more resistant to alteration than the surrounding olivines and pyroxenes.
As well displayed in DDH BT-08-10, the intermittent beds often have sharp basal and grade upward into dunite. Excellent top directions are defined by sharp basal massive chromitite contacts against cumulate dunite hosting minor intercumulus chromite (Fig. 3.21). Upward increasing nodular olivine concentrates until cumulus olivine forms dunite with diminishing intercumulus chromite, followed by another knife sharp contact
45at the base of overlying massive chromitite (Fig. 3.22). The beds of sharp lower massive chromite grading upward into interstitial chromite with increasing cumulus olivine are a result of the settling of chromite layers (Kaçira, 1971). Higher up in the section, there are cumulus contacts below the lower and above the upper contacts of the chromite layers indicating a change in the order of crystallization from olivine back into chromite. Then higher up, the beds are reversely graded with coarser cumulus olivine grading up to fine interstitial chromite with sharp lower contacts of the chromite with the next cycle. This demonstrates dominant crystallization in the olivine field followed by chromite. Intermittent chromitite beds also show crystallization of cumulus chromite plus pyroxene where pyroxene is the dominant host silicate before the overlying chromitite interval. An example would be the layered beds with cumulus pyroxene in DDH BT-09-17 (Fig. 3.23).
3.6.3 Semi-massive chromite Semi-massive chromite is olivine or pyroxene cumulate with 45 to 70 modal % chromite (Fig. 3.24). Interstitial very fine cumulus chromite is disseminated within cumulus olivine and/or pyroxene or as groundmass to dispersed cumulus olivine and/or pyroxene. Layering is common, with up to 5 cm wide chromite bands. Disseminated chromite grades to heavily disseminated to semi-massive, and finally to massive chromite. There is no general pattern as to the location of the various types of chromitite.
An excellent example of semi-massive chromite in thin section is the Black Label chromitite of BT-09-31. This chromitite has high silicate content, the chromite occurs in chain-like textures interstitial to serpentinized olivine (Fig. 3.25). These chromites contain more silicate inclusions, atoll textures, which are swiss cheese-like holes in the chromite containing silicate (Fig. 3.26). The silicate inclusions at 155 m depth have the same cleavage plane orientations as the surrounding tremolite, suggesting the chromites underwent subsequent growth or annealing around the host silicate. Annealing/sintering is a reequilibration of chromite around silicate melt has been postulated for the origin of the swiss cheese-like textures in the Bushveld chromites (Hulbert and Von Gruenewaldt, 1985). These silicate inclusions have been investigated by detailed microprobe analyses. They are of serpentine or tremolite composition, sometimes with the occurrence of both mineral inclusions in one chromite grain. In some cases, either single chromites, or a few

48fine chromites grown concentrically together, appear to partially envelop silicate from the host rock (Figs. 3.27 and 3.28). The incomplete growth of chromite around the silicate shows that the chromite primarily crystallized in equilibrium with the surrounding silicate
i.e. the olivine dunite. In some cases, the sintering would occur after cumulus olivinepyroxene-chromite segregation as some of the chromites envelop both serpentine (after olivine) and tremolite (after pyroxene). The investigation of silicate inclusions demonstrates a larger range in mineral species than has been reported in other chromites in the world. In addition to serpentine and tremolite there are inclusions of Na-Ca amphibole, Ca amphibole, K and Naphlogopite, chromian diopside, Ni sulphide and even albite. The silicate inclusions often have unique compositions, as in the case of Na-phlogopite and albite, and are often different than the cumulus minerals (Fig. 3.29). A single inclusion can contain igneous amphibole (edenite) that displays retrogressive zoning to tremolite, along with the occurrence of albite and phlogopite (Fig. 3.30). The suite of minerals constitute melt inclusions that show a unique crystallization environment within the inclusion. In some cases, however, amphibole such as pargasite can occur both within host cumulates and within silicate inclusions in the chromite. Sample 486163 at 155 m in DDH BT-09-31 shows relic igneous amphibole in cumulate hosting chromite with silicate inclusions of the same igneous amphibole composition (Figs. 3.31 and 3.32). Chromite probably encapsulated residual melt that crystallized at lower temperatures. Phlogopite analysed in the host cumulates is less Na-bearing than phlogopite in the silicate inclusions. Some textures suggest phlogopite was also incorporated by the growing chromite rather than being crystallized from fluids post entrapment. Sample 486353 at 260.6 m in DDH BT09-31 shows chromite growing around a phlogopite grain (Fig. 3.33). Chromite in association with igneous amphibole and phlogopite is found in other stratiform intrusions such as the Stillwater Complex (Page and Zientek, 1987). In sample 486352 at 260.2 m in DDH BT-09-31, there is the common association of chromite with surrounding phlogopite (Fig. 3.34).
The silicate inclusions generally form large spheres within most chromite grains. Silicate inclusions of different composition can inhabit growth planes in larger chromites. The size of these central “swiss cheese” inclusions and also nature of growth within the

53chromite suggests they were intimately encapsulated as melt while chromite was growing. Chromite encapsulates amphibole, serpentinized olivine and tremolitized pyroxenes by sintering. The melt responsible for the inclusions was residual within the crystal mushes. There are often fractures around the inclusions and entry points where melt was encapsulated in chromite. Negative crystal outlines of the inclusions reflect the cubic symmetry of the host chromite. There was probably also the later H2O autohydration inclusions. More details in the discussion of the silicate inclusions are provided in chapter 6.
3.6.4 Massive chromite Massive chromitite is composed of mesocumulus to adcumulus fine grained granular chromite with minor intercumulus tremolite after pyroxene. At Black Thor, the lower chromitites, between dunite and olivine pyroxenite, are the highest grade with over 90 modal % chromite and contain fewer oikocrystic pyroxene (Fig. 3.35). The Big Daddy chromitite is similarly high grade as Black Thor (Fig. 3.36). Chromitites with more intercumulus pyroxene show textures of lighter coloured/less dense chromite-bearing intercumulus pyroxene patches in a darker/more dense chromitite adcumulate (Fig. 3.37). The oikocrysts usually occur as large 1.5 to 5 cm wide patches of white to grey depending on the concentration of included chromite. In some chromitites, there are occasional chicken track textures of intercumulus pyroxene networks lacing the chromite (Fig. 3.38). In thin section, the lighter coloured areas of the intercumulus pyroxene in the massive chromite is characterized by birefringent tremolite after pyroxene. The darker areas contain lesser altered tremolitized pyroxene (Fig. 3.39). Clinochlore, is locally observed as a minor hydration product of original orthopyroxene (Fig. 3.40). Chromian clinochlore preferentially occurs where there has been brittle failure of original chromite (Fig. 3.41).
The Black Label chromitites are more heterogeneous than the Black Thor chromitites and contain wavy, lensoidal and magmatic breccia textures indicating a dynamic depositional environment (Fig. 3.42). Within the chromitites, the lighter areas often appear as single cleaved oikocrysts overgrowing cumulus aggregates of olivine and pyroxene. The lower Black Label (Layer 1) chromitite contains up to 15-20 modal % oikocrystic pyroxene and cumulus olivine content, identifying host pyroxene-oikocrystic

58cumulus olivine harzburgite. Not all pyroxene is oikocryst, some occurs as large amoeboid patches in both Black Label and Black Thor chromitite. Some of the massive chromitites also contain interstitial carbonate after pyroxene which is probably magnesite (Fig. 3.43).
Often massive chromitites contain round aggregates of either olivine or pyroxene (Fig. 3.44). Pyroxene aggregates in the chromitites appear medium grey whereas cumulus aggregates of olivine appear white. The pyroxene hosts disseminated cumulus chromite whereas the olivine does not. The silicate aggregates commonly form singular “beaded” to composite layers, signifying primary magmatic layering.(Fig. 3.45).
Other features of massive chromitite include common deformation fabrics, rare hematite alteration and a variety of veins. Foliations commonly overprint the primary magmatic fabrics near faulted contacts (Fig. 3.46). In thin section, deformation is often represented in the incipient fracturing of adcumulus chromite that may be a result of compaction (Fig. 3.47). Chromitites are often wholesale hematite-altered as seen by the red-brown colouration of the ores (Fig. 3.44). Thin talc-carbonate-serpentine veinlets are often scattered within chromitites due to volume expansion related to serpentinization. Some of the veins have kaemmererite on the fracture coatings, which is a chromian chlorite alteration of the chromite (Fig. 3.19).
3.7 Magmatic Breccia A few drill holes at Black Label intersect magmatic breccia developed after crystallization of chromitite. In DDH BT-11-176, the magmatic breccia occurs after the Layer 2 massive chromitite in the transition from oikocrystic harzburgite to dunite. Magmatic breccia consists of rounded up to 6 cm fragments of dunite in a lighter coloured pyroxenite and olivine matrix. Proportion of clasts to matrix is 70:30 or higher with variable clast size. This unit is chromite mineralized with occasional up to 5 cm massive chromitite clasts (Figure 3.48). This unit is also occasionally sulphide mineralized with interstitial pyrrhotite-pentlandite-chalcopyrite, disseminations and veinlets ranging from 0.5 to up to 8 modal % (Fig. 3.49).
In DDH BT-11-179, magmatic breccia occurs after the Layer 1 massive chromitite in the transition from oikocrystic harzburgite to heterogeneous pyroxenite. The fragments are dominantly fine grained cumulus olivine with intercumulus pyroxene.

63The host is serpentinized pyroxene-oikocrystic harzburgite and individual oikocrysts range up to 2 cm in size. From 290.40 to 290.70 m, there is coarse wispy pentlandite in serpentinized dunite. Light grey pyroxenite occurs from 297.10 to 298.62 m. Then there is oikocrystic magmatic breccia with more intercumulus pyroxene content and finer olivine clasts to 306 m. Patchy chromite is disseminated in this section ranging up to 8 Cr % in a few 1.5 m intervals.
3.8 Heterogeneous pyroxenite Heterogeneous pyroxenite is dark green and light grey-coloured and ranges from olivine orthopyroxenite to harzburgite that consists of 50:50 dark olivine to light grey orthopyroxene (Fig. 3.50). Olivine forms fine to medium grained cumulus aggregates in diffuse patches up to 1 cm in size. Orthopyroxene occurs as light grey, up to 3 mm, sheafy cumulus minerals that have been tremolitized. The patchy association of pyroxene with olivine has been interpreted by Lesher (pers. communication, 2011), to be the result of replacement of primary olivine by a pyroxenitic magma. Like the textures of dunite-harzburgite, there is coarse patchy encroachment of pyroxene on fine cumulus olivine.
Occasionally cumulus olivine occurs as filter pressed layers within a pyroxene groundmass that may show a fabric orientation (Fig. 3.51). This filter pressed layering is probably formed as pyroxene melt was pressed out leaving behind thin compact olivine layers. Evidence of this being a form of compaction is the common occurrence of this layered olivine pyroxenite at the upper contacts of chromitites below major pyroxenite sequences, before the units grade into pyroxenite. The new pulse of pyroxenite would press the underlying olivine into layers within the unit.
3.9 Pyroxenite-olivine pyroxenite Pyroxenites above the main chromitite zones are light grey medium to coarse grained massive units composed of sheafy to tabular, cumulus pyroxene (Fig. 3.52). The units locally have a cumulus olivine content ranging from 10 to up to 35 modal %. In areas where olivine pyroxenite is present, the crystallization sequence is dunite . chromitite • olivine pyroxenite . pyroxenite. Otherwise crystallization is dunite . chromitite • pyroxenite.

66The pyroxenites have a variety of textures. Medium grained pyroxenite is commonly comprised of orthopyroxene. Occasionally, bronzite primocrysts make up segments of FW-12-108 (Fig. 3.53). Medium grey pyroxenite is mostly composed of light grey tremolitized pyroxene. Wholesale replacement by green radial fibrous tremolite can eradicate original pyroxene. In the bronzitite of FW-12-108, the tremolitization of pyroxenes is displayed by minor veinlets (Fig. 3.53). Coarse grained pyroxenite is commonly foliated and altered to talc. Large sections of the coarse grained talcose pyroxenite has pink hematite alteration. Rather commonly large 1.5 cm, rounded poikilitic pyroxene megacrysts enclose medium grained pyroxene. Poikilitic pyroxene accounts for 8 to 15 modal % of the composition and are identified by a darker, somewhat ghostly appearance.
Near the contacts with overlying leucogabbro, the pyroxenite is mylonitized and distinguished from the leucogabbro in that it is more greenish in colour contains no feldspar content. Leucogabbro, in contrast, is grey in colour with feldspar. It is unclear if the pyroxenes in pyroxenite occur in a cumulus fabric as similar textures have been reported in Pykes Hill komatiitic pyroxenites which could have a metasomatic origin (Lesher, pers. communication 2011). Under thin section, pyroxenite comprises tabular, anhedral, haphazardly oriented pyroxene that has been pervasively talcose-altered and incipiently tremolitized (Fig. 3.54). Tremolite usually occurs along the cleavage planes of pyroxene minerals that has been pseudomorphed by fine masses of talc. The pyroxenites are usually devoid of interstitial chromite and cap the chromitite sequences.
Although they cap the sequences, it is still argued that the pyroxenite is related to chromite mineralization. In DDH BT-10-17, pyroxenite above the first chromite sequence (above the initial dunite) and the pyroxenite in pyroxenite-chromitite-dunite cycles higher up in stratigraphy contain wispy interstitial and bands of chromite grading up to cumulus pyroxene in some of the cycles (Fig. 3.55). In thin section, the chromite in pyroxenite occurs in a vermicular habit and is retrogressed at the margins in contrast to regular euhedral chromite (Fig. 3.56). This is similar to the vermicular habit of pyroxenite-bearing chromites in ophiolites (Matsumoto and Arai, 2001). The gradation of chromite to pyroxene probably indicates the pyroxenes are cumulus within these chromitite zones. The occurrence of chromite mineralization with pyroxenite above the
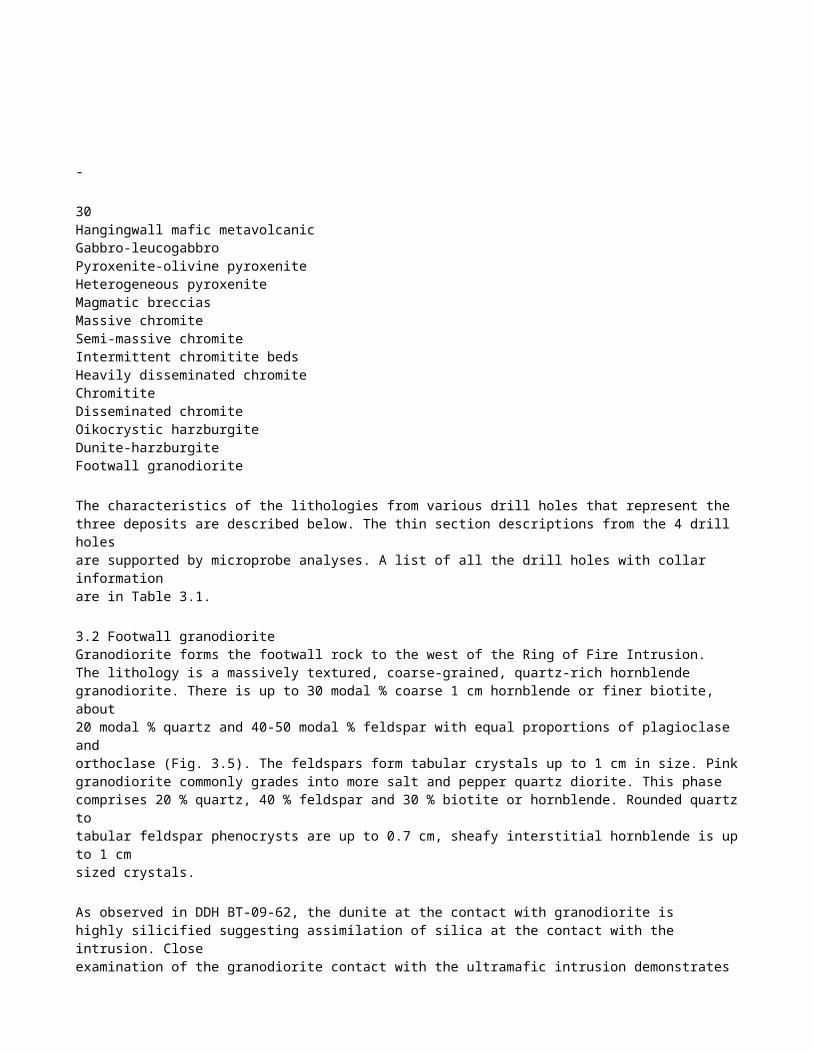
69dunite is probably indicative of chromite mineralizing with a pulse of pyroxenite. The occurrence of chromitite above the pyroxenite can be explained by additions of new pulses of dunite overlying the pyroxenite. All this is more akin to a mixture of magmas involved with mineralization as proposed by Irvine (1977) and Irvine et al. (1983). In thin section, the chromites in the pyroxenites, although inferred to be cumulus, do not display igneous textures since the minerals have been obliterated at the edges and within the grains by replacement pyroxene.
There are sometimes green, aphanitic chloritized to talc-altered aphyric layers within the pyroxenite. Often these layers are found near the tops of the pyroxenites proximal to the leucogabbro, but have also been found within the pyroxenite sequences. The interlayers mostly have a green aphanitic chloritized groundmass that may contain a few plagioclase phenocrysts in clumps (Fig. 3.57). These layers have been interpreted to be komatiite by Lesher, C.M. (pers. communication, 2011). Sometimes there are plagioclase phenocrysts in the layers as shown by white, up to 0.5cm wide augen to oval shaped aggregates foliated in the pyroxenites at the tops of massive pyroxenite sequences. Weathering of the feldspars leaves behind vesicles in an orange weathered and talcose altered interlayer. Examples of these drill holes include DDH FW-12-93, -94, -97, -106, and -112.
Another examination of these green aphyric units shows that they are products of the hornfelsing of lamprophyre dikes against pyroxenite. In DDH FNCB-13-032, there is an abundance of these units in a pyroxenite interval from 667 to 672 m depth in the hole. Ultramafic-mafic dikes are described as consisting of light aqua-green, aphyric, aphanitic chlorite with sharp margins with pyroxenite. In larger dike sets, there is first green chlorite at the contact with pyroxenite and dark brown very fine grained biotite alteration in the interiors of the dikes. Then inner from the biotite zone is a fresh textured amphibole-feldspar fine grained lamprophyre dike. So zoning is from pyroxenite . talc phyllonite pyroxenite . sharp contact . green chlorite . brown biotite . amphibolefeldspar mafic dike to . brown biotite . green chlorite . sharp contact . talc phyllonite pyroxenite . pyroxenite. The green chlorite-biotite seen in these units is therefore the thermal aureole of a lamprophyre dike on the pyroxenite.

703.10 Gabbro-Leucogabbro In DDH BT-09-17, there is biotite gabbro cross-cutting the chromitite in the upper parts of the Black Thor deposit. The unit is a salt and pepper textured, medium- to coarse-grained, massive gabbro that contains dominant white cumulus plagioclase and lesser green rounded up to 5 mm cumulus tremolite after early crystallizing orthopyroxene (Fig. 3.58). The green tremolites are in turn rimmed by and occur in association with finer tabular to needly brown biotite after late igneous amphibole. In thin section, the tremolites have high birefringence, two oblique cleavages and sometimes have a radial fibrous habit. The tremolites are surrounded by tabular, brown pleochroic biotite (Fig. 3.59). The plagioclase crystals occur as colourless twinned tabular crystals with cloudy sausserite alteration and overprinted by blue epidote, zoisite and albite alteration after primary plagioclase. Titanite and hexagonal to columnar apatite are accessory (Fig. 3.60). There appears to be a zonation from brown primary biotite to sericite on the margins to the central green tremolite. The tremolites contain centres of dark green lamellae that are remnants to be from titanium of primary pargasitic hornblende (Fig. 3.61). There is accessory magnetite.
The rock may be called leuconorite since there are a few occurrences of coarse cumulus bronzite. The tremolite:biotite:plagioclase ratio is dominantly 40:30:30 and ranges to 00:20:80 leucogabbro. The unit contains the coarsest bronzite orthopyroxene with finer tremolite at the base of the sequence at 299 m depth. Upward, there is more fine grained brown biotite in association with coarse green tremolite. Plagioclase increases up to 80 modal % by 309.80 m and then the rock is finer grained tremolitedominant with plagioclase at 30 modal %. Unlike the ultramafic layered series the gabbro roof appears relatively fresh and unaltered. There is approximately 1-2 modal % pyrrhotite + pyrite + chalcopyrite. The chromitites that are cross-cut by the gabbro are massive and contain sharp contacts with the gabbro.
Leucogabbro is a massive light grey feldspar and quartz-phyric plagioclaseorthopyroxene cumulate overlying the pyroxenite that dominates the upper differentiated lithologies of the intrusion (Fig. 3.62). The contact of leucogabbro with pyroxenite is often faulted with either a mylonite as in DDH FW-11-83 or a hematized fault breccia as in DDH BT-11-185. In other drillholes such as DDH FW-11-87, the contact between
74leucogabbro and pyroxenite is marked by the disappearance of feldspar in the pyroxenite, but having a gradation from the pyroxenite to leucogabbro in terms of the same tremolitized cumulus pyroxene.
The leucogabbro above the pyroxenite in DDH BT-11-185 begins with a fine to medium grained dark vs. light pyroxene gabbro or gabbro which lacks the medium to coarse feldspar. After the basal gabbro, there is leucogabbro with a feldspar content of 30 modal % in proportion to surrounding darker green tremolitized pyroxene. This is followed by a coarse silicified section of feldspar and quartz veins in pyroxene from 47 to 40 m in that hole. From 43.26 to 37 m, the leucogabbro contains veiny to patchy coarser grained feldspar-quartz silicification. From 37 to 31.53 m, there is leucogabbro with a
75:35 pyroxene to feldspar composition. Porphyritic feldspars are up to 0.5 cm wide grains. This section continues to 29 m depth in that hole. Sometimes pink feldspar is observed making the unit locally granophyric. 3.11 Hangingwall mafic metavolcanic Mafic volcanic occurs when the leucogabbro loses its feldspar, becomes very fine grained grading into mafic volcanic lithology. The appearance of a gradational contact supports the idea that the gabbro is melted roof rock rather than being a differentiate of the ultramafic intrusion. The gradation of gabbro into mafic volcanic could be due to assimilation of wallrock mafic volcanic by gabbro. In DDH BT-11-200, the mafic volcanic is first medium grey like the groundmass of the gabbro, but progressively becomes darker green-grey chloritized down the hole. From 656.82 to 660.15 m, the unit is a true dark green basalt with 12 modal % clotty pyrrhotite mineralization. From
660.15 to the end of the hole at 684 m, the basalt is light green-grey chloritized with quartz banding, coarse quartz veins and interlayers of pegmatitic leucogabbro. In DDH BT-11-194, the metabasalt is green chloritized and aphanitic with Cross-cutting pink feldspar veins. From 678 to 684 m in DDH BT-11-200, the volcanic is recrystallized with medium grained feldspar at a composition of 60:40 chlorite to feldspar.

75CHAPTER 4 GEOCHEMISTRY
4.1 Introduction The geochemistry of the McFaulds Lake Intrusion is presented as whole rock geochemistry of major oxides, analyses of major element variation in previous assays, trace element geochemistry, full spectrum PGE analysis of host rock and chromite and electron microprobe mineral chemical analysis of silicates. Trace element and rare earth element analyses were performed on the same representative whole rocks reported for the three chromite deposits. Results are listed in Appendix 3.
4.2 Whole rock geochemistry Whole rock geochemical analysis was carried out on 26 drill core samples from four drill holes that represent the three deposits: DDH FW-08-19 for Big Daddy; BT-0810 for Black Thor; and BT-09-31 for Black Label. Two of the samples were collected from DDH BT-09-17 to represent the upper gabbro at Black Thor. Previous bulk rock geochemistry reported by Spider-KWG-Freewest and Freewest databases have been examined and interpreted along with this data. Full results are listed in Appendix 3. Discussion of bulk rock geochemical trends is for major element oxide and trace element/REE.
4.2.1.1 Major oxides The lithologies analysed for major oxides include dunite, oikocrystic harzburgite, heterogeneous olivine pyroxenite, pyroxenite and gabbro. Results are displayed in Table
4.1. The Black Label dunite is the most primitive of the intrusion with an MgO content of 41 to 45 wt. % MgO. The Black Thor dunites is also primitive with 40 to 41 wt. % MgO. The Big Daddy dunite is more evolved with 36 to 41 wt. % MgO. The evolution in the Big Daddy dunites is likely due to differentiation as there was a greater
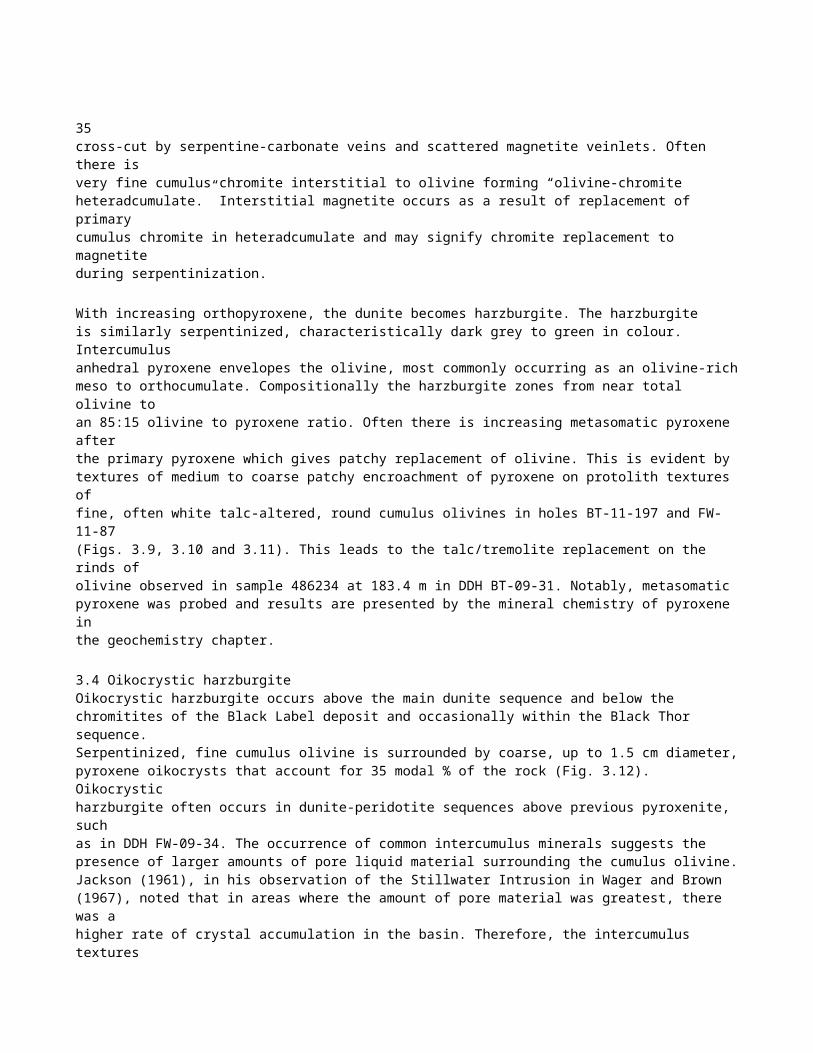
77subset sampled in that drill hole. The dunites show degrees of crustal contamination, as evidenced by a source magma chemistry with high Cs, Ba and Rb contents. Notably, the dunites from the Big Daddy suite are located more proximal to the basement tonalite. All the dunites of the three deposits have low wt. % CaO and Al2O3 due to lack of pyroxene crystallization. Notably, the wt. % FeO contents is more elevated in the dunite than pyroxenite due to higher Fe in olivine.
The pyroxenites are distinctly more evolved than the dunites with 26 to 40 wt. % MgO. The Black Thor pyroxenites are the most primitive with 30 to 40 wt. % MgO. The more primitive pyroxenite combined with the primitive dunite at Black Thor makes this the most primitive of the three deposits. In contrast, the Black Label pyroxenite sample is much more evolved at 27 wt. % MgO. The Big Daddy pyroxenite is generally more evolved like Black Label. Although, there are more evolved pyroxenites in Big Daddy, the trace element geochemistry of the Big Daddy pyroxenites suggests they have a primitive source like that at Black Thor. Therefore, although there is more contamination in the Big Daddy suite, overall, the setting of the Big Daddy is more primitive and more like Black Thor than Black Label in terms of geochemistry of the pyroxenite.
Transitional lithologies like heterogeneous olivine pyroxenite and oikocrystic harzburgite are local to the Big Daddy and Black Label suites respectively. Heterogeneous pyroxenite does not just occur at Big Daddy, but in the other deposits as well. The sample selected from Big Daddy is representative of the transitional chemistry between dunite and pyroxenite. As will be observed in the major element trends of Big Daddy, the heterogeneous pyroxenite probably formed as a result of uptake of olivine in pyroxenite from the lower dunite followed by the replacement of olivine by pyroxene in these samples. The MgO content of the heterogeneous pyroxenite is at 38 wt. % and contains more pyroxene with higher Al2O3 content at 2.0 wt. % and SiO2 content at 44 wt. %.
Oikocrystic harzburgite, an olivine cumulate with poikilitic pyroxene that is transitional from the dunite to pyroxenite in Black Label, has 33 to 39 wt. % MgO. Pyroxene is evident by the elevated Al2O3 and CaO contents of 4.9 and 9.0 wt. % respectively. Although there is higher CaO content, this probably reflects the tremolitization of primary orthopyroxene. Relic pyroxenes have parallel extinction

78diagnostic of orthopyroxene. The Ca content of tremolite is derived from CO2 fluid metasomatism
The two samples of gabbro proximal to the upper chromitite at Black Thor are much more evolved than the other samples due to modal plagioclase. SiO2 contents vary between 51 and 53 wt. % and Al2O3 contents vary between 16 to 18 wt. %.
4.2.1.2 Up section major oxide variation 4.2.1.2.1 Black Label: DDH BT-09-31 Geochemical trends in major oxide variation are best represented by the major element plots based on reported assays for the three drill holes. A stratigraphic column of lithologies is presented for each drill hole for all the following variation plots. The legend for the lithologies is the same as that presented on the drill sections of the holes (Figs. 3.1 to 3.4). Major element variation is demonstrated for the lithologies bordering the chromitites of the three deposits. The Black Label interval begins at a depth of about 150 m (Figs. 4.1 to 4.3). From 150 to 164.70 m, there is elevated Mg % in heterogeneous olivine pyroxenite. Then from 164.70 to 203.50 m, there is the main chromitite interval composed of clasts of oikocrystic pyroxenite as wavy bands in a semi-massive chromitite. There are various replenishments of chromitite in this interval as indicated by peaks in Mg % content. Fe % varies inversely in the chromitite as it substitutes with Mg %. After 203.50 m, there is pyroxenite that contains decreased Mg % while increased Ca % and Al % content. The next interval begins at 228 m. From 228 to 237 m, there is oikocrystic harzburgite with generally high Mg % content due to dominance of cumulus olivine. Within this unit, Mg % decreases with height probably due to differentiation. Ca and Al % contents are intermediate since there is both olivine and pyroxene in the unit. From 237 to 270 m, there are intermittent chromitite beds with replenishments as evidenced by peaks in Mg % and Fe % content. Al % is elevated as it varies with Cr content. After 270 m, there is dunite that is characterized by decreased Al % and increased Mg % content. The last interval from 306 to 320m intersects the last beds of chromite within a dominant dunite sequence. Fe and Al % contents are elevated in association with Cr content.
814.2.1.2.2 Black Thor: DDH BT-08-10 & BT-09-17 The major oxide variation across Black Thor is shown for DDH BT-08-10, beginning with dunite at 94 m depth (Figs. 4.4 to 4.6). From 94 to 124.70 m, there is general decreasing Mg % and Fe % with depth indicative of a differentiating dunite pulse. From 124.70 to 168.20 m, there are various intermittent to semi-massive beds of chromite alternating with cumulus olivine dunite. Mg % increases in the areas of cumulus olivine and is lower in content within the chromite beds. Fe % peaks in these chromite beds is due to more silicate exchange in disseminated chromite as opposed to massive chromitite. From 155 to about 160 m, there is a trend of decreasing Mg % indicative of magma evolution in a chromitite interval. Fe % is antipathetic to Mg % and increases with substitution as the chromites become more evolved. Another Mg % and Fe % trend occurs from 168.20 to 174.20 m, where there is a section of massive chromitite with lower Mg % content. This shows a trend of decreasing Mg % and increasing Fe % with depth in the chromite interval indicative of magma evolution in the chromitite. Above the chromitite from 174.20 to 187.10 m, there is dunite showing a large replenished increase in Mg % content. Al % generally increases directly with Cr content within the drill hole sequence,.
Samples from DDH BT-09-17 are different than samples from the other drillholes as chromitite is related to pyroxenite intruded by upper gabbro. The interval of interest that contains the upper chromitite is from 290 to 345 m (Figs. 4.7 to 4.9). The interval begins with a pyroxenite above the previous chromitite layer at 290 m. The pyroxenite contains high Mg % but lower Al % and Ca % contents in comparison to the overlying gabbro. From 296.30 to 298.80 m, there is the first chromitite horizon sandwiched between pyroxenite and gabbro. The chromitite is dinstinguished by a peak in Fe % in comparison to low Fe % in background pyroxenite and gabbro. Above the chromitite there is gabbro with elevated Ca % and Al %. From 298.80 to 318.70 m, there is a trend of decreasing Al % from 8.4 to 7.8 %. This represents evolution in anorthite content of plagioclase to lower anorthite with height. A trough in Al % at 304 m coincided with high Ca % which represents abundance of tremolitized pyroxene over plagioclase. Higher up in the gabbro from 311 to 318.70 m, there is increased Ca % with the fractionation of pyroxene is association with plagioclase. Notably, the wt. % SiO2 and

86Na2O contents increase upward in this section with evolution of the gabbro, well demonstrated by the increase in wt. % SiO2 and Na2O in the two gabbros analysed. The increase in modal % pyroxene is also evident by increase in Mg % upward in the gabbro. The main chromitite interval, from 318.70 to 337.90 m, is characterized by peaks in Fe %. There appears to be a decreasing trend in Mg % in the first chromite pulse from
318.70 to 325 m which may be due to differentiation. However, in the above pulses there is increased Mg %. The higher Mg % contents may be due to retrogression of the chromites to higher Mg % along with higher Al % as there is reduction in Fe with heat of the gabbro. Above the chromitite from 337.90 to 345 m, there is again pyroxenite with high Mg % and low Ca and Al %. 4.2.1.2.3 Big Daddy: DDH FW-08-19 Big Daddy is represented by DDH FW-08-19. From 9 to 64.50 m, there are three increases in Mg % that probably represent three replenishments of olivine cumulus magma to form dunite that alternates with pyroxenite (Fig. 4.10 to 4.11). From 64.50 to 100 m, there appears to be a megapulse of dunite, as evident by an overall decreasing trend in Mg %. Within this sequence are two pulses of decreasing Mg % with height from dunite to pyroxenite. They are from 64.50 to 73.97m and 73.97 to 105.39 m. Two replenishment trends of increased Mg wt. % occur in the interval of heterogeneous olivine pyroxenite from 105.39 to 129 m and from 129 to 141.50 m. With increased Mg %, there is generally elevated Fe % due to olivine content. From 141.50 to 144.14 m, there is semi-massive chromite with cumulus pyroxene. From 144.14 to 159.37 m, there is replenishment in Mg % with a dunite pulse. From 159.37 to 162.00 m, there is massive chromitite characterized by no Si % along with Fe % and Al % peaks. There is heterogeneous pyroxenite with elevated Mg %. from 162.00 to 164.20 m. From 164.20 to 183.00 m, there is a drop in Mg % in a new pyroxenite sequence. Notably, there is increased Ca % in the pyroxenite due to presence of tremolite and also increased Al % as Al substitutes into the pyroxene structure. From 183.00 to 229.64 m, there is the main section of massive chromitite. Within this sequence, there is an overall decreasing trend of Mg % while an increasing trend Fe % as Fe substitutes with Mg in the chromite structure. The overall decreasing Mg % trend is due to evolution from bottom to top of

88 the chromite sequence. Although there are trends of Mg and Fe %, Al % stays relatively constant at 6.5 wt. % Al. Above the chromitite is pyroxenite with elevated Ca %.
4.2.1.3 Binary major oxide variations 4.2.1.3.1 Black Label (Fig. 4.12) The Black Label deposit displays variation to more evolved compositions, both in more evolved chromite and more pyroxene in the system. On a Cr ppm vs. Mg % plot, there is a general trend of decreasing Cr with increasing Mg %, reflective of more cumulus chromite and less cumulus olivine. On a Cr ppm vs. Al % plot, there is a convex upward trend of increasing Cr ppm with increasing Al % content. Again, with increased Cr, there is increased Al with substitution. The leveling off at the high Cr end of the plot is due to the effect of interstitial poikilitic pyroxene providing chromitite more exchange with higher aluminous compositions.
For Cr ppm vs. Fe %, there is a large spread of values over a general increasing Cr with increasing Fe % trend. There is increased Fe % with increased chromite content as before. However, the large spread in compositions is due to the increase in the amount of ferrichromite in the Black Label deposits as opposed to the other deposits. Since ferrichromite is non-igneous, there is no general enrichment trend in its origin. Where there is semi-massive chromite with interstitial silicate, there is greater amount of enriched Fe-bearing ferrichromite due to silicate-oxide exchange during hydration.
Igneous evolution in the Black Label chromitite is displayed well by linear negative correlative trends of decreasing Al and Fe % with Mg %. The decreases are due to substitution with Cr and Mg respectively and the predominance of those elements in more massive chromite-bearing vs. disseminated chromite-bearing cumulates.
There is no correlation on the Ca % vs. Mg % plot. There are however a large amount of Ca-enriched lithologies on a broad range of Mg % due to tremolite in more pyroxene-bearing lithologies. There is, in contrast, less pyroxene in the Big Daddy and Black Thor intercepts. Notably, the pyroxenes were probably more affected by Ca metasomatism during hydration to cause irregularity in the Ca signatures.
4.2.1.3.2 Black Thor (Fig. 4.13) The Black Thor deposit shows more complete evolution in major element variation between the less chromite-bearing disseminated and the more massive

91chromite-bearing lithologies. On the Cr ppm vs. Mg % plot, there is a distinct negative correlation of increasing Mg % with decreasing Cr ppm. This trend reflects the greater Cr ppm in the more massive chromites vs. the more evolved disseminated chromites that have undergone silicate exchange. The trend of decreasing Cr ppm with differentiation is characteristic of chromite deposits of layered intrusions such as Bushveld (Stowe, 1994). With increased evolution of the chromitite, there is increasing Al content as well due to Cr-Al substitution in the individual chromites.
For Cr ppm vs. Fe %, there is also a trend of increasing Fe % with Cr ppm with magma evolution in the chromitites – the more massive chromitites containing less Fe % due to more primitive compositions. There is an increasing trend of Fe % in many of the less Cr-bearing lithologies due to increased Fe % in the olivine of dunite. At the high Cr-bearing end, there are also some high Fe-bearing chromitites or chromite-olivine cumulates that plot off the trend. These are representative rims on primary chromites that have been retrogressed leaving behind Cr-enriched and Fe-enriched ferrichromites on the rims of the primary chromites.
The Al % vs. Mg % plot shows a distinct negative correlation of decreasing Al % with increasing Mg %. This trend is also evident of the magma evolution in the chromitites where the more massive chromitites have greater Al % than the more primitive Mg-rich chromite-olivine cumulutes. This is again due to Cr-Al substitution, the more chromite in the rock, the higher the Al content. Fe varies similarly with Mg as it does with Cr, only in an inverse way. There is another evolutionary trend of the more chromite-bearing lithologies containing more Fe % content. Again, some Mg-enriched dunites contain elevated Fe within the olivine. Also, there is enrichment in Fe % at the low Mg % end that goes above the trend due to enriched Fe in ferrichromite-bearing chromitites.
The Ca % vs. Mg % plot, enrichment in Ca % shows no correlation. Enrichment in Ca % is probably due to secondary tremolite replacement of pyroxene. Notably, there are two outliers of high Ca-bearing lithologies which are intercumulus pyroxene-bearing semi-massive chromitites.
A few binary trends are useful for analyzing the composition of the gabbro vs. chromitite vs. pyroxenite in DDH BT-09-17. On a Al % vs. Mg % plot, igneous


92evolution occurs with increasing Al % from pyroxenite to gabbro. The massive chromitite plots with intermediate Al % and Mg % compositions between the gabbro and pyroxenite. On a Ca % vs. Mg % plot, the gabbros plot at higher Ca % than the pyroxenite due to plagioclase controlled fractionation. The relatively low Ca % of the pyroxenite is indicative of predominant orthopyroxene fractionation.
4.2.1.3.3 Big Daddy (Fig. 4.14) On binary variation plots, the Big Daddy deposit shows trends of magma evolution from the most primitive dunite through to the heterogeneous olivine pyroxenite to the chromitite and associated pyroxenite lithologies. Below the 2 % Cr mark on a Cr ppm vs. Mg % plot, chromite increases slightly with increasing Mg % up to 21 % Mg. Most of the data from the dunite plot in an area of chromite accumulation below a line of increasing Cr with Mg %. However, with evolution of the units, there is also a large negative correlation of Cr with Mg %. At the high Cr end of the trend, there is a cluster representative of the samples in the massive chromitite interval. Between the massive chromitite and the dominant cumulus olivine dunite lithologies are fewer intermediate lithologies that contain intermediate (semi-massive) chromite with intermediate Mg content between massive and disseminated chromite. This shows a direct negative correlation of Cr with decreasing modal % chromite. The observation of there being high Cr and low Cr-bearing clusters with few intermediate compositions shows the “it’s massive or it’s not there at all” nature of the Big Daddy chromitite as seen in this drill hole.
The Cr ppm vs. Al % plot shows a positive correlation of Cr ppm and Al % content. Therefore, there will be more partitioning of Al into the spinel structure as opposed to dunite that contains little Al %. Notably, the massive enriched chromitite contains the highest Al % content. This is probably due to silicate exchange with the surrounding dominant pyroxenite host lithology. The same correlation exists between Cr ppm and Fe % as Fe % increases with evolution of the chromitites.
The Al % vs. Mg % plot shows Al % generally increases with decreasing Mg % as there is more Al % in the chromitites than in the other lithologies. Pyroxenites with lower Mg % content also have elevated Al % content due to Al substitution into pyroxene. Fe % increase with decreasing Mg % content is not as obvious since many

94samples contain more pyroxene which have lower Fe % contents. Generally, the more chromite, the more Fe content due to its partitioning in the spinel structure.
The Ca % vs. Mg % plot identifies a broad increase of Ca % content in the more evolved pyroxene-bearing lithologies as opposed to the dunites. The Ca is not admitted into the spinel structure, so the olivine-chromite cumulus and massive chromite-bearing lithologies have limited Ca % content.
4.2.2 Trace element geochemistry 4.2.2.1 Primitive mantle-normalized multielement plots 4.2.2.1.1 Black Label The Black Label chromite deposit is hosted in the main dunite and pyroxenite sequences stratigraphically lower than Black Thor. On a PM-normalized diagram, the Black Label dunite is the most primitive with the lowest overall REE (Fig. 4.15). They were probably the first units to crystallize among the host rocks to the three chromite deposits. The dunites are enriched in light rare earth elements (LREE) relative to heavy rare earth elements (HREE) and contain negative Nb-Ta, negative Zr-Hf, and positive Ti anomalies. These collectively indicate crustal contamination of komatiite. For trends in REE, the dunites and oikocrystic harzburgites show LREE enrichment over middle rare earth elements (MREE) with (La/Sm)cn ratios between 1.94 and 4.70, MREE depletion over HREE with (Gd/Yb)cn ratios of 0.68 to 1.05, and (Eu/Eu*)cn ratios of 0.41 to 1.50. (La/Sm)cn ratios have an average ratio of 3.02 which is slightly larger than Big Daddy and larger than Black Thor. The ratios are similar to Big Daddy, only the overall REE are lower in the Black Label dunites.
LREE enrichment in Black Label identifies crustal contamination of an original komatiite as such LREE and LILE enrichment is commonly linked to crustal contamination (Lesher, 2005). LREE enrichment coinciding with negative Nb-Ta and Zr-Hf anomalies is due to crustal contamination in komatiites by tonalite-tronjhemitegranodiorite suites (Lesher, 2005 and Hollings & Kerrich, 1999). Low Al tonalities in the North Caribou Terrane have been characterized by LREE enrichment and negative Nb-Ta and Zr-Hf anomalies (Wyman et al., 2011). For the case of Black Label, the LREE enrichment along with enrichment in Cs-Rb-Ba suggests greater degree of crustal contamination in these dunites in contrast to Black Thor. Although the (La/Sm)cn ratios
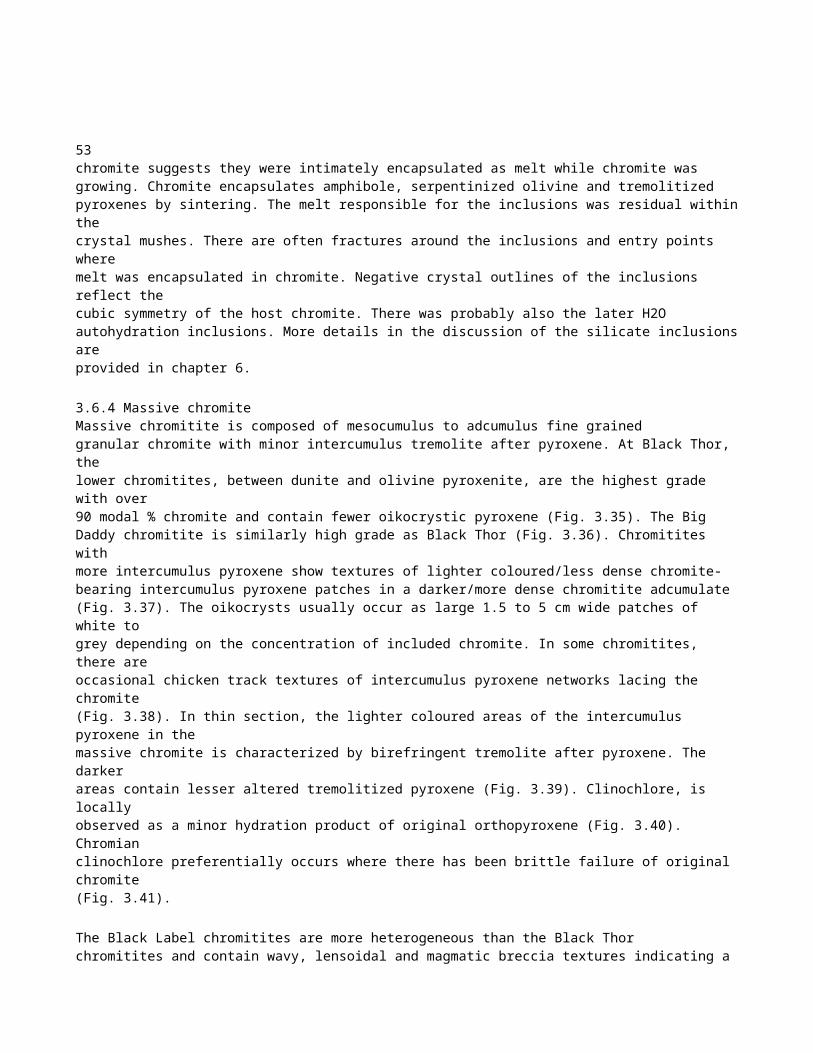
96are larger than Black Thor, the Black Label dunites are more primitive with lower abundance in overall REE along with their signature MREE depletion characteristic of primitive aluminum-undepleted komatiite (AUK).
Notably, the REE compositions of the oikocrystic harzburgite samples are intermediate between Black Label dunite and Black Label pyroxenite (Fig. 4.15). The origin of the oikocrystic pyroxene at the top of a dunite sequence is related to the initiation of pyroxene crystallization, following the fractionation of pyroxene-laden magma (pyroxenite) in this sequence. Intermittent beds of chromite have been found associated with these wavy banded oikocrystic units and in DDH BT-11-176, oikocrystic harzburgite units are found in association with the magmatic breccias. The dynamic textures in these units indicate the chromite probably originated with a mixture of pyroxene-laden magma to drive the magma into the chromite field for crystallization. This mixing of pyroxene is suggested by the REE contents being intermediate that of dunite and pyroxenite.
One sample of Black Label pyroxenite was analysed and shows a highly evolved composition similar to the Big Daddy pyroxenite (Fig. 4.16). The sample displays LREE and LILE content that is lower than that of Big Daddy, but higher than Black Thor. The pyroxenite displays slight LREE enrichment relative to HREE and contains negative Nb-Ta, negative Zr-Hf and negative Y anomalies suggestive of crustal contamination. There is LREE enrichment over MREE with (La/Sm)cn of 1.59; MREE depletion over HREE with (Gd/Yb)cn of 0.85, and the (Eu/Eu*)cn ratio is 0.57.
4.2.2.1.2 Black Thor The Black Thor chromite deposit is hosted in main dunite with pyroxenite higher in stratigraphy. On a PM-normalized diagram, the Black Thor dunites are enriched in LREE relative to HREE and contain negative Nb-Ta, negative Zr-Hf, and positive Ti anomalies (Fig. 4.17). The dunites display LREE enrichment over MREE with (La/Sm)cn ratios between 1.68 and 2.11, MREE depletion over HREE with (Gd/Yb)cn ratios of 0.64 to 0.83, and (Eu/Eu*)cn ratios of 0.44 to 0.63. The (La/Sm)cn ratios are lesser than the Big Daddy dunites and are depleted in MREE. The relative LREE non-enrichment is probably reflective of primitive AUK komatiite (Lesher et al., 1999). HREE enrichment over MREE is a characteristic signature of AUK komatiite or boninite (Lesher et al.,

981999, Kerrich, 1997 and Barnes, 1989). Like Big Daddy, the rocks show evidence of crustal contamination by TTG with the negative Nb-Ta, Zr-Hf anomalies. However, there is no local contamination as evidenced by depletion LILE of Cs-Rb-Ba, but generally reflective of an AUK signature.
The Black Thor pyroxenites are depleted in overall REE compared to Big Daddy and Black Label and are the most primitive pyroxenites (Fig. 4.16). These pyroxenites are also enriched in LREE relative to HREE and contain negative Nb-Ta, negative Zr-Hf, negative Y and positive Ti anomalies suggestive of crustally contaminated komatiite. The pyroxenites display LREE enrichment over MREE with (La/Sm)cn ratios between
2.42 and 2.87, MREE depletion over HREE with (Gd/Yb)cn ratios of 0.28 to 0.70, and (Eu/Eu*)cn ratios of 0.51 to 1.42. The MREE are strongly depleted relative to HREE compared to Big Daddy which reflect that of HREE-enriched primitive AUK (Lesher et al., 1999). In Black Thor DDH BT-09-17, there is gabbro cross-cutting the chromitite and it is located higher in stratigraphy than the pyroxenite. The gabbros are enriched in overall trace elements and REE relative to the other lithologies due their more evolved composition (Fig. 4.18). Although more enriched, the gabbros display similar REE trends of LREE enrichment, negative Nb-Ta, Zr-Hf and Y anomalies as the other lithologies which probably indicate they form an upper differentiate of the same layered intrusion. The negative Nb-Ta along with negative Ti anomalies is related to TTG contaminant. TTGs are considered to be formed by partial melting of hydrous basalt at the base of a thickened oceanic island arc, leaving a rutile-bearing eclogitic residue (Huang et al., 2012). The differences between the gabbros and the other lithologies are that the gabbros do not have HREE enrichment and have negative Ti anomalies: (La/Yb)cn ratios are 6.48 to 12.53 in contrast to an average (La/Yb)cn ratio of 3.60 in the other lithologies. This shows that the gabbros are not komatiitic, but are rather melted roof rocks after mafic volcanics. For REE ratios, the gabbros display LREE enrichment over MREE with (La/Sm)cn ratios between 2.18 and 4.23, MREE enrichment over HREE with (Gd/Yb)cn ratios of 1.74 to 1.89, and (Eu/Eu*)cn ratios of 0.99 to 1.26.
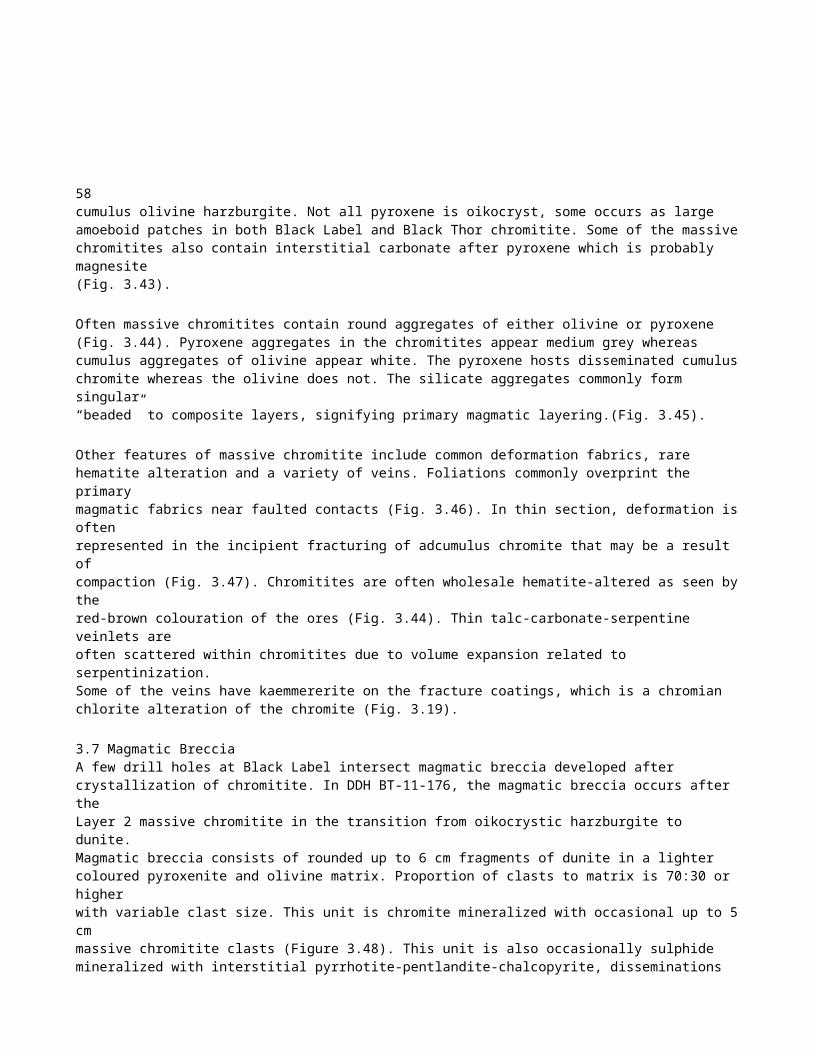
994.2.2.1.3 Big Daddy The Big Daddy chromite deposit is hosted in main dunite and pyroxenite lithologies along with transitional heterogeneous olivine pyroxenite. On a PM-normalized diagram, the Big Daddy dunites and heterogeneous pyroxenite are enriched in LREE relative to HREE and contain negative Nb-Ta, negative Zr-Hf, negative Y and positive Ti anomalies (Fig. 4.17). The dunites display LREE enrichment over MREE with (La/Sm)cn ratios between 2.49 and 9.19, MREE slight depletion or enrichment over HREE with (Gd/Yb)cn ratios of 0.76 to 1.43, and (Eu/Eu*)cn ratios of 0.23 to 0.70. Five of the samples have (La/Sm)cn between 2.49 and 4.18 while sample 232251 with (La/Sm)cn at 9.19 is an exception. The enrichment of LREE to MREE and HREE reflects crustal contamination like that in Black Label. Although HREE are depleted relative to LREE, they are slightly enriched relative to MREE which could reflect an AUK signature (Lesher et al., 1999 and Kerrich, 1997). There are also positive Ti anomalies which would reflect the komatiite. For large ion lithophile elements (LILE) of Cs-Rb-Ba, there is strong enrichment in the Big Daddy dunites reflecting crustal contamination by continental crust. LILE are enriched in continental crust in contrast to depletion in komatiites by themselves (Lesher, 1999). The heterogeneous pyroxenite displays the higher REE content and LILE content than all the dunites and is notably transitional to the higher REE and LILE contents of the Big Daddy pyroxenites.
The Big Daddy pyroxenites are also enriched in LREE relative to HREE, but have more enrichment in overall REE than the dunites (Fig. 4.16). On a PM-normalized diagram, the pyroxenites also contain negative Nb-Ta, negative Zr-Hf, negative Y and positive Ti anomalies and are even more enriched in Cs-Rb-Ba. The samples display LREE enrichment over MREE with (La/Sm)cn ratios between 1.94 and 6.52, MREE slight depletion over HREE with (Gd/Yb)cn ratios of 0.80 to 0.92, and (Eu/Eu*)cn ratios of 0.36 to 0.97. The negative Nb-Ta, Zr-Hf and positive Ti anomalies reflect crustal contamination in komatiite. Local contamination of the pyroxenites, like the dunites, is reflected by enriched Cs-Rb-Ba.
4.2.2.2 (La/Sm)cn vs. (Gd/Yb)cn A (La/Sm)cn vs. (Gd/Yb)cn plot can be used to distinguish the different host rocks to the three chromite deposits. Most of the samples plot in a (Gd/Yb)cn range from 0.75

1000.001.002.003.004.005.006.007.008.009.0010.000.000.200.400.600.801.001.201.401.601.802.00(La/Sm)cn(Gd/Yb)cnBDduniteBDpyroxeniteBTduniteBTpyroxeniteBLduniteBLpyroxeniteBTleucogabbroFigure 4.19. Plot of (La/Sm)cn vs. (Gd/Yb)cn for Black Label, Black Thor and Big Daddy host rocks. Normalizing values of McDonough and Sun (1995).

101to 1.0 (Fig. 4.19). This range for both dunite and pyroxenite suggests the host magmas to the deposits are aluminum-undepleted komatiites or AUK. AUK at Pykes Hill, Quebec, for example, plot between 0.8 and 1.2 mark whereas aluminum-depleted komatiites (ADK) of the Tisdale suite plot between 1.2 and 1.6 (Kerrich, 1997). Although (Gd/Yb)cn falls within the range, the (La/Sm)cn ratio will be more enriched in the samples due to crustal contamination by TTG. The (La/Sm)cn ratios are from 1.5 to 4.0 rather than near 0.5 for Pykes Hill. For the individual deposits, the Black Label dunites are the most enriched in (La/Sm)cn while the Black Thor dunites are the most depleted. There was probably more crustal contamination in Black Label. The Big Daddy dunites are crustally contaminated in the range approaching that of Black Label. For (Gd/Yb)cn, the Black Thor dunites contain less (Gd/Yb)cn than the others and are more primitive in composition. For pyroxenite, Big Daddy and Black Label pyroxenites plot as similar evolved with greater (Gd/Yb)cn compositions than the Black Thor pyroxenites.
4.3 Full spectrum PGE analysis Full spectrum PGE analysis was performed on dunites, pyroxenites and chromitites of the Black Thor, Black Label and Big Daddy deposits. The 26 samples analysed for whole rock geochemistry were also analysed for full spectrum PGE. Six more samples of chromitite were analysed for full spectrum PGE, two from each deposit. Results are listed in Appendix 3.
4.3.1 Primitive mantle normalized PGE plots of host rocks In comparing the dunites and pyroxenites hosting the three chromite deposits, the dunites are more enriched in IPGE (Os, Ir, Ru) than the pyroxenites, but have similar PPGE (Rh, Pt, Pd). Dunites have Pd/Irmn contents of 1.60 to 21.98 compared to pyroxenites with Pd/Irmn contents of 0.65 to 26.2. This is similar to komatiites reported by Barnes et al. (1985) where peridotitic komatiites have Pd/Ir of ~10 while pyroxenitic komatiites have Pd/Ir of ~30. The more primitive PGE chemistry of the dunites compared to the pyroxenites is probably due to the higher degree of partial melting in magmas that fractionated the dunites. For individual deposits, the Big Daddy dunites are more enriched in PPGE than the Black Thor dunites indicating there was more sulphur saturation in the Big Daddy lithologies (Fig. 4.20). The Big Daddy dunites have Pd/Irmn contents of 6.49 to 21.98 compared to Black Thor dunites with Pd/Irmn contents of 1.60 to

1032.58. This is probably related to the Big Daddy lithologies being more evolved than the Black Thor lithologies. The Black Label dunites are most enriched in IPGE with up to 30 ppm Ir and are enriched in PPGE like the Big Daddy dunites with up to 423 ppm Pt and Pd (Fig. 4.21). The Black Label dunites have up to Pd/Irmn contents of 4.02 to 17.6. Enrichment in IPGE reflects the more primitive PGE signatures of the Black Label dunites. Along with enrichment in dunites, the Black Label pyroxenite is the most enriched in PGE compared to the other pyroxenites (Fig. 4.22). The Black Label pyroxenite is also the most fractionated pyroxenite with Pd/Irmn of 26.2. The Big Daddy pyroxenites have Pd/Irmn contents of 2.32 to 21.97. The Black Thor pyroxenites are the most primitive with Pd/Irmn contents of 0.65 to 14.17. The overall PGE are noticeably different between the dunites and pyroxenites. The two lithologies probably reflect two magmas – an olivine and a fractionated pyroxene magma - that were mixed to precipitate the chromitites. The IPGE-rich dunites would reflect new S-saturated magmas that mixed with less IPGE-bearing S-undersaturated pyroxenites, thus chromitites being produced by magma mixing according to Irvine’s model. 4.3.2 Primitive mantle normalized PGE plot of chromitite For the PGE signature of the chromitites, all the deposits are enriched in both IPGE and PPGE with slightly more enrichment in PPGE (Fig. 4.23). These chromitites appear to have similar PGE patterns in comparison to the Blackbird chromitite, reported by Azar (2010),. The relatively low PGE of the chromitites suggests the intrusion is largely sulphur undersaturated. Pd/Irmn contents range from 0.64 to 9.57. The enrichment in IPGE is due to the presence of IPGE inclusions in chromite. Inclusions of Rh, Ir, Os, Ru were detected in the chromite of Black Thor during the laser ablation work. These are probably multiple PGE minerals including laurite and others. The Black Label chromitite are the least enriched in Os, Ir, Ru and Rh compared to the Black Thor and Big Daddy chromitites since they are the most evolved. Enrichment in Cu in Black Label indicates the presence of sulphide in this deposit. For Pt contents, the Black Thor and Big Daddy chromitites contain more Pt with contents of 279 ppm for Black Thor and 266 ppm for Big Daddy, compared to 133 ppm for Black Label. Although the Black Label chromitites have proportional higher Pd with Pd/Pt ratio in one of the samples at 3.22, and usually have higher Pd contents e.g. assays of DDH BT-09-31.
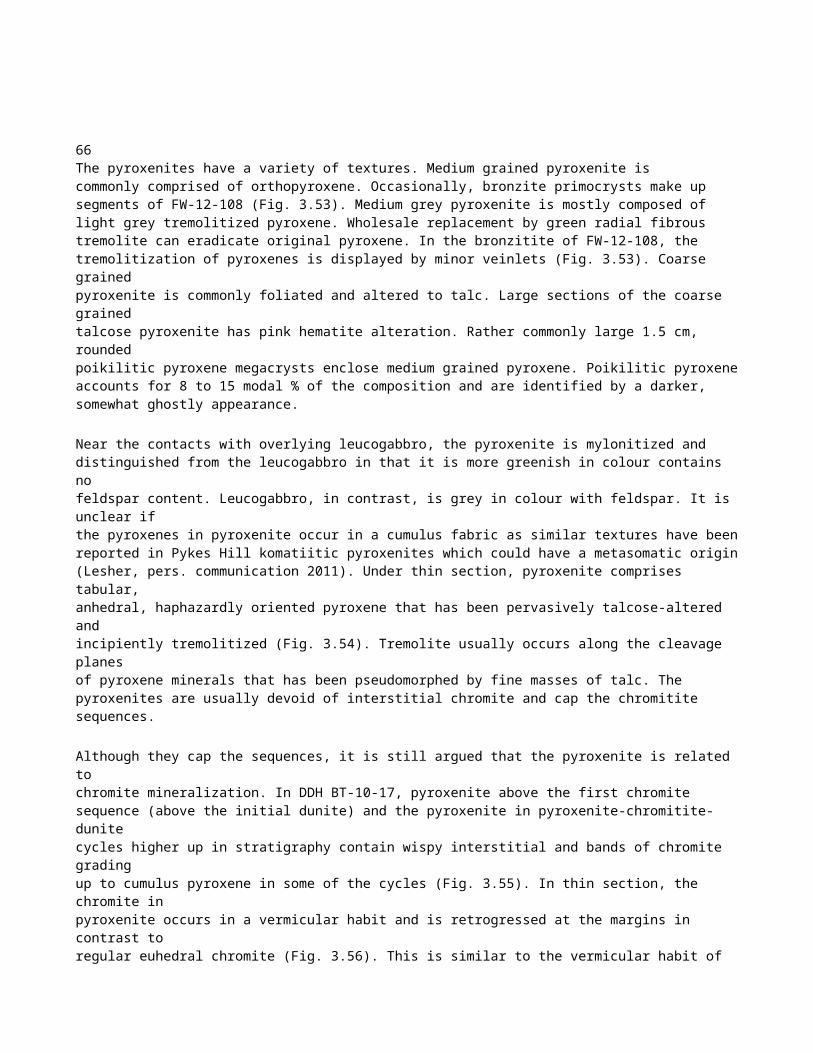
1054.4 Mineral chemistry of host silicates Electron microprobe analysis was performed on primary host silicates, minerals in silicate inclusions in chromites and on retrogressive silicate to the chromite. A total of 465 point analyses were determined for the silicates, not including serpentine, talc and albite. These last three minerals were not included in the database. Of the 465 analyses, 32 point analyses were performed for olivine, 45 for pyroxene, 202 for amphibole, 61 for phlogopite and 125 for chlorite. Analyses are listed in Appendix 4.
4.4.1 Olivine Olivines were probed in only a few samples where there was remnant fresh olivine and pyroxene in DDH BT-09-31. Since there is very little primary olivine remaining due to pervasive hydration to serpentine, reporting of complete chemistries of Mg # up section in the intrusion is not possible. However, the few remnant olivine grains in the chromitites plot in compositions reflective of that layer, which gives evidence of difference in Mg # between the chromitites (Fig. 4.24). The Layer 1 olivines have lower Mg # between 85.7 to 90.77 compared to the Layer 2 olivines with Mg # between 90.68 and 94.41 reflective of the more primitive chromites in Layer 2 than in Layer 1.
4.4.2 Pyroxene Primary intercumulus pyroxene has been pervasively retrogressed to hydrothermal tremolite and talc. Fresh pyroxene was analysed where preserved in five samples in Black Label DDH BT-09-31. Notably, no primary pyroxene is preserved in the Black Thor and Big Daddy drill holes. On a pyroxene ternary plot, the pyroxenes are classified as diopsides and augites for clinopyroxene and pigeonites and enstatites for orthopyroxenes (Fig. 4.25). In sample 486211 at 174.4 m, there is a trend of ferrosilite depletion in three pyroxenes from the main cluster of pyroxenes in the diopside-augite field (Fig. 4.26). The three offset pyroxenes are due to magmatic metasomatism of the primary pyroxene cluster. These pyroxenes have ferrosilite component at 2.83 to 3.39 % whereas the primary pyroxenes have ferrosilite at 4.73 to 5.60 %. This trend in Mg enrichment is due to replacement of the primary pyroxenes by metasomatic pyroxene.
Another trend evident in the diopside-augite cluster is the increase in wollastonite component in the primary pyroxenes from 45.70 to 47.79 %. This trend is due to core to rim diffusion in the relic pyroxenes due to melt metasomatism. Evidence of the core to

109rim diffusion is the variation from a core pyroxene at point 4 in sample 486211image_0001 at 45.40 % Wo to a rim pyroxene at point 3 at 46.90 % Wo. Diffusion to greater wollastonite component is also evident in the orthopyroxenes of sample 486211 (Fig. 4.27). Wollastonite increases from core orthopyroxene at 2.46 % Wo to rim orthopyroxene at 5.99 % Wo.
Primary pyroxenes occur as both poikilitic phases in the host olivine cumulate and the chromitite and as minerals in the chromite-hosted silicate inclusions. The primary pyroxenes are characterized by elevated non-pyroxene quadrilateral components such as wt. % TiO2 and wt. % Cr2O3. The chromian diopsides have up to 0.33 wt. % TiO2 and
1.74 wt. % Cr2O3 while the orthopyroxenes have up to 0.22 wt. % TiO2 and 0.80 wt. % Cr2O3. The trend of decreasing Ti from primary to metasomatic to hydrothermal pyroxene is displayed on a plot Ti vs. total Al where the primary pyroxenes have higher Ti and Al contents (Fig. 4.28). Hydrothermal diopsides were also detected in sample 486155 at 151.8 m in Black Label DDH BT-09-31. These represent higher T metamorphism of pyroxene into diopside stability after tremolite at 450 °C temperature (Winter, 2001). These pyroxenes have almost no non-quadrilateral components and high MgO at up to 21.71 wt. %.
4.4.3 Amphibole The McFaulds Lake chromites have associated of both primary igneous and secondary retrogressive amphiboles. The amphiboles probed in this study are from Black Label DDH BT-09-31 and Black Thor DDH BT-09-17. All the amphiboles analysed are divided into three groups according to the nomenclature of Leake et al. (1997). Noteably, Cr is not accounted for in this classification scheme. There are three types of igneous amphibole: the magnesiotaramites-magnesiokatophorites-winchites, the pargasitesedenites and the tschermakites-magnesiohornblendes. On a plot of Mg # vs. Si for (Na+K)A > or < 0.50; (Ca+NaB) = 1.00; 0.50 < NaB < 1.50, the first group of amphiboles range from the bulk cluster of lower Si-bearing magnesiotaramites and magnesiokatophorites with Si between 6.47 and 6.81 that trend in Si enrichment to four winchite compositions with Si ranging from 7.49 to 7.819 (Fig. 4.29). The bulk cluster of magnesiotaramites-magnesiokatophorites consists of silicate inclusion amphiboles found in both the Layer 1 and Layer 2 Black Label chromitites. On a AlIV vs. NaA+K diagram,
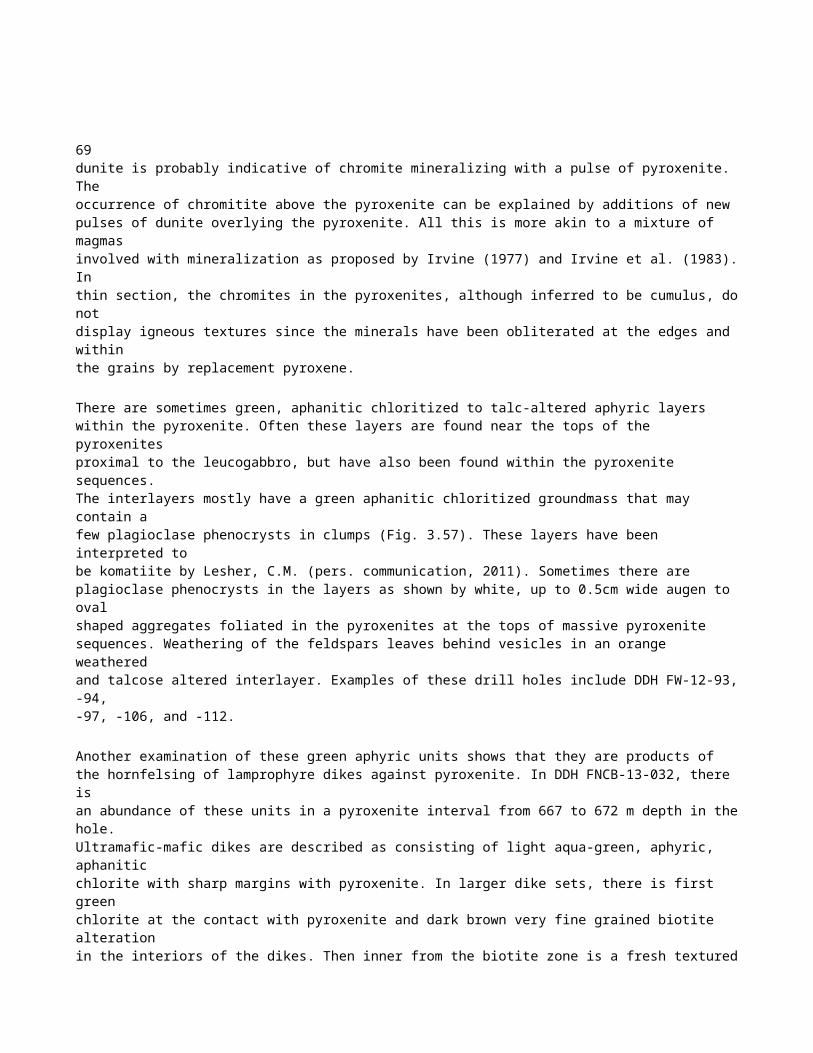
112these amphiboles plot in the range of igneous amphiboles with NaA+K greater than 0.5 which have relatively similar AlIV compositions of about 1.1 to 1.45 (Fig. 4.30). The winchite is the only exception and occurs along the 1:1 magnesiohornblende to tremolite trend and has a NaA+K value of 0.49. On a AlIV-(Na, K)A vs. AlVI+2Ti+Cr diagram, the amphibole with the highest Ti number is a magnesiotaramite while the amphibole with the highest Cr number is a magnesiokatophorite (Fig. 4.31). The winchite plotted on the Mg # vs. Si diagram with Si of 7.49 is from a relatively bright silicate inclusion mineral that occurs with albite in silicate inclusions at 273.6 m depth in the Black Label Layer 2 chromitite. The other three winchite compositions that did not run through the Papike calculation with Si from 7.81 to 7.819 are three point analyses from a single silicate inclusion amphibole from sample 486211 at 174.4 m.
The pargasites-edenites plot on a diagram of Mg # vs. Si for CaB = 1.50; (Na+K)A > 0.50; Ti < 0.50 (Fig. 4.32). There is one large cluster that plots in the range of Si between 6.37 and 6.99 while one point analysis plots at Si of 7.24. Within the range of these amphiboles, there is a trend of increasing Si and Mg # that probably reflects igneous evolution of decreasing Mg # in the amphiboles. On a plot of Mg # vs. depth for Black Label DDH BT-09-31, the amphiboles in Black Label Layer 2 from 232 to 321 m in DDH BT-09-31 have a higher amount of high Mg # amphiboles than Layer 1 amphiboles from 155 to 186 m which probably reflects the more primitive chromite compositions of Layer 2 (Fig. 4.33). A trend of decreasing Mg # with height from 255.6 m to 273.6 m in Layer 2 from 0.98 to 0.90 is suggestive of a differentiation trend. Notably, two pargasite compositions were detected (analyses 33 and 34 at 155 m) for igneous amphibole that surrounds silicate inclusion-bearing chromites with amphiboles of the same composition in the silicate inclusions. On a AlIV vs. NaA+K diagram, the pargasites-edenites have the highest range of AlIV compositions in the range of amphiboles with NaA +K greater than 0.5 (Fig. 4.30). The AlIV compositions range from
1.01 to 1.66. On a AlIV-(Na, K)A vs. AlVI+2Ti+Cr diagram, the pargasites-edenites plot in the large cluster of igneous amphiboles with high Ti and Cr contents (Fig. 4.31). The tschermakites-magnesiohornblendes plot with and are replaced by retrogressive tremolite as the third type of amphibole. On a Mg # vs. Si diagram for CaB = 1.50; (Na+K)A < 0.5, there is a Si enrichment trend with associated Mg enrichment that

116represents the retrogression of pargasite to magnesiohornblende and further to tremolite (Fig. 4.34). This trend is better observed on a AlIV vs. NaA+K diagram where there is decreasing NaA+K with decreasing AlIV from pargasite to tremolite (Fig. 4.30). Evidence of this retrogression is the presence of chromian tremolite in analysis 71 of sample 486211 at 174.4 m that occurs as tabular grains adjacent to a crack in a silicate inclusion with pargasite. Notably, relics of pargasite at 155 m are observed in poikiloblastic chromian tremolite which represents replacement tremolite. Also, secondary zonation is observed from edenite to tremolite from points 1 to 2 in zoned amphibole sample 486211 image_0010, 174.4m depth (see petrography chapter, silicate inclusions). The retrogressive trend is also observed as decreasing AlIV-(Na+K)A with decreasing AlVI+2Ti+Cr where the replacement tremolites have lower Ti and Cr contents than the pargasites and other igneous amphiboles (Fig. 4.31). A large amount of the tremolites are also replacement of primary chromian diopsides. One tremolite with elevated Cr (analysis 40 in sample 486211) is a poikiloblastic tremolite that replaces poikilitic chromian diopside that occurs as a patchy poikilitic pyroxene interstitial to massive chromite. The Mg enrichment evident in the pyroxenes as a whole represents initial retrogression toward more Mg-enriched tremolites. Finally, there are also high Mg hydrothermal vein tremolites present at 321 m in Black Thor DDH BT-09-17 with Mg #s of 0.96 to 0.99. These tremolites are zoned and their presence indicates higher T prograde alteration of the upper chromitites in that layer.
4.4.4 Phlogopite The phlogopite probed in Black Label DDH BT-09-31 is unusual due to Ti and Cr enrichment similar to phlogopites found in other chromite-bearing rocks. On a plot of wt. % Al2O3 vs. wt. % TiO2, the phlogopite plots with high Al2O3 at 6.89 to 15.49 wt. % and enriched TiO2 in the primitive mantle box; and they plot with compositions below the box on a kimberlite trend (Fig. 4.35). This would lead one to interpret that these minerals to be sourced directly from the mantle. The phlogopites are hosted within round silicate inclusions in the chromites and also in the surrounding matrix. The phlogopites in the common groundmass are more regular K phlogopites while those in the silicate inclusions are K and more Na-enriched phlogopites. Variation between the K and Na-enriched compositions is seen on a ternary Ba-K-Na plot (Fig. 4.36). Since Na
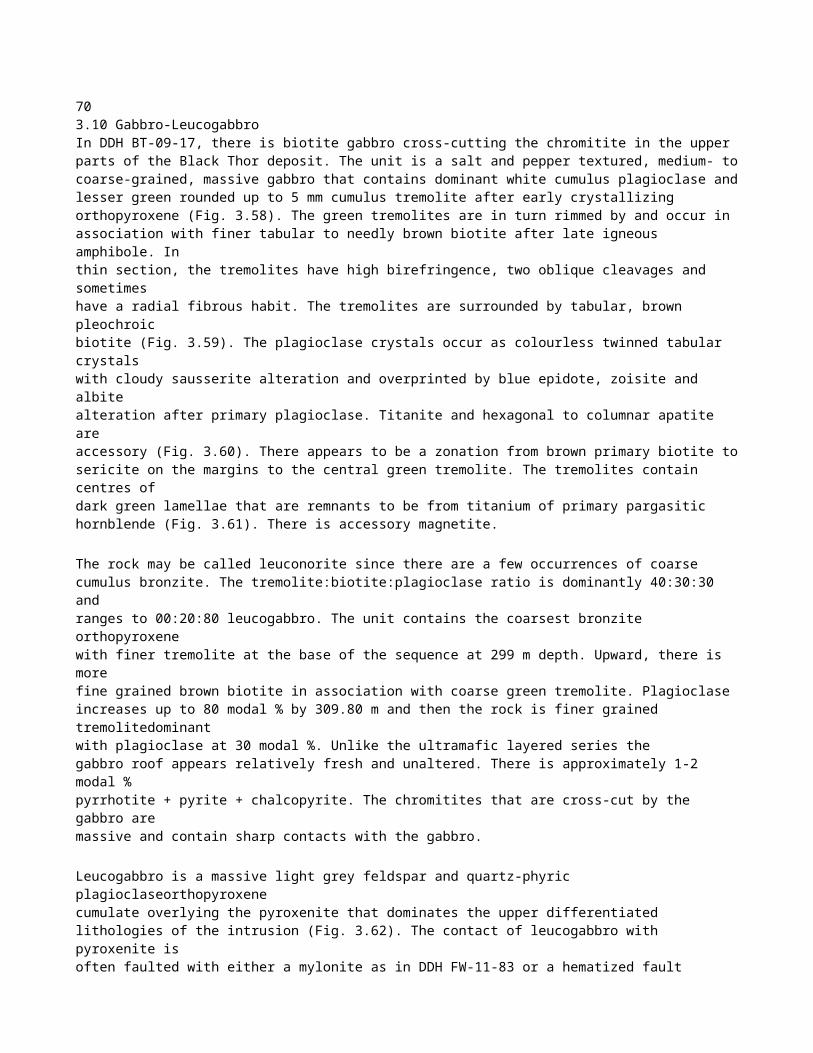
120phlogopites are in the silicate inclusions and not in the groundmass, this could lead one to interpret that the silicate inclusion phlogopites are different than the groundmass phlogopites, possibly encaptured as metasomatized mantle nodules within the chromites.
However, with variation of wt. % MgO and Cr2O3 with up section height, it is shown that the phlogopites (with mostly silicate inclusion phlogopites being represented here) have lower MgO/higher Cr2O3 contents in Black Label Layer 1 and higher MgO/lower Cr2O3 in Layer 2 (Figs. 4.37 and 4.38). The Layer 2 inclusions are therefore more primitive and reflect the trends of more MgO-rich chromites in Layer 2 than in Layer 1. This trend is also seen in the plot of Mg # variation of pargasite-edenite with up section height. A correlation of decreasing wt. % MgO with increasing wt. % Cr2O3 is evident due to Mg-Cr substitution with igneous evolution in the phlogopites (Fig. 4.39). On a plot of wt. % Cr2O3 vs. wt. % TiO2, there is a correlation of increasing Cr with Ti that is similar to that observed in metasomatic phlogopites of the upper mantle (Fig. 4.40; Erlank et al., 1987). In the case of these phlogopites, they were probably enriched in Cr and Ti in the presence of residual melt. It appears therefore that the phlogopite compositions define trends of igneous evolution in Ti and Cr phlogopites and are more akin to ultramafic intrusive-hosting phlogopites in a layered intrusion. The Ti and Cr enrichment in more Na-bearing phlogopites in some of the silicate inclusions has probably been derived from the surrounding chromites themselves similar to phlogopites in the Stillwater Complex (Page and Zientek, 1987). This is discussed in more depth in chapter 6.
4.4.5 Chlorite Chlorites were analysed from three drill holes: Black Label DDH BT-09-31, Black Thor DDH BT-08-10 and Black Thor DDH BT-09-17. On a Fe # vs. Si plot, the chlorites plot as a range of Si vs. Al with very magnesian compositions from sheridanite to clinochlore to penninite (Figs. 4.41 to 4.43). The Mg content of the chlorites reflect the Mg content of the chromites in the various zones. The Black Label chlorites are divided between those found in the Layer 1 and Layer 2 chromite intervals. The Layer 1 chlorites are the four analyses that plot in a separate cluster of higher Fe # than the other chlorites and reflect the higher Fe # of the host chromitites (Fig. 4.42). The Layer 2

127chlorites, on the other hand, are more primitive with lower Fe # more similar to the Black Thor chlorites (Figs. 4.41 and 4.42).
There is a large range of chlorite compositions in the Black Thor chromites analysed. Three types of chlorite have been probed in the samples: 1) chlorites found in the round silicate inclusions in chromite; 2) chlorites found in the matrix of host dunites and chromitites; 3) and chlorites found as inclusions in the reaction margins of chromites. The chlorites are distinguished on a plot of wt. % Cr2O3 vs. wt. % Al2O3 (Fig. 4.44). The chlorites found in the round silicate inclusions plot as the four analyses 43 to 46 which are from sample 486034 at 131.2m in DDH BT-08-10. Three of these chlorites have high Al2O3 at 20 wt. % and elevated Cr2O3 at up to 2.63 wt. %. The fourth chlorite has lower Al2O3 at 15.53 wt. % and higher Cr2O3 at 3.66 wt. % as Cr substitutes with Al. The high Al2O3 and elevated Cr2O3 contents of these minerals are derived from the high Al and Cr contents of the host chromites. They probably formed from retrogression of chromite and host amphiboles and other minerals found within the round inclusions. The chlorites found in the host silicate and surrounding chromites have lower Al2O3 contents of 13 to 15 wt. % and either do or do not contain elevated Cr2O3. Those with elevated Cr2O3 either replace interstitial chromian tremolite occurring interstitial in massive chromitites or are found as chromian chlorites in fractures where there has been mobility of Cr. It has been noted in the petrography chapter that the fracture chlorites all have elevated Cr while other interstitial chlorites either do or do not have elevated Cr. The chlorites found as inclusions in the reaction margins of chlorites are similar to the chlorites found in the round silicate inclusions with elevated Al2O3 from 16 to 20 wt. % and elevated Cr2O3 up to 2.55 wt. %. Some of these chlorites plot with lower Al2O3 and are similar to the matrix chlorites but with higher Cr2O3, up to 5.75 wt. %. The high Cr, low Al is due to substitution of Cr for Al, as in the round silicate inclusion-bearing chlorites.
On a wt. % Cr2O3 vs. wt. % MgO plot, there is an overall trend of decreasing Cr2O3 with increasing MgO in the chlorites as a whole; however, there are two trends within the Black Thor DDH BT-08-10 and Black Label chromites for increasing Cr2O3 with MgO (Fig. 4.45). Overall, the chlorites are found as very Cr-rich (up to 9.61 wt. % Cr2O3) minerals coexisting with the upper chromites of DDH BT-09-17, lesser Cr-rich
(1.6 to 7.17 wt. % Cr2O3) chlorites co-existing with chromite in DDH BT-08-10 and
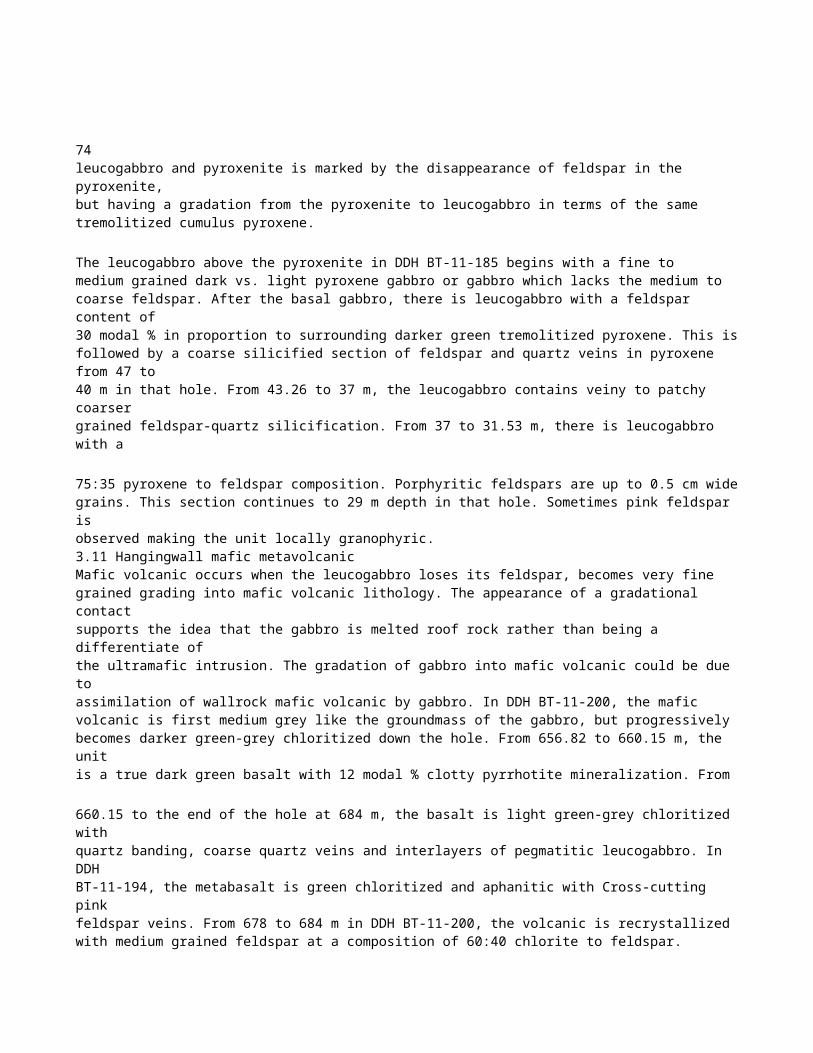
129DDH BT-09-31, and low Cr-bearing regular chlorites coexisting with serpentine in the host dunites to the chromitites.
The high chromian chlorites of DDH BT-09-17 have lower Mg contents since there is Mg enrichment with higher T retrogression of these chromites from core to rim. This would not result in as high Mg content in the resulting chlorite due to mass balance. However, the high Cr enrichment of ferrichromite on the rims of these chromites serves to also enrich the Cr contents in the resulting chlorites. On the wt. % Cr2O3 vs. wt. % Al2O3 diagram, the DDH BT-09-17 chromites follow a separate trend of decreasing Cr2O3 with increasing Al2O3 than the other chlorites (Fig. 4.44). The chlorites as a whole generally decrease in Cr content with substitution with Al. However, the DDH BT-09-17 chlorites retrogressed at higher temperatures resulting in increased Cr and Al contents and substitution of the two elements under these conditions.
The two lower trends of increasing Cr2O3 with MgO are a result of Mg and Cr enrichment with the diffusion of Mg and Cr ions of the primary chromite as retrogression in the resulting chromites (Fig. 4.45). It was also noted in the petrography chapter that Cr is enriched in chlorites along fractures where there has been more retrogression of chromites as opposed to some of the interstitial groundmass to the chromites where there has not been this diffusion.
Finally the low Cr, high Mg chlorites are pristine clinochlores that occur with serpentine in the dunite host to the chromites and as chlorites surrounding chromite where there has not been mobility of Cr. Clinochlore is a result of low T greenschist hydration of the silicates.
130CHAPTER 5 MINERALIZATION
5.1 Introduction The nature of the chromite mineralization at McFaulds Lake is defined by an initial investigation of drillhole assay data, by electron microprobe analysis of major element chemistry of chromite, and by a laser ablation study of trace element chemistry of chromite.
5.2 Metal assay variation Chromium oxide (wt. % Cr2O3), base and precious metals analyses are reported for three DDH holes representative of the three chromite deposits: DDH FW-08-19 for Big Daddy; BT-08-10 for Black Thor; and BT-09-31 for Black Label. These assays are reported on the exploration drill programs by Freewest-Spider-KWG for Big Daddy, and by Freewest for Black Thor and Black Label. Discussion of assay trends presented below are divided into up section Cr2O3 wt. %, Pt, Pd, Ni and Cu variation. This is followed by wt. % Cr2O3 vs. Ni, Ti, Zn and Mn variation for the Black Label, Black Thor and Big Daddy deposits respectively.
5.2.1 Up section wt. % Cr2O3, Pt, Pd, Ni and Cu ppm variation Assay values for whole rock wt. % Cr2O3, ppb Pt+Pd and ppm Ni were investigated as a preliminary framework to performing electron microprobe work on chromite. This data shows basic trends of replenishment and differentiation in terms of Cr2O3 and Ni. Also, associated peaks in Pt+Pd mineralization provide evidence for double diffusive convection processes being involved in PGE concentration in the chromitites and host lithologies. Although helpful to understanding of gross trends through each of the chromitite intervals, care must be taken as the whole rock wt. % Cr2O3, ppm Ni and ppb Pt+Pd represent the content of chromite + silicate rather than chromite alone; the variation in chromite chemistry is determined through electron
131microprobe analyses. The up section variation in these metals is presented for the Black Label, Black Thor and Big Daddy drill holes in sections 5.2.1.1 to 5.2.1.3.
5.2.1.1 Black Label (Figs. 5.1 and 5.2) In Black Label DDH BT-09-31, there are trends of increasing wt. % Cr2O3 upward, identifying repeated pulsing of chromite layers within alternating lithologies in three separate chromitite intervals. The first chromite interval at Black Label is from 154 to 206 m. From 154 to 165 m, there are two initial chromite replenishments with peaks at 14 wt. % Cr2O3. Between 165 to 210 m, there is an overall trend of differentiation with decreasing wt. % Cr2O3. However, in the overall trend, there are individual chromite replenishment peaks in wt. % Cr2O3 that increase in Cr2O3 with each successive replenishment. Pt+Pd show peaks that are offset from the replenishments in Cr2O3, usually beneath each Cr2O3 layer. These PGE peaks probably represent sulphur saturation near the bottom and top boundaries of a convection layer.
PGE peaks at the tops and bottoms of convection layers have been known to occur in other layered complexes such as the Bushveld Complex. They have been attributed to represent initial sulphur saturation of a magma that initially convected near the top and bottom boundary layers of double diffusive convection cells (Rice and von Gruenewaldt, 1994). In the overall interval, Pt+Pd values have signatures of primary Pt+Pd in the top silicate at 206 m and the bottom of the interval at 156 m. With increased stratigraphic height between, there is a decreasing cascading upward trend of Pt+Pd values due to saturations with each chromite replenishment upward in the sequence.
For Cr2O3, the individual replenishments of Cr2O3 in the overall differentiation trend reflect massive to lensy and discontinuous beds of chromitite hosted in pyroxenite between sections of dunite. Along with replenishments in Cr2O3, there are peaks in Ni contents within the dunites that occur after each successive chromite layer. The Ni contents of the dunites increase upward in the section due to replenishing supply of magma. Cu contents show an overall increasing upward trend reflecting higher Cu contents with increased fractionation.
The second chromite interval is from 229 to 277 m. At first there is silicate with little chromite mineralization. Then from 248 to 270 m, there is a series of chromite replenishments that increase in wt. % Cr2O3 upward from 248 to 257, followed by a

136green serpentinized dunite. From 124 to 152 m, there is an interval of intermittent chromitite beds that are variably 1 to 50 cm thick that alternate with dunite. The beds contain layers of chromite that fine upward to chain textures of cumulus chromite and olivine as chromite is filter pressed through the overlying dunite pulses. The individual chromite beds are identified by replenishments in wt. % Cr2O3 that successively increase upward from 124 to 130 m. From 130 to 152 m, replenishments in wt. % Cr2O3 of individual pulses follow an overall decreasing trend in wt. % Cr2O3 due to more dominant differentiation in the sequence. Pt+Pd peaks correspond with Cr2O3 replenishments. Ni ppm increases upward with each dunite pulse between the chromite beds. At 149 m, there is a peak at 2790 ppm Ni along with elevated Cu that is possibly due to sulphide.
From 152 to 165 m, there is another chromitite interval where there is a dominant replenishment of wt. % Cr2O3 followed by decreasing wt. % Cr2O3 in replenishments from 157.8 to 165 m. Ni ppm increases with each dunite pulse between the chromite layers. From 162 to 168.20 m, there are cumulus contacts below the lower and above the upper contacts of the chromite layers indicating a change in the order of crystallization of chromite and olivine. Above 168.20 m, beds then contain cumulus olivine grading up to chromite that indicate dominant cumulus olivine over cumulus chromite mineralization. There are then upward replenishments of increasing wt. % Cr2O3 as the magma switches back to the chromite stability field from 168.20 to 174.20 m. At 174.20m, there is a sharp upper contact of the chromitite bed followed by the main dunite again. Notably, there are peaks in Cu ppm at 175 m depth above the chromite layer which are probably due to sulphur saturation at the upper contact.
The Black Thor deposit in DDH BT-09-17 intersects chromitite located within host pyroxenite and gabbro lithologies which shows trends in greater enrichment in wt. % Cr2O3 compared to the other chromitites in that particular drill hole. The sequence is found from 290 to 345 m depth. At 290 m, there is first pyroxenite with elevated Ni ppm. From 296.30 to 298.80 m, there is a pulse of chromite represented by up to 38.92 wt. % Cr2O3. Along with a peak in wt. % Cr2O3, there is a peak of 306 ppb Pt+Pd. From
298.80 to 318.70 m, there is gabbro. In contrast to the pyroxenite, there is little Ni in the gabbro and the unit is devoid of Pt, Pd and chromite. From 318.70 to 339 m, there are
137three chromite sequences that alternate with gabbro, giving rise to troughs in wt. % Cr2O3. Cr2O3 contents reach a maximum of 43.63 wt. % and possibly show trend in increasing Cr2O3 upward. These could be indicative of enrichment in wt. % Cr2O3 with retrogression of the chromites. Pt+Pd ppb show the highest peak in the third sequence where there is more silica for greater sulphur saturation. Above the sequence from 339 to 345 m, there is again pyroxenite similar to the first pyroxenite at 290 m.
5.2.1.3 Big Daddy (Fig. 5.7) Big Daddy DDH FW-08-19 begins with a sequence of dunite with intervening pyroxenites and heterogeneous olivine pyroxenite as the system changes from cumulus olivine to pyroxene followed by chromite mineralization. There are a few intervals of chromite mineralization before the main sequence from 141.50 to 144.14 m and from
159.37 to 162.00 m that show replenishments in wt. % Cr2O3 and associated peaks in ppb Pt+Pd. In the interval of pyroxenite before the lower contact with the main massive chromitite sequence, there is high ppb Pt+Pd within 20 m of the contact. This possibly represents remobilized PGE since it is not in one horizon with visible sulphide, however it is not fully understood. Some sulphide is present since there is a large peak of 8480 ppm Ni at 165 m (Fig. 4.10). In the company logs, sulphide has been noted with predominately po with minor py and trace cpy. The mineralization style follows the foliation where it is semi massive but it appears to be fine grained disseminated on fracture surfaces. Notably, similar fracture pyrite has been noted immediately above the chromitite/pyroxenite contact which shows a similar peak in Pt+Pd. The massive chromitite begins after the pyroxenite at 183 m and continues to 229
m. Within the sequence, wt. % Cr2O3 is consistently high at between 33 to 39 wt. % Cr2O3. The chromitite sequence is divided into three intervals. The first two there is increasing wt. % Cr2O3 followed by decreasing wt. % Cr2O3 from 183 to 192 m and from 192 to 208.5 m. From 208.5 to 229m, there is an overall decreasing trend in wt. % Cr2O3. The increases in wt. % Cr2O3 are due to replenishments while the decreasing trends are differentiation trends. Pt+Pd values are offet by these increases and decreases probably due to individual sulphur saturations in the top and bottoms of double diffusive convection cells as at Black Label.

139Above the upper contact of the chromitite, there is pyroxenite again. There is high ppm remobilized Pt+Pd again in the background pyroxenite. Notably, there are medium grained fracture pyrite sulphides just above the upper contact. The unit is bleached due to talc, indicative of intense hydrothermal alteration.
5.2.2 Binary metal assay variation Binary metal plots that represent association of Ti, Zn and Mn with modal % chromite are displayed for Black Label (Fig. 5.8). Ni contents, on the other hand, do not show a correlation. For Ti ppm vs. Cr ppm, Ti increases with Cr, demonstrating Ti is partitioned into chromite grains than into silicate. Zn shows an even stronger correlation as Zn partitions into chromite, however, there are also Zn contents that are above the main trend due to sulphide mineralization. Mn generally correlates with Cr like Ti and Zn, however, there is variable Mn content in host dunite vs. pyroxenite. Pyroxenite contains more elevated Mn compared to the dunite. V contents are interesting in that they show two trends of increasing V ppm vs. Cr ppm. These represent the two chromitite intervals of Black Label. The first chromitite interval follows the lower trend plus the higher sloped trend of increasing V ppm vs. Cr ppm. The second chromitite interval only follows the lower sloped trend. The higher V in the first chromitite interval is due to higher V with differentiation of the chromitite in the first chromitite interval while the second chromitite interval is more primitive. These same trends can be shown for the Ti % vs. Cr ppm for these two intervals. The third interval follows the same trend as the second interval only with lower V and Cr contents.
Black Thor BT-08-10 shows well defined positive correlations of Ti, V and Zn with Cr (Fig. 5.9). There is a strong association of these metals with modal % chromite. Mn also shows a positive correlation but more diffuse. The consistent trend in Mn reflects only one host lithology to the chromite which is dunite. Ni contents show a diffuse negative correlation with Cr while an antipathetic positive correlation with Mg %. Therefore, Ni in Black Thor is more strongly associated with Ni in olivine of the dunite pulses.
Big Daddy also shows well defined correlations, although many of the samples plot as either low in the various metal contents or at high metal contents in the massive chromitite (Fig. 5.10). The fewer intermediary metal contents reflect increasing Ti, V, Zn

143with increased modal % chromite. Mn show a broad correlation although many samples contain Mn that do not follow the trend as there is considerable cumulus pyroxene-bearing lithologies with elevated Mn and the chromitite is more varied in Mn with evolution to bordering pyroxenite. The same variability in metals is reflected in Ti and V as well for the massive chromitite interval. Ni shows negative correlation with Cr and shows a subtle positive correlation with Mg % due to Ni in cumulus olivine-bearing dunite.
5.3 Chromite mineral chemical variation A major effort was made to define the mineral chemical variation in the McFaulds Lake chromite deposits. Electron microprobe analysis has been carried out on 300 samples with over 4200 point analyses on samples spaced 20 cm to 1 m apart across individual gravitational cycles. Generally, up to 8 point analyses are made of each chromite sample. More point analyses are needed where there is evident textural variation in modal chromite (i.e. mineral zoning), there is variation in grain size, and higher ferrichromite content (Fig. 5.11). The microprobe work outlines the primary differentiation sequences as well as the effects of secondary hydration on chromite mineral chemistry. Results are listed in Appendix 5.
The microprobe analyses document original igneous compositions best preserved in the cores of large chromite grains in massive chromitite. The smaller, more isolated disseminated chromites have undergone greater silicate exchange. Primary compositions retained in larger grains best define igneous fractionation. Ferrichromite developed on the rims of original grains relates to secondary hydration. Specific chromite mineral chemistry therefore relates to both primary adcumulate sintering and secondary hydrous retrogression.
Current microprobe data shows Cr2O3 loss from 55 to 51 wt. % for centres of grains up section. Grain margins and disseminated smaller grains show up section chemistries of 49 to 47 wt. % Cr2O3. Disseminated chromites have generally undergone more silicate exchange, reporting 48 wt. % Cr2O3. Other elemental variation in the chromites includes increasing Fe, slightly decreasing Al and decreasing Mg due to magmatic differentiation. Near constant low-Al compositions are characteristic of komatiitic chromites. High grade chromite with higher wt. % FeOT forms as retrograde

145ferrichromite rims. Original magmatic chromites are leached of Mg and Al leaving high Cr and Fe behind as ferrichromite.
The ferrichromite content has the effect of increasing or decreasing the Cr content of the ores. Cr-enriched ferrichromites are found as retrogression on the more primitive chromitites while Cr-depleted ferrichromites are found as further retrogression on disseminated chromite. The evolution of the chromites from core to rim to ferrichromite is illustrated in ferrichromite-bearing chromitites in three samples of massive chromite in DDH BT-08-10 (Figs. 5.12 to 5.17). In sample 486044 at 135.2 m, there is primary chromite with 52.18 wt. % Cr2O3, 9.17 wt. % MgO, 19.78 wt. % FeO and 14.09 wt. % Al2O3 (Figs. 5.12 to 5.13). Due to increased diffusion towards the margin of the grain, there is then depletion of Cr2O3 and MgO to 50.04 and 8.87 wt. % respectively with enrichment in Al2O3 and FeO to 14.69 and 20.19 wt. % respectively. In one intermediate ferrichromite, there is enrichment in Cr2O3 and FeO to 57.84 and 22.27 wt. % respectively while depletion in Al2O3 and MgO with substitution to 9.87 and 7.28 wt. % respectively. In a more enriched ferrichromite, Cr2O3 and FeO increase to 59.94 and
21.53 wt. % respectively while Al2O3 and MgO decrease to 7.97 and 7.06 wt. % respectively. The ferrichomite occurs in association with chromian chlorite. There is later growth of Cr-depleted ferrichromite with relic grains of chlorite that decrease in Cr2O3, Al2O3 and MgO to 48.90, 6.92 and 5.76 wt. % while FeO enriches to 23.50 wt. %. Notably, Fe2O3 has a composition of 13 wt. % compared to the earlier Cr-enriched ferrichromite at 2.47 wt. % Fe2O3. The same trend is seen in another chromite from sample 486044 at 135.2 m, but there is an increase from core to rim in Cr2O3 in the primary chromite grain (Figs. 5.14 to 5.15). In sample 486129 at 169.6 m, Cr2O3 enriches to up to 65.11 wt. % with FeO at 23.25 wt. % while Al2O3 and MgO decrease to 2.62 and 5.16 wt. % respectively (Figs. 5.16 to 5.17). 5.3.1 Up section mineral chemistry of chromite Detailed electron microprobe analysis was performed on chromitite intervals through the three deposits. Up section plots showing variation of wt. % Cr2O3 and wt. % MgO vs. depth are provided for the three chromite deposits in section 5.2.1. Comparable Cr #s (Cr/(Cr+Al+Fe3+)) and Mg #s (Mg/(Mg+Fe2+) are plotted to supplement the wt. % Cr2O3 and wt. % MgO. Cr/Fe (Cr2O3/FeOT) diagrams are also indicators of magma
149evolution, but more importantly provide economic grades of the three deposits. There is a major difference from higher grade chromitites with Cr/Fe of 2 to 2.5 to lower grade with Cr/Fe of 1 to 1.7. The lower Cr/Fe is an indicator of more modal silicate degrading the ore. Also plotted are wt. % Al2O3 and wt. % FeO. Plots of wt. % Fe2O3 and wt. % TiO2 for total chromite illustrate the range of spinel compositions between ferrochromite and magnetite, due to primary igneous fractionation and secondary retrogression of the chromites. Black Label analyses are from DDH BT-09-31; Black Thor from DDH BT08-10 and Big Daddy from DDH FW-08-19. Another section of chromitite was probed in DDH BT-09-17 for chromitite hosted in gabbro. Note that since the host sill is overturned, increasing drill hole depths register increasing height in sill stratigraphy.
The microprobe analyses also show details of the deposits in terms of binary variation of major oxides and metals as an aid in tectonic discrimination. Section 5.3.2 documents the binary variation of Black Label, Black Thor and Big Daddy in terms of wt. % Cr2O3, Al2O3 and FeO vs. wt. % MgO along with the metals of wt. % TiO2, ZnO, MnO and NiO vs. wt. % MgO.
In comparing trends of the three chromite deposits, the Black Thor chromites are highest grade with more primitive magmatic compositions in terms of Cr and Mg than the Black Label chromites. Heterogeneous pyroxene oikocrystic harzburgites host the Black Label chromitite, and more heterogeneous textures are displayed by the chromite ores themselves. With higher modal % silicate in the chromitite there is more silicate exchange accounting for the lower 50 to 46 wt. % Cr2O3 in Black Label chromite compared to 53 to 49 wt. % Cr2O3 in Black Thor. In addition to the more primitive composition of Black Thor chromite, magmatic variation grossly accounts for the lower wt. % Cr2O3 in disseminated chromite grains. Although lower Cr2O3 contents occur with more silicate exchange in disseminated grains, a strong linear regression from massive to disseminated grains reflects magmatic differentiation in forming massive through to disseminated chromite (Fig. 5.18). In terms of trends of other oxides, wt. % Al2O3 varies antipathetically with wt. % Cr2O3 and wt. % FeO varies antipathetically with wt. % MgO (Fig. 5.19). TiO2 also increases with decreasing wt. % MgO, though there is less variation in wt. % TiO2 in the deposits.

151The massive chromitite at Big Daddy shows remarkable homogeneity at 50 to 51 wt. % Cr2O3. This is higher than reported assay data for wt. % Cr2O3, which is accounted for by the minor silicate. The homogeneity of the massive ores is attributed to development of chromite layers by double diffusive convection (Rice and von Gruenewaldt, 1994). With little silicate in the massive zones there is less silicate exchange, much less than observed in the exchanged chromitites of the Black Thor and Black Label intersections. Variations from core to rim in all chromite is essentially due to diffusion during secondary hydration.
5.3.1.1 Black Label The two chromitite intervals probed in BT-09-31 have markedly different mineral chemistries. First, from 158 to 161 m, the Cr2O3 and MgO values in disseminated chromite are low with maximum contents of 42 to 44 wt. % Cr2O3 and up to 4.67 wt. % MgO (Figs. 5.20 to 5.23). Notably, FeO contents are high ranging from 26 to 30 wt. % (Fig. 5.24). The first chromitite interval from 161 to 203 m comprises 4 zones defined by 4 pulses of decreasing wt. % MgO with height (Fig. 5.21). Cr/Fe ratios are lower with between 0.98 and 2.26 for magmatic compositions and as low as 0.41 for alteration rim Cr-enriched to Cr-depleted ferrichromites (Fig. 5.25). Within this first interval, wt. % Al2O3 contents are more elevated in these chromites than in the chromites from the second interval, except for the low wt. % Al2O3 contents in the Cr-enriched to Cr-depleted ferrichromites (Fig. 5.26). The trend in wt. % Al2O3 is also evident in wt. % TiO2 where the first interval contains higher wt. % TiO2 than the second interval.
The first pulse from the first interval is from 161 to 164 m and contains the lowest wt. % MgO and wt. % Cr2O3. The next two pulses are larger up to 20 m in thickness, and contain well defined differentiation sequences of decreasing wt. % MgO. Within these two pulses are individual replenishments with MgO peaks followed by decreasing wt. % MgO. The second pulse contains two subzones with wt. % MgO decreasing in the second subzone from 176 to 179 m. Notably, there is a large amount of Cr-depleted ferrichromite detected at the top of this subzone as displayed by enriched Fe2O3 compositions (Fig. 5.27). There appears to be an association of Cr-depleted ferrichromite with evolved chromite. This is due to more diffusion and leaching of ions to form the Cr-depleted ferrichromite where there is a greater proportion of adjacent silicate.
160The third pulse contains three subzones of decreasing wt. % Cr2O3 with height, following the pattern of differentiation shown by the MgO contents. In the fourth pulse of the chromitite interval, with each new replenishment the Cr2O3 contents remained high at about 50 wt. % Cr2O3. However, individual differentiation sequences of decreasing Cr2O3 wt. % with height can be picked out within up to 6m thick mini-pulses. These mini cycles possibly formed by convection cells within the larger pulse of magma (Rice and von Gruenewaldt, 1994; Naldrett et al., 2010).
The second chromitite interval is from 229 to 276 m and contains 3 zones from 229 to 257 m, 257 to 265 m and from 265 to 276 m characterized by separate subsets of elevated wt. % Cr2O3 separated by troughs of low wt. % Cr2O3. Notably, the Cr2O3 values are consistently high at above 50 wt. % suggesting a primitive chromitite interval. In the first zone, 3 pulses of replenished MgO are followed by decreasing MgO trends. Cr/Fe ratios are higher and more primitive in this second interval with between 1.82 and
2.42 for magmatic chromite compositions and as low as 1.38 for alteration rim Cr-enriched to Cr-depleted ferrichromites. With each successive replenishment, there is an overall increase in the MgO values. This suggests the influx of more primitive magma. The high peaks above 53 wt. % Cr2O3 with low wt. % MgO are Cr-enriched ferrichromites due to secondary hydration. In the second zone, there are 2 pulses with the second being larger, and having higher wt. % MgO and Cr2O3 than the second. Notably, more secondary Cr-enriched ferrichromite has been detected in this first pulse. The second pulse shows marked decreasing wt. % MgO with height while the Cr2O3 values decrease to a lesser extent. The third zone contains 3 to 4 pulses on an overall trend of decreasing Cr2O3 wt. % with height. The first pulse from 259 to 270 m contains higher wt. % MgO than the others and is well differentiated. The second pulse is poorly developed. The 3rd to 4th pulses from 272 to 276 m begin with more elevated MgO that decreases past 274 m. The overall decreasing trend in Cr2O3 wt. % in this zone also reflects igneous differentiation. 5.3.1.2 Black Thor BT-08-10 Black Thor DDH BT-08-10 contains chromite of more primitive but also more variable composition due to diffusion processes accompanying greater ferrichromite replacement during retrogression. Therefore, plots of core + margin of igneous chromite

161have been separated from replacement ferrichromite. Cr/Fe ratios in the drill hole are less for disseminated but more for primitive and higher grade overall than Black Label with between 1.53 and 2.90 for magmatic compositions and as low as 0.74 for alteration rim Cr-enriched to Cr-depleted ferrichromites (Fig. 5.28). Some Cr-enriched ferrichromites in the upper part of the hole above 154 m have enriched Cr/Fe to the range of 2.50 to 2.95, thereby increasing the grade of the ore. From 114 to 124 m there are two zones of low MgO chromite disseminated in dunite (Figs. 5.29 to 5.30). The first zone from 114 to 118.5 m, comprises two pulses with trends of decreasing wt. % MgO with height. The second zone from 118.5 to 124 m also contains 2 pulses with decreasing wt. % MgO with height.
Above 124 m, chromite shows elevated wt. % Cr2O3 in intermittent beds of massive chromitite (Figs. 5.31 to 5.32). Between 124 and 127 m there is a well differentiated sequence showing decreasing wt. % MgO and Cr2O3 with height. A large zone of chromitite between 127 and 150 m can be subdivided into two zones from 127 to 136 m and 136 to 150 m based on Cr2O3 contents. These chromitites begin with high Cr2O3 wt. % contents and show a marked trend of decreasing MgO and Cr2O3 with height. In the first subzone, Cr2O3 contents reach 54 wt. % suggesting very primitive magma.
The upper zone from 150 to 174 m, also show trends of decreasing MgO and Cr2O3 wt. % with height. Notably, there is only a slight decrease in wt. % Cr2O3. This may be explained by development of chromite convection cells. A number of replenishments of high MgO may be also attributed to successive convection cells (Rice and von Gruenewaldt, 1994). Also shown are variation of FeO, Al2O3 and Fe2O3 with height (Figs. 5.33 to 5.35).
5.3.1.3 Black Thor BT-09-17 The Black Thor upper chromitite in DDH BT-09-17 displays trends in the mineral chemistry of chromite that are different than DDH BT-08-10 and the other chromite deposits. Instead of decrease in wt. % Cr2O3 and wt. % MgO from core to rim that is most common with silicate exchange of chromite in the other deposits, there is enrichment in wt. % Cr2O3 and wt. % MgO that effectively increases the grade of the ores (Figs. 5.36 to 5.39). With enrichment in Cr2O3 and MgO, there is enrichment in Cr/Fe

174from core to margin with ratios of between 1.88 and 2.44 for magmatic chromite (Fig. 5.40). In contrast to other drill holes, the Cr-enriched ferrichromites serve to enrich the upper chromitites in Cr/Fe with compositions reaching up to 3.03 with retrogression. The high Cr/Fe in the ferrichromites is due to the decrease in FeOT in these chromites.
In the drill hole sequence, there are two chromitite intervals, the first situated between pyroxenite and gabbro and the second situated between gabbro and pyroxenite. In the lower interval, from core to margin of the grains, there is an increase in Cr2O3, Al2O3 and MgO while a decrease in FeOT that occurs due to silicate exchange with retrogressive fluids. Evidence for retrogression is “zoning” toward the margins that also occur along interior cracks and rims with associated alteration rim replacement chromite. Along with these trends, retrogression has been observed with the occurrence of bright alteration margins (similar to ferrichromite) with enriched 61.75 wt. % Cr2O3, low 6.45 wt. % Al2O3, low 4.62 wt. % MgO and elevated 23.84 wt. % FeOT. These are probably Cr-enriched ferrichromites, although the ferric iron content is not as high.
Retrogression has also been observed with the occurrence of chrome chlorites and tremolites with very little wt. % FeOT which could be interpreted as hydrothermal tremolite in contrast with tremolite that results from the replacememt pyroxene. Also, higher up in the second chromitite interval, the chromites are more diffused with increased Cr2O3, Al2O3, but with decreased MgO to 4 to 6 wt. %. It appears that the upper chromitites underwent higher temperature hydrothermal metamorphism to the tremolite field in the lower parts but have been more retrogressed in the upper parts of the upper chromitite. The lower T retrogression in the upper part is probably a later hydration overprint. The chromites in the upper parts of the zone are more non-uniform, broken up and enriched in silicate due to late influx of retrogressive fluids. In the two intervals, since only 12 samples were analysed in the chromitite and the differentiation and replenishment trends are masked by these retrogressive Cr2O3 and MgO enrichments, primary igneous signatures are too overprinted to interpret any fine scale cryptic layering.
For variation of major oxides with depth, the lower chromitite interval from
296.30 to 298.80 m contains more primary chromite than the second interval. The chromites show uniformity in the back scatter images with evidence for primary cores in well zoned chromites. From 296.80 to 298.40 m, the samples begin with wt. % Cr2O3 at

17649.59 wt. % Cr2O3 and increase upward to 52 to 54 wt. % Cr2O3 with retrogression. MgO decreases from 7.95 to 6.62 wt. % MgO in the igneous cores but shows enriched zonation on the margins to 9.01 wt. % MgO. Other trends include a decrease in wt. % Al2O3 while increase in wt. % FeO in the igneous core from the first to the second sample (Figs. 4.41 and 4.42). However there is an increase in wt. % Al2O3, while decrease in wt. % FeO in the silicate exchanged zoned margins. The alteration rim chromites at 59.06 and 62.75 wt. % Cr2O3 have no wt. % Fe2O3 and low FeO at 23.41 and 24.61 wt. %. The second chromitite interval is from 318.70 to 339 m. There are three sequences as seen from the variation in wt. % Cr2O3 from the assays. In the microprobed chromites, the first chromite sequence is from 319 to 324 m. There is a decrease in wt. % Cr2O3 in the igneous cores going up the sequence, however, Cr2O3 contents are enriched to up to 53.36 wt. % Cr2O3 on the diffused margins. MgO increases up to 9.69 wt. % MgO with retrogressive silicate exchange. Within the overall second interval, alteration rims report up to 68.03 wt. % Cr2O3 in chromite. Fe2O3 contents in the overall DDH BT09-17 are more depleted than the Fe2O3 contents of the other drill holes (Fig. 4.43). The second chromite sequence from 326 to 331 m shows an enrichment in wt. % Cr2O3 in the cores followed by a decrease in wt. % Cr2O3. With retrogression, the margins are enriched to 53.9 wt. % Cr2O3. MgO decreases from 7.72 to a low 3.69 wt. % MgO in the cores along with margins. These chromites are not as uniform as the chromites in the lower sequences, due to considerable fracturing and silicate exchange. It is interpreted that primary compositions are not preserved. In the third chromite sequence from 334 to 338 m, MgO increases to 7.37 wt. % MgO probably due to a new pulse along with retrogressive enrichment in wt. % MgO. Cr2O3 concentrations at 49.47 wt. % are not as high, however, due to lack of primary chromite signatures. Notably, Fe2O3 becomes more elevated from 3.14 to 4.47 wt. % Fe2O3 in these more evolved chromites.
5.3.1.4 Big Daddy Before the main chromitite in Big Daddy DDH FW-08-19, there is a sequence of dunite, heterogeneous pyroxenite and pyroxenite with intervening chromites. The chromites microprobed in this section are usually disseminated chromites found in dunite and sometimes pyroxenite. At 13.50 m depth, there is first a band of primitive chromite in dunite that contains high wt. % Cr2O3 and MgO (Figs. 5.44 to 5.48). In contrast there

185is low wt. % Al2O3 and FeO (Figs. 5.49 to 5.50). This chromite band is located in dunite just above a small layer of pyroxenite and is interpreted to form due to the mixing of a new dunite pulse with pyroxenite. Another such layer occurs at 20.10 m. At 16.07 m, disseminated interstitial chromite in dunite is more evolved in composition with lower wt. % Cr2O3 and MgO and higher wt. % Al2O3 and FeO. The dunite continues to 69.40
m. At first there is differentiation from 16.07 to 35.20 m toward lower wt. % Cr2O3 and MgO with intervening pyroxenite. Then there is a new pulse of dunite after beginning somewhere after 33.36 m with higher wt. % Cr2O3 and MgO at 55.62 m depth. Pyroxenite begins after 64.00 m above a faulted contact with the dunite. Another pulse of dunite occurs from 73.97 to 84.94 m and contains more primitive chromite at 75.36 m. From 74.36 to 135.2 m, the interstitial chromite in the host units become steadily more evolved as there is differentiated pyroxenite that grades into heterogeneous olivine pyroxene to harzburgite. This represents a mixed unit interpreted to be caused by magma mixing of a pulse of pyroxenite with dunite to form chromitite in an overlying pulse. Compositions show increasing wt. % FeO, wt. % TiO2 while decreasing wt. % Al2O3 in the pyroxenite (Fig. 5.51). Lower wt. % Al2O3 is due to retrogression in the pyroxenite. From 141.50 to 144.14 m, there is a chromitite layer containing semi-massive chromitite in cumulus pyroxene and olivine. The chromitite contains the highest wt. % Cr2O3 and MgO with 53.45 wt. % Cr2O3 and 11.68 wt. % MgO making it the most primitive chromitite in the sequence. Then compositions are lower again in an overlying disseminated chromite-bearing dunite. The chromites then become progressively more evolved from 144.50 to 182.40 m as the dunite grades into heterogeneous olivine pyroxenite and in turn pyroxenite. Chromite in pyroxenite is vermicular in texture with low wt. % Cr2O3 and MgO. Within this first sequence, there are ferrichromites that contain higher wt. % Cr2O3 and wt. % Fe2O3 (Fig. 5.52). The main Big Daddy interval begins at 183.80 m depth. It is all massive chromitite and therefore demonstrates a markedly different compositional trend than Black Thor and Label. MgO and Cr2O3 compositions are more uniform in the chromites (Figs. 5.53 to 5.56). This is especially reflected in constant Cr2O3 from one zone to another. The main chromitite interval in the hole is from 183 to 230 m and is divided into 4 main zones as defined by troughs in wt. % MgO. With constant Cr2O3


194compositions, Cr/Fe is consistent at 2.25 for magmatic chromite, but tapers off near the upper contact with pyroxenite to lower Cr/Fe of down to 1.17 (Fig. 5.57). Minor variability in Cr/Fe is due to more variable wt. % MgO or FeO (Fig. 5.58). Cr-enriched ferrichromite where present enriches the Cr/Fe ratio. The first zone from 183 to 192 m, begins with two minor replenishments in wt. % MgO followed by decreasing wt. % MgO with height from 187 to 192 m. Chromite compositions are at 51 wt. % Cr2O3. The second zone from 192 to 206 m, begins with a pulse from 192 to 194 m at lower wt. % MgO followed by three successive pulses beginning at 11.46 wt. % MgO that decreases successively upward. Chromite compositions are constant at 50 wt. % Cr2O3. The third zone from 206 to 227 m, starts with a pulse at 11.27 wt. % MgO that decreases with height from 206 to 211 m. From 211 to 227 m there is a large well defined differentiation sequence. Chromite compositions decrease subtly from 51 to 47 wt. % Cr2O3 as the interval approaches the upper contact with pyroxenite. From 227 to 230 m is a contact zone with a pronounced decrease to 3 wt. % MgO and 41 wt. % Cr2O3 toward the contact. This zone is probably depleted due to silicate exchange with pale grey to white globular shaped aggregates of pyroxene. Also, there is more ferrichromite in this zone indicating higher degrees of hydration.
Al2O3 contents show a different pattern of variation in the Big Daddy interval. For wt. % Al2O3, the interval can be divided into three zones from 183 to 203 m, from 203 to 216 m and from 216 to 230 m (Fig. 5.59). The first zone shows a general trend of slightly increasing wt. % Al2O3 from 13.14 to 14.85 wt. % Al2O3. These contents are antipathetic the decreasing differentiation trend of the Cr2O3 contents. From 203 to 216 m, the Al2O3 contents first decrease and then increase in a concave pattern, due to replenishment followed by differentiation. Then from 216 to 230 m, there is another general increase in wt. % Al2O3 toward the contact with differentiation and silicate exchange with pyroxenite. The difference between the Al2O3 and MgO trends is due to less variation of Al2O3 and Cr2O3 within the complete convection cycles in massive chromitite compared to the more variable pattern of the Black Label and Thor intervals. Ferrichromites that are plotted have very low wt. % Al2O3. For wt. % Fe2O3 variation, contents are below 10 wt. % Fe2O3 and therefore do not show the retrogression to Cr-depleted ferrichromite as in Black Thor and Label (Fig. 5.60).
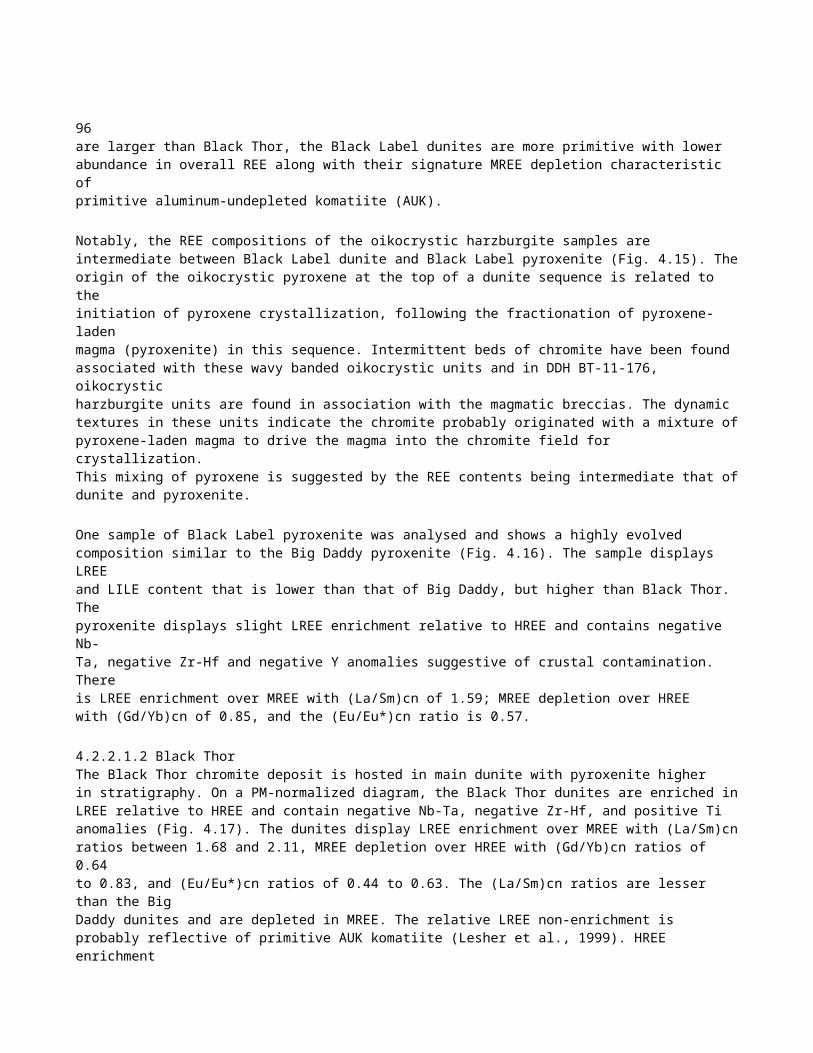
1995.3.2.1 Black Label binary chromite chemistry The Black Label chromites show interesting trends in terms of wt. % Cr2O3 vs. wt. % MgO. Within DDH BT-09-31, two separate chromitite intervals are delineated as Layer 1 and Layer 2 (Figs. 5.61 to 5.62). Overall, there is a well defined positive correlation of increasing wt. % Cr2O3 with increasing wt. % MgO. Layer 1 is the bottom chromitite horizon from 161 to 203 m and is characterized by both lower and higher trends of increasing wt. % Cr2O3 with wt. % MgO. Layer 1 overlaps Layer 2 on the higher trend since here it represents the primary cores of the more massive chromitites that show igneous evolution from high wt. % Cr2O3 and MgO to lower wt. % Cr2O3 and MgO. Although, Layer 1 also plots on the lower trend because there is more differentiation to lower wt. % Cr2O3 and wt. % MgO in the disseminated chromites of this sequence vs. the more primitive larger grains of the massive chromites.
A general observation of the Black Label chromites is that chromitites are not as high grade as that of Black Thor and Big Daddy. This is due to the amount of intercumulus pyroxene content in the ore that causes the chromites to be more silica-enriched than the more primitive Black Thor and Big Daddy chromites. In the lower left of the plot, a number of Cr-depleted ferrichromites have been detected that have low MgO and a drop in Cr2O3 compared to the other chromites. In contrast, Cr-enriched ferrichromites are plotted off the trend and contain abnormally high wt. % Cr2O3 but low wt. % MgO.
There are several paths for chromite evolution as the primary grains undergo diffusion at their margins and in turn contain alteration replacement rims with retrogression. One path is from Layer 1 (chromite evolution 1). First the chromite crystallized out of the melt to form the primary core composition. With diffusion towards the margin, Mg and Cr contents are leached and exchanged with surrounding silicate. In turn, the chromite is retrogressed to a very MgO and Cr2O3-depleted ferrichromite at the rim. Another common example is that of chromite evolution 2 where an original chromite grain undergoes silicate exchange/diffusion at the margin thereby leaching both Cr and Mg components, but gaining Al and Fe components. Another path that could happen involves a chromite in Layer 2. A more primitive chromite is crystallized out of the melt. As it undergoes diffusion, Cr is again leached, but this time,

Figure 5.61. Binary plot of Cr2O3 vs. MgO wt. % for Black Label DDH BT-09-31 with paths of chromite evolution shown. Figure 5.62. Black Label layers 1 and 2 of DDH BT-09-31. The primary, higher Cr2O3 and MgO cores of massive chromite from layer 1 are overlapped by the chromites of layer 2. 0 10 20 30 40 50 60 70 0 2 4 6 8 10 12 Cr2O3 wt. % MgO wt. % Series1 Chromite evolution 1 Chromite evolution 2 Chromite evolution 3 0 10 20 30 40 50 60 700 2 4 6 8 10 12 Cr2O3 wt. % MgO wt. % Layer 1 Layer 2 200
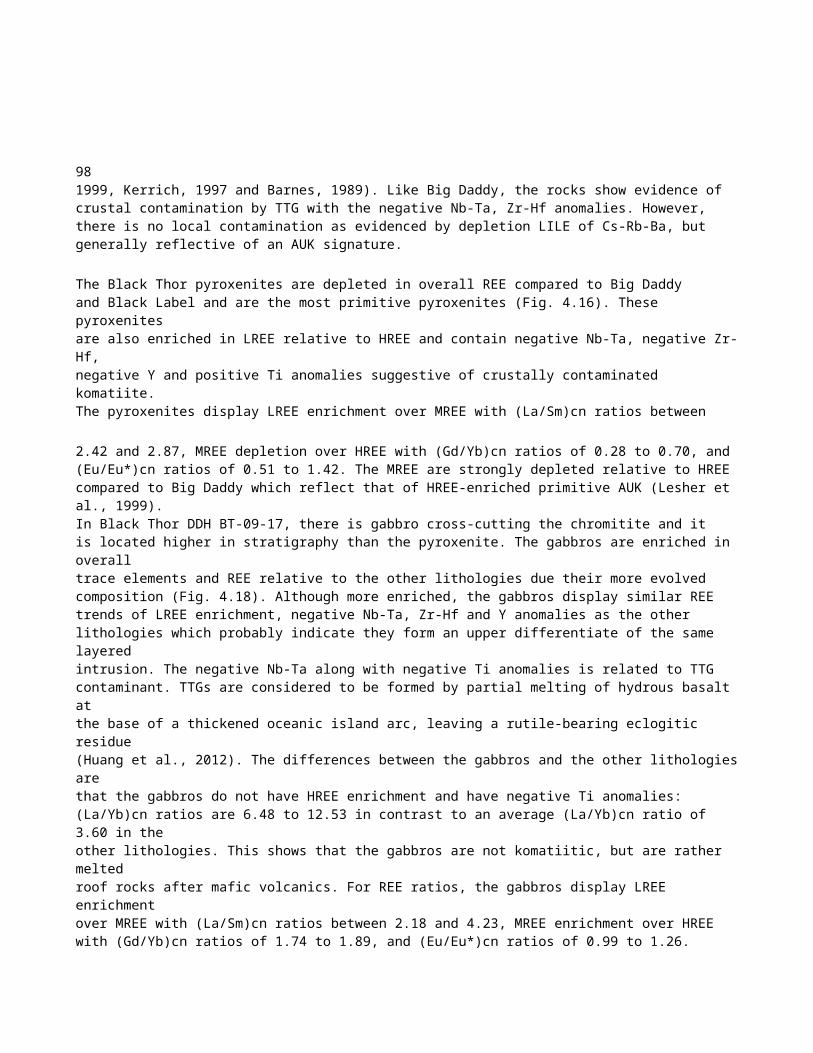
201 Mg is gained. Although there are sometimes increases in Mg and Al or sometimes even increases in Cr, the path mostly taken is that of diffusion to leach Cr and Mg and gain Al and Fe to eventually be replaced by ferrichromite. So this grain is eventually replaced by a Cr-enriched and high ferric iron-bearing ferrichromite as the last composition on the replacement rim.
For wt. % Al2O3 vs. wt. % MgO variation, wt. % Al2O3 is not well correlated with wt. MgO, but more or less shows a constant composition for the primitive chromite compositions as seen by the overlap of Layers 1 and 2 at lower wt. % Al2O3 and higher wt. % MgO (Fig. 5.63). In Layer 1, many of the more disseminated chromites contain higher wt. % Al2O3 reflective of silicate exchange with interstitial pyroxene. There is a well defined positive correlation in the transition of the chromites to Cr-enriched to Cr-depleted ferrichromites. With increasing Fe2O3, there is a great decrease in wt. % Al2O3 with substitution. Therefore, the Cr-enriched to Cr-depleted ferrichromites show a substantial decrease in wt. % Al2O3.
FeO shows a well defined correlation antipathetic to MgO (Fig. 5.64). With both diffusion and differentiation of the primary chromites, there is an increase in wt. % FeO from core to margin to Cr-enriched or Cr-depleted ferrichromite and from massive to disseminated chromites that have undergone more silicate exchange.
A Binary plot of wt. % TiO2 vs. wt. % Fe2O3 demonstrates the behaviour of Fe vs. Ti in the Fe-Ti trend (Fig. 5.65). Most of the samples plot as a cluster with low wt. % TiO2 at low wt. % Fe2O3. With fractionation of olivine or pyroxene from the magma, the Fe/Mg ratio and Ti contents of the melt increase so there is enrichment of these elements in the more differentiated chromites (Barnes and Roeder, 2001). The trend is then accentuated by the reaction of the chromites with the intercumulus magma to produce the high TiO2-bearing Cr-depleted ferrichromites (Barnes and Roeder, 2001). With continuation toward magnetite, the wt. % TiO2 contents decrease again at the highest wt. % Fe2O3. This trend is common to chromites of MORB basalts and also stratiform layered intrusion chromitites.
For binary plots of metals, wt. % TiO2 shows a subtle negative correlation with increasing wt. % Cr2O3 since there is more wt. % TiO2 in the differentiated chromites (Fig. 5.66). There is a large increase in wt. % TiO2 toward the Cr-depleted

204 ferrichromites. For wt. % TiO2 vs. wt. % FeO, there is a well defined igneous fractionation trend of increasing wt. % TiO2 with wt. % FeO (Fig. 5.67). Above this trend are TiO2-enriched Cr-depleted ferrichromites that have high wt. % FeO. For wt. % ZnO vs. wt. % Cr2O3, the chromites are separated into clusters for Layers 1 and 2 (Fig. 5.68). Layer 1 overlaps the higher and lower wt. % ZnO clusters at low and high wt. % Cr2O3 respectively, while Layer 2 overlaps the lower wt. % ZnO at higher wt. % Cr2O3. The decrease in wt. % ZnO with increasing wt. % Cr2O3 is due increase in ZnO with differentiation. For wt. % NiO vs. wt. % Cr2O3, NiO correlates with Cr2O3 in two layers (Fig. 5.69). Layer 1 has lower wt. % NiO at lower wt. % Cr2O3 than Layer 2.
5.3.2.2 Black Thor BT-08-10 binary chromite chemistry Black Thor DDH BT-08-10 displays similar variation to Black Label, with more Cr-enriched ferrichromites analysed along with Cr-depleted ferrichromites. On a wt. % Cr2O3 vs. wt. % MgO diagram, there is a well defined correlation of wt. % Cr2O3 with MgO from the primitive to the differentiated chromites (Fig. 5.70). Typical paths of chromite evolution are displayed similar to Black Label. The Cr-depleted ferrichromites plot off the trend at lower wt. % Cr2O3 and wt. % MgO and the ferrichromites plot off the trend with high wt. % Cr2O3 at lower wt. % MgO. The Black Thor chromites are the most primitive with compositions reaching 54 wt. % Cr2O3 and 12 wt. % MgO which are even higher than Layer 2 of Black Label. Although primitive, there is still variation from massive to disseminate chromites that characterize the igneous evolution of other stratiform layered intrusions such as the Great Dyke (Wilson, 1982).
For wt. % Al2O3 vs. wt. % MgO, Black Thor shows the same trends as Black Label with a constant Al2O3 composition for the primitive chromitites and diffusing to higher wt. % Al2O3 at the margins (Fig. 5.71). The Cr-enriched to Cr-depleted ferrichromites plot on a well defined trend of decreasing Al with substitution of Fe3+. For wt. % FeO vs. wt. % MgO, there is a well defined negative correlation with substitution from the massive to disseminated chromites. Notably, the wt. % FeO contents are lower in Black Thor than Black Label (Fig. 5.72).
For binary plots of metals, wt. % TiO2 shows a subtle negative correlation with wt. % Cr2O3 (Fig. 5.73). The TiO2 compositions of Black Thor are lower than Black Label. Also displayed are the high TiO2 Cr-depleted ferrichromites at low wt. % Cr2O3
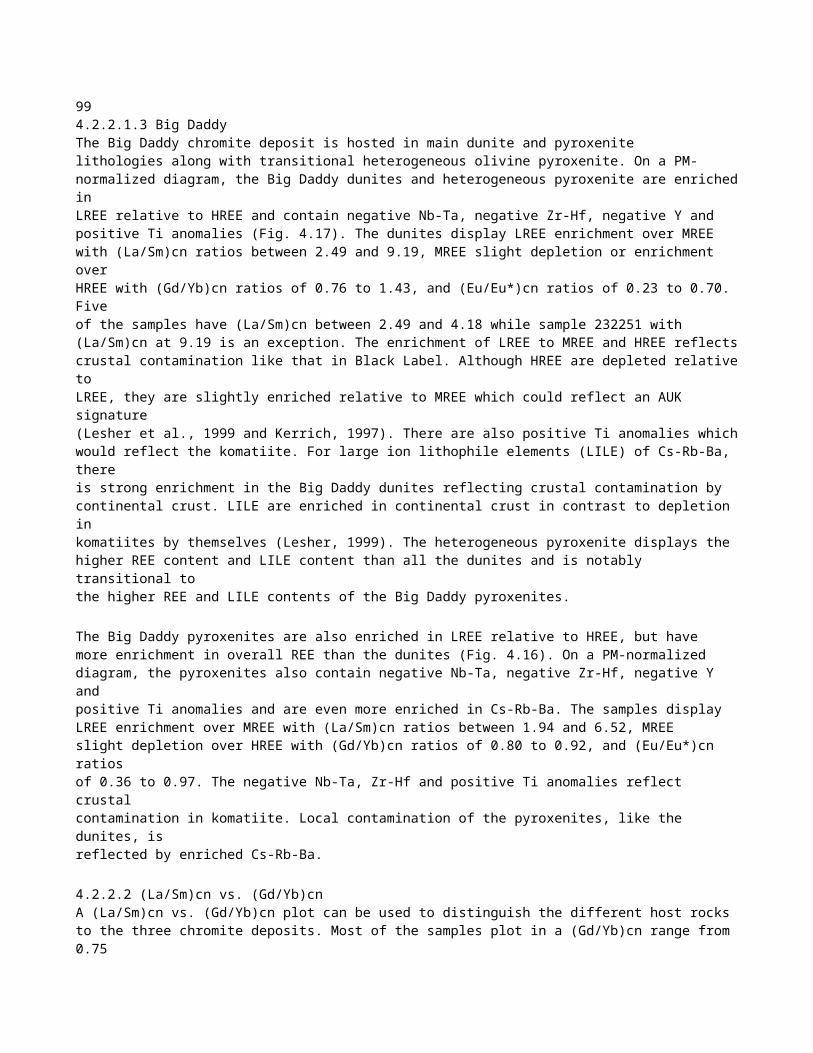
209 and the low TiO2 ferrichromites at high wt. % Cr2O3. Wt. % ZnO increases with decreased wt. % Cr2O3 due to differentiation (Fig. 5.74). The ZnO contents are lower than ZnO of Layer 1 in Black Label. The NiO contents of Black Thor are noticeably lower than Black Label for both layers of Black Label (Fig. 5.75. Wt. % MnO shows a slight negative correlation with wt. % Cr2O3. This is due to MnO increasing with differentiation (Fig. 5.76).
5.3.2.3 Black Thor BT-09-17 binary chromite chemistry The upper chromitite of DDH BT-09-17 show similar binary variation of major oxides as the other chromite deposits but contains trends of chromite enrichment rather than depletion due to retrogression. On a wt. % Cr2O3 vs. wt. % MgO diagram, there is increased wt. % Cr2O3 with wt. % MgO similar to the other deposits, only the chromites evolve in the direction from lower to higher wt. % Cr2O3 and wt. % MgO with retrogression (Fig. 5.77). This can be seen in the chromite evolution 1 trend on the diagram where core to margin compositions increase from 51.70 to 52.21 wt. % Cr2O3 in one of the grains. The later alteration rims of the chromites have even higher wt. % Cr2O3 compared to the Cr-enriched ferrichromites in the other deposits. Chromites enrich to as high as 68.03 wt. % Cr2O3. Notably, there are two separated chromite composition clusters on the diagram. Most of the chromites contain more primitive and higher wt. % Cr2O3 and wt. % MgO while the lower compositions are from more evolved chromites higher up in the second chromitite interval in the drill hole.
For wt. % Al2O3 vs. wt. % MgO variation, there are trends of increasing wt. % Al2O3 with wt. % MgO from the cores to rims due to retrogression (Fig. 5.78). Al2O3 compositions are higher compared to the other chromites of Black Thor DDH BT-08-10 to as high as 18.57 wt. % Al2O3. This higher Al2O3 content is probably due to enrichment of Al2O3 with higher retrogression that overprints the primary chemistry. From primary chromite core to alteration rim, there is a well defined positive

correlation of decreasing wt. % Al2O3 with decreasing wt. % MgO. This trend shows these rim chromites are behaving the same as Cr-enriched to Cr-depleted ferrichromites in the other deposits ie. Al is substituting with Cr. For wt. % FeO vs. wt. % MgO variation, there is a well defined negative correlation of wt. % FeO and MgO that is characteristic of all the

213deposits (Fig. 5.79). Notably, the alteration rim chromites are even more depleted in wt. % FeO and fall off the trend with decreasing wt. % MgO.
For other oxides, wt. % TiO2 increases with decreasing wt. % Cr2O3 (Fig. 5.80). Therefore, wt. % TiO2 does not increase with retrogression from core to margin in the chromites. ZnO is variable but also increases with decreasing wt. % Cr2O3 (Fig. 5.81). NiO is low in these chromites since the pyroxenites are not elevated in Ni ppm (Fig. 5.82). MnO increases with decreasing wt. % Cr2O3 like the other oxides (Fig. 5.83).
5.3.2.4 Big Daddy binary chromite chemistry The Big Daddy chromites show relatively uniform compositions for major element and metals in contrast to the other deposits. For wt. % Cr2O3 vs. wt. % MgO variation, there is a positive linear correlation of increasing wt. % Cr2O3 with increasing wt. % MgO in the igneous chromites (Fig. 5.84). The lower wt. % MgO-bearing chromites have more scattered wt. % Cr2O3 contents than most of the chromites in the high MgO region. These chromites are from disseminated chromites hosted as minor cumulus phases in the dunites, heterogeneous pyroxenites and pyroxenites located below the main massive chromitite. The different contents of these chromites is due to differentiation in those pulses. Then from 7.33 to 11.68 wt. % MgO, there are chromites in the massive chromitite that plot on a well defined trend of increasing Cr2O3 with MgO. The slope of the trend is small compared to the other chromite deposits since there is not as much variation in the more complete convection cycles of these massive chromites. A few chromites plotting from 35 to 40 wt. % Cr2O3 are from the more retrogressed chromites in the pyroxenites. Also plotted are a few Cr-enriched ferrichromite with high wt. % Cr2O3 contents.
For wt. Al2O3 vs. wt. % MgO variation, most of the Al2O3 contents are constant with respect to wt. % MgO since there is little pyroxene to promote pyroxene-chromite substitution of Al2O3 (Fig. 5.85). The Al2O3 contents plot from 12 to 14 wt. % Al2O3 with lesser variation for the massive chromitite interval. The Al2O3 contents are lower than Black Label and Black Thor since there is less differentiation. Notably, wt. % Al2O3 does not plot above 16 wt. % Al2O3 as it does in the other deposits, even in the disseminated chromite. The disseminated and massive chromites have compositions from 11 to 15 wt. % Al2O3. However, Al2O3 is higher in the intermediate chromitite at
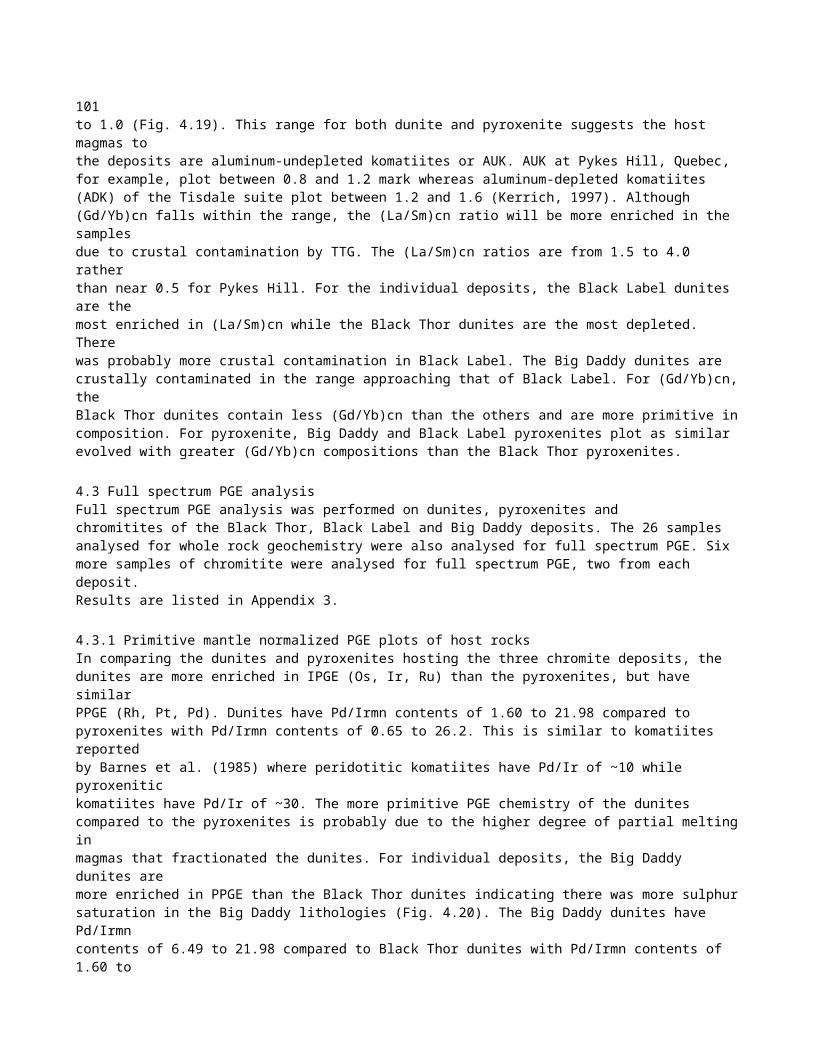
218 161.50 m depth. In the samples with more intermediate modal % chromite i.e. chromite ranging in between massive and disseminated chromite, the chromitites are hosted by heterogeneous pyroxenite and dunite. The chromitites probably mineralized in a magma driven toward more pyroxene stability rather than being constantly primitive due to repetitive replenishment of chromite pulses that are closer to olivine stability as in the massive chromitite interval. And the disseminated chromites primarily mineralized in cumulus olivine dunite sequences where there is less Al2O3 content. Notably, there is lower wt. % Al2O3 in the disseminated chromites while higher wt. % Al2O3 in the intermediate chromites of e.g. Black Thor which supports this observation. For wt. % FeO vs. wt. % MgO, there is similar separation of disseminated vs. massive chromite regions that are visible in the wt. % Cr2O3 vs. wt. % MgO variation diagrams (Fig. 5.86). There is a general well defined trend of decreasing wt. % FeO with increasing wt. % MgO with substitution of the elements from more primitive to differentiated chromites. From 7.33 to 11.68 wt. % MgO, there is a large bunch of analyses with lower wt. % FeO that represent the massive chromites.
For binary plots of metals, there is a slight negative correlation of decreasing wt. % TiO2 with increasing wt. % Cr2O3 with evolution of the chromites (Fig. 5.87). Higher wt. % TiO2 samples represent evolved chromites of the disseminated chromite-bearing host lithologies located beneath the main zone. The negative correlation is also reflected in the wt. % ZnO vs. wt. % Cr2O3 (Fig. 5.88). The ZnO contents are elevated to 0.2 wt. % ZnO as in other deposits except for Layer 1 of Black Label. There are many samples of elevated ZnO above 0.2 wt. that reflect the more differentiated chromites in the host rocks below the main chromitite. The wt. % NiO vs. wt. % Cr2O3 shows a well defined correlation of increasing wt. % NiO with increasing wt. % Cr2O3 reflecting the igneous variation of the chromites (Fig. 5.89). NiO contents are high to 0.4 wt. % NiO which is similar to the higher wt. % NiO of Layer 2 in Black Label. The high NiO contents reflect the predominance of primary chromite that is present at these stratigraphic levels of Big Daddy and Black Label. MnO clusters at between 0.4 and 0.8 wt. % MnO at 50 wt. % Cr2O3 (Fig. 5.90). There is also a negative correlation of decreasing wt. % MnO with decreasing wt. % Cr2O3 reflecting higher MnO in the more differentiated disseminated chromites.

222 5.4 Laser ablation ICP-MS analysis of chromite Laser ablation ICP-MS analysis was carried out on chromites from three drill holes from the three deposits: Black Label DDH BT-09-31, Black Thor DDH BT-08-10 and Big Daddy DDH FW-08-19. There were 142 laser point analyses taken from 35 samples with up to 5 to 6 analyses taken per sample. The goal of the laser ablation work was to characterize the trace element signatures and variability of the three deposits with possible insights into using these signatures for an exploration vector. Trace elements of Sc, Ti, V, Mn, Co, Ni, Zn, Ga are reported and plotted on chromite normalized to chromite in MORB trace element plots. Binary variation of these elements with Cr is reported below. Another output of the analysis is an analysis of Ru, Rh, Pd, Os, Ir and Pt PGE in the deposits. However, the PGE in most of the samples are below detection limits, so they are not reported below. See Appendix 6 for the total suite of elements analysed by laser ablation.
5.4.1 Chromite/Chromite in MORB trace element plots The laser geochemical results of the three deposits were analysed at the GSC facility in Ottawa May 16 to 18 and December 18 to 21, 2012. Results were first organized on an excel spreadsheet with care to subtract bad analyses. Chromite/chromite in MORB-normalized diagrams were then plotted for a useable suite of elements based on Pagé’s work on the Thetford chromitites (Pagé, 2009).
The MORB chromite normalized patterns of the chromites reflect that of layered intrusion chromitites with large positive Ti anomalies and increased Fe contents and large negative Sc anomalies. There is also evolution in the patterns from more primitive komatiite to more evolved intrusion patterns where komatiites typically contain lower but positive Ti, negative Ni and negative Sc anomalies (Pagé and Barnes, 2012). The Black Label chromitites have high positive Ti anomalies indicating fractionated magma chemistry (Fig. 5.91). Zn and Co are elevated, again indicating these chromitites being more evolved. The Black Label chromitites are highest in Fe content and lowest in Mg content. There is more elevated Zn content in the disseminated chromite of Black Label. There are distinct negative Ni anomalies at Black Label in contrast to the other chromitites which indicates these chromitites are more evolved.
224At Black Thor, there are 2 subsets, a more differentiated and primitive sample (Fig. 5.92). The primitive komatiitic sample has a lesser positive Ti anomaly and lesser Zn and Co similar to the Great Dyke pattern, though being enriched in Fe (Jiménez et al., 2012). The more differentiated suite has a greater positive Ti anomaly with greater Zn and Co, more like Bushveld. V contents of the chromitites are high, in common with layered intrusion chromites in contrast to more primitive komatiite chromites.
The Big Daddy chromitites consistently show positive Ti anomalies, but contain the most depleted Zn and Co, probably reflecting their primitive nature (Fig. 5.93). They are not, however, as primitive as the first subset of Black Thor. Notably, the Sc contents are more elevated. Mn contents are higher in Big Daddy and Black Label than Black Thor since they are more differentiated.
5.4.2 Binary trace element variation The chromitites show trends of the elements vs. Cr that are indicative of fractionation from the more massive to disseminated chromites. Fractionation trends are displayed by increases of Ti, V, Co, Ga, Zn, Mn vs. Cr while decreases in Ni and Sc vs. Cr. Specific results from the three deposits are presented below.
The Black Label chromitites show the most fractionated magma chemistry of the three deposits (Fig. 5.94). Trace element concentrations include 2350 to 6012 ppm Ti, 794 to 1448 ppm V, 516 to 2392 ppm Zn, 2086 to 3016 ppm Mn, and 110 to 542 ppm Ni. For binary variation, fractionation trends are displayed by negative correlations of Zn, V and Mn with Cr and a positive correlation of Sc with Cr. Sc behaves incompatibly similar to Ni in these deposits. Ni appears to show a positive correlation and generally increases with Cr. Although showing fractionation with depleting trends of Cr in komatiitic chromites such as Alexo, Ga shows an enriching trend suggestive of it behaving incompatibly like Ni and Sc (Méric et al., 2012). Ga shows this positive correlation in all the deposits. Ti and Co vs. Cr plots no significant trend.
The Black Thor chromitites are the most primitive of the deposits with trace element concentrations that include 1125 to 2792 ppm Ti, 819 to 1277 ppm V, 575 to 1577 ppm Zn, 1125 to 2792 ppm Mn, and 526 to 1112 ppm Ni (Fig. 5.95). For binary variation, fractionation trends are displayed by negative correlations of Ti, Zn, Mn and Co with Cr and positive correlations of Ni and Sc with Cr. Ti shows two negative

2250.1 1 10 Al Ga Ti Ni Mg Zn Co Mn FeOT V Sc Cr Chromite / Chromite in MORB Figure 5.93. Chromite in MORB normalized trace element plot of Big Daddy DDH FW-08-19. Normalizing values of Pagé and Barnes (2009).
226226Figure 5.94. Binary plots of Cr vs. Ti, V, Zn, Mn, Ni, Co, Sc and Ga ppm for Black Label DDH BT-09-31.

227227Figure 5.95. Binary plots of Cr vs. Ti, V, Zn, Mn, Ni, Co, Sc and Ga ppm for Black Thor DDH BT-08-10.
228correlation trends for higher and lower Ti concentrations representative of two different sample subsets of the deposit, one being more primitive than the other. Zn and Mn show well defined correlations. V appears to show a weak negative correlation. Ga again shows a negative correlation. Ni and Sc also show well defined positive correlations indicative of fractionation.
The Big Daddy chromitites show less but similar variability as the other deposits (Fig. 5.96). Trace element concentrations include 2336 to 3923 ppm Ti, 940 to 1425 ppm V, 381 to 769 ppm Zn, 1758 to 3209 ppm Mn, and 668 to 1482 ppm Ni. Ni is higher and reflects the primitive character of the deposit like Black Thor. Mn contents are higher than the other deposits. Many of the Ni contents are high since the samples are all from massive chromite. For binary variation, correlations are less well defined but show negative correlations for Ti, Zn and possibly Mn with Cr. Correlations are positive for Ni and Sc with Cr. Ga shows a variable but negative correlation.

230CHAPTER 6 DISCUSSION
6.1 Introduction For discussion of the McFaulds Lake deposits, the chromites are first plotted on tectonic discrimination diagrams to compare the chromites with other deposits of the world and indicate the type setting. Origin of chromite as it pertains to these deposits is then discussed in terms of an evaluation of Irvine’s (1975) model, followed by a discussion of silicate inclusions leading up an evaluation of Irvine’s (1977) proposal for chromite genesis. Magma mixing is proposed for origin and is further refined by advocating the double diffusive convection model. Postcumulus chromite growth is then discussed and an evaluation is made of the conduit theory for chromite origin. Finally, the late hydration overprint is discussed in terms of chromite ore modification.
6.2 Tectonic discrimination of chromite 6.2.1 The Cr# vs. Mg# plot Chromites can be distinguished between komatiitic, layered intrusion and other environments such as ophiolitic by means of the Cr# vs. Mg# catio ratio plot (Figs. 6.1 and 6.2). In comparison to other chromites of the world, the McFaulds Lake chromites plot well in the fields of stratiform mafic intrusions and komatiite with the exception of the ferrichromites. In comparison to komatiite chromites, the McFaulds Lake chromites are similarly high in Cr/Al for the most primitive chromites. The primitive chromites of McFaulds Lake are most similar to the Great Dyke chromites. Other komatiitic chromites such as those from the Selukwe dataset, the Hartley Complex and the Wedza Complex and the Shurugwi dataset are however, slightly more Cr/Al-rich due to high Cr and low Al and more Mg-rich. There is not much pyroxene in the komatiitic magmas to exchange Al into the chromite structures. Also, lack of differentiation tends to make these deposits plot at a higher Mg composition. There is still substantial variation in Mg#
Figure 6.1. Cr # vs. Mg # plot of McFaulds Lake chromites with other layered intrusion and komatiite chromites of the world. World chromite data is from Barnes and Roeder (2001). Figure 6.2. Cr # vs. Mg # plot of McFaulds Lake chromites with other chromite deposits of the world. World chromite data is from Barnes and Roeder (2001). 00.1 0.2 0.3 0.4 0.5 0.6 0.7 0.8 0.9 1 1 0.8 0.6 0.4 0.2 0 Cr/(Cr+Al+Fe3+) Mg/(Mg+Fe2+) Layeredintrusion Greenschistkomatiite McFauldsLakeDeposits 0.00 0.10 0.20 0.30 0.40 0.50 0.60 0.70 0.80 0.90 1.00 1.00 0.80 0.60 0.40 0.20 0.00 Cr/(Cr+Al+Fe3+) Mg/(Mg+Fe2+) McFauldsLake Deposits Selukwe Hartley Wedza Bushveld GreatDyke Shurugwi Kemi Inyala 231

232 in the Great Dyke deposits, but only up to a Mg# composition of 0.218. The McFaulds Lake deposits then follow a trend toward decreasing Cr# with decreasing Mg# as in evident in other stratiform layered intrusions. However, other stratiform complexes that follow this trend do not plot at high Cr# and high Mg# compositions. A similar stratiform complex that follows a trend of decreasing Cr# with decreasing Mg# is the Bushveld Complex. Although having the same trend, the Bushveld chromites have overall lower Cr# than McFaulds Lake. The lower Cr# of Bushveld is due to the predominance of pyroxene to exchange Al with the chromite to lower the Cr#.
With increasing differentiation i.e. as the chromites go to lower Mg# composition along the increasing Fe-Ti trend, there are lower Cr#s in the McFaulds Lake chromites. Since there is a strong correlation of decreasing Cr# with decreasing Mg# in the McFaulds Lake chromites, this would indicate magmatic evolution typical of a differentiated intrusion. The McFaulds Lake deposits plot on an overall trend of primitive komatiite to more differentiated with increasing Fe-Ti and finally to more pyroxene-dominated differentiated compositions. The primitive McFaulds Lake chromites are similar to the Great Dyke komatiitic chromites; they become more differentiated along an increasing Fe-Ti trend similar to Great Dyke followed by Bushveld; and then decrease Cr# with differentiation and pyroxene fractionation similar to Bushveld chromite.
Another thick chromitite deposit, the Kemi Intrusion chromitite deposit is plotted for comparison. Although similar in thickness, the Kemi deposit is lower in grade at lower Cr# than the McFaulds Lake deposits and rather plots similar to the Bushveld complex. For comparison to the main chromites, the Cr-enriched to Cr-depleted ferrichromites of McFaulds Lake are also plotted. There is a much larger dataset for these secondary chromites in McFaulds Lake than for other chromites of the world. Unusual trends in Cr# enrichment with decreasing Mg# is evident in the Cr-enriched ferrichromites which is significant for higher grade chromite ores. The trend toward Cr-enrichment occurs with retrogression of the chromite rims. In contrast to Cr-enrichment, retrogression also produces a secondary chromite trend to low Cr# compositions with low Mg# in the Cr-depleted ferrichromites.
2336.2.2 The Ternary Cr-Fe3+-Al plot The ternary Cr-Fe3+-Al plot is also used for tectonic discrimation of chromites. On a Cr-Fe3+-Al plot, the McFaulds Lake deposits plot well in the field for komatiites and in the komatiitic part of the layered intrusions (Fig. 6.3). They plot near the corner of high Cr but lower Fe3+ and low Al. The lower Fe3+ and Al is typical of low Al-bearing undifferentiated komatiites. Although lower in Fe3+, there is still more Fe3+ in the McFaulds Lake chromites than in the komatiite chromites. This is similar to the Mg#Cr# diagram in that the McFaulds Lake deposits follow an Fe-Ti trend with more differentiation than komatiite chromites. However, the broad overlap of the McFaulds Lake deposits with the komatiite field clearly shows the deposits have komatiite affinity
i.e. primary chromite of komatiite composition. Like the Cr#-Mg# plots, there are also fields for the Cr-enriched to Cr-depleted ferrichromites. All the secondary chromites plot with low Al since Al is either substituted for Cr or Fe3+ in the chromite structure. The Cr-enriched ferrichromites plot at compositions intermediate between Cr and Fe3+ while the Cr-depleted ferrichromites plot toward the Fe3+ end. There is a subset of high Cr, low Fe3+ and low Al ferrichromites near the Cr apex of the plot. These represent the Cr-enriched ferrichromites of the upper chromitite of DDH BT-09-17 that follow a different trend than the other secondary chromites of the other deposits. 6.3 Origin of chromite: An Evaluation of Irvine’s 1975 model The origin of the McFaulds Lake chromite deposits is linked to the petrography and geochemistry of the host rocks and ores themselves. The deposits as a whole may be classified with stratiform magmatic Cr/PGE ores in layered complexes (Duke, 1988). Stratiform chromite deposits are formed by magmatic segregation during fractional crystallization (fractionation) of mafic-ultramafic magma. The precise reasons why massive chromite cumulate layers form have not been entirely understood. In the first of Irvine’s models (Irvine, 1975) he suggested a mechanism whereby a chromite saturated picritic tholeiite liquid becomes more siliceous by contamination (assimilation) with granitic material or alternatively by blending with a more siliceous differentiate of the parent magma, thereby causing chromite to precipitate. In this model, the original magma is contaminated while coprecipitating olivine and minor chromite. A period
Al2O3 0.0 0.1 0.2 0.3 0.4 0.5 0.6 0.7 0.8 0.9 1.0 Fe2O3 0.0 0.1 0.2 0.3 0.4 0.5 0.6 0.7 0.8 0.9 1.0 Cr2O3 0.0 0.1 0.2 0.3 0.4 0.5 0.6 0.7 0.8 0.9 1.0 Layered intrusion Greenschist komatiite McFaulds Lake deposits Figure 6.3. Ternary Cr-Fe3+-Al plot of the McFaulds Lake chromites with other layered intrusion and komatiite chromites of the world. World chromite data is from Barnes and Roeder (2001). 234

235 follows when chromite precipitates alone, and then, because the liquid is enriched in silica, orthopyroxene crystallizes instead of olivine (Irvine, 1975).
In the case of the McFaulds Lake deposits, initial crystallization of an olivinechromite cumulate is indicated by dunite with disseminated chromite followed by the transition into massive chromite alone. However, what is not explained by this model is how the magma migrates into chromite-alone stability. It is assumed that this occurs with decreasing temperature as this is the dominant control of fractional crystallization. However, this does not explain the sudden onset of massive chromite from the disseminated chromite-bearing dunite. The magma needs to be directly shifted into the chromite-only field. A mechanism for driving melt chemistry from the chromite-only field to pyroxene is by crustal contamination. A contaminant would raise the silica content of the olivine magma so that it shifts directly into chromite stability. This would ideally work in the case of a chromite-laden pulse of magma after crystallization of chromite and olivine, that injests some silica-rich country rock to directly raise the silica of the melt to pyroxene stability. Although this model explains the transition of olivine to massive chromite, there is no explanation for the sudden break from chromite back into the pyroxene stability field. In other words, there are two modes of magma emplacement occurring one after the other which is an unlikely scenario. The appearance of intermittent chromitite beds after disseminated chromite suggests that there were intermittent pulses of magma to separate out chromite layers rather than a single magma batch being fractionated into chromite stability. There must have been episodic pooling and dithering of the magma to the right composition to cause the rainout of chromite layers eventually forming the massive chromitite zone.
There are several problems with Irvine’s 1975 model. As suggested by Irvine (1977) and Mondal (2010), it takes an enormous amount of silica to migrate the melt to pyroxene stability. Rollinson (1997) in his discussion of the komatiitic chromites in Inyala, Zimbabwe, counters this argument by saying that for komatiitic melts, the melts have a high melting temperature sufficient to assimilate silica in the formation of chromite from olivine along with the later surrounding pyroxenites. There the pyroxenites are in the transition zone of dunite with country rock. In McFaulds Lake, the chromite compositions plot similarly to komatiitic chromites of the Great Dyke yet
236contain pyroxenites similar to the intrusion in Inyala. Also, from the primitive mantle multielement plots, it can be observed that the dunites are of komatiitic affinity, with crustal contamination signatures evident of incorporation of TTG. However, the pyroxenites at McFaulds Lake appear to contain pyroxenite in an ordered layered series from dunite to pyroxenite with leucogabbro melted roof rock. From the primitive mantle multielement plots, it can be seen that the pyroxenites appear to be originated from komatiitic melts that have been contaminated by TTG, similar to dunite but with more contamination. However, both are part of the same series of intrusives that have incorporated TTG. Since there was inheritance of a crustal contamination signature in the dunite below the chromite intervals, this would suggest that TTG assimilation was already inherent in the magmas before chromite crystallization.
The leucogabbro has been argued as to not be a part of the layered series but as melted roof rock to the intrusion. True, the leucogabbro has distinct evolved signatures from the dunite and pyroxenite; however, there also appears to be a crustal contaminant signature of TTG in the leucogabbro as well. In drill core, the leucogabbro contains textures of large scale silicification of an original gabbro that are probably from the injestion of TTG or other country rock since these are non-igneous. However, this implies that the gabbro existed and was overprinted by silicification, not that the gabbro itself originated as a result of silicification. Roof rock assimilation is evidenced by typical granophyric textures of coarse pink K-spar patches that occur in some of the feldspathic zones. Therefore the upper gabbro likely developed as a “typical granophyres” in the roof of the intrusion. It represents the crustally contaminated border of the intrusion and not the pyroxenite. Other clues to it being the roof of the intrusion are its large extent in the Ring of Fire intrusion and its abrupt change from pyroxenite, as opposed to it being a gradational replacement zone. Therefore, since the pyroxenite is not located at the contact of the wallrock, it is probably not a transition replacement zone of chromite with wall rock as implied for the origin of komatiitic chromite in Inyala by Rollinson (1997).
Another problem with the Irvine (1975) model is that it is only applied to cases of silica addition. Often in chromitites, there is the sequence of dunite to chromitite to pyroxenite which implies a migration of the melt with lowering of temperature and silica

237contamination from olivine to chromite to pyroxene on the liquidus. However, not all chromitites occur in this sequence order. In the second layer of Black Label, there is pyroxenite before the chromitite which is followed in turn by oikocrystic harzburgite and dunite. In the first layer of Black Label DDH BT-09-31, the oikocrystic harzburgite is a transitional unit with crystallization of more intercumulus pyroxene from dunite to pyroxenite. In the second interval of that drill hole however, the oikocrystic unit is transitional from pyroxenite to oikocrystic unit/chromitite to dunite with a small pulse of dunite in between the pyroxenite and oikocrystic unit. This explains the onset of cumulus olivine rainout.
In Big Daddy DDH FW-08-19, there is a sequence of pyroxenite followed by the transitional heterogeneous pyroxenite unit, then chromitite followed by dunite resulting in the sequence order of pyroxenite to chromitite to dunite. In the second chromitite layer of DDH BT-09-17 there is first pyroxenite followed by cumulus pyroxene with chromite, then chromitite with minor dunite and then pyroxenite. In these scenarios, the chromitite is related to the migration of the melt from pyroxene to chromite to olivine. Notably, most chromitite layers occur in the sequence from dunite to chromitite to pyroxenite. Since this reversal in crystallization order involves an increase in temperature, the migration of the melt to eventual olivine could only work with magma mixing rather than a fractionation mechanism. There is no way of depleting the melt of silica except for some sort of mixture with a primitive melt which is inferred to be the mechanism for chromite origin.
Another problem with the model is that the chromite is related to the magma chemistry of the host rocks and not the assimilant. If a new dunite pulse was contaminated by TTG to mineralize chromite, the presence of variable plagioclase content with variable contamination would cause variable Cr contents of the ores. However, in the Big Daddy massive chromitite interval, the chromites that were probably derived from various replenishments have a consistent Cr2O3 composition up section. The chromites all have primitive Cr2O3 compositions related to the chromite that are primitive and closer to olivine stability rather that being lowered by plagioclase content of an assimilant. In their discussion of the Bushveld chromitites, Naldrett et al. (2009) show that Al2O3 content of chromite mineralized in equilibrium with plagioclase will be

238buffered by the high Al2O3 content of plagioclase. The effect is to raise the Cr/(Cr+Al) or lower the Al2O3 content of the chromite since the chemical potential of Al2O3 is over its maximized value and is buffered by plagioclase (Naldrett et al., 2009). In the Big Daddy massive chromitite, there is no enrichment or depletion in Al2O3 in the chromite that would result due to the presence of plagioclase, as would be present in a crustally contaminated dunite pulse.
In the sequences of dunite to chromitite to pyroxenite, it may be argued that there was replacement of pyroxene by olivine to drive the melt into chromite stability. This is the mechanism thought to be the origin of some podiform chromitites. In the harzburgitic mantle the migration of an intercumulus melt causes replacement of pyroxene, incorporation of silica and the precipitation of pods of chromitite (Matsumoto and Arai, 2001). Or in a layered intrusion sequence, the influx of a primitive melt could dissolve and assimilate the roof pyroxenite of an intrusion and precipitate chromitite (Pagé, 2010). However, there appears to be several stacked sequences of dunite to chromitite to pyroxenite where there are large thicknesses of the later pyroxenite. It is unlikely that the large sequences of pyroxenite are all a result of roof contamination when there are later higher and more primitive sequences of chromitite in Black Label Layer 2 for example. Also the occurrence of some reversed crystallization orders of pyroxenite to chromitite to dunite and the presence of cumulus chromite in pyroxenite makes it unlikely that the pyroxenite was a result of roof assimilation.
The evidence that is missing is the lack of xenoliths in drill core that would be injested by the magma for incorporation into the melt. Mungall (2008) outlines the presence of iron formation xenoliths for the Eagle’s Nest deposit and proposed the same incorporation of contaminant in the formation of the Blackbird deposit chromites. The assimilation of TTG is inherent to the trace element geochemistry of the McFaulds Lake dunites and pyroxenites. Iron formation has been observed as xenolith in the Black Creek chromite deposit (Lavigne, pers. communication, 2013). However, there have been no xenoliths detected in the McFaulds Lake chromite layers that would explain the formation of the large chromite layers.
Another means proposed for chromite formation is straight fractionation. This would explain the presence of cumulus chromite and olivine in disseminated chromite

239bearing dunite. Though, often in deposits such as Big Daddy, there is chromite disseminated in dunite followed by thick massive chromitite before overlying pyroxenite. What would cause a chromite-only crystallization change from chromite + olivine? There appears to be no mechanism of dithering and keeping the intercumulus melt in the chromite only field in order to produces up to 40 m thickness of chromitite. And of course the sequence of pyroxenite to chromite to dunite is not explained.
6.4 Silicate Inclusions in Chromite There has been evidence used to support chromite origin by silica addition by means of the presence of silicate inclusions with minerals such as albite and amphibole. This interpretation was made in Irvine (1975). The presence of serpentine, chlorite or tremolite would be explained as the result of replacement of olivine. However, silicate inclusions of albite and amphibole are foreign to the surrounding retrograded serpentines and tremolites of the intrusive dunites and pyroxenites. The Kemi deposit in Finland is a chromite deposit similar in thickness to the McFaulds Lake deposits. Alapieti et al. (1989) described the Kemi deposit in detail and concluded that it is a stratiform chromite deposit in an ultramafic layered intrusion. He proposed that chromite crystallization was initiated by silica addition/salic contamination. Evidences for silica addition were round silicate inclusions of serpentine, amphibole or albite in chromite grains. The presence of albite inclusions in chromite hosted by dunite suggested entrapment of wallrock contaminant. Spandler et al. (2005) discuss the presence of mineral inclusions of enstatite, aspidolite (Na-phlogopite), magnesiokatophorite (Na-Ca amphibole), albite and diopside. Spandler et al. (2005) referenced Page and Zientek (1987), proposing that Na amphiboles and micas significantly more Na-rich than the primary amphibole and phlogopite of the surrounding cumulates, are exotic, related to contamination of the primary magma by a Na-rich trondhjemitic melt.
In the McFaulds Lake chromites, silicate inclusions of serpentine and tremolite have been observed in the chromites. The inclusions of serpentine and tremolite in the chromites of this study have been documented to undergo sintering as evidenced by the concentric growth of chromites around olivines and also adcumulus growth with the presence of incomplete chromites growing around silicate. In these cases, the resultant inclusions have compositions and sometimes cleavage planes that are the same as the

240surrounding tremolite silicate. Therefore, these inclusions are shown to be a result of sintering similar to silicate inclusions of chromites in the Bushveld Complex (Hulbert and Von Gruenewaldt, 1985; Fig. 6.4). However, exotic inclusions of chromian diopside, chromian magnesiokatophorite, chromian Na-phlogopite and albite have also been found in the chromites. This would appear to suggest they are exotic inclusions involved in the origin of the chromite that were a result of contamination. The McFaulds Lake dunites and pyroxenites have trace element compositions that show crustal contamination of komatiite by Na-rich TTG. However, the magnesiokatophorites analysed have high TiO2 contents similar to that of late igneous amphiboles in ultramafic intrusions. Primary pargasites, for example, often have high TiO2 concentrations (Embey-Isztin, 1976). Borisova (2012) in his discussion of silicate inclusions in the Oman ophiolite chromitites, discusses that the high Ti and Cr contents of the amphiboles indicate either a magmatic or high T hydrothermal environment of formation, since these elements are less mobile in the presence of low T aqueous fluids. So these amphiboles would be magmatic.
Another observation is that primary pargasite occurs as a relic grain interior to tremolite in the host silicate to the chromite in sample 486163 that has silicate inclusions of the same pargasite composition. This is evidence that the mineral inclusions are residual amphiboles similar to that of the surrounding host rock and are therefore not exotic. A similar scenario could be suggested for the Na-phlogopite although the Naphlogopite was not found in the host silicate. Though Cr-bearing Na-, titanian phlogopites occur as late stage igneous phases in other olivine-chromite cumulates such as the host rocks to the B chromitites in the Stillwater Complex (Page and Zientek, 1987). High Cr and Ti contents in phlogopites have been shown to be enriched by metasomatism in zoning trends of phlogopites of South Africa (Field et al., 1989). If the McFaulds Lake inclusions were a result of high T metasomatism, this would affect the chemistries of the chromites themselves with enrichment in silica and titanium. However, titanium distribution has shown to be less at the cores of the chromites rather than being enriched. The lower Ti as well as primitive high Cr and high Mg contents suggest that the chemistries of the chromites are primary residual melt rather than enriched by metasomatism. Another evidence of the phlogopite being postcumulus is the presence of similar K phlogopites in the surrounding host rocks and evidence of chromite in the
241Fig. 6.4. Annealing process for the formation of silicate inclusions/atoll structures in chromite. From Hulbert and Von Gruenewaldt (1985).

242intermediate stages of enveloping phlogopite minerals (See petrography chapter, silicate inclusions). Such evidence of the annealing of chromite around phlogopite has also been documented in chromites of the Western Laouni mafic intrusion in Algeria (Lorand and Cottin, 1987).
Sometimes the magesiokatophorite has been subsequently altered or the magnesiokatophorite replaces original clinopyroxene which is different alteration then the low T hydration of silicate surrounding the chromite. This shows that the silicate inclusions are often isolated from the silicate surrounding the chromite and reflects a different alteration. Often Na-katophorites have been found in silicate inclusions where there is no igneous amphibole surrounding the chromite. This could be explained by possible slumping of pulses that could have mobilized the chromite from the surroundings. In such a circumstance, the chromite composition would still be relatively similar to the surrounding host rock olivine or pyroxene magma. Another explanation that seems more plausible is that the minerals formed from residual melt encapsulated in the growing chromite. This explanation is discussed below in the discussion of Sharpe’s (1983) thesis.
The high Ti and Cr compositions of the silicate inclusion-bearing amphiboles and phlogopites appear to be mantle compositions. On a Cr2O3 vs. Al2O3 plot of the phlogopites analysed, the minerals plot in the primitive mantle box and follow a trend of high Mg compositions similar to kimberlites. Also the Ti and Cr-enriched magnesiokatophorites and pargasites are similar to such amphiboles found in mantle nodules of kimberlites of the Jagersfontein and Kimberley kimberlites (Field et al., 1989). Page and Zietek (1987) discuss similar mantle-like compositions for the hornblendes and phlogopites of the Stillwater Intrusion. They reference Arima and Edgar (1981) for the solubility of titanium of phlogopites in mantle compositions. However, Page and Zietek (1987) state that the phlogopites certainly did not crystallize at high pressure and temperature mantle regimes. In their analysis of postcumulus hornblende and phlogopite compositions with height of the Stillwater Intrusion, they have shown that these compositions reflect the chromite content of the surrounding rocks. McElduff and Stumpfl (1991) have proposed that these minerals found in silicate inclusions form in the same process of postcumulus amphibole and phlogopite in the layered chromitites of the

243Troodos Complex. Lorand and Cottin (1987), in their study of the silicate inclusions in chromites of the Western Laouni mafic intrusion, also concluded that the inclusions are postcumulus like the surrounding postcumulus amphiboles and phlogopites and are a result of residual liquids and late magmatic fluids.
Therefore, the silicate inclusion amphiboles and phlogopites should mimic the chromite contents of the host rocks like those of the Stillwater Intrusion. On a plot of wt. % MgO and wt. % Cr2O3 with height in DDH BT-09-31, it is shown that the Layer 2 chromites are more primitive than the Layer 1 chromites with higher wt. % MgO and wt. % Cr2O3. With the same variation in the phlogopites, it is also shown that the Layer 2 silicate inclusion phlogopites have higher wt. % MgO than the Layer 1 phlogopites. The wt. % Cr2O3 would show a reverse trend due to the substitution of Mg with Cr in phlogopite. For variation of Mg # with height in the same drill hole for pargasiteedenites compositions, it is also shown that Layer 2 silicate inclusion amphiboles have higher Mg # than the Layer 1 amphiboles.
It might be argued that phlogopite and amphibole mantle nodules were incorporated by the chromites from the varying primitive nature of the pulses that formed these layers. However, it is shown that the chemistry of the chromite in the Layer 1 chromitite reflects the mineralogy of the host oikocrystic harzburgite that lowers the Cr/Fe content of the chromites in that layer. Therefore, the lower Cr and Mg chromites of that layer are not reflective of a less primitive pulse. Also, it would remain to be explained why there would be mantle nodules incorporated in the chromites if the chromite itself crystallized in the magma chamber. The fractionation trends in the chromites give strong evidence that the chromites formed in a magma chamber rather than in mantle-like podiform chromitites. The newly formed chromites would have to peculiarily extract a large amount of mantle nodules from the surrounding host rock that has no evidence of the presence of mantle nodules itself. In fact, the igneous amphiboles that have been found with similar compositions to the silicate inclusion amphiboles are relic postcumulus amphiboles like those in the Stillwater Intrusion. This shows that the phlogopites and amphiboles in the silicate inclusions are derived as residual melts encapsulated by the chromite and reflect the differentiated layers rather than as mantle

244nodules in the chromites. The chromite and titanium contents are derived from the chromite rather than forming under high pressure and temperature regimes of the mantle.
The presence of evolved albite in the inclusions would also preclude mantle origin. Albite would not crystallize as late igneous phases in the ultramafic McFaulds Lake complex like the amphiboles and phlogopites. Therefore, the origin of albite needs to be explained. It is suggested that the same Na-rich melt that produced the Namagnesiokatophorites was involved in the crystallization of albite as Na-rich residual. One suggestion in the past from Irvine (1981) is that the albitic and other “granitic” inclusions formed as a result of an enhanced silica immiscibility effect with oxidation of chromite in the presence of FeO and Fe2O3. In such a circumstance, it might happen that the mixing lines of chromite between olivine and pyroxene will intersect the solvus and precipitate the silica-rich immiscible liquid as inclusion. Another theory for precipitation of albite is the reequilibration of previous inclusions due to metasomatism of the chromites. Often there are are other salt species present in these inclusions that could allude to ingress of later fluids. The inclusions appear to be wholly enclosed by the chromite, and some fractures appear to be late with no retrogression which argues against a pathway for these migrating fluids. However, other silicates such as tremolites, chlorites and talcs that crystallized within the chromites formed the same way as later hydration metasomatism of the silicates and chromites. Clues to there being metasomatism of ionized salts are the presence of chlorites that require silicon from an outside source that can not be provided from the chromite spinels themselves.
Although there is evidence of metasomatism with retrogression, it is unlikely that the albite formed in a similar way. First of all, the retrogressive fluids are unrelated to the high alkali compositions of the albites. Also, in sample 486349, albite inclusions appear to have igneous textures in association with chromium titanian magnesiokatophorites and phlogopites. Since the magnesiokatophorites and phlogopites are interpreted as being magmatic, this is suggested for the albite as well. Albite, like phlogopite, has not been found outside of the inclusions. Also, it is not a late stage igneous mineral of an intrusion like igneous amphibole and phlogopite.
One thesis from Sharpe (1983) on chromitites in the Thetford Ophiolite Complex describes trends in chemistries of chromites and olivines toward secondary fluid
245inclusion trains occurring in both chromite and olivine. The effect of the fluids on chromite was to slightly enrich the grains in ferrous and ferric iron, while decrease in Cr, Mg and Al. The effect of the fluids on olivine was to decrease the SiO2 and MgO of olivine while increase in K2O, CaO and NaO (Sharpe, 1983). From those observations, Sharpe (1983) concluded that the fluid that flowed through the rocks after formation contained significant amounts of Na, Ca and possible some iron. Further analysis of primary inclusions in chromite has shown that the fluids caused enrichment in Na2O, MgO, SiO2 and CaO, decrease in Al, Cr and Fe while no significant change in K or Ti. In comparing to inclusions in other deposits, Sharpe (1983) suggests the inclusions are not primary silicates that were included in the chromites, but were a result of later fluid to precipitate the serpentine, talc, chlorite, sulfides, pargasitic amphiboles, albite and sodic layer silicates described in these other complexes (Watkinson and Mainwaring, 1980 in Sharpe, 1983).
In the McFaulds Lake chromites, these types of silicates are found in the chromites, which suggests they were later incorporated into the chromites due to encapsulation of residual melt and later hydration. The enrichment in Na2O, MgO and CaO would not be involved in forming the Na-katophorites after silicate is included since similar pargasite was found as late stage amphibole in the silicate host before being included in the chromite. However, Na-katophorites are not like the typical pargasites with lower Na2O and CaO found as later stage igneous amphibole in complexes such as the Stillwater Complex. Sharpe (1983) suggested that the fluid inclusion trains observed in the Thetford chromites and olivines were from magmatic fluids. Clues to these fluids as being magmatic are the alkali and CaO along with MgO enrichment toward the inclusion trains. Clues to these being fluids rather than igneous melt are the textures of bubbles of fluid trains hosting the fluids and the enrichment or depletion in elements of the chromite and olivine toward these trains.
In the McFaulds Lake chromites, some of the inclusions are found as trains along growth planes in the chromites, in a similar habit to the fluid inclusion trains to the Thetford chromites. Their distribution along a growth plane in the chromite suggests incorporation of fluid during growth of the chromites since it is unlikely the chromite grew around aggregates of silicate all along the edge of the chromite (Fig. 3.29,

246petrography chapter). Therefore the association of the inclusions with the growth planes suggests these were real magmatic fluids/residual melts. Sharpe (1983) mentions how there was no change in TiO2 toward the inclusions. This suggests Ti was not mobile but represents a magmatic component to the inclusions rather than being a metasomatic feature. The Na-magnesiokatophorites of the McFaulds Lake chromites have high MgO, Na2O and CaO similar to enrichments in these elements provided by the magmatic fluids of Sharpe (1983). Since the amphiboles are igneous with high TiO2 and have peculiarly high MgO, Na2O and CaO than regular pargasites, it is interpreted these inclusions as well as katophorite found in the silicate host are derived from residual melt. Naphlogopite may have been derived from similar fluids. K2O was enriched by these fluids in the olivines of Sharpe (1983) and was probably also enriched in the formation of phlogopite.
Albite may have crystallized from these residual melts. Notably, in the fluids of Sharpe (1983), there is also enrichment in Al2O3 and a high enrichment in SiO2. These elements along with Na2O would result in the formation of the albite in the inclusions. It may be that the albite grew in the inclusion or could have been the result of magmatic fluids being incorporated along fractures. Fractures have been found to occur along possible points of entry into silicate inclusions. Notably, retrogressive zoning has not been seen along these fractures like the retrogression that is involved in the formation of later chlorite within the chromites. However, these fluids are a different composition than the retrogressive fluids and would not cause the same extent of depletion in Cr, Mg while enrichment in Fe as the retrogressive fluids. Sharpe (1983) notes these trends in the chromites are subtle in the case of these magmatic fluids. Albite has not been found like amphibole and phlogopite as late stage igneous phases in the silicate host to the chromite. This is probably due to albite forming from residual melts specific to to the chromite it is encapsulated in. Usually, albite is found in cases of granophyres and incorporation of wall rock in the intrusion. Since there is no indication of wallrock contamination in the immediate surrounding dunites and pyroxenites, and cracks have been found in association with the silicate inclusions, the albite probably grew within the silicate inclusions from residual melt.
247This may or may not be the case for the igneous amphiboles and phlogopites since the growth and incorporation in some cases incorporated pargasite whereas in other cases magnesiokatophorite is found in the inclusion but not in surrounding silicate. Either the chromites were later mobilized in a different location than surroundings with slumping or filter pressing or the magnesiokatophorite grew in these cases in the inclusion. It appears more probable that the amphibole grew within the inclusion since chromite surrounds other exotic minerals such as the Na phlogopites. Either way, all these minerals are late stage phases to the intrusion, and since there is not a magmatic chemical association of the chromite with these minerals, they all crystallized as melt encapsulated by the chromite. It could have been argued that in some circumstances, the negative crystal faces of the silicate inclusions within the chromite make them in equilibrium with growing chromites. However, closer examination shows that these negative crystal faces of the inclusions surround an inclusion of multiple minerals and are not related to single crystal growths in the chromite. Therefore, these structures are interpreted to be wholly related to the crystal face structure of the chromite itself. The nature of how the chromite grew around the silicate is either by annealing or adcumulus growth of individual chromites.
There are other references to katophorite, Na-phlogopite and albite silicate inclusions in chromite being formed from precipitation of magmatic fluids. McElduff and Stumpfl (1991) argue the inclusions in the Troodos chromitites are intimately linked to a reducing chloride-rich fluid within the magmatic system where chromite is either transported within this fluid or extracted from the melt. An Na-rich and Ca-rich hydrous phase probably separated from the melt due to decreasing pressure related to the opening of the system (McElduff and Stumpfl, 1991). Within the Troodos chromitites, the layered complex chromites have different compositions of silicate inclusions than the lower mantle podiform chromites. The podiform chromites bear orthopyroxene, clinopyroxene, hornblende, olivine, serpentine and chlorite while the chromites in the layers bear pargasitic amphibole, serpentine, chlorite and albite (McElduff and Stumfl, 1991). The latter set of inclusions is more similar to the pargasite, serpentine, chlorite and albite found in McFaulds Lake chromites. Inclusions in Troodos have been noted to become more Na and Fe-rich toward these layered cumulate chromites. The

248compositional difference of the inclusions is probably reflective of the different environments of formation – the layered chromites being more evolved and alkalic than the podiform mantle chromites.
The association of these inclusions with layered chromite suggests the inclusions are related to the magma chemistry of the chromite evolution, rather than being exotic assimilants. Li et al. (2005) discuss the inclusions of the Merensky Reef and explain the Ti and Na-rich compositions as being due to volatiles that formed with dissolution of rutile and pyroxene as the fluids were expelled from the underlying cumulus pile. In the Merensky Reef chromites, silicate inclusions have been found to contain Na phlogopite that is more Na-rich than the matrix, similar to the case of there being Na phlogopites only in the inclusions of the McFaulds Lake chromites. Li et al. (2005) report oxygen isotopic data of the inclusions as having a bulk d18O value of 7 ‰. Plagioclaseorthopyroxene, orthopyroxene-chromite and orthopyroxene-phlogopite delta values suggested equilibration temperatures near 1200 °C using the fractionation factors of Zheng (1991, 1993) in Li et al. (2005). This shows that higher T magmatic fluids were involved rather than low T fluids in the precipitation of these alkali minerals. The addition of Na-K rich fluid occurred during chromite crystallization on the floor of the magma chamber (Li et al., 2005).
It appears that the exotic minerals in the silicate inclusions crystallized from residual melt encapsulated by the growing chromite. In sample 486211, there appears to be an association of silicate inclusion with the finer more disseminated grains rather than the larger chromites. The observation of more silicate inclusions in chain-like disseminated chromite was also made in the semi-massive chromitites of this study. Also, inclusions are found along growth planes within original chromites. Since the inclusions are preferentially found in smaller, later chromites, this would suggest that there are multiple generations of chromite in the samples: the first being primary magmatic chromite crystallization of larger, primitive chromites in the melt followed by further growth of chromite that encaptured the melt that later precipitated the silicate inclusions. The later growth of chromite that encaptured magmatic fluids is suggested by the presence of enriched Cr2O3 in the inclusions of diopside, magnesiokatophorite and phlogopite. The fact that there is Cr2O3 in these minerals suggests these minerals

249incorporated Cr2O3 from pre-existing chromite. Since magmatic fluids have been shown by Sharp (1983) to cause subtle exchange with chromite, it is possible that the chromites in the presence of inclusions have slightly more diffused compositions. Although, there has not been evidence observed for this in these chromites, perhaps since diffusion is subtle.
The primary silicate inclusion minerals have unique compositions. The phlogopites and igneous amphiboles appear similar to metasomatic phlogopites and amphiboles in the upper mantle. Although these inclusions are not from the upper mantle, they probably formed from essentially similar magma chemistries. Page and Zientek (1987) concluded that the postcumulus phlogopites and amphiboles derived their chromium from the chromites themselves. Lorand and Cottin (1987) concluded that the minerals are a result of dissolution of chromite. In their discussion of metasomatic minerals in peridotite nodules of kimberlites, Erlank et al. (1987) suggest these minerals inherit Cr from the Cr-spinel with the Mg being of peridotite heritage. An overall reaction for the formation of metasomatic minerals in the upper mantle is Olivine + enstatite + garnet + diopside1 + Cr-spinel + fluid (K2O etc., H2O, CO2) . phlogopite + K-richterite ± diopside2 + Cr-spinel2 ± calcite ± LIMA, ilmenite, rutile, armalcolite, sulphides. The same magnesian olivines and pyroxenes + chromite + fluids are probably involved in the formation of the silicate inclusion minerals. Notably, the pyroxenes, amphiboles, phlogopites, and chlorites probed in this study all have very magnesian compositions. These minerals would be linked to the magnesian heritage of the host magma to the chromite. Albite, which has a more crustal-like composition, is suggested to be derived from the transformation of plagioclase toward its Na-end member due to hydrothermal fluids (Lorand and Cottin, 1987). This is also suggested by the presence of Na-phlogopite and Na-magnesiokatophorite in the inclusions alone as opposed to the surrounding silicate host rock.
6.5 Origin of chromite: Irvine’s 1977 magma mixing model Since there are problems with the theory of silica addition alone, it is proposed that the chromitites crystallized by means of magma mixing of two different magmas. In the case of the McFaulds deposits, one difference between the magmas is the lesser vs. more crustally contamination in the pyroxenite vs. dunite. Irvine (1977) explains that in a

250magma chamber, there was first differentiation causing accumulation of dunite to pyroxenite, and then a new replenishing olivine-laden magma pulse mixes with the residual melt, left after pyroxene accumulation, to drive the melt into the chromite stability field to rainout chromite (Fig. 6.5). Eventually with fractionation the melt will migrate into the pyroxene only field. This order of crystallization is seen in the petrography of the oikocrystic harzburgite/semi-massive chromitites where olivine crystallized first followed by chromite which is in turn overgrown by intercumulus pyroxene. Specifically, Irvine (1977) demonstrated that if a new input of magma was injected into one that had reached a higher degree of fractionation, the resultant mixing action could inhibit the fractional crystallization of silicate minerals such as olivine and orthopyroxene and permit the crystallization of chromite alone. As illustrated in Figure 6.5, the mixing of liquid A which is on the olivine – chromite cotectic, with liquid D on the orthopyroxene field may, provided that points on the mixing line lie above the liquidus surface, culminate in a hybrid magma such as AD which will intersect the liquidus in the chromite field on cooling. Hence it will crystallize chromite alone while it moves to point X on the olivine – chromite cotectic, and thereafter it will continue to crystallize chromite and olivine.
It has been shown that the decrease in the solubility of chromite in basaltic magma in equilibrium with chromite per degree centigrade fall in temperature is greater at high (1,300°C – 1,400°C) than at low (1,100°C – 1,200°C) temperature. Due to this concave – upward curvature of the solubility curve, the mixing of two magmas at different temperatures saturated (or nearly saturated) in chromite places the resultant mixture above the saturation curve, which suggests that point AD in Figure 6.5 is likely to lie above the liquidus. The suggestions by Irvine (1977) are consistent with observations on chromitites in layered intrusions. Most significant amongst these observations is the fact that most of these chromitite layers occur at the base of well defined cyclic units (e.g. Bushveld Complex and Great Dyke in Southern Africa) or at/near the base of similar cyclic units. Further evidence comes from the textures of the underlying rock units which indicate a common cotectic crystallization of chromite with olivine or orthopyroxene showing that the magmas previously in the chambers were
251Figure 6.5. Phase Relations in the System Olivine-Silica-Chromite as determined by Irvine (1977) illustrating the consequence of mixing primitive magma (A) with well fractionated (D) and slightly fractionated (B) variants of the same primitive magma. From Naldrett et al. (1990) in: Gowans (2009).

252saturated with respect to chromite. In the case of the McFaulds Lake chromitites, the Cr-saturated magma would be the melts that accumulated either the dunite or the pyroxenite.
There is evidence for magma mixing for the McFaulds Lake chromitites in the different multielement and PGE chemistries between the host dunites and pyroxenites of the three chromite deposits. The differences in trace element patterns are due to evolved and more crustally contaminated vs. primitive and less crustally contaminated magmas before the onset of chromite crystallization. Barnes and Maier (1999) have shown that in the Bushveld Complex, the magma mixing of a high-MgO basalt or U-magma that is SiO2 and LILE-enriched and the A- or tholeiitic magma would result in the mineralization of the Merensky Reef PGE sulphide zone. Other evidence of there being two magmas are in the higher PGE, lower Pd/Ir of the U-magma in contrast to the lower PGE and higher Pd/Ir of the A-magma (Barnes and Maier, 1999). The terms of the two magmas involved are derived by studies on the J-M Reef by Todd et al. (1982) where U-type refers to an ultramafic magma that is PGE-rich and A-type refers to an anorthositic magma that is sulphur-rich. There is evident contrast in the behavior of the elements between the dunite and pyroxenite of the three deposits. For the trace element compositions, the dunites are more trace element and REE-depleted and provide primitive fresh magmas to the more evolved pyroxenites (Fig. 6.6). Contrasting REE contents are evident in other deposits such as the more crustally contaminated upper peridotites vs. the websterites of the Kemi Intrusion in Finland (Linkermann, 2010).
Mungall (2012) further explains the model as the mixing of S-undersaturated, high IPGE-bearing magma with S-saturated low IPGE, higher Pt/Pd restite, in this case, the mixing of a parental picrite with mantle residue. In the case of the McFaulds Lake chromite deposits, there was mixing of a S-undersaturated, higher IPGE:PPGE U-type olivine-bearing magma with S-saturated, lower IPGE:PPGE A-type pyroxene-laden magma. In the case of Black Label, there would be the magma mixing of a highly Sundersaturated dunite with the highest S-saturated pyroxenite of the three deposits (Fig. 6.7). Contrasting PGE contents of dunite vs. pyroxenite are also evident in the higher IPGE:PPGE peridotites vs. the lower IPGE:PPGE websterites of the Kemi Intrusion (Linkermann, 2010). For Black Thor, the dunite is not as highly undersaturated which probably makes it more capable of precipitating PGE sulphide. Pyroxenite is less highly
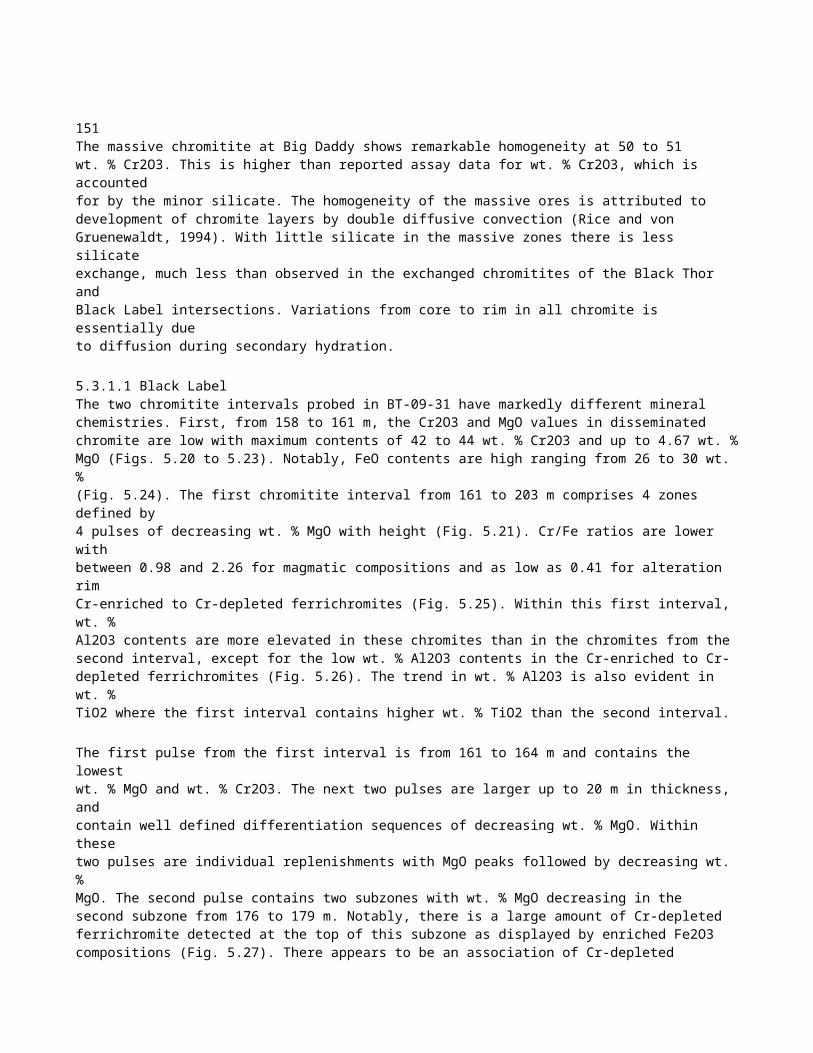
254S-saturated. In this case, a S-saturated, crustally contaminated pyroxene magma probably mixed with S-undersaturated, less crustally contaminated dunite magma to cause chromite crystallization. The case is similar with Big Daddy, only there is more evidence of LILE enrichment within the dunites and pyroxenites which is probably a local phenoma since this signature is not found in all the samples. In terms of petrography, intermediate compositions of heterogeneous pyroxenite in Big Daddy and oikocrystic harzburgite in Black Label show intermediate trace element and PGE chemistries between the dunites and pyroxenites of the deposits.
At McFaulds Lake, a U-type olivine-laden magma, represented by dunite, is the main carrier of Cr2O3 with the amount of Cr2O3 increasing rapidly with the amount of olivine (Sharpe and Irvine, 1983). In the deposits, disseminated chromite-bearing dunites commonly contain finer intercumulus to cumulus chromite that surrounds the primary olivine grains. The A-type pyroxenite, in contrast, is close to saturation with chromite even when Cr-free. Therefore there is not more than trace Cr2O3 in the pyroxene-laden magma before there is crystallization of chromite (Sharpe and Irvine, 1983). This trace chromite is characterized by the disseminated chromite in pyroxenite. The mixing of Crundersaturated olivine magma with Cr-saturated residual pyroxene magma will then cause the precipitation of chromite that segregate into layers.
Textures of interstitial and net-textured chromite may suggest evidence for separation of an immiscible oxide melt. The separation of an immiscible oxide melt, as described by Pavlov (1977) is the process of liquation of an ore-silicate melt and the crystallization of the two separated liquids, essentially silicate and essentially oxide in nature. In this definition, it is noted that the two liquids are just separated without any particular order of crystallization. In the Black Label and Black Thor sequences, it was noted that the chromite crystallizes post olivine from the melt left behind in the interstices of the olivine cumulate. This makes sense if the melt is driven toward chromite stability after separation of cumulus olivine. Therefore, any olivine cumulate can leave behind an immiscible chromite melt.
In their discussion of podiform mantle chromites, the same interstitial chromite textures are evident due to this unmixing (Ballhaus, 1998). However, although this is evident in disseminated chromites, there needs to be a condition where massive chromite

255is formed without there being wholesale mantle melting (Ballhaus, 1998). That is, if immiscible oxide melts were separated out of an olivine magma everywhere, there would be a common occurrence of chromite with dunite. However, the massive chromitite horizons are typically found between dunite and pyroxenite sequences with distinct chemistries as far as Cr-saturation. It would be more probable for separation of an immiscible oxide melt under certain conditions where the magma reaches Cr stability near certain evolved olivine magmas and certain primitive pyroxene magmas. However, the limited occurrence of massive chromite within these lithologies suggests the chromites are a product of the specific mixing of two different magmas and is more site specific than would be suggested by separation of an oxide melt.
The magma mixing of differing trace element and PGE-bearing magmas is more difficult to explain for chromitites since chromites host PGE as alloys in their structure in contrast to the silicates and have very little trace element and REE (Barnes and Maier, 1999). Therefore, the chromites can not be represented as magma compositions with olivine and pyroxene. The very thick chromitite intervals also make them harder to explain for a simple mixing model since some condition needs to keep the magma dithering in chromite stability. Therefore another mechanism is needed to explain the presence of the thick chromitite layers: namely, double diffusive convection after repetitive injections of magma.
6.6 Evidence for magmatic differentiation by double diffusive convection: The electron microprobe results. 6.6.1 Magmatic differentiation Past microprobe studies demonstrate that chromite compositions vary substantially with respect to changes in Mg#, Cr/(Cr+Al), Cr3+/(Fe3++Fe2+) and elemental Cr3+, Fe3+ and Al contents. Research has shown that Cr, Cr/Al, Cr/Fe and Mg# typically decreases while Al and Fe increases from basal chromitites upward in stratigraphy (Cameron, 1982, 1977; Irvine, 1975; Eales and Reynolds, 1986; Jackson, 1969). Commonly there is increase in Cr and Cr/Al while Fe decreases, making Cr/Fe increase while the Mg# decreases (Eales and Reynolds, 1986; Teigler and Eales, 1993; Teigler, 1999; Engelbrecht, 1985). The explanation for the general decrease in Cr, Cr/Al, Cr/Fe and Mg # and general increase in Al and Fe relates to disseminated chromitites hosted in

256more evolved magma ie. from dunite at the bottom, to pyroxenite, to leucogabbro at the top. Increasing Cr, Cr/Al, and lower Cr/Fe towards the top of intervals relates to differention from primary dunite to pyroxenite, and then a new pulse of magma mixes with the residual melt to drive this mixed magma batch into the chromite stability field and causes rainout of new chromite towards the tops of some intervals. Eales and Reynolds (1986) and Naldrett (2009) also document trends in enrichment in Cr/Al in the UG 2 chromitite and explain the increase as due to Al declining in the spinel phase after plagioclase is nucleated in the liquid.
In the McFaulds Lake chromites, there is evidence of magmatic differentiation in the form of cascading upward decreasing trends in MgO and Cr2O3, while increasing FeO and Al2O3 with height in layers, one on top of the other with pulses evident at the decimeter scale. These trends are particularly evident in the Black Label and Black Thor drill intercepts analysed. From one pulse to the next, there are enrichment trends in MgO and Cr2O3, while decreasing FeO and Al2O3. Since there is an association of increasing MgO with Cr2O3 and there is no plagioclase observed in the zones, the interpretation of increasing Cr/Al in the deposits as due to the buffering by plagioclase can be discarded. Rather, since MgO decreases with Cr2O3 and chromite is known to be a petrogenetic indicator of the melt, it is interpreted that these trends are due to replenishing pulses of magma followed by differentiation trends of the magma afterward (Irvine, 1965).
Evidence that the chromite is chemically related to the host rock are the high vs. low Al2O3 content of the Black Label Layer 1 vs. Layer 2, from which greater Al2O3 reflects greater pyroxene. In Layer 1, the greater silicate content also lowers the Cr/Fe ratio with more disseminated chromite. A few primary olivines have also been probed in the two layers where olivines of Layer 1 are more evolved with Fo #s of 80 to 85 whereas olivines of Layer 2 are more primitive with Fo #s of up to 94. Another evidence of these major oxide trends being due to magmatic differentiation is that they are common in layered intrusions and have relatively good antipathetic correlations to each other: MgO being antipathetic with FeO and Cr2O3 being antipathetic with Al2O3 due to direction substitution of the elements in the tetrahedral and octahedral sites of the chromite structure. These direct correlations have also been documented from other intrusions such as the Bushveld Complex (Stowe, 1994).

257From disseminated to massive chromite, there are trends toward homogeneity in Cr2O3 as can be seen in the Big Daddy massive chromitite intercept. Although there is less of a decrease of Cr2O3 upward in each pulse, there is still a more direct decrease in MgO. This phenomenom has not been studied to any extent in other massive chromitite intervals of the world. Since there is no plagioclase in the surrounding lithologies to buffer the Al and cause an increase in Cr, it is proposed that the lesser decrease upward of Cr in these cycles is due to double diffusive convection. The theory is explained below.
6.6.2 Double diffusive convection mineralization Double diffusive convection is a type of magma mixing where a flux of one property of a system is imposed on the gradient of another property with a different molecular diffusivity to produce a series of convecting layers (Campbell, 1996). A magma with a compositional density gradient when cooled from above will break up into two horizontal convective layers separated by an interface or boundary layer across which heat and composition are transported by molecular diffusion. Heat is transferred across the interfaces and causes instability and convection in the layers above and below, while the composition of the layer changes little to preserve “stable” density steps between the layers (Fig. 6.8). Total density is greatest in the bottom layer and density contrasts in a system will increase in time between individual double diffusive convection systems (Fig. 6.8).
There is a trend of increasing density in the bottom layer while decreasing density in the top since there is a loss of heat in the bottom layer while a gain of heat in the top (Fig. 6.8). In a layered intrusion chromite-PGE interval, the gain in density in the bottom layer is shown by replenishment with increasing Cr, and Cr/Al in the chromitite upward while the decreasing density in the top layer is shown by less decreasing Cr and reverse grading in the chromitite downward. An example of this system in progress is the top vs. bottom chromitite intervals in DDH BT-08-10. For PGE, top and bottom peaks in PGE first mineralize with initial sulphur saturation in the respective top and bottom convective layers in a double diffusively convecting chromite-PGE mineralizing system (Fig. 6.9).
At the early stages, the PGE contents increase more so in the bottom convective layer while decrease in the top convective layer due to the respective increasing density of mineralization in the bottom convective layer while decreasing the density in the top
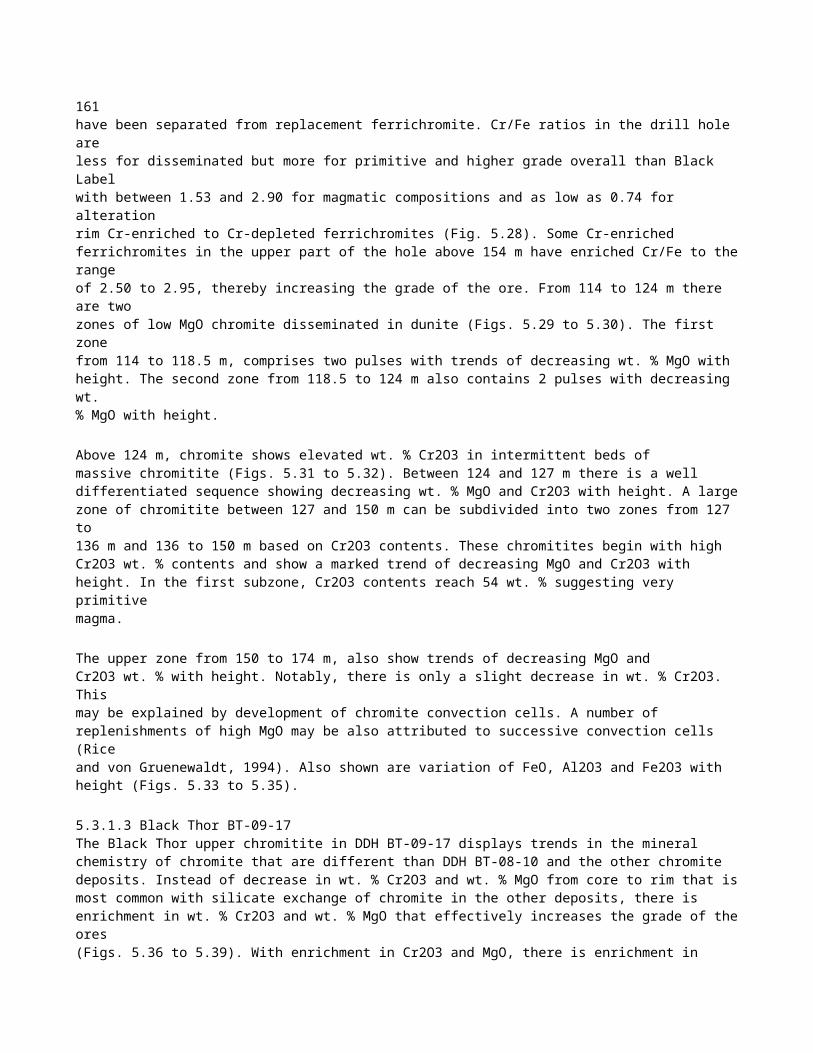

258258Figure 6.8. Double diffusive convection. a) In the magma chamber, density of
crystallization is greatest toward the bottom convective layer, while temperature is
initially the lowest in bottom convective layer. The density contrasts in the chamber
cause development of the separate convection cells. b) With time, a series of double
diffusion convection systems develop in a step-wise manner with density increasing
toward the bottom layer due to settling mineralization and contrast in temperature. With
time, the bottom convective layer increases in temperature with burial of cumulate and/or
mineralization (Campbell, 1996). Figure 6.9: Double diffusion convection cells in the magma chamber with associated mineralization: a) The boundary layer is contained between top and bottom convective layers of a double diffusive convection system. Upwellings of magma heat the bottom of the overlying top layer which in turn cycles down into the bottom convective layer. b) Details of boundary layer: Heat first transports up with fluid, then cools down and crystallizes refractory chromite and PGE in top and bottom peaks of the respective top and bottom convective layers. With time there is an increasing velocity in top convective layer thereby increasing the mineralization, while decreasing velocity in the bottom convective layer. This is due to the temperature differences between the top and bottom layers (Rice and von Gruenewaldt, 1994).

259convective layer (Fig. 6.9). Eventually, however, the PGE will increase from the top boundary layer downward since temperature drives higher velocity flow of magma in the top layer, while the bottom layer obtains slower velocity magma with more crystal accumulation (Fig. 6.9: Rice and von Gruenewaldt, 1994). Even though there is less velocity for mineralization with time in the bottom convective layer, there will still be a trend of less decreasing Cr upward since more mineralization in the top convective layer will be coupled by gravitational settling of this mineralization downward which accumulates the PGE in the bottom layer (Fig. 6.10: Rice and von Gruenewaldt, 1994). Therefore, with time there will be a pattern of increasing chromite-PGE inward ie. from the top convective layer downward and from the bottom convective layer upward in the most evolved chromite-PGE intervals.
In the McFaulds Lake chromites of the Big Daddy interval, it can be seen that there are less decreasing Cr2O3 contents while MgO decreases to a further extent. Although this phenomenon is has not been studied in any detail, one thesis by Johnson (2012) on the study of the podiform chromitites in Kazakhstan also considers prominent changes in Mg # vs. Cr # with depth of the chromitite. Johnson (2012) gave two proposals for this pattern: the first that there could be reequilibration of chromite with olivine in order to decrease the Mg # or that this was a result of increased chromite to olivine with densification of the magma upward in the profile. Johnson (2012) notes that the fine-scale layering and structural continuity of the massive chromitite would need to be preserved under these conditions.
For the Big Daddy massive chromitite, it is suggested that the pattern is not due to chromite reequilibrating with olivine because there is no cumulus olivine present in the massive chromitite. However, there are definitely higher chromite to olivine contents. Therefore, there is probably densification of the magma with the actual preservation of fine-scale layering in these compositions which makes them truly magmatic. Further explanation of the double diffusive convection with the densification of the magma is proposed. One factor critical for this convection to occur is the contrasting diffusivities between a Cr-saturated olivine magma and a Cr-undersaturated pyroxene magma. The olivine magma would have a higher diffusivity then the pyroxene magma. With a new pulse of olivine magma mixed into the pyroxene magma, the diffusion of Cr from the

260Figure 6.10: Double diffusive chromite-PGE mineralization. Separate systems develop with step-wise chromite-PGE mineralization where refractory chromite and PGE mineralize with increasing velocity of magma in the top convective layer, thereby increasing mineralization with gravitational settling in the bottom convective layer. Over time, the bottom convective layer mineralization will continue to be replenished from rainout from the top convective layer. Therefore patterns of increasing chromite-PGE from the top layer downward and bottom layer upward will develop with development of each step-wise double diffusive convection system grading upward in the magma chamber (Rice and von Gruenewaldt, 1994).

261olivine magma to the pyroxene magma will cause Cr saturation and crystallization. After Cr is saturated in the underlying pyroxene magma, there will in turn be convective overturn of the resulting melt upward that will be less Cr-saturated and less dense. The next olivine magma layer higher up in sequence will mix with this less dense melt and the process will continue higher up in stratigraphy. There will be periodic interruptions in this sequence by new replenishments of olivine magma as evident by peaks in MgO contents within the overall differentiation trend. Noticeably in the 3rd pulse of the Layer 1 in Black Label, there is also more of a transition of the regular fractionating pulses to this double diffusive convecting condition. This would then progress to the more complete mineralization of the Big Daddy massive chromitite intervals. The double diffuse convection is also documented by the primary top and bottom peak PGE mineralization of many of the chromitite intercepts in all the drill holes analysed. These peaks of PGE that are commonly offset by the chromite mineralizations are due to primary individual sulphur saturating conditions of the PGE with the surrounding silicates at the beginning of the bottom layer going upward and the top layer mineralizing downward.
6.6.3 Formation of massive chromite by post-cumulus growth In the petrography of intermittent chromitite beds, semi-massive chromite and massive chromite, there are observations in the chromite grains that alludes to post-cumulus growth of chromite following the pulsing events. In the intermittent chromitite beds, there are textures of layers with first chromite only, followed by cumulus olivine that contains intercumulus finer grained chromite. Textures of chromite interstitial to cumulus olivine suggest the chromite formed after cumulus olivine segregation. In semi-massive chromite, net to chain-like textures of intercumulus chromite within olivine also suggests this in situ crystallization. In the semi-massive chromites, the abundance of silicate inclusions within the chromites of these chains suggests the growth of adcumulus chromite. It was suggested earlier in this chapter that the occurrence of silicate inclusions in smaller chromites vs. no inclusions in larger chromites points to two generations of chromite: one being the early magmatic chromite and the second being a second-stage chromite that encaptured residual melts from the expulsion of these fluids from the cumulus pile. The fact that these silicate inclusions formed from expulsion of fluids after
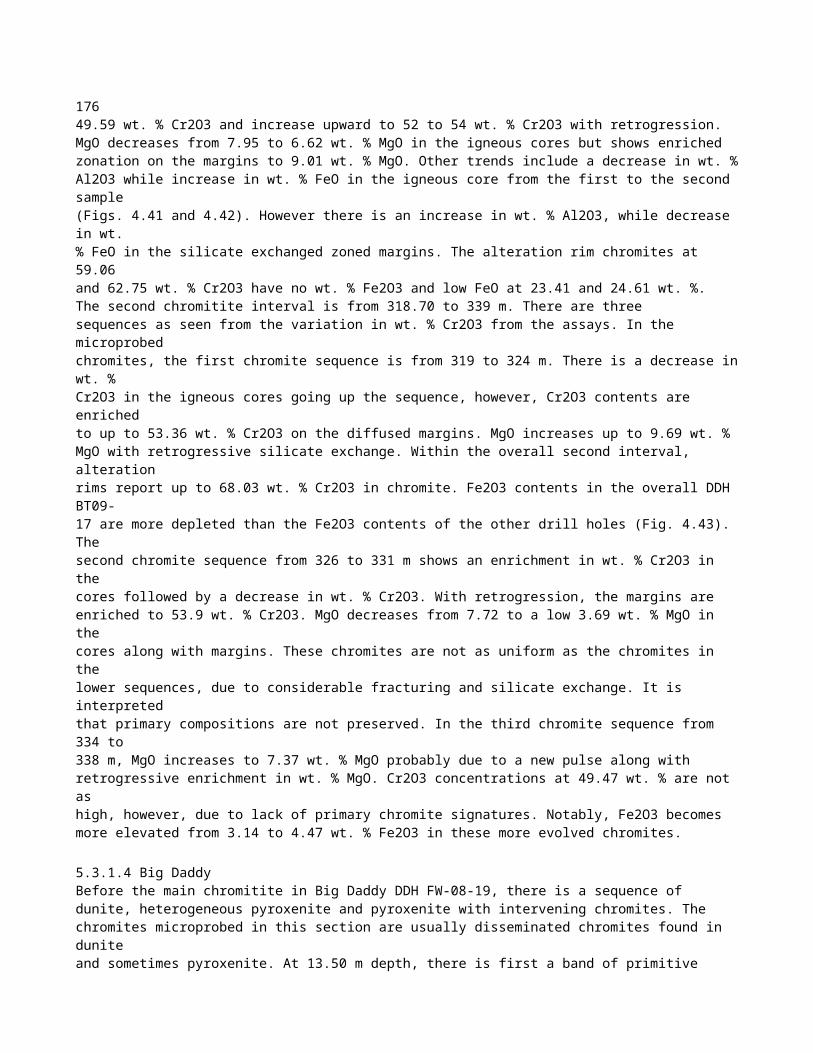
262cumulus segregation makes sense if their occurrence is after the larger primary chromite grains.
The presence of chromite growing in equilibrium with later igneous phases also suggests that chromite may have crystallized in the presence of H2O. Azar (2010) cites Bannister et al. (1998) in her thesis on the Blackbird chromitites that H2O lowers the liquidus temperature of chromite and associated olivine or pyroxene phase crystallization. This may suggest that the crystallization temperatures for growth of chromite are in fact lower than that as proposed from magmatic models of Irvine. Bannister et al. (1998) notes in her study of chromite in the Paricutin lava flows that when orthopyroxene crystallizes in equilibrium with chromite, the orthopyroxene dissolves Cr of the chromite to raise the Cr content of the orthopyroxene.
In the silicate inclusion samples, Cr-bearing pyroxene was observed in a silicate inclusion. Earlier it was suggested that the fact that there is Cr in the pyroxene, amphiboles and phlogopites suggests these silicates incorporated the Cr from the preexisting chromite. Although there was pre-existing chromite, the chromite probably grew in equilibrium with the silicates as suggested by Bannister et al. (1998), by the Cr content in the silicates and by the fact that the magmatic fluids were encaptured in a growing chromite grain. Since Cr is also found in the amphiboles and phlogopites, it is suggested that the chromite also grew in equilibrium with these late igneous phases and that chromite probably also grew at lower crystallization temperatures. The lower crystallization temperatures and the presence of the silicate inclusions in chromite together suggest that H2O was involved in the crystallization of chromite and associated igneous phases at least in the area of the silicate inclusions.
A hydrous component to chromite crystallization has been suggested by authors such as Johan (1986) and Boudreau (1999) in their discussion of hydrous silicate inclusions. A hydromagmatic model may be suggested for the chromitite deposits as a whole. The presence of a large amount of chromite with little magma volume may be explained by H2O that raises the Cr content of the melt to promote chromite crystallization. This may suggest why there is plagioclase-bearing leucogabbro that occurs early after a relatively small intrusive sequence of dunite-chromitite-pyroxenite in

263the Ring of Fire Intrusion. H2O may have lowered the liquidus of orthopyroxene and in turn plagioclase crystallization according to the model of Bannister et al. (1998).
More evidence for in situ crystallization is observed in the massive chromite. In massive chromite, the chromites that were probed have more primitive larger grains and also more differentiated smaller grains. It was noted that there was more diffusion to lower Mg and Cr in the smaller grains. However, the fact that there is a general association of lower Mg and Cr with the smaller grains could be evidence that they were later grown in the intercumulus of the larger grains. In Big Daddy DDH FW-08-19, the Cr contents of the chromitite horizon appear homogeneous up the interval while there appears to be more variation in Mg content. The fact that the Mg contents are decoupled from the Cr contents shows that there was probably double diffusive convection involved in mineralizing complete chromite layers that were a result of pulses.
However, even though there is considerable primitive pulsing as seen in the Mg variation with height, there is also evidence of homogenization of these pulses, especially in the large differentiated section of the hole. There are numerous Mg pulses, but Mg contents seem to rise from below and move up through these mini-pulses. In other words, there are not perfect differentiations represented by these pulses. This is probably evidence of adcumulus growth of chromite after intitial segregation of primary chromite. Another clue for adcumulus chromite is the chromite layer at the top of the section of DDH BT-08-10. The last of the chromite has a sharp boundary with the overlying dunite. Double diffusive convection could explain the formation at the top convecting layer, however, there would still be some sort of differentiation after that top layer. It is probably that chromite was formed in the intercumulus and migrated upward until trapped by an impermeable barrier at the overlying dunite sequence. Also, the adcumulus textures that fill the voids in the massive chromitites can be explained by further growth of the magmatic chromites.
In terms of silicate content, in Black Label DDH BT-09-31, there are a number of sections of oikocrystic harzburgite bearing chromite that is intercumulus to olivine but is overgrown by orthopyroxene. It was determined that the crystallization sequence was then olivine . chromite . intercumulus orthopyroxene. In the massive chromitites, there is often tremolitized intercumulus pyroxene in the matrix of the chromites. The
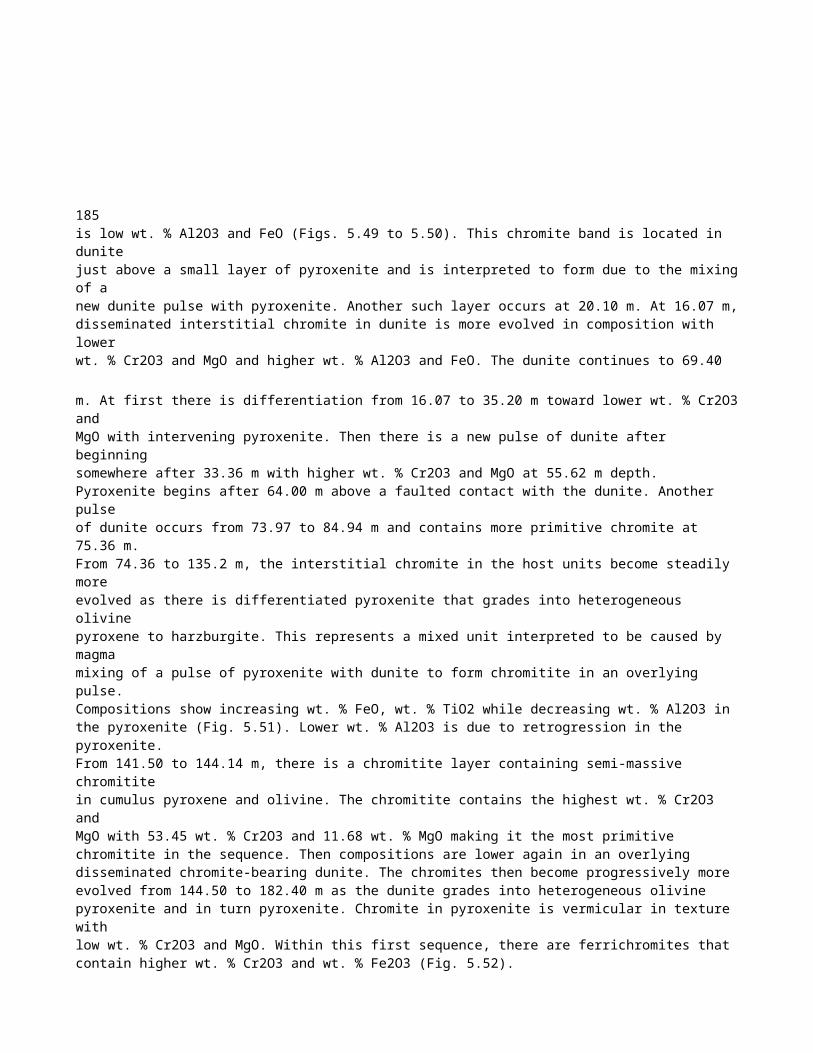
264formation of amoeboid intercumulus pyroxene after chromite might be showing that the chromite continued to form from the reaction of the olivine and chromite with the surrounding melt. In this case, it would be a Cr and pyroxene-bearing liquid. After chromite is mineralized from the mixing of the Cr and pyroxene-bearing melt, the melt goes into pyroxene stability and pyroxene crystallizes. It is noteworthy, that the chromitite in Black Label Layer 1 reflects the textures of oikocrystic pyroxene in the host oikocrystic harzburgite. Therefore, primary chromite probably formed with the mixing of this pyroxene-bearing oikocrystic unit with dunite. Many of the samples reflect primary chromite after this mixing event. However, possibly where samples show chromite more into the intercumulus pyroxene farther away from the primary cumulus olivine, and where chromite has encapsulated inclusions, the chromite probably formed from this reaction.
In Black Thor DDH BT-08-10, some of the intercumulus pyroxene in the massive chromitite has been probed to be chromian diopside whereas other times it is orthopyroxene. Diopside has been observed as an interstitial phase to chromitites in the Uralian-Alaskan complexes of Asia (Krause et al., 2007). In these chromitites, the diopsides contain enriched La/Lu contents relative to cumulus diopside in neighbouring clinopyroxenites. Enriched diopsides have also been observed on the rims of cumulus diopside in the clinopyroxenites. Krause et al. (2007) concluded that the enriched rim and interstitial diopsides are fractionated residual melt in the pore space of the solidifying cumulate and are accessory minerals. The diopside would represent a hydrous fluid enriched in LREE which developed during the final crystallization of the pore liquid (Krause et al., 2007). In the McFaulds Lake chromites, hydrous melts that formed along with chromite crystallization have been documented in the silicate inclusions. Within these inclusions, there is also the presence of chromian diopside which gives evidence for it being a late stage igneous phase. Notably, the diopsides are chromian diopsides which implies the incorporation of Cr post-magmatic the primary chromite.
6.7 Evaluation of the conduit model The McFaulds Lake chromites are high in grade with 50 wt% Cr2O3 in many of the layers with very thick intercepts. Also there has been evidence documented of magmatic breccias and deformations with sulphide mineralization, as at Black Label,

265which alludes to some dynamic emplacement of the layers. There also needs to be a significant amount of magma to cause the precipitation of so much chromite. Conditions for the amount of Cr required in the magma to mineralize the amount of Cr have been discussed by Naldrett (2009) and are shown in Fig. 6.11.
Fig. 6.11 Figure showing thickness, grade and wt% Cr in the 36 m-thick ore zone at Big Daddy, the tonnes of chromium this would amount to over each square m of the sill, and the value of magma required to produce this chromium, assuming that the magma contained 0.2 wt% Cr (a reasonable estimate for the magma likely to have produced the sill). – Naldrett (2009a)
The argument is that if there is so much chromite – a 36 m zone in Big Daddy – then there needs to have been a lot of magma to have produced so much chromite by gravitational processes. However, there does not have to be so much magma if there was a central pooling of the magmas in a conduit before being injected into layers. And the layers would still be settled out as differentiation cycles similar to that observed in the deposits. A key to debating such a case for the McFaulds deposits is to document the olivine and pyroxene silicate mineral chemistries upward in the layers along with the chromite. If olivine and pyroxene differentiate along with the chromite, then they probably mineralized by gravitational processes. If chromite was mineralized in the conduit, it would not settle out in association with the magma chemistry of the surrounding silicates which would have been gravitationally settled. In the McFaulds
266intrusion, most of the olivine and pyroxene has been replaced by serpentine-tremolitechlorite, so an in-depth study on silicate is not possible. A few olivines in samples from Layers 1 and 2 have been probed to have compositions relative to the primary chromite chemistries in those layers: Layer 1 having Fo #s of 80 to 85 in contrast to the more primitive chromite-bearing Layer 2 which has Fo #s of up to 94. Hence, this is evidence for the association of more primitive olivine with more primitive chromite layers. Also there is evidence of magmatic variation of pargasitic amphibole and phlogopite in the two layers of DDH BT-09-31.
In spite of no detailed study on primary silicates of McFaulds Lake, the olivine and pyroxene chemistries have been studied in another massive chromitite deposit, namely the 8 m-thick Ipueiro-Medrado chromitites in Brazil. These chromites have chemistries that relate to the silicate chemistries and have been proposed to mineralize by gravitational processes (Marques, 2003). Therefore, for other massive chromitites, it appears there is direct correlation of silicate-oxide that suggests gravitational segregation.
However, another important point about McFaulds Lake is that the chromite is komatiitic. Massive chromite from a different komatiitic chromite occurrence in Nunavut has been microprobed to compare with the McFaulds Lake deposits. It has compositions of 52 to 55 wt. % Cr2O3, 26 to 27 wt. % FeOT, 11 to 12 wt % Al2O3 and 6 wt. % MgO. Diffusion of the chromitite is even similar with depletion of Cr2O3 and FeOT to 48 and
25.75 wt. % respectively and enrichment in Al2O3 and MgO to 16 and 7 wt. % respectively. These compositions are very similar to the higher temperature hydrothermally retrogressed upper chromitite of DDH BT-09-17. Low-Mg komatiites can have up to 0.4 % or 3500 to 4000 ppm Cr in the magma, more than the basalts in the above diagram at 0.2 % (Baird et al., 1996). The dunite and pyroxenite lithologies hosting the Cr deposits have been demonstrated to be aluminum-undepleted komatiite. More work needs to be done to investigate the primary magma chemistry of the intrusion. However, the chemistries of the cumulates show that the system is not basaltic as Naldrett (2009) proposed but contains more primitive magmas with higher partial melting conditions and therefore contain higher Cr to generate more chromium reserves. Other similar komatiitic-hosted thick chromitite deposits of the world include Ipueiro-Medrado, Kemi, Selukwe and

267Nkomati SA (Mungall, 2010). Notably, these deposits are mineralized by many injections, one on top of the next, so there could have been many scenarios of mixing of new pulses with old ones to dither the magma in chromite stability.
Therefore, it is assumed that major amounts of chromite can be generated by a komatiite magma if there is this constant dithering. Although, to generate so much magma interaction, there should be conduit sites for feeders to the zones. As a general picture, the intrusion becomes more evolved from NW to SE from Black Label to Black Thor, while laterally the chromite mineralization branches off in doublets in the pyroxenites as it tends to do in more evolved lithologies moving NW from Big Daddy to Black Label and from Black Thor BT-09-10 to Black Thor BT-09-17. In the Black Thor zone specifically, there are 3 separate zones that differ laterally along strike: the SW zone, the Central Zone, and the NE zone with Upper-Upper Zone (Fig. 6.12). Areas where these zones intersect are domains of discontinuity. In the discontinuity between the SW and Central Zone, there appears to be NW-SE oriented displacements. These are probably faults. However, along with the fault displacement, the chromitite zones vary differently along both sides of the fault. Toward the SW, the chromitites become more massive while toward the NE, the zones branch off in doublets. Since the zones occur along the same orientation along strike on both sides of the faults, it is possible that these are feeder conduit sites for the magmas that injected into the chambers to mineralize the chromite. Notably, the intrusion has been overturned so care needs to be taken in this interpretation. However, given the preservation of the primary intermittent bedding and layering of the zones, it is possible that this is accurate. Discontinuities have been shown to be possible feeder sites in other complexes such as that of the discordant IRUP (ironrich ultramafic pegmatite) localities in the Bushveld Complex (Reid et al., 2012).
6.8 Retrogression of chromite with hydration of the intrusion The McFaulds Lake chromites have textures resulting from pervasive hydration, causing complete serpentinization and uralitization of host dunite and pyroxenite respectively. Along with hydration of silicates, there was reconstitution of the primary chromite ores to form either Cr-enriched or Cr-depleted ferrichromite and associated chromian chlorite. The host silicate to the chromite deposits have very few primary silicates preserved. There are a few primary olivines and orthopyroxenes preserved with
0 250 1,000 Metres 500 NE Zone, Upper-Upper Central Zone SE Zone Figure 6.12. Residual gravity map with chromitite zones plotted and labeled. Possible feeder conduit sites are indicated by arrows in areas of discontinuity. From Tuchscherer (2010). 268

269 compositions suggestive of cumulus segregation of a magnesian magma. Olivines have been replaced with serpentine as evidenced by the pseudomorphing of serpentine on original cumulus olivine grains. Pyroxenes have been replaced by tremolite and talc as evidenced by tremolitization along the cleavage planes of orthopyroxene. Chemical compositions of serpentine are lizardite to antigorite and amphiboles after pyroxene are pristine magnesian tremolites. Another retrogressive mineral includes chlorite that occurs in association with chromite. The textures of serpentine after olivine suggest temperatures of formation of around 300-350 °C of H2O hydration of the silicates (Winter, 2001).
Unlike the almost total replacement of the host silicates, the chromites are preserved with original cumulus associations of chromite in disseminated to massive chromite layers throughout the drill holes. Although, the ores have been modified and reconstituted first by diffusion with retrogressive fluids with further replacement to either Cr-enriched ferrichromite with chromian chlorite or Cr-depleted ferrichromite. Diffusion has the effect of depleting the primary chromites of Cr2O3 and MgO while enriching the grains in Al2O3 and FeO. Backscatter images of lighter areas on the margins of the grains and along cracks in the grains give evidence of variation in the chromite compositions with retrogression. The retrogression would be a result of fluids as the diffusion occurs from core to rim and along cracks where there is fluid access.
Three types of ferrichromite serve to either enrich or deplete the original chromites in Cr2O3. In the bulk of the samples analysed, there is either enrichment or depletion in ores with hydration. Evidence of the association of ferrichromite with the hydration that produced serpentine is not seen in massive chromitite due to absence of silicate. However, the massive chromitites occur in the same section as the serpentinized disseminated chromite-bearing dunites so are inferred to undergo the same overprint. Cr-enriched ferrichromites serve to enrich the ores to compositions of up to 65 wt. % Cr2O3. Chlorite laths accompany ferrichromite developed interior to the primary chromite grains. The occurrence of chlorites within the primary chromite suggests breakdown and replacement of the chromite. Specifically, there must have been Si mobility in order to produce the chlorite.
270Similar ferrichromite and chlorite relations in chromitites has been documented in other studies. Beeson and Jackson (1969) and Onyeagocha (1964) suggest the reaction: chromite + olivine + pyroxene + H2O = ferrichromite + chlorite + magnetite + serpentine. In the McFaulds Lake chromites, this reaction is indicated by the simultaneous serpentinization and tremolitization with ferrichromitization and chloritization of the chromites. Cr-enriched ferrichromite and chlorite are not found in association with serpentine but rather in association with interstitial chlorite or tremolite. So there was no reaction to produce both the chlorite and ferrichromite with serpentine. Bliss and MacLean (1975) suggest there was first serpentinization. A later reaction of chromite with serpentine produces the ferrichromite and chlorite at higher grades of alteration. There is no evidence in the immediate vicinity of these ferrichromites to suggest higher degrees of alteration except for the tremolitization in DDH BT-09-17. Since there are pervasively serpentinized dunites within the same section as the massive chromites, higher degrees of hydration probably play no role.
However, in the chromites analysed, there are no associations of the ferrichromite and chlorite with serpentine and also no relations of the minerals with olivine and pyroxene. This is since the altered chromites occur within massive chromitites with no surrounding silicate rock (except for the chlorite interstitial the chromite). The chlorites are pristine Mg clinochlores with high MgO to 35 wt. %, but with low FeOT at 1 to 2 wt. %. For mass balancing, it is inferred that the Mg and Al diffuse from the chromite into chlorite, while the Fe and Cr diffuse into the ferrichromite. There is lowering of the Cr and Mg from core to margin of the chromite grains with diffusion of these atoms into chlorite. Al and Fe however go up with substitution with Cr and Mg respectively. There must also be some SiO2 in the metasomatizing fluids to cause the enrichment of SiO2 in the chlorites. The SiO2 is probably transported with the ingress of hot water.
After retrogression of the chromites to Cr-enriched ferrichromite, there was oxidation of the grains to Cr-depleted ferrichromite. Cr is degraded along with Mg and Al, while Fe increases with an especially large enrichment in ferric iron to 13 wt. % Fe2O3. This trend is seen in the last chromite evolution of samples 486044 and 486126 in Black Thor. It cannot be said that the Cr-depleted ferrichromite in these samples formed the same way as the bulk of Cr-depleted ferrichromites found in the drill hole intervals.

271However, the association of Cr-depleted ferrichromites with more retrogressed disseminated chromites, the tendency to form chromian magnetite with further retrogression, and the fact that these grains have relics of previous chlorite suggests that these grains are similar to most of the other Cr-depleted ferrichromites. The only difference is that most of the other Cr-depleted ferrichromites have been depleted to within the 30 percentile range of Cr2O3. Chromian magnetites are known to form as further retrogression from ferrichromite in other deposits of the world (Ashley, 1975 and Kapsiotis et al., 2007). The Cr-depleted ferrichromites are not exactly chromian magnetites but show the same tendency toward enrichment in ferric iron and depletion in Cr. Some magnetites have been found in the chromites of this study as well as magnetite veins cross-cutting chromite are a result of retrogression along with the magnetite with serpentine.
The chromitites of DDH BT-09-17 are the third type of ferrichromite observed in the McFaulds Lake chromites analysed. These upper chromitites have ferrichromites of high Cr-enrichment while depletion in FeO to 68 wt. % Cr2O3 and 20 wt. % FeO. The high Cr-enrichment along with lowering of FeO served to enrich not only the Cr content of the ores, but the Cr/Fe ratio as well. In most ferrichromites, there is a trend toward Fe-enrichment along with Cr-enrichment with hydration. The McFaulds Lake chromites have in general undergone this retrogression to enrich the Fe in these secondary chromites. However, there is a lowering of Fe in the case of DDH BT-09-17.
The lowering of FeO with ferrichromite is not well documented in the literature. One suggestion by Hamlyn and Keays (1979) regarding the Panton Sill in Australia is that the lowering of FeO in those chromites occurred with postcumulus reequilibration of the chromite. Although, it is not understood why there would be reequilibration of chromite to reduce the FeO here while enrich the FeO in chromites in the other drill hole intercepts, since they have the same mineral assemblages. An earlier paper by Hamlyn (1975) mentions that the Panton Sill chromites with this trend are the case of higher temperature chromite. Metamorphosed more aluminous spinels have undergone higher grades of amphibolite metamorphism to cause precipitation of Fe-depleted ferrichromite with hornblende. The higher T metamorphism would occur as a result of metasomatism under conditions of lower oxygen activity which would result in a reduction of FeO in the

272ferrichromite. In DDH BT-09-17, there is evidence that the chromitites underwent higher T metamorphism in the thermal aureole of a neighbouring cross-cutting gabbro that itself underwent autohydration. The heat from the gabbro would reequilibrate the chromite to higher metamorphic conditions toward that seen in the Panton Sill, though not crystallizing hornblende. Hydrothermal tremolite and epidote-zoisite and sphene mineralogy of the gabbro constrain metamorphism in the upper greenschist field to above 500 °C (Apted and Liou, 1983).
In association with the Cr-enriched ferrichromite, there is pristine MgO-rich tremolite that is interpreted to be prograde. The tremolite shows textures of zoning in the grains from a core Cr2O3-enriched core to a Cr2O3-depleted margin. This shows that the tremolite is not just a replacement of clinopyroxene, but that there was an earlier Cr-enriching event. Chromian-enriched tremolites are seen elsewhere in the McFaulds Lake chromites as chromian tremolites after chromian pyroxene. However, the crystal zoning present and MgO-rich chemistries suggests these tremolites are hydrothermal. It may be that there are other hydrothermal tremolites elsewhere in drill core. However, the presence of this phase along with the ferrichromite and higher T epidotes and sphenes in the gabbro suggests the condition of higher T hydrothermalism of both gabbro and altered chromite.
In general, it is shown that the Ring of Fire Intrusion underwent complete hydration to eradicate primary chemistries of olivine and pyroxene. This autohydration occurred as a result of subsolidus cooling of this synvolcanic komatiitic sill. Autohydration had the effect of convecting water from the seawater interface down and from the bottom of the intrusion upward through stratigraphy. The intrusion cooled from the base of the intrusion upwards from magmatic temperatures of 1300°C at olivine and chromite crystallization to to temperatures of 950°C in the roof gabbro. Encapsulation of residual melt crystallized with the sintering of chromites at lower temperatures of 700°C. Finally, the intrusion hydrated with the circulation of water rich in SiO2 and CO2, as low as 350°C with modification to serpentine. The fluids cooled the intrusion from the bottom dunites upward to the latest leucogabbros. The leucogabbros were the last to cool and retained their heat to 500°C while the lower cumulates were cooled to 350°C. Therefore, conditions of prograde modification of the upper chromitites in DDH BT-09

27317 were retained and preserved the higher T assemblages of tremolite, epidote, titanite, high Cr/Fe ferrichromite that are present in both gabbro and chromitite.
This autohydration supports that the Ring of Fire Intrusion is a subvolcanic sill. The intrusion is overlain by mafic volcanics and later intermediate volcanic that have been age dated to be coeval with the upper ferrogabbro. Other clues to synvolcanic volcanism are the komatiitic chemistry of the intrusion, the lack of thick stratigraphy that would be more suggestive of large layered intrusions, and the occurrence of thin chert horizons in the pyroxenites of some holes drilled in the Black Horse stratigraphy. These cherty silicalites represent the silicification barriers to the convecting fluids that one might see in a hydrothermal VMS system. They are found in pyroxenites which are in turn overlain by silicified volcanics of this subvolcanic to volcanic system.

274CHAPTER 7 CONCLUSIONS
7.1 Conclusions A number of conclusions can been drawn from the study of the McFaulds Lake chromite deposits. One is that the electron microprobe analyses on the chromite minerals give evidence of magmatic variation. Magmatic chemistries of the chromite minerals are displayed by linear enrichment of wt. % Cr2O3 vs. MgO from disseminated to massive chromite. Linear variations are also evident in the negative linear correlation of FeO vs. MgO. The variability of Cr2O3 and MgO with down hole depth give evidence that chromite mineralized by means of repeating successive primitive pulses or replenishments followed by differentiations with height of the intrusion. Evidence of replenishments are the occurrence of periodic Cr2O3 and MgO peaks or increases that are followed by decreases of Cr2O3 and MgO with differentiation before there is another replenishment. These pulses occur at the cm to metre scale in the chromitites.
The Black Thor and Big Daddy chromites are higher grade and distinguished from the Black Label chromites. The compositions of the Black Thor and Big Daddy chromites range from 49 to 53 wt. % Cr2O3 while the Black Label chromites range from 46 to 50 wt. % Cr2O3. The Black Thor and Big Daddy chromites also have higher Cr/Fe at 1.53 to 2.90 in contrast to the lower Cr/Fe of Black Label at 0.98 to 2.42. In the Black Label chromites, there are textures of pyroxene oikocrysts and olivine aggregates with wavy layering suggestive of dynamic deposition with magma mixing with oikocrystic pyroxene-bearing ultramafics. With greater modal % silicate, there are lower Cr2O3 and MgO contents which makes the ore lower grade than the Black Thor and Big Daddy chromites. The Black Label chromites are also distinguished from the Black Thor and Big Daddy chromites in the laser ablation analyses. There are higher negative Ni
275anomalies and higher positive Ti and Fe anomalies suggestive of more fractionated chromites.
The massive chromitite of Big Daddy DDH FW-08-19 shows more subtle change in Cr2O3 vs. depth in contrast to the more varying Cr2O3 compositions from the massive to the disseminated chromites in Black Label DDH BT-09-31 and Black Thor BT-08-10. Even though, there is subtle change in wt. % Cr2O3 in the massive chromite, pulses are still evident in the variation of wt. % MgO with depth. The high Cr2O3 and MgO compositions of the chromites and less variation from core to rim rule out the possibility that these chromites have been reequilibrated to mask primary compositions. Also there is the same variation in core chromite compositions in the massive Big Daddy chromites as the massive chromites of the Black Label and Black Thor intercepts. Therefore, the similar Cr2O3 compositions of the Big Daddy chromites are probably a result of real igneous processes. A theory for subtle decrease of wt. % Cr2O3 upward is that these chromites are a result of a cascading effect of double diffusive convection cells upward. Repeating convection cells cause chromite deposition in upward succession whereby the more progressively filled cells have more primitive Cr2O3 compositions. Upward in stratigraphy, the double diffusive convection effect wanes and differentiation is evident by the slightly decreasing Cr2O3 compositions before the next pulse takes place.
The chromites mineralized as both primitive settled chromites and later in situ chromites. In some of the replenishments of the Big Daddy chromites, there are distinctly higher MgO compositions than the MgO compositions in the chromites higher in a pulse. The distinction of high, early MgO compositions from lower, later MgO compositions support evidence of there being two generations of chromite: an early primitive settled chromite and a later in situ crystallized chromite. The occurrence of distinct high MgO compositions vs. lower MgO compositions at the same depth in some instances indicates that the variability of core compositions is due to some chromites being early settled chromites while others follow with later in situ crystallization of the interstitial melt. There is variation from lower to higher core wt. % Cr2O3 and MgO compositions in all the chromite intercepts which indicates that this succession in chromite mineralization in characteristic of all types of chromite. For textural evidence, massive chromites often contain very primitive cores of large grains that are the early

276settled chromites along with later smaller chromite cores that are later in situ chromites with lower Cr2O3 and MgO chemistries. Textures of chain and net-textured chromites in semi-massive chromites support the crystallization of chromites interstitial to cumulus olivines.
Round silicate inclusions in some chromites vs. no inclusions in others supports the interpretation that there was an early deposition of primary settled chromite followed by in situ chromite that encaptured late igneous melt exsolved from a compressed cumulus igneous pile. The silicate inclusions have igneous amphibole and phlogopite with high Ti compositions that identify original igneous minerals. The prevalence of these inclusions in chain and net-textured semi-massive chromites suggests these chromites are later in-situ chromites that encaptured residual liquid. The idea that the primary core chromites do not have these inclusions and that the inclusion are late igneous phases of the intrusion rules out the possibility that they are remnants of exotic contaminants that were involved in chromite crystallization.
The chromites reached stability by magma mixing between the olivine and pyroxene fields, rather than by means of salic contamination. This is suggested by the fact that silicate inclusions are related to magmatic fluids introduced with compression of the igneous pile, the fact that the chromites occur between dunite and pyroxenite lithologies in any order, the fact that disseminated cumulus chromite sometimes occurs in pyroxenite before a massive chromite interval (e.g. DDH BT-09-17), the lack of evidence of assimilated xenoliths, the occurrence of both pyroxene and olivine inclusions in juxtaposed chromites and the distinction of trace element and full spectrum PGE signatures of dunite vs. pyroxenite.
There is variation of decreasing wt. % Cr2O3 and MgO in the chromites from core to margin of chromite grains that is evidence of zoning in the chromites. Since the location of this zoning is prevalent on outer margins, along crack of grains, in smaller grains and surrounding silicate inclusions, the zoning is attributed to retrogression rather than silicate exchange with primary intercumulus silicate. The decrease in wt. % Cr2O3 and MgO is due to silicate exchange with interstitial and rim retrogressive chlorites. This diffusion is part of the modification of the chromite with hydration.

277The primary chromites were later retrogressed to rim ferrichromite and chlorite. Mg and Cr ions are leached from the chromite while Al is enriched due to reaction forming ferrichromite and chlorite. The formation of ferrichromite and chlorite occurs along with the serpentinization of the dunites and tremolitization and chloritization of the pyroxenites. These reactions occur as the intrusion underwent greenschist subsolidus hydration at 300-350°C.
In the chromites of DDH BT-08-17, there is different variation with diffusion from chromite core to rim to lower wt. % Cr2O3, but higher wt. % MgO. The variation of Cr2O3 and MgO with depth do not show much evidence of magmatic fractionation. There is evidence of zoned tremolite interstitial the chromite grains in massive chromite in this interval. Since there is increase in wt. % MgO rather than decrease and there is zoned tremolite, it is proposed that this upper chromitite underwent higher temperature retrogression than the chromites in the other intercepts. The chromitite in this intercept is intercalated with gabbro. Petrography of the gabbro shows tremolite replacement of pyroxene, epidote-saussurite replacement of plagioclase and sphene mineralogy that support higher temperature retrogression in the gabbro. The bulk rock chemistry of the gabbro shows that it contains nil Ni and Cr and is therefore not saturated to warrant chromite mineralization. The higher T retrogression of the gabbro, the nil Ni and Cr and the intercalation of massive with no disseminated chromite in gabbro support the interpretation that the gabbro intrudes the upper chromitite, and that the heat of the gabbro caused prograde alteration to higher degrees C in both the gabbro and surrounding chromitite. Therefore, the diffusion to higher wt. % MgO from core to rim in the chromites is due to higher T retrogression. Along with diffusion to higher wt. % MgO, there was retrogression to higher wt. % Cr2O3 in the altered ferrichromite rims. It is proposed that higher T retrogressive fluids caused Cr2O3 enrichment in the ferrichromite rims to these chromite. These ferrichromites have the highest Cr2O3 compositions and serve to enrich the chromite ores in the interval.
7.2 Summary From the study of the McFaulds Lake chromite a sequence of events can be deduced:
1. Regional WNW-ESE trending faults and NNE-SSW oriented faults related to rifting are the locus of the magma to the Ring of Fire magma chamber.
2782. As the komatiitic Ring of Fire magma intruded the Oxford-Stull Terrane basement TTG, there was crustal contamination of the magma to produce large negative Nb-Ta and Zr-Hf anomalies in the geochemical signatures of the komatiitic magma. 3. The feeders of the Ring of Fire intrusion intruded in NW-SE oriented faults that are seen as displacement of the linear chromite zones. 4. In the McFaulds Lake sequence of the Ring of Fire magma chamber, there was first the pulsing and settling of primitive dunite. On the roof of the initial magma chamber, there was pyroxenite. In the Black Label sequence, primitive pulses of magma represented by the dunite mixed with pyroxene under dynamic conditions to crystallize oikocrystic harzburgite. In this dynamic environment, there was magma mixing of pyroxene in the primitive olivine pulse to dither the magma into the Cr field and crystallize the Black Label Layer 1 chromitite within the oikocrystic harzburgite. The dynamic features of the oikocrystic harzburgite are also suggested by magmatic breccias and wavy, pyroxene-rich textures in the Black Label chromite. The oikocrystic pyroxene has the effect of decreasing the Cr/Fe ratio of the chromite ore. 5. With differentiation of pyroxenite and additional mixing to produce oikocrystic harzburgite, there was the introduction of a primitive Mg pulse of magma to migrate the magma into Cr stability again in the Black Label Layer 2 chromitite. This chromitite is more primitive and reflects the chemistry of this dunite pulse. Dunite is being differentiated in this chamber at this time. It is Cr-saturated, and when there is slight dithering of the magma to a composition closer to pyroxene, another chromititie horizon will form such as the Black Label Layer 3 chromitite. 6. There is a large sequence of primitive dunite between the Black Label and Black Thor sequences. This dunite is probably very primitive and well below Cr saturation. 7. As the dunite sequence evolves in composition, the magma approaches Cr stability and mineralizes disseminated interstitial chromite followed by intermittent pulses of interstitial chromite in dunite in the DDH BT-08-10. New
279chromite layers separate out of the magma as the melt migrates into Cr stability from the more evolved olivine.
8. Further in BT-08-10 sequence, the melt migrates in the Cr field closer to pyroxene and the chromite itself grades into pyroxenite. There is a massive layer at the top of the sequence where there is olivine-only crystallization. Not far above this sequence, there is only pyroxenite. The evidence of there being a large sequence of pyroxenite after this chromite interval and that the pyroxenite has higher degrees of crustal contamination of TTG that affects it differently than the underlying dunite suggests to some extent that the pyroxenite was a later differentiate that a primitive olivine magma mixed in to cause chromite saturation. At first chromite is disseminated with evolved dunite; however, the presence of cumulus pyroxene evident in the drill core along with the associated development of a massive layer of chromite suggests dithering occurred from a pyroxene to chromite magma with the mixing in of olivine. 9. In other nearby areas of the same intrusion at Big Daddy DDH FW-08-19, there is massive chromitite hosted in pyroxenite. The intermittent pulses in the Black Thor-Big Daddy deposits as a whole build up into layers upwards and outwards within double diffusive convective cycles of magma. These convection cycles cause separation of chromite into semi-massive net-textured chromitites followed by massive chromitites. Along with crystallization of semi-massive and massive chromite, there is the exsolution of magmatic fluids from the cumulus pile that are captured by the growing chromite grains. Further modification of the chromite includes adcumulus growth of the in situ chromites unto massive chromite. 10. In the layers higher up in the Black Thor sequence, there is primarily pyroxenite. Some mini-pulses of dunite cause the magma to migrate into chromite stability again from pyroxene to mineralize the upper chromitites such as in DDH BT-0917. 11. Later in the upper chromite sequence of BT-09-17, there was the intrusion of gabbro into the upper chromitite that underwent higher T prograde modification of the upper chromitite. Within this chromite, ferrichromite is enriched to up to 68 wt. % Cr2O3 and hydrothermal tremolite becomes stable in nearby silicate.

28012. As the subvolcanic Ring of Fire Intrusion underwent subsolidus cooling, there was autohydration by fluids that circulated from the seawater interface down through the stratigraphy of the intrusion. The primary olivines and pyroxenes of the dunite and pyroxenite retrogress into serpentine, tremolite, talc and chlorite. In the chromitites themselves, the original magmatic signatures of the chromites are well preserved with some areas of retrogression where there is zoning in the grains and replacement rims. In the zoned chromites, Mg and Cr are diffused out of the chromites causing enrichment in Fe and Al. Further retrogression results in diffusion of Fe and Cr that causes the crystallization of enriched Cr ferrichromite rims to the chromite. In this reaction, Mg and Al diffuses and dissolves from the chromite into the chlorite associated with the ferrichromite. 13. Further retrogression of the chromites causes the formation of Cr-depleted chromite which is more oxidized and has less Cr. Often, the Cr-depleted ferrichromite is found in association with more Cr-depleted disseminated chromites in the Black Label and Black Thor olivine-chromite cumulates. As hydrous fluids advanced upward in stratigraphy, the gabbros and upper chromitite were the last to cool and undergo retrogression to produce the MgO-depleted chromites in the upper part of the upper chromitite. 14. The Ring of Fire Intrusion was finally overturned as a result of late Kenoran granodiorite diapirism in the Oxford-Stull Terrane. This caused the steep plunges and overturning of the stratigraphy in the Black Label-Black Thor and Big Daddy sequences. Deformation fabrics often overprint the chromitites in massive chromites, together with Cr-enrichment in chromian chlinochlore and kaemmererite vein alteration.


![instruct.uwo.cainstruct.uwo.ca/engin-sc/cbe497/rah/Hazard_Analysis/15... · XLS file · Web view2002-12-05 · Farris PSV Code No. = Table Line = P Orif Class (D-T, omit I ... (58.27)(58.27)(34.15)]](https://img.dokumen.tips/doc/110x75/5b1bac897f8b9a3c258ee79d/-xls-file-web-view2002-12-05-farris-psv-code-no-table-line-p-orif.jpg)