Embed Size (px)
Citation preview

ACM Transactions on xxxxxxxx, Vol. xx, No. x, Article xx, Publication date: Month YYYY
Using Video to Automatically Detect Learner Affect in Computer-
enabled Classrooms
NIGEL BOSCH, University of Notre Dame
SIDNEY K. D’MELLO, University of Notre Dame
JACLYN OCUMPAUGH, Teachers College, Columbia University
RYAN S. BAKER, Teachers College, Columbia University
VALERIE SHUTE, Florida State University
Affect detection is a key component in intelligent educational interfaces that respond to students’ affective
states. We use computer vision and machine learning techniques to detect students’ affect from facial
expressions (primary channel) and gross body movements (secondary channel) during interactions with an
educational physics game. We collected data in the real-world environment of a school computer lab with
up to thirty students simultaneously playing the game, while moving around, gesturing, and talking to
each other. The results were cross-validated at the student level to ensure generalization to new students.
Classification accuracies, quantified as area under the receiver operating characteristic curve (AUC), were
above chance (AUC of 0.5) for all the affective states observed, namely boredom (AUC =.610), confusion
(AUC = .649), delight (AUC = .867), engagement (AUC = .679), frustration (AUC = .631), and for off-task
behavior (AUC = .816). Furthermore, the detectors showed temporal generalizability in that there was less
than a 2% decrease in accuracy when tested on data collected from different times of the day and from
different days. There was also some evidence of generalizability across ethnicity (as perceived by human
coders) and gender, although with a higher degree of variability attributable to differences in affect base
rates across subpopulations. In summary, our results demonstrate the feasibility of generalizable video-
based detectors of naturalistic affect in a real-world setting, suggesting that the time is ripe for affect-
sensitive interventions in educational games and other intelligent interfaces.
Categories and Subject Descriptors: H.1.2 [Models and Principles]: User/Machine Systems
General Terms: Affective Computing, Computer Vision, User Modeling
Additional Key Words and Phrases: Affect detection, generalization, naturalistic facial expressions,
classroom data, in the wild
ACM Reference Format:
Nigel Bosch, Sidney K. D’Mello, Jaclyn Ocumpaugh, Ryan S. Baker, and Valerie Shute, 2016. Using video
to automatically detect learner affect in computer-enabled classrooms. ACM Trans. Interactive Intelligent
Syst. X, X, Article XX (Month 2016), X pages.
This research was supported by the National Science Foundation (NSF) (DRL 1235958) and the Bill &
Melinda Gates Foundation. Any opinions, findings and conclusions, or recommendations expressed in this
paper are those of the authors and do not necessarily reflect the views of the NSF or the Bill & Melinda
Gates Foundation.
Author’s addresses: N. Bosch, Department of Computer Science, University of Notre Dame; S. D’Mello,
Departments of Computer Science and Psychology, University of Notre Dame; J. Ocumpaugh, Department
of Human Development, Teachers College, Columbia University; R. Baker, Department of Human
Development, Teachers College, Columbia University; V. Shute, Department of Educational Psychology
and Learning Systems, Florida State University.
Permission to make digital or hardcopies of part or all of this work for personal or classroom use is granted
without fee provided that copies are not made or distributed for profit or commercial advantage and that
copies show this notice on the first page or initial screen of a display along with the full citation.
Copyrights for components of this work owned by others than ACM must be honored. Abstracting with
credits permitted. To copy otherwise, to republish, to post on servers, to redistribute to lists, or to use any
component of this work in other works requires prior specific permission and/or a fee. Permissions may be
requested from Publications Dept., ACM, Inc., 2 Penn Plaza, Suite 701, New York, NY 10121-0701 USA,
fax +1 (212) 869-0481, or [email protected].
© 2010 ACM 1539-9087/2010/03-ART39 $15.00
DOI:http://dx.doi.org/10.1145/0000000.0000000
??

??:2 N. Bosch et al.
ACM Transactions on xxxxxxxx, Vol. xx, No. x, Article x, Publication date: Month YYYY
INTRODUCTION 1.
Learning is not a mere cognitive endeavor but an affectively charged experience
[Calvo and D’Mello 2011; D’Mello 2013]. Affective states like confusion, frustration,
boredom, anxiety, curiosity, engagement, and happiness occur continually
throughout the learning experience. The affective states are not merely incidental.
They indirectly influence learning by modulating cognition in multiple ways [Clore
and Huntsinger 2007]. An effective learning agent, be it human or computer, should
foster affective states that are beneficial to learning, such as engaged concentration,
interest, and curiosity. It should also minimize the occurrence of states that can
interfere with learning, such as boredom and despair.
A human teacher or tutor can observe students’ affect (cf. [Lepper et al. 1993]) and
can use that information to determine how to adjust the pace or content of learning
materials. Can our intelligent learning environments do the same? Some initial
progress toward affect-sensitive (or affect-aware) learning technologies has occurred
in laboratory settings (see [D’Mello et al. 2014] for a recent review). But it is time to
consider affect-sensitivity in contexts where everyday learning occurs – in classrooms,
in a school computer lab, in homes, or in the library. This is the long-term goal of this
work. One initial challenge that we consider here is the task of detecting affective
states in noisy contexts.
Affect can be detected from multiple data streams. For example, interaction data
(e.g., speed of actions performed in an interface, number of help requests) [Baker et
al. 2012], facial expressions [Bosch et al. 2014; Kapoor and Picard 2005], posture
[Mota and Picard 2003], and other data sources have been used to detect students’
affective states (see [Calvo and D’Mello 2010; Zeng et al. 2009; Calvo et al. 2015] for
reviews). Facial features are attractive for affect detection because there is a well-
studied link between facial features and affective states [Ekman et al. 1980;
Reisenzein et al. 2013], face-based affect detectors are likely to generalize across
different learning technologies (unlike interaction-based detectors), and they do not
require expensive hardware as webcams are ubiquitous on laptops and mobile
devices. Therefore, we focus on video to detect affective states from facial features
(primary channel) and body movements (secondary channel).
First, face-based affect detection has been extensively researched (see [Calvo and
D’Mello 2010; Zeng et al. 2009] for reviews), but most of the work has occurred
outside of learning contexts and mainly in laboratory settings (see exceptions
discussed below). Laboratory environments have the advantage of relatively
consistent lighting, which facilitate computer vision methods, and are free from
distractions from other people, cell phones, etc. Further, motion, unusual head pose,
and face-occluding gestures are much more difficult to control in the wild compared
to the lab, thereby introducing additional challenges.
Second, much of the previous work on face-based affect detection has focused on
the so-called ―basic emotions‖ [Ekman 1992] of anger, fear, sadness, happiness,
disgust, and surprise (see reviews in [D’Mello and Calvo 2013; Calvo and D’Mello
2010]). However, a recent meta-analysis of 24 studies indicated that these basic
emotions are quite infrequent during short (30-90 mins) learning sessions with
technology [D’Mello 2013]. Instead, affective states such as engagement, boredom,
confusion, frustration, happiness, curiosity, and anxiety were much more frequent. It
is unclear if these ―learning-centered‖ affective states can be detected as accurately
as the basic emotions, where the links between emotion and expression have been
investigated for decades [Ekman et al. 1980; Reisenzein et al. 2013]. Similar links
Using Video to Automatically Detect Learner Affect in Computer-enabled Classrooms ??:3
ACM Transactions on xxxxxxxx, Vol. xx, No. xx, Article xx, Publication date: Month YYYY
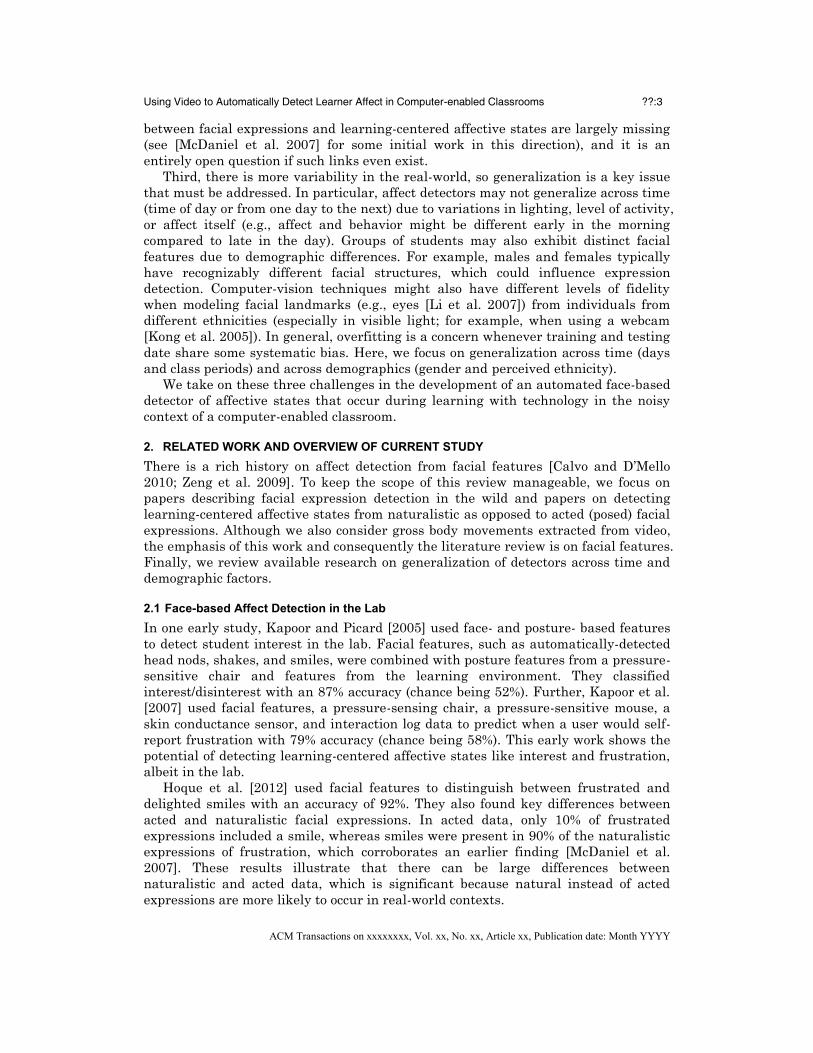
between facial expressions and learning-centered affective states are largely missing
(see [McDaniel et al. 2007] for some initial work in this direction), and it is an
entirely open question if such links even exist.
Third, there is more variability in the real-world, so generalization is a key issue
that must be addressed. In particular, affect detectors may not generalize across time
(time of day or from one day to the next) due to variations in lighting, level of activity,
or affect itself (e.g., affect and behavior might be different early in the morning
compared to late in the day). Groups of students may also exhibit distinct facial
features due to demographic differences. For example, males and females typically
have recognizably different facial structures, which could influence expression
detection. Computer-vision techniques might also have different levels of fidelity
when modeling facial landmarks (e.g., eyes [Li et al. 2007]) from individuals from
different ethnicities (especially in visible light; for example, when using a webcam
[Kong et al. 2005]). In general, overfitting is a concern whenever training and testing
date share some systematic bias. Here, we focus on generalization across time (days
and class periods) and across demographics (gender and perceived ethnicity).
We take on these three challenges in the development of an automated face-based
detector of affective states that occur during learning with technology in the noisy
context of a computer-enabled classroom.
RELATED WORK AND OVERVIEW OF CURRENT STUDY 2.
There is a rich history on affect detection from facial features [Calvo and D’Mello
2010; Zeng et al. 2009]. To keep the scope of this review manageable, we focus on
papers describing facial expression detection in the wild and papers on detecting
learning-centered affective states from naturalistic as opposed to acted (posed) facial
expressions. Although we also consider gross body movements extracted from video,
the emphasis of this work and consequently the literature review is on facial features.
Finally, we review available research on generalization of detectors across time and
demographic factors.
Face-based Affect Detection in the Lab 2.1
In one early study, Kapoor and Picard [2005] used face- and posture- based features
to detect student interest in the lab. Facial features, such as automatically-detected
head nods, shakes, and smiles, were combined with posture features from a pressure-
sensitive chair and features from the learning environment. They classified
interest/disinterest with an 87% accuracy (chance being 52%). Further, Kapoor et al.
[2007] used facial features, a pressure-sensing chair, a pressure-sensitive mouse, a
skin conductance sensor, and interaction log data to predict when a user would self-
report frustration with 79% accuracy (chance being 58%). This early work shows the
potential of detecting learning-centered affective states like interest and frustration,
albeit in the lab.
Hoque et al. [2012] used facial features to distinguish between frustrated and
delighted smiles with an accuracy of 92%. They also found key differences between
acted and naturalistic facial expressions. In acted data, only 10% of frustrated
expressions included a smile, whereas smiles were present in 90% of the naturalistic
expressions of frustration, which corroborates an earlier finding [McDaniel et al.
2007]. These results illustrate that there can be large differences between
naturalistic and acted data, which is significant because natural instead of acted
expressions are more likely to occur in real-world contexts.

??:4 N. Bosch et al.
ACM Transactions on xxxxxxxx, Vol. xx, No. x, Article x, Publication date: Month YYYY
More recently, Whitehill et al. [2014] used Gabor features (appearance-based
features capturing edges and textures of various parts of the face) to detect
behavioral engagement as students used cognitive skills training software. They
were able to detect engagement as judged by human annotators at rates
substantially greater than chance. Specifically, they reported an average AUC (area
under the receiver operating characteristic curve) of .729 compared to a chance-level
AUC of .5.
Gabor features have also been used for detection of Action Units (AUs), which
refer to activation of specific facial muscles (e.g., lowered brow) [Ekman and Friesen
1978]. As noted in [Senechal et al. 2014], detecting action units can be a useful
intermediate dimensionality reduction step toward detecting affective states as
features derived from AUs range in the tens to hundreds compared to the much
larger numbers of Gabor features or other lower-level features (e.g., local binary
pattern features). There has also been considerable progress in automatic detection
of AUs from video [Valstar et al. 2012; Girard et al. 2015]. For example, the
Computer Expression Recognition Toolbox (CERT) [Littlewort et al. 2011] can
automatically detect AUs as well as head pose and head position information. CERT
uses Gabor features as inputs to SVMs that provide likelihood estimates of the
presence of 20 different AUs on a frame-by-frame basis. CERT has been tested with
databases of both posed and spontaneous facial expressions, achieving accuracies of
90.1% and 79.9% respectively for discriminating between presence vs. absence of AUs
[Littlewort et al. 2011].
Grafsgaard et al. [2013] achieved modest results (R2 = .24) in using CERT to
predict self-reported (on a Likert scale) frustration during a learning session. They
did not perform frustration detection at a fine-grained level (i.e. specific affective
episodes), instead detecting the presence of frustration across the entire learning
session. They also verified that there was moderate agreement (Cohen’s kappa of .68
or higher) between CERT AU estimates and human-coded AUs after correcting for
individual differences in facial features (e.g., eyebrows appear raised even in a
neutral expression for some students but not others).
In another study, Bosch and D’Mello [2014] demonstrated the effectiveness of
CERT features for affect detection when novices learned the basis of computer
programming from a computerized learning environment. They were able to detect
confusion and frustration at levels above chance (22.1% and 23.2% better than
chance, respectively), but accuracy was much lower for other states (11.2% above
chance for engagement; 3.8% above chance for boredom).
In summary, these studies show that it is possible to automatically detect
learning-centered affective states from video. However, they were conducted with the
high degree of control afforded by the laboratory, so applicability to real-world
contexts is unknown. There has been some recent work on affect detection in more
real world contexts, as reviewed below.
Face-based Affect Detection in the Wild 2.2
The Affectiva-MIT Facial Expression Dataset (AM-FED) [McDuff et al. 2013]
contains videos of participants recorded in their personal environments. Participants
watched Super Bowl commercials which were likely to elicit smiles, which could be
detected quite accurately (AUC = .90). The authors were also able to detect whether
viewers liked the commercials (AUC = .82) and wanted to view them again (AUC
= .79) [McDuff et al. 2014]. They also found that appearance-based features yielded

Using Video to Automatically Detect Learner Affect in Computer-enabled Classrooms ??:5
ACM Transactions on xxxxxxxx, Vol. xx, No. xx, Article xx, Publication date: Month YYYY
higher accuracy than geometric features. This is likely due to the fact that precisely
locating the shape of facial landmarks was more difficult than simply extracting
textures from regions of the face in the noisy AM-FED data set. We also used
appearance-based features for AU detection, which is presumably more appropriate
for a noisy real-world context.
In a somewhat similar vein, Hernandez et al. [2012] used computer vision
techniques to detect smiles collected from cameras in various buildings on a college
campus. They found expected patterns, such as more smiles on weekends and
holidays, suggesting that visible affect might be influenced by temporal and seasonal
factors, thereby highlighting the importance of temporal generalizability for affect
detectors.
The Emotion Recognition in the Wild Challenge [Dhall et al. 2013] is an effort to
create a common benchmark to test audio and visual affect detection techniques. The
challenge used the Acted Facial Expressions in the Wild (AFEW) database, which
was compiled using movie clips. These professionally acted clips raise some concerns
due to well-known differences between acted and naturalistic expressions, as
discussed above. Nevertheless, recent advancements in computer vision techniques
(such as deep neural networks [Kahou et al. 2013]) were successful for the AFEW
data set and may prove useful in the present context as well.
In perhaps the study most closely related to our work, Arroyo et al. [2009] tracked
self-reported affect of high school math students and college students taking a math
for elementary teachers class. They simultaneously recorded facial features, posture,
skin conductance, mouse movements, and contextual information from log-files.
Their best models explained 52% of the variance (R2) for confidence, 46% for
frustration, 69% for excitement, and 29% for interest in predicting self-reported affect
on Likert scales. Although this research suggests that it is possible to perform
automated affect detection in a classroom, this conclusion should be interpreted with
a modicum of caution. This is because the models were not validated with a separate
testing set (i.e. no cross validation was performed), and the data sets were small (20-
36 instances depending on model) due to missing data. These issues raise concerns of
overfitting to the training data.
Temporal and Demographic Generalization of Affect Detectors 2.3
Most of the work on temporal generalization has focused on physiological signals (e.g.,
skin conductance and heart rate) with the general finding of degraded affect
detection accuracy when training on data from one day and testing on another
[AlZoubi et al. 2011; Picard et al. 2001]. In a classic study, Picard et al. [2001] found
that physiological data were more tightly clustered by affective state within a day
than across days. Generalization issues were due in part to physical differences from
day to day, such as a change in resting heart rate and skin conductance – factors
related to mood, physical exercise, and so on. Efforts have been made to improve
generalization of physiology-based detectors across time [AlZoubi et al. 2011; AlZoubi
et al. 2015], but it is not clear whether such measures will also be necessary for face-
based affect detectors.
Ocumpaugh et al. [Ocumpaugh et al. 2014] created affect detectors using log file
data from three different demographics: urban, suburban, and rural students. They
found that detectors built using data from all three groups worked well (average
AUC = .65) but detectors trained on one group and applied to another did not
??:6 N. Bosch et al.
ACM Transactions on xxxxxxxx, Vol. xx, No. x, Article x, Publication date: Month YYYY
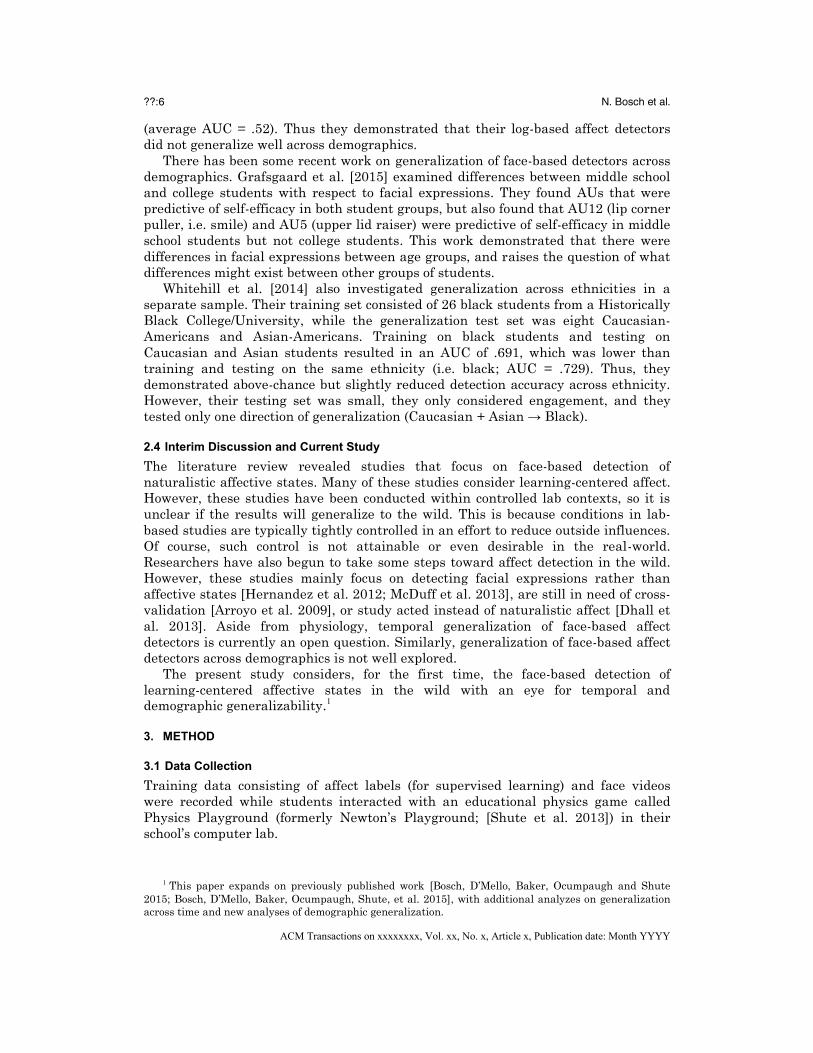
(average AUC = .52). Thus they demonstrated that their log-based affect detectors
did not generalize well across demographics.
There has been some recent work on generalization of face-based detectors across
demographics. Grafsgaard et al. [2015] examined differences between middle school
and college students with respect to facial expressions. They found AUs that were
predictive of self-efficacy in both student groups, but also found that AU12 (lip corner
puller, i.e. smile) and AU5 (upper lid raiser) were predictive of self-efficacy in middle
school students but not college students. This work demonstrated that there were
differences in facial expressions between age groups, and raises the question of what
differences might exist between other groups of students.
Whitehill et al. [2014] also investigated generalization across ethnicities in a
separate sample. Their training set consisted of 26 black students from a Historically
Black College/University, while the generalization test set was eight Caucasian-
Americans and Asian-Americans. Training on black students and testing on
Caucasian and Asian students resulted in an AUC of .691, which was lower than
training and testing on the same ethnicity (i.e. black; AUC = .729). Thus, they
demonstrated above-chance but slightly reduced detection accuracy across ethnicity.
However, their testing set was small, they only considered engagement, and they
tested only one direction of generalization (Caucasian + Asian → Black).
Interim Discussion and Current Study 2.4
The literature review revealed studies that focus on face-based detection of
naturalistic affective states. Many of these studies consider learning-centered affect.
However, these studies have been conducted within controlled lab contexts, so it is
unclear if the results will generalize to the wild. This is because conditions in lab-
based studies are typically tightly controlled in an effort to reduce outside influences.
Of course, such control is not attainable or even desirable in the real-world.
Researchers have also begun to take some steps toward affect detection in the wild.
However, these studies mainly focus on detecting facial expressions rather than
affective states [Hernandez et al. 2012; McDuff et al. 2013], are still in need of cross-
validation [Arroyo et al. 2009], or study acted instead of naturalistic affect [Dhall et
al. 2013]. Aside from physiology, temporal generalization of face-based affect
detectors is currently an open question. Similarly, generalization of face-based affect
detectors across demographics is not well explored.
The present study considers, for the first time, the face-based detection of
learning-centered affective states in the wild with an eye for temporal and
demographic generalizability.1
METHOD 3.
Data Collection 3.1
Training data consisting of affect labels (for supervised learning) and face videos
were recorded while students interacted with an educational physics game called
Physics Playground (formerly Newton’s Playground; [Shute et al. 2013]) in their
school’s computer lab.
1 This paper expands on previously published work [Bosch, D’Mello, Baker, Ocumpaugh and Shute
2015; Bosch, D’Mello, Baker, Ocumpaugh, Shute, et al. 2015], with additional analyzes on generalization
across time and new analyses of demographic generalization.

Using Video to Automatically Detect Learner Affect in Computer-enabled Classrooms ??:7
ACM Transactions on xxxxxxxx, Vol. xx, No. xx, Article xx, Publication date: Month YYYY
Participants. The sample consisted of 137 8th and 9th grade students (57 male, 80
female) who were enrolled in a public school in a medium-sized city in the
Southeastern U.S. They were tested in groups of about 20 students per class period
for a total of four periods on different days (55 minutes per period). Students in the
8th and 9th grades (predominately 13-15 years old) were selected because of the
alignment between Physics Playground content and State Standards (relating to
Newtonian physics) at those grade levels.
Interface. Physics Playground is a two-dimensional game that requires the
player to apply principles of Newtonian physics in an attempt to guide a green ball to
a red balloon (key goal) in many challenging configurations. The player can nudge
the ball to the left and right (if the surface is flat) but the primary way to move the
ball is by drawing/creating simple machines (which are called ―agents of force and
motion‖ in the game) on the screen that ―come to life‖ once the object is drawn
(example in Fig. 1). Thus, the problems in Physics Playground require the player to
draw/create four different types of agents (which are simple machine-like objects):
inclined plane/ramps, pendulums, levers, and springboards. All solutions are drawn
with colored lines using the mouse. Everything in the game obeys the basic laws of
physics relating to gravity and Newton’s three laws of motion.
Fig. 1. Ramp solution for a simple Physics Playground problem.
Procedure. The study took place in one of the school’s computer-enabled
classrooms, which was equipped with about 30 desktop computers for schoolwork.
Each computer was equipped with a monitor, mouse, keyboard, webcam, and
headphones. Inexpensive webcams ($30) were affixed at the top of the monitor on
each computer. At the beginning of each session, the data collection software allowed
students to position their faces in the center of the camera’s field of view by adjusting
the camera angle up or down. This process was guided by on-screen instructions and
verbal instructions given by the experimenters, who were also available to answer
any additional questions and to troubleshoot any problems.
??:8 N. Bosch et al.
ACM Transactions on xxxxxxxx, Vol. xx, No. x, Article x, Publication date: Month YYYY
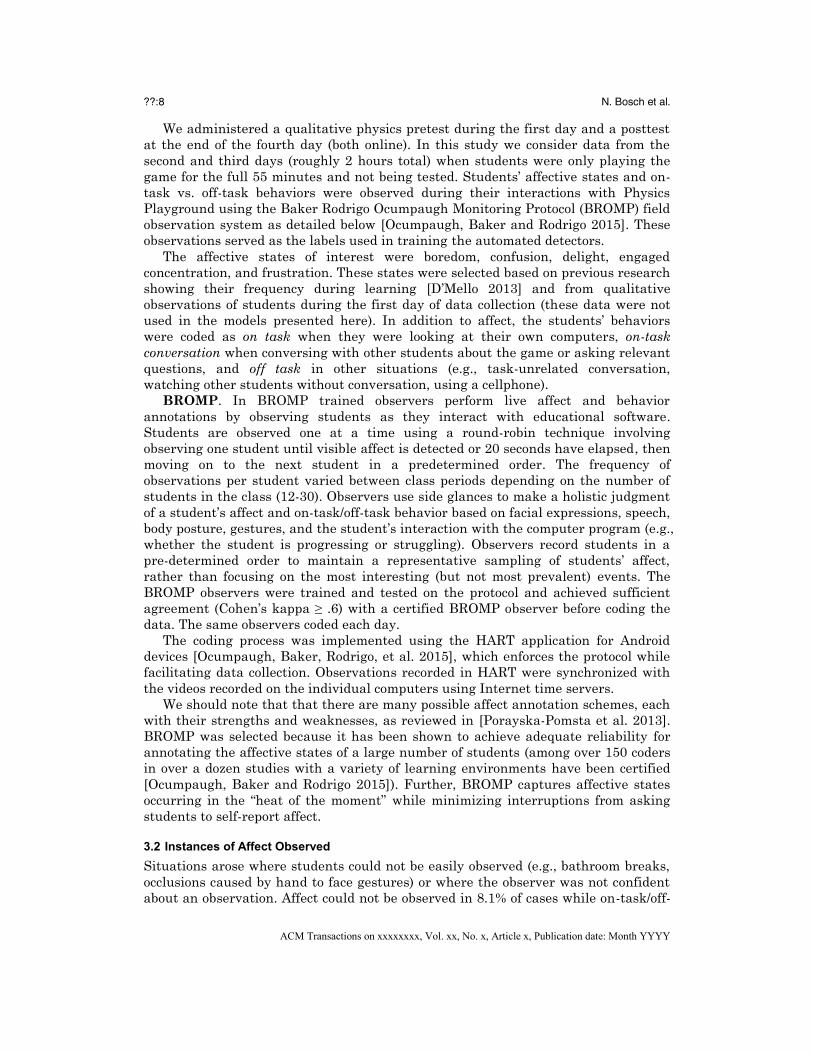
We administered a qualitative physics pretest during the first day and a posttest
at the end of the fourth day (both online). In this study we consider data from the
second and third days (roughly 2 hours total) when students were only playing the
game for the full 55 minutes and not being tested. Students’ affective states and on-
task vs. off-task behaviors were observed during their interactions with Physics
Playground using the Baker Rodrigo Ocumpaugh Monitoring Protocol (BROMP) field
observation system as detailed below [Ocumpaugh, Baker and Rodrigo 2015]. These
observations served as the labels used in training the automated detectors.
The affective states of interest were boredom, confusion, delight, engaged
concentration, and frustration. These states were selected based on previous research
showing their frequency during learning [D’Mello 2013] and from qualitative
observations of students during the first day of data collection (these data were not
used in the models presented here). In addition to affect, the students’ behaviors
were coded as on task when they were looking at their own computers, on-task
conversation when conversing with other students about the game or asking relevant
questions, and off task in other situations (e.g., task-unrelated conversation,
watching other students without conversation, using a cellphone).
BROMP. In BROMP trained observers perform live affect and behavior
annotations by observing students as they interact with educational software.
Students are observed one at a time using a round-robin technique involving
observing one student until visible affect is detected or 20 seconds have elapsed, then
moving on to the next student in a predetermined order. The frequency of
observations per student varied between class periods depending on the number of
students in the class (12-30). Observers use side glances to make a holistic judgment
of a student’s affect and on-task/off-task behavior based on facial expressions, speech,
body posture, gestures, and the student’s interaction with the computer program (e.g.,
whether the student is progressing or struggling). Observers record students in a
pre-determined order to maintain a representative sampling of students’ affect,
rather than focusing on the most interesting (but not most prevalent) events. The
BROMP observers were trained and tested on the protocol and achieved sufficient
agreement (Cohen’s kappa ≥ .6) with a certified BROMP observer before coding the
data. The same observers coded each day.
The coding process was implemented using the HART application for Android
devices [Ocumpaugh, Baker, Rodrigo, et al. 2015], which enforces the protocol while
facilitating data collection. Observations recorded in HART were synchronized with
the videos recorded on the individual computers using Internet time servers.
We should note that that there are many possible affect annotation schemes, each
with their strengths and weaknesses, as reviewed in [Porayska-Pomsta et al. 2013].
BROMP was selected because it has been shown to achieve adequate reliability for
annotating the affective states of a large number of students (among over 150 coders
in over a dozen studies with a variety of learning environments have been certified
[Ocumpaugh, Baker and Rodrigo 2015]). Further, BROMP captures affective states
occurring in the ―heat of the moment‖ while minimizing interruptions from asking
students to self-report affect.
Instances of Affect Observed 3.2
Situations arose where students could not be easily observed (e.g., bathroom breaks,
occlusions caused by hand to face gestures) or where the observer was not confident
about an observation. Affect could not be observed in 8.1% of cases while on-task/off-

Using Video to Automatically Detect Learner Affect in Computer-enabled Classrooms ??:9
ACM Transactions on xxxxxxxx, Vol. xx, No. xx, Article xx, Publication date: Month YYYY
task behavior could not be observed in 2.8% of cases. We obtained 1,767 successful
observations of affective states and 1,899 observations of on-task/off-task behavior
during the two days of data used in this study. The most common affective state was
engaged concentration (engagement for short – 77.6%), followed by frustration
(13.5%), boredom (4.3%), delight (2.3%), and confusion (2.3%). On-task behavior
occurred 74.2% of the time, on-task conversation occurred 20.9% of the time, and off-
task behavior occurred 4.9% of the time.
Model Building 3.3
Feature Engineering. We used FACET (no longer publicly available), a
commercialized version of the CERT computer vision software (Fig. 2), for facial
feature extraction. FACET provides likelihood estimates of the presence of 19 AUs (1,
2, 4, 5, 6 ,7, 9, 10, 12, 14, 15, 17, 18, 20, 23, 24, 25, 26, and 28 [Ekman and Friesen
1978]) as well as head pose (orientation), face size, gender, and eyewear. It also
provides measures of unilateral (one side of the face only) AUs for three action units,
as well as ―Fear Brow‖ and ―Distress Brow,‖ which indicate the presence of
combinations of AU1 (Inner Brow Raiser), AU2 (Outer Brow Raiser), and AU4 (Brow
Lowerer). Data from FACET were temporally aligned with affect observations in
small windows of time. Features were created by aggregating FACET estimates in a
window of time leading up to each BROMP observation using maximum, median, and
standard deviation. We tested five different window sizes (3, 6, 9, 12, and 20 seconds).
For example, we computed three features pertaining to AU4 (brow lower) by taking
the maximum, median, and standard deviation of the frame-level AU4 likelihoods
within the six seconds leading up to an affect observation. In all there were 78 facial
features (3 aggregation functions × [19 AUs + 3 head pose orientation axes + 2 face
position coordinates + gender + eyewear]).
Fig. 2. CERT interface demonstrating AU estimations from a face video. AUs were used as features. Video
was not from the current study due to privacy concerns.

??:10 N. Bosch et al.
ACM Transactions on xxxxxxxx, Vol. xx, No. x, Article x, Publication date: Month YYYY
About a third (34%) of the instances were discarded because FACET was not able to
register the face and thus could not estimate the presence of AUs. We removed
instances with less than 1 second (12.5 frames) of valid AU data. Poor lighting,
extreme head pose or position, occlusions from hand-to-face gestures, and rapid
movements were all causes of face registration errors. These issues were common due
to the engaging nature of the game and the active behaviors of the young students.
We also computed gross body movement present in the videos using a motion
estimation algorithm [Westlund et al. 2015]. Body movement was calculated by
measuring the proportion of pixels in each video frame that differed by a threshold
from a continuously updated estimate of the background image generated from the
four previous frames (illustration in Fig. 3). We computed three body movement
features using the maximum, median, and standard deviation of the gross body
movement within the window of time leading up to an observation, similar to the
method used to compute FACET features.
Fig. 3. Silhouette visualization of motion (used as a feature) detected in a video. Video was not from the
current study due to privacy concerns.
We used tolerance analysis to eliminate features with high multicollinearity
(variance inflation factor > 5) [Allison 1999]. This was followed by RELIEF-F
[Kononenko 1994] feature selection on the training data to rank features. We
retained a proportion of the highest ranked features for use in the models
(proportions of .1, .2, .3, .4, .5, and .75 were tested). Feature selection was performed
using nested cross-validation on training data only. In particular, we ran 10
iterations of feature selection on the training data, using data from a randomly
chosen 67% of students within the training set in each iteration.

Using Video to Automatically Detect Learner Affect in Computer-enabled Classrooms ??:11
ACM Transactions on xxxxxxxx, Vol. xx, No. xx, Article xx, Publication date: Month YYYY
Supervised Learning. We built separate detectors for each affective state in
order to afford parameter optimization per state (e.g., window size, features used).
This was done with a one-versus-other approach, where each affective state was
discriminated from all others. For example, engagement was discriminated from
frustration, boredom, delight, and confusion instances combined (collectively referred
to as ―other‖). Behaviors were grouped into off task and on task (including on-task
conversation).
There were large class imbalances in the distributions (e.g., .04 vs. .96 base rates
in the boredom vs. other classification). We used two different sampling techniques
(on training data only) to compensate for class imbalance. These included
downsampling (removal of random instances from the majority class) and synthetic
oversampling (with SMOTE [Chawla et al. 2011]). SMOTE creates synthetic training
data by interpolating feature values between an instance and randomly chosen
nearest neighbors. The distributions were not changed in the testing data.
Aside from the basic procedure discussed above, other details were specific to each
classification task (baseline, temporal generalization, demographic generalization) as
discussed in the subsequent sections.
BASELINE CLASSIFICATION OF AFFECT 4.
We built supervised classification models to discriminate between five affective states
and off task vs. on task behavior. We used 14 different classifiers, including Bayesian
classifiers, logistic regression, classification via clustering (with k-means), C4.5 trees,
etc., using standard implementations from the Waikato Environment for Knowledge
Analysis (WEKA) machine learning tool [Holmes et al. 1994].
Cross-Validation for Baseline Classification 4.1
The detectors were cross-validated at the student level. Data from 67% of randomly-
chosen students were used to train each classifier, while data from the remaining
students were used to test accuracy. This method emphasizes generalization to new
students since training and testing data are student-independent. Cross-validation
was repeated 150 times for each model and the results were averaged across
iterations.
Results 4.2
The best results for affect and off-task detection are presented in Table I.
Table I. Details and results for baseline classification with all data.
Classification AUC Accuracy Classifier No.
Instances
No.
Features
Window
Size (secs)
Boredom .610 64% Classification
Via Clustering
(k-means)
1305 20 12
Confusion .649 74% Bayes Net 1305 15 12
Delight .867 83% Updateable
Naïve Bayes
1003 24 3
Engagement .679 64% Bayes Net 1228 51 9
Frustration .631 62% Bayes Net 1132 51 6
Off Task .816 81% Logistic
Regression
1381 15 12

??:12 N. Bosch et al.
ACM Transactions on xxxxxxxx, Vol. xx, No. x, Article x, Publication date: Month YYYY
Note. No. Instances refers to the total number of positive and negative examples that were used to train
the detector. This number varied because the window size differed between detectors. Shorter windows
contain fewer video frames and are thus less likely to contain at least one second of valid data. Windows
with less than one second of valid data were not used.
Accuracy (percentage correctly classified; i.e. recognition rate) varied widely.
However, recognition rate is unsuitable when class distributions are skewed as in
these data. For example, delight occurred 2.3% of the time, which means a one-
versus-other detector that simply guesses ―Other‖ for every instance would have a
97.7% recognition rate. Metrics such as Cohen’s Kappa are also unstable when class
distributions are highly skewed [Jeni et al. 2013]. AUC is the recommended metric
for skewed data and is used here as the primary measure of classification accuracy.
AUCs, shown in Table I, were above chance (AUC = .5) for each affective state and
for off-task behavior. Parameters of the classifiers represented in the best results
were not varied, thus no classifier parameters were reported.
Of particular note is the fact that classification was successful despite large class
imbalances. The confusion matrices shown in Table II reflect the fact that classifiers
detected even the infrequent affective states. In particular, boredom, confusion,
delight, and off-task behavior have base rates of less than 5%.
Table II. Confusion matrices for individual affect classifications in the baseline results.
Actual Classified Base Rate
Boredom All Other
Boredom .581 (hit) .419 (miss) .041
All Other .361 (false alarm) .639 (correct rejection) .959
Confusion All Other
Confusion .415 (hit) .585 (miss) .027
All Other .251 (false alarm) .749 (correct rejection) .973
Delight All Other
Delight .693 (hit) .307 (miss) .029
All Other .166 (false alarm) .834 (correct rejection) .971
Engagement All Other
Engagement .655 (hit) .345 (miss) .747
All Other .391 (false alarm) .609 (correct rejection) .253
Frustration All Other
Frustration .588 (hit) .412 (miss) .143
All Other .374 (false alarm) .626 (correct rejection) .857
Off Task All Other
Off Task .645 (hit) .355 (miss) .046
All Other .180 (false alarm) .820 (correct rejection) .954
Note. Base rates in these confusion matrices do not perfectly match the original base rates because
instances were removed due to face detection failures (e.g., delight is 2.9% in the test set rather than 2.9%
in the original observations).

Using Video to Automatically Detect Learner Affect in Computer-enabled Classrooms ??:13
ACM Transactions on xxxxxxxx, Vol. xx, No. xx, Article xx, Publication date: Month YYYY
Fig. 4 illustrates the overall effect of using SMOTE compared to using no balancing
technique. We note that the mean hit (true positive) rate improves noticeably for
detectors built with SMOTE, though with a slightly lower correct rejection rate. This
is because the one-versus-other detectors trained without SMOTE are biased toward
recognizing the majority class (i.e. ―other‖ for all detectors except engagement). On
the other hand, detectors built with SMOTE have equal numbers of both classes in
the training data, so they are better trained to recognize the affective state of interest.
Fig. 4. Comparison of mean hit rates and correct rejection rates for the best baseline detectors built with
and without using SMOTE, illustrating the increase in hit rate from using SMOTE.
We also investigated the relationship between window size and classification
accuracy (see Fig. 5). Window size did not have much of an effect for boredom,
engagement, and frustration (dotted lines), but it was relevant for confusion, delight,
and off task behavior (solid lines). The accuracy decrease for larger windows sizes for
delight vs. confusion may be due to the fact that delight expressions may last just a
few seconds while confusion typically lasts longer [D’Mello and Graesser 2011]. The
results also confirm that varying the window size for different affective states was an
important consideration in many cases. 2
2 We also built models with a 20 second window. However, classification accuracy for those
models was no better than the results reported here so they were not further analyzed.
0.000
0.250
0.500
0.750
SMOTE No SMOTE SMOTE No SMOTE
Hit Correct Rejection

??:14 N. Bosch et al.
ACM Transactions on xxxxxxxx, Vol. xx, No. x, Article x, Publication date: Month YYYY
Fig. 5. Detection results across window sizes in the baseline results.
Feature Analysis 4.3
We report the ten most frequently selected features in each baseline model (Table III).
Cohen’s d, computed as (mean within class – mean ―other‖ class] / pooled standard
deviation) provides an estimate of the effect size of that feature’s discriminability. We
discuss features with at least small (d = .2) effect sizes [Cohen 1988].
Boredom. Boredom was manifested by increases in body motion and AU17 (chin
raise) and changes in apparent face size (i.e. distance from the screen) and yaw (side-
to-side head motion). This suggests that students were likely moving away from the
screen and looking side-to-side at other students’ computers when bored.
Confusion. Confusion was characterized by variation in yaw and several AUs.
AU1 (inner brow raise), AU2 (outer brow raise), AU14 (dimple), AU17 (chin raise),
and AU18 (lip pucker) all varied more during expressions of confusion. Raised
eyebrows in particular may indicate students’ surprise at an unexpected event
associated with confusion.
Delight. Effect sizes were large (d >= .8) for each of the 10 highest-ranked delight
features. Magnitude and variation in motion predicted delight, as did pitch changes
(head motion nodding up and down). Variation in AU6 (cheek raise), AU10 (upper lip
raise), AU12 (lip corner pull), AU15 (lip corner depress), AU17 (chin raise), AU18 (lip
pucker), and AU23 (lip tighten) were also associated with delight. These features
might reflect students’ excited movement and smiles as they experienced delight.
Engagement. The largest effect size was d = .159 (AU18, lip pucker). Students
were engaged during most of the session (77.6%), so it is not a surprise that their
facial expressions were fairly neutral for the majority of the time.
Frustration. Frustration was manifested by changes in motion, more presence of
AU25 (lips part), and increased variation in AU1 (inner brow raise) and AU10 (upper
lip raise). AU10 and AU25 together indicate bared teeth, perhaps related to a
frustrated smile [McDaniel et al. 2007; Hoque et al. 2012].
Off-task behavior. Motion and variations in yaw and pitch were largely different
(d >= .8) from on-task behavior. Variation in face size was also predictive of off-task
0.5
0.6
0.7
0.8
0.9
3 6 9 12
Window Size (Seconds)
Boredom
Frustration
Engagement
Confusion
Off Task
Delight
AUC

Using Video to Automatically Detect Learner Affect in Computer-enabled Classrooms ??:15
ACM Transactions on xxxxxxxx, Vol. xx, No. xx, Article xx, Publication date: Month YYYY
behavior, as were AU1 (inner brow raise), AU14 (dimple), AU20 (lip stretch), and
AU28 (lip suck). The features might suggest that students were looking away from
their own screens and moving their mouths (perhaps talking).
Table III. Cohen’s d effect sizes for the inter-class difference of the 10 most frequently selected features’ values
in each baseline model.
Model Cohen's d
Model Cohen's d
Boredom
Engagement
SD of yaw 0.402
Median AU18 (lip pucker) 0.159
Median motion 0.319
Median pitch 0.091
SD of face size 0.276
Median AU2 (outer brow raise) -0.072
SD of motion 0.273
Median roll 0.061
Median AU17 (chin raise) 0.253
Median AU25 (lips part) -0.052
SD of AU20 (lip stretch) 0.199
Median AU1 (inner brow raise) -0.044
SD of estimated gender 0.170
Median yaw 0.036
Median AU1 (inner brow raise) 0.098
Median AU15 (lip corner depress) -0.005
SD of AU14 (dimple) 0.056
Median AU9 (nose wrinkle) -0.012
Median AU2 (outer brow raise) 0.045
Median AU10 (upper lip raise) -0.016
Confusion
Frustration
SD of yaw 0.402
SD of AU10 (upper lip raise) 0.417
SD of AU18 (lip pucker) 0.363
SD of motion 0.346
SD of AU1 (inner brow raise) 0.323
SD of AU1 (inner brow raise) 0.279
SD of AU17 (chin raise) 0.299
Median AU25 (lips part) 0.250
SD of AU2 (outer brow raise) 0.258
Median AU14 (dimple) -0.158
SD of AU14 (dimple) 0.222
Median AU15 (lip corner depress) 0.080
Median AU1 (inner brow raise) 0.190
Median AU10 (upper lip raise) -0.071
SD of face size 0.180
Median AU17 (chin raise) 0.050
Median AU2 (outer brow raise) 0.165
Median AU1 (inner brow raise) 0.049
SD of pitch 0.137
Median AU2 (outer brow raise) 0.012
Delight
Off-task
SD of AU6 (cheek raise) 2.125
Median motion 1.241
Median motion 1.855
SD of yaw 1.112
SD of AU18 (lip pucker) 1.474
SD of pitch 0.830
SD of motion 1.364
SD of AU20 (lip stretch) 0.640
SD of pitch 1.355
SD of AU28 (lip suck) 0.616
SD of AU12 (lip corner pull) 1.336
SD of AU14 (dimple) 0.567
SD of AU23 (lip tighten) 1.065
SD of AU1 (inner brow raise) 0.471
SD of AU15 (lip corner depress) 1.044
SD of face size 0.433
SD of AU17 (chin raise) 0.981
Median yaw 0.195
SD of AU10 (upper lip raise) 0.929
Median AU1 (inner brow raise) -0.027

??:16 N. Bosch et al.
ACM Transactions on xxxxxxxx, Vol. xx, No. x, Article x, Publication date: Month YYYY
TEMPORAL GENERALIZATION 5.
We have demonstrated the feasibility of video-based affect detection in a noisy
classroom environment with an emphasis on generalization to new students. In this
section, we study temporal generalization in terms of different days and different
class periods within a day. The procedure was similar to the baseline procedure
discussed above with the following exceptions. First, we only used classifiers that
were effective in the baseline results. These included Bayes Net, Updateable Naïve
Bayes, Logistic Regression, AdaBoost, Classification via Clustering, and LogitBoost.
Second, we adopted a different cross-validation approach as detailed below.
Cross-day Generalization 5.1
We tested generalization across days with a nested cross-validation approach. First,
data from one day were chosen as training data. Then, 67% of students were
randomly selected from that day and their data were used to train a detector. This
detector was tested using data from the remaining 33% of students on the opposite
day (cross-day generalization: e.g., train on Day 1, test Day 2) or within the same day
(within-day generalization: e.g., train on Day 1, test on Day 1). Student-level
independence was also ensured as testing data always contained a different set of
students from training data as illustrated in Fig. 6. The cross-validation process was
repeated 150 times for each detector (train-test: Day 1-Day 1; Day 1-Day 2; Day 2-
Day 1; Day 2-Day 2) and the results were averaged across iterations. The within-day
results were averaged across both within-day detectors (e.g., train on Day 1, test on
Day 1; train on Day 2, test on Day 2). Likewise, the cross-day results were obtained
by averaging both cross-day detectors (train Day 1, test Day 2; train Day 2, test Day
1).
Fig. 6. Example of within-day and cross-day testing with student-level independence.
We compared cross-day classification accuracy to the baseline and within-day
accuracies (Fig. 7). The key result was that cross-day affect detection accuracies
(average AUC = .627) were similar (within 2%) to within-day accuracies (average
AUC = .640). The largest drop occurred for confusion, but it was still small (AUC
= .665 to .639; 2.61% of the range of AUC). Similarly, off-task behavior detection was
not negatively impacted by cross-day testing compared to within-day testing.
Compared to the baseline, within-day affect detectors had nearly identical
accuracy, while cross-day detectors had 1.51% lower accuracy. The decreased
accuracy of cross-day detectors compared to the baseline may be attributable to the
fact that the baseline detectors had the advantage of twice as much training data.
The decreased accuracy of cross-day detectors compared to the within-day detectors
S1
S2
S3
S4
S5
S6
S1
S2
S3
S4
S5
S6
Day 1 data Day 2 data
Train
Cross-daytest
Within-daytest

Using Video to Automatically Detect Learner Affect in Computer-enabled Classrooms ??:17
ACM Transactions on xxxxxxxx, Vol. xx, No. xx, Article xx, Publication date: Month YYYY
is likely due to differences in the data between days, which within-day detectors may
overfit to.
Fig. 7. Cross-day affect and off-task detection accuracy compared to baseline and within-day accuracies.
Class Period Generalization 5.2
We tested generalization across class periods, potentially reflecting difference in time
of day/light levels, with a leave-several-out approach. Five out of the seven class
periods (67%) were randomly chosen as training data while data from the remaining
two periods served as testing data. This process was repeated for 150 iterations.
Student-level independence was guaranteed as each student was in one and the same
class period every day. Testing across class periods also implicitly tests
generalization across time of day, since class periods took place at unique times.
The results are shown in Fig. 8. Cross-period affective state detection accuracy
was on average 1.89% lower than baseline accuracy. Confusion and boredom were
most negatively affected while delight, engagement, and frustration were more stable.
There was also a small drop in the accuracy of the cross-period off-task behavior
detector compared to the baseline detector. Overall, accuracy across class periods was
still well above chance-level, suggesting that our affect detection approach
generalized across different times of the day.
0.5
0.6
0.7
0.8
0.9
Boredom Confusion Engagement Frustration Mean Affect Off Task
Baseline AUC Within-day AUC Cross-day AUC

??:18 N. Bosch et al.
ACM Transactions on xxxxxxxx, Vol. xx, No. x, Article x, Publication date: Month YYYY
Fig. 8. Comparison of baseline accuracy to accuracy while generalizing across class periods (time of day).
DEMOGRAPHIC GENERALIZATION 6.
In the previous section, we presented methods for testing detector generalization
across time. In this section we consider generalization across two key demographic
factors: perceived ethnicity (as coded by researchers) and gender.
Perceived Ethnicity Generalization 6.1
We did not collect self-reports of ethnicity. Hence, two researchers annotated student
ethnicity (called perceived ethnicity) from the videos. Disagreements were
adjudicated with assistance from a third researcher. Fifty-seven percent of the
students were coded as Caucasians. Although the difference between other ethnic
groups and races is also important to affect detection, no other specific group was
sufficiently frequent in the data set to afford reliable data analysis. Therefore, we
combined all students with other perceived ethnicities into a non-Caucasian group in
order to create roughly balanced data sets.
We performed within- and cross- perceived ethnicity validation experiments.
Within perceived ethnicity testing was performed by training the detectors with data
from 67% of students in one group and testing it on the remaining 33% of students
within that same group (e.g., train on Caucasian students, test on Caucasian
students). For between perceived ethnicity testing, it would have been possible to use
100% of the data from each group (i.e. train on all Caucasian, test on all non-
Caucasian) without violating the student-level independence constraint because no
student was annotated as both Caucasian and non-Caucasian. . However, that would
not have allowed a fair comparison to within-perceived-ethnicity testing since the
sizes of the data sets would be different. Hence, cross-perceived ethnicity testing was
performed by training a detector with data from 67% of students in one group and
testing it on 33% of students from the other group (e.g., train on 67% Caucasian
students, test on 33% non-Caucasian students). Cross-validation was repeated for
150 iterations and we used the same classifiers as in the temporal generalization
experiments.
0.5
0.6
0.7
0.8
0.9
Boredom Confusion Delight Engagement Frustration Mean Affect Off-task
Baseline AUC Cross-period AUC

Using Video to Automatically Detect Learner Affect in Computer-enabled Classrooms ??:19
ACM Transactions on xxxxxxxx, Vol. xx, No. xx, Article xx, Publication date: Month YYYY
Since 57% of the students were coded as Caucasians, we randomly downsampled
the Caucasian training data so as to equate the number of instances with the non-
Caucasian data. We also recreated the baseline detectors (Section 4) using the
downsampled datasets to achieve a fair comparison.
Classification accuracies were averaged across pairs (train on Caucasian → test
on non-Caucasian and vice versa). Within-perceived ethnicity affect detectors were on
average 1.9% more accurate than baseline detectors (see Fig. 9), which was expected
as there was less variability when training and testing on the same perceived
ethnicity. Off-task behavior detection accuracy was not notably different between
groups.
Fig. 9. Comparison of baseline results to generalization across perceived ethnicity.
The more interesting comparison pertains to between- vs. within- perceived ethnicity
tests. Overall accuracy for cross-perceived ethnicity detectors was consistently above
chance (average AUC = .722), demonstrating the feasibility of generalization. We
observed decreases in cross-perceived ethnicity detector accuracy for engagement and
frustration, but this was not surprising as these detectors are exposed to different
visual characteristics when tested on a new perceived ethnicity. However, there were
some unexpected increases in accuracy, most notably in the confusion and delight
detectors but also in boredom (details in Appendix, Table VIII). In particular, the
confusion detector exhibited a surprising 9.3% improvement (AUC of .673 to .766) in
the Caucasian train → non-Caucasian test analysis compared to the Caucasian train
→ Caucasian test analysis. Similarly, the delight detector showed an 8.7%
improvement (AUC of .840 to .927) in non-Caucasian → Caucasian testing compared
to non-Caucasian → non-Caucasian testing.
We examined base rates of affect within each perceived ethnicity to determine if
they may explain these unexpected results (see Table IV). We note a general pattern
where training on the group with a higher base rate and testing on the group with
the smaller base rate yields a higher accuracy. For example, the Caucasian and non-
Caucasian training sets had a 2.8% and 1.5% base rates of confusion, respectively.
.5
.6
.7
.8
.9
Boredom Confusion Delight Engagement Frustration Mean Affect Off-task
Baseline AUC Within Perceived Ethnicity AUC Between Perceived Ethnicity AUC

??:20 N. Bosch et al.
ACM Transactions on xxxxxxxx, Vol. xx, No. x, Article x, Publication date: Month YYYY
Training for confusion on Caucasian (higher base rate) and testing on non-Caucasian
(lower base rate) resulted in a higher AUC of .766 compared to training and testing
on Caucasian (AUC of .673). Similarly, the base rate of delight was higher in the non-
Caucasian data set (3.3%) compared to the Caucasian data set (.016). Accordingly,
training for delight on non-Caucasian (higher base rate) and testing on Caucasian
(lower base rate) resulted in a higher (AUC of .927) accuracy than training and
testing on non-Caucasian (AUC of .840).
Therefore, it appeared that base rate differences rather than appearance features
best explain the results. Importantly, despite this base rate issue, the results provide
strong evidence for generalization across perceived ethnicities.
Table IV. Proportions of affective states and off-task behavior within each perceived ethnicity.
Affective State
Perceived
Caucasian
Perceived
Non-Caucasian Difference
Boredom .038 .049 29%
Confusion .028 .015 84%
Delight .016 .033 102%
Engagement .792 .755 5%
Frustration .126 .147 17%
Off Task .046 .054 18%
Note. Difference refers to the size of the larger proportion relative to the smaller one.
(i.e. 100 × [larger / smaller – 1]).
Cross-Gender Generalization 6.2
Cross-gender generalization testing was similar to cross-perceived ethnicity testing.
However, gender was reported by students so there was no need for post-hoc
annotation. The sample comprised 58% females, so the female data were randomly
downsampled so as to obtain an equal distribution of males and females. Baseline
results were also recreated based on the downsampled data set.
Error! Reference source not found.Fig. 10 illustrates the main results with
additional details reported in the Appendix (Table IX). Most importantly, overall
cross-gender affect detection accuracy was consistently above chance (average AUC
= .730), demonstrating the feasibility of cross-gender generalization. Moreover, cross-
gender affect accuracy was similar to overall within-gender accuracy (AUC = .724).
Cross-gender affect accuracy also appeared to be as good as or better than the
baseline with both genders pooled (average AUC = .712). The baseline proportions
shown in Table V also illustrate the same issue discussed in the perceived ethnicity
generalization results wherein training on a larger group and testing on a smaller
group resulted in higher accuracy attributable to differences in base rates rather
than gender per se.

Using Video to Automatically Detect Learner Affect in Computer-enabled Classrooms ??:21
ACM Transactions on xxxxxxxx, Vol. xx, No. xx, Article xx, Publication date: Month YYYY
Fig. 10. Comparison of detector accuracies for within-gender versus cross-gender classification.
Table V. Proportions of affective states and off-task behavior within each gender.
Affective State Female Male Difference
Boredom .053 .028 86%
Confusion .030 .011 165%
Delight .019 .030 58%
Engagement .724 .857 18%
Frustration .175 .074 137%
Off Task .063 .028 125%
Note. Difference refers to the size of the larger proportion relative to the smaller one
(i.e. 100 × [larger / smaller – 1]).
GENERAL DISCUSSION 7.
Affect detection is a crucial component for interfaces that aspire to dynamically
respond to affect. The inexpensive, ubiquitous nature of webcams makes facial
expressions an attractive modality for affect detection. We were interested in the
feasibility of utilizing face-based affect detection methods in noisy computer-enabled
classrooms. In this environment, students were subject to distractions, uncontrolled
lighting, and other factors which complicated affect detection. Additionally, we were
interested in the detectors’ ability to generalize across time and student
demographics – both underexplored aspects of affect detection. In this section, we
discuss our main findings with respect to detection accuracy and generalization, as
well as the implications of these findings, their limitations, and future directions.
.5
.6
.7
.8
.9
Boredom Confusion Delight Engagement Frustration Mean Affect Off-task
Baseline AUC Within-gender AUC Cross-gender AUC

??:22 N. Bosch et al.
ACM Transactions on xxxxxxxx, Vol. xx, No. x, Article x, Publication date: Month YYYY
Main Findings 7.1
Our first contribution was to develop face-based detectors of learning-centered
affective states in a noisy school environment. We demonstrated the feasibility of
automatic detection of boredom, confusion, delight, engagement, frustration, and off-
task behavior as students used an educational game. There were many sources of
noise. With respect to class distractions, students fidgeted, talked with one another,
asked questions, left the classroom, and occasionally even used their cellphones
(against classroom policy). On some occasions multiple students crowded around the
same screen to view something that another student had done. Additionally, lighting
conditions were inconsistent across students, in part due to placement of computers.
We were able to create detectors without excluding any of these difficult but realistic
situations, except where faces could not be automatically detected in the video. In
fact, despite using modern computer vision techniques, we were unable to register
the face in 34% of the instances. This goes to illustrate the challenge of detecting
affect in the wild.
We also experimented with various classification methods and parameters.
Creating one universal detector for all affective states is attractive for the sake of
simplicity. However, we found that ideal methods and parameters varied as a
function of affective state. For example, the confusion and off-task detectors were
more accurate with larger window sizes, while the delight detector worked better on
smaller windows. Frequently selected features also differed between models. The
optimal classifiers and feature selection parameters also varied across affective
states. This suggests that accuracy can be improved by tailoring the parameters used
to distill data sets to specific affective states.
Imbalanced (or skewed) affective state distributions are another challenge for the
detectors. This was a major concern with the present data, as three of the affective
states were observed at rates less than 5%, while the most frequent occurred at a
rate nearing 80%. To overcome this, we synthetically oversampled the training data
to create detectors that predicted the less common states well. This is particularly
important for applications of the detectors in affect-sensitive educational interfaces
(see below). Detectors must be able to recognize relatively infrequent affective states
that are important to learning (e.g., confusion) [D’Mello 2013], because infrequent
does not mean inconsequential. Indeed, one or two episodes of intense frustration can
disrupt an entire learning experience.
Generalization is another important but often overlooked aspect of real-world
affect detection. After showing that our baseline models generalized to new students,
we studied generalization across time and demographics. Temporal generalizability
is a key feature of affect detectors that are intended for real-world use as they will
inevitably encounter data that is temporally distant from training data. We expected
detector accuracy to be diminished by training on one day and testing on another due
to confounds such as changes in lighting, mood, and other factors (e.g., novelty
effects). However, we found that average cross-day classification accuracy was
reduced by less than 2% compared to combined-days baseline detectors and within-
day detectors. We had similar expectations for generalization across class periods,
where additional factors such as time of day might diminish affect detection accuracy.
However, cross-period detection was also successful with less than 2% average
reduction in accuracy compared to baseline. Therefore, we have some evidence that
our affect detectors demonstrated adequate temporal generalization.

Using Video to Automatically Detect Learner Affect in Computer-enabled Classrooms ??:23
ACM Transactions on xxxxxxxx, Vol. xx, No. xx, Article xx, Publication date: Month YYYY
We also investigated, for the first time, generalization of face-based affect
detection across demographic variables – specifically perceived ethnicity (Caucasian
or non-Caucasian) and gender. We expected that detectors trained and tested on the
same perceived ethnicity or gender would yield improved performance over the
combined ethnicity and gender detectors, respectively. We found this to be the case,
as there were average improvements of 1.9% and 1.1% (compared to baseline AUC)
for perceived-ethnicity- and gender- specific detectors, respectively. We anticipated a
reduction in accuracy when within-group detectors were applied to the
complementary group (e.g., train on Caucasian, test → non-Caucasian) because
detectors are likely calibrated to the specific training group. In fact, we found that
accuracy actually improved slightly in some cases (average improvement of 1.6% for
cross-perceived-ethnicity and 0.7% for cross-gender). Follow-up analyses indicated
that the differences in class base rates were likely responsible for this unexpected
effect. Specifically, accuracy was higher when the training data had more instances
of the target class label than the testing set. Despite these somewhat unexpected
findings, the core research question of whether the detectors could generalize across
demographic factors of perceived ethnicity and gender was answered in the
affirmative.
Implications 7.2
The primary implication of our findings is that our affect detectors can be effective in
a noisy computer-enabled classroom context. Previous affect-detection work in
computer-enabled classrooms has been limited, so these results establish some
expectations of moderate accuracy for future work. Additionally, previous work had
not explicitly tested generalization of face-based affect detectors across time and
demographics, which our results showed was indeed possible.
A limitation of face-based detectors is that they can only be used when the face
can be automatically detected in the video. This is not always the case outside of the
lab, where there is little control over movement, occlusions, poor lighting, and other
complicating factors. In fact, the face could only be detected in about 65% of the
instances in this study. To address this, we [Bosch, Chen, Baker, Shute and D’Mello
2015] developed additional detectors based on features extracted from the ongoing
interaction context (and stored in log files), such as the difficulty of the current game
level attempted, the student’s actions, the feedback received, response times, and so
on. The interaction-based detectors (mean AUC of .569) were less accurate than the
face-based detectors (mean AUC of .668), but could be applied in almost all of the
cases. Logistic regression models were trained to adjudicate between the outputs of
the video- and interaction- based detectors. The resultant multimodal model was
almost as accurate as the face-based detector (mean AUC of .637 for multimodal
versus .668 for face-based), but was highly applicable (98% for multimodal vs. 65%
for face-based). These results are notable because they suggest the feasibility of
multimodal affect detection in noisy real-world environments.
The next step is to use the detectors in an affect-sensitive version of Physics
Playground with intelligent strategies that respond to student affect. Confusion and
frustration offer opportunities to intervene in the form of hints or revisiting
introductory material related to the current game level. If the student was recently
frustrated and unable to solve a level, the game might suggest an easier level.
Conversely, a more difficult level might be appropriate if the student has become
bored because challenge is too low.

??:24 N. Bosch et al.
ACM Transactions on xxxxxxxx, Vol. xx, No. x, Article x, Publication date: Month YYYY
Much work remains to be done in determining what interventions should be used
in this context and how frequently they should be applied. Special considerations
must also be given to the probability of spurious detection (false alarms) when
designing these strategies, since incorrect interventions could cause confusion or
annoyance. Although the results presented here are modest and there is clearly
considerable room for improvement, it should be noted that affect detection is
inherently an imperfect science due to numerous challenges discussed in previous
reviews [Calvo and D’Mello 2010; D’Mello and Kory 2015; Zeng et al. 2009]. Detection
accuracy is unlikely to ever be perfect, hence, the challenge is to develop
interventions that take into account ambiguity in affect detection (via probabilistic
approaches). Furthermore, interventions must be fail-soft so that learning is not
negatively impacted if delivered incorrectly. For example, subtle strategies, such as
re-ordering levels to display an easier level after a frustrating experience, may be
preferred over more explicit ones – e.g., directly commenting that the student is
frustrated.
Limitations and Future Work 7.3
Like most research, this study has a number of limitations as discussed below.
First, the number of positive training instances was limited for some affective
states, due (in part) to the difficulty of collecting data in the wild. This limitation was
partially overcome by using SMOTE to create synthetic training data, but
oversampling is not a perfect substitute for the diversity of genuine data.
Second, the distribution of affective states depends on the interface used. The
interface in this study was game-based, which may have increased engagement and
decreased other affective states compared to some other types of interfaces, though
perhaps not intelligent tutoring systems (cf. [D’Mello 2013]). Initial work in this
direction was done by [D’Mello 2013] in his meta-analysis of affect incidence across
24 studies involving learning with technology. However, this work can be expanded
to include a larger set of educational interfaces in order to ascertain if different
affective profiles emerge as a function of the nature of the interaction (e.g., one
profile for reading text, another for interacting with an intelligent tutoring system, a
third for an educational game).
Third, the affect annotation protocol we used requires observers to be in the
classroom, which could influence students’ displays of affect akin to a Hawthorne
effect [Cook 1962]. A different distribution would be possible if students self-reported
their affective states [D’Mello in press]. This issue needs to be studied by comparing
different affect annotation methods similar to [Graesser et al. 2006] and to consider a
combination of annotation methods as discussed in [D’Mello et al. 2008].
Fourth, lighting conditions and students themselves varied somewhat between
days. However, additional sources of variation, such as from different learning
environments and multiple schools, might make classification even more difficult and
produce new insights on generalization to new contexts. Additionally, the amount of
time represented in this study (two different days) was sufficient for an initial
analysis of cross-day generalization, but not for larger temporal differences, such as
cross-seasonal generalization (i.e. train detectors in fall → test in spring).
Longitudinal data collection across multiple school years and across different grade
levels will be needed to resolve questions of generalization across longer periods of
time and across age groups. This will also provide more accurate estimates of how
Using Video to Automatically Detect Learner Affect in Computer-enabled Classrooms ??:25
ACM Transactions on xxxxxxxx, Vol. xx, No. xx, Article xx, Publication date: Month YYYY
usable models are under varying lighting conditions and other sources of noise in
different classrooms.
Finally, true cross-ethnicity testing would require measuring ethnicity from
student self-reports or from administrative data, rather than the post hoc perceived
ethnicity labels used in this study. The number of students per perceived ethnicity
did not afford fine-grained testing across perceived ethnicities either, which could
have yielded additional insight into differences between, for example, Asian and
Latino students. Additionally, generalization across culture and age were not tested
in this study, but may be possible challenges for face-based affect detection (see
Grafsgaard et al. [2015] for recent work comparing facial expressions across age) and
should be more thoroughly explored with expanded and diverse data collection.
Concluding Remarks 7.4
Our long term vision is for next-generation learning environments to improve the
process and products of learning by considering affect in addition to cognition. We
hope that the present research that detects students’ affect in a noisy real-world
environment and with evidence of multiple levels of generalizability takes us towards
this goal. The next critical step is to use the detectors to trigger affect-sensitive
interventions in order to provide a more enjoyable, efficient, and effective learning
experience for all students.
ACKNOWLEDGMENTS
This research was supported by the National Science Foundation (NSF) (DRL 1235958 and IIS 1523091)
and the Bill & Melinda Gates Foundation. Any opinions, findings and conclusions, or recommendations
expressed in this paper are those of the authors and do not necessarily reflect the views of the NSF or the
Bill & Melinda Gates Foundation.
REFERENCES
Paul D. Allison. 1999. Multiple regression: A primer, Pine Forge Press.
Omar AlZoubi, Davide Fossati, Sidney D’Mello, and Rafael A. Calvo. 2015. Affect
detection from non-stationary physiological data using ensemble classifiers.
Evolving Systems 6, 2 (2015), 79–92.
Omar AlZoubi, M.S. Hussain, Sidney D’Mello, and Rafael A. Calvo. 2011. Affective
modeling from multichannel physiology: analysis of day differences. In
Proceedings of the 4th International Conference on Affective Computing an
Intelligent Interaction (ACII 2011). Berlin Heidelberg: Springer-Verlag.
Ivon Arroyo, David G. Cooper, Winslow Burleson, Beverly Park Woolf, Kasia
Muldner, and Robert Christopherson. 2009. Emotion sensors go to school. In
V. Dimitrova, R. Mizoguchi, B. Du Boulay, & Art Graesser, eds. Proceedings
of the 14th International Conference on Artificial Intelligence in Education.
IOS Press, 17–24.
Ryan Baker et al. 2012. Towards sensor-free affect detection in cognitive tutor
algebra. In Proceedings of the 5th International Conference on Educational
Data Mining. 126–133.
Nigel Bosch, Sidney D’Mello, Ryan Baker, Jaclyn Ocumpaugh, Valerie J. Shute, et al.
2015. Automatic detection of learning-centered affective states in the wild. In
Proceedings of the 2015 International Conference on Intelligent User
Interfaces (IUI 2015). New York, NY: ACM, 379–388.
Nigel Bosch, Huili Chen, Ryan Baker, Valerie Shute, and Sidney D’Mello. 2015.
Accuracy vs. availability heuristic in multimodal affect detection in the wild.

??:26 N. Bosch et al.
ACM Transactions on xxxxxxxx, Vol. xx, No. x, Article x, Publication date: Month YYYY
In Proceedings of the 17th International Conference on Multimodal
Interaction (ICMI 2015). New York, NY: ACM, 267–274.
Nigel Bosch, Yuxuan Chen, and Sidney D’Mello. 2014. It’s written on your face:
Detecting affective states from facial expressions while learning computer
programming. In Stefan Trausan-Matu, Kristy Elizabeth Boyer, Martha
Crosby, & Kitty Panourgia, eds. Proceedings of the 12th International
Conference on Intelligent Tutoring Systems (ITS 2014). Lecture Notes in
Computer Science. Switzerland: Springer International Publishing, 39–44.
Nigel Bosch, Sidney D’Mello, Ryan Baker, Jaclyn Ocumpaugh, and Valerie J. Shute.
2015. Temporal generalizability of face-based affect detection in noisy
classroom environments. In Cristina Conati, Neil T. Heffernan, Antonija
Mitrovic, & M. Felisa Verdejo, eds. Proceedings of the 17th International
Conference on Artificial Intelligence in Education (AIED 2015). Berlin
Heidelberg: Springer-Verlag, 44–53.
Rafael A. Calvo and Sidney D’Mello. 2010. Affect detection: An interdisciplinary
review of models, methods, and their applications. IEEE Transactions on
Affective Computing 1, 1 (January 2010), 18–37.
Rafael A. Calvo, Sidney D’Mello, Jonathan Gratch, and Arvid Kappas. 2015. The
Oxford handbook of affective computing, New York, NY: Oxford University
Press.
Rafael A. Calvo and Sidney K. D’Mello. 2011. New perspectives on affect and learning
technologies., New York, NY: Springer.
Nitesh V. Chawla, Kevin W. Bowyer, Lawrence O. Hall, and W. Philip Kegelmeyer.
2011. SMOTE: synthetic minority over-sampling technique. Journal of
Artificial Intelligence Research 16 (June 2011), 321–357.
Gerald L. Clore and Jeffrey R. Huntsinger. 2007. How emotions inform judgment and
regulate thought. Trends in Cognitive Sciences 11, 9 (September 2007), 393–
399.
Jacob Cohen. 1988. Statistical power analysis for the behavioral sciences (2nd ed.),
Hillsdale, NJ: Erlbaum.
Desmond L. Cook. 1962. The Hawthorne effect in educational research. Phi Delta
Kappan (1962), 116–122.
Abhinav Dhall, Roland Goecke, Jyoti Joshi, Michael Wagner, and Tom Gedeon. 2013.
Emotion recognition in the wild challenge 2013. In Proceedings of the 15th
ACM on International Conference on Multimodal Interaction (ICMI 2013).
New York, NY, USA: ACM, 509–516.
Sidney D’Mello. 2013. A selective meta-analysis on the relative incidence of discrete
affective states during learning with technology. Journal of Educational
Psychology 105, 4 (2013), 1082–1099.
Sidney D’Mello, Nathan Blanchard, Ryan Baker, Jaclyn Ocumpaugh, and Keith
Brawner. 2014. I feel your pain: A selective review of affect-sensitive
instructional strategies. In Robert Sottilare, Art Graesser, Xiangen Hu, &
Benjamin Goldberg, eds. Design Recommendations for Intelligent Tutoring
Systems - Volume 2: Instructional Management. 35–48.
Sidney D’Mello and Rafael A. Calvo. 2013. Beyond the basic emotions: What should
affective computing compute? In CHI ’13 Extended Abstracts on Human
Factors in Computing Systems. New York, NY: ACM, 2287–2294.
Sidney D’Mello and Art Graesser. 2011. The half-life of cognitive-affective states
during complex learning. Cognition & Emotion 25, 7 (2011), 1299–1308.

Using Video to Automatically Detect Learner Affect in Computer-enabled Classrooms ??:27
ACM Transactions on xxxxxxxx, Vol. xx, No. xx, Article xx, Publication date: Month YYYY
Sidney K. D’Mello. in press. On the influence of an iterative affect annotation
approach on inter-observer and self-observer reliability. IEEE Transactions
on Affective Computing (in press).
Sidney K. D’Mello, Scotty D. Craig, Amy Witherspoon, Bethany McDaniel, and
Arthur Graesser. 2008. Automatic detection of learner’s affect from
conversational cues. User Modeling and User-Adapted Interaction 18, 1–2
(2008), 45–80.
Sidney D’Mello and Jacqueline Kory. 2015. A review and meta-analysis of
multimodal affect detection systems. ACM Computing Surveys 47, 3
(February 2015), 43:1–43:36.
Paul Ekman. 1992. An argument for basic emotions. Cognition and Emotion 6, 3–4
(May 1992), 169–200.
Paul Ekman, Wallace V. Freisen, and Sonia Ancoli. 1980. Facial signs of emotional
experience. Journal of Personality and Social Psychology 39, 6 (1980), 1125–
1134.
Paul Ekman and Wallace V. Friesen. 1978. Facial action coding system: A technique
for the measurement of facial movement, Palo Alto, CA: Consulting
Psychologists Press.
Jeffrey M. Girard, Jeffrey F. Cohn, Laszlo A. Jeni, Michael A. Sayette, and Fernando
De la Torre. 2015. Spontaneous facial expression in unscripted social
interactions can be measured automatically. Behavior Research Methods 47,
4 (December 2015), 1136–1147.
Art Graesser, Bethany McDaniel, Patrick Chipman, Amy Witherspoon, Sidney
D’Mello, and Barry Gholson. 2006. Detection of emotions during learning
with AutoTutor. In Ron Sun & Naomi Miyake, eds. Proceedings of the 28th
Annual Meetings of the Cognitive Science Society. Austin, TX: Cognitive
Science Society, 285–290.
Joseph F. Grafsgaard, Seung Y. Lee, Bradford W. Mott, Kristy Elizabeth Boyer, and
James C. Lester. 2015. Modeling self-efficacy across age groups with
automatically tracked facial expression. In Proceedings of the 17th
International Conference on Artificial Intelligence in Education (AIED 2015).
Berlin Heidelberg: Springer-Verlag, 582–585.
Joseph F. Grafsgaard, Joseph B. Wiggins, Kristy Elizabeth Boyer, Eric N. Wiebe, and
James C. Lester. 2013. Automatically recognizing facial indicators of
frustration: A learning-centric analysis. In Proceedings of the 5th
International Conference on Affective Computing and Intelligent Interaction.
159–165.
Javier Hernandez, Mohammed (Ehsan) Hoque, Will Drevo, and Rosalind W. Picard.
2012. Mood meter: Counting smiles in the wild. In Proceedings of the 2012
ACM Conference on Ubiquitous Computing. UbiComp ’12. New York, NY,
USA: ACM, 301–310.
Geoffrey Holmes, Andrew Donkin, and Ian H. Witten. 1994. WEKA: a machine
learning workbench. In Proceedings of the Second Australian and New
Zealand Conference on Intelligent Information Systems. 357–361.
Mohammed (Ehsan) Hoque, Daniel McDuff, and Rosalind W. Picard. 2012. Exploring
temporal patterns in classifying frustrated and delighted smiles. IEEE
Transactions on Affective Computing 3, 3 (2012), 323–334.
László A. Jeni, Jeffrey F. Cohn, and Fernando De la Torre. 2013. Facing imbalanced
data–Recommendations for the use of performance metrics. In Proceedings of

??:28 N. Bosch et al.
ACM Transactions on xxxxxxxx, Vol. xx, No. x, Article x, Publication date: Month YYYY
the 5th International Conference on Affective Computing and Intelligent
Interaction. 245–251.
Samira Ebrahimi Kahou et al. 2013. Combining modality specific deep neural
networks for emotion recognition in video. In Proceedings of the 15th
International Conference on Multimodal Interaction. New York, NY: ACM,
543–550.
Ashish Kapoor, Winslow Burleson, and Rosalind W. Picard. 2007. Automatic
prediction of frustration. International Journal of Human-Computer Studies
65, 8 (2007), 724–736.
Ashish Kapoor and Rosalind W. Picard. 2005. Multimodal affect recognition in
learning environments. In Proceedings of the 13th Annual ACM International
Conference on Multimedia. New York, NY, USA: ACM, 677–682.
Seong G. Kong, Jingu Heo, Besma R. Abidi, Joonki Paik, and Mongi A. Abidi. 2005.
Recent advances in visual and infrared face recognition—a review. Computer
Vision and Image Understanding 97, 1 (January 2005), 103–135.
Igor Kononenko. 1994. Estimating attributes: Analysis and extensions of RELIEF. In
Francesco Bergadano & Luc De Raedt, eds. European Conference on Machine
Learning (ECML 94). Lecture Notes in Computer Science. Berlin Heidelberg:
Springer, 171–182.
Mark R. Lepper, Maria Woolverton, Donna L. Mumme, and J. Gurtner. 1993.
Motivational techniques of expert human tutors: Lessons for the design of
computer-based tutors. Computers as Cognitive Tools 1993 (1993), 75–105.
Stan Z. Li, RuFeng Chu, ShengCai Liao, and Lun Zhang. 2007. Illumination
invariant face recognition using near-infrared images. IEEE Transactions on
Pattern Analysis and Machine Intelligence 29, 4 (April 2007), 627–639.
Gwen Littlewort et al. 2011. The computer expression recognition toolbox (CERT). In
2011 IEEE International Conference on Automatic Face Gesture Recognition
and Workshops (FG 2011). 298–305.
Bethany T. McDaniel, Sidney K. D’Mello, Brandon G. King, Patrick Chipman, Kristy
Tapp, and Art Graesser. 2007. Facial features for affective state detection in
learning environments. In Proceedings of the 29th Annual Cognitive Science
Society. 467–472.
Daniel McDuff, Rana El Kaliouby, Thibaud Senechal, David Demirdjian, and
Rosalind Picard. 2014. Automatic measurement of ad preferences from facial
responses gathered over the Internet. Image and Vision Computing 32, 10
(October 2014), 630–640.
Daniel McDuff, R. El Kaliouby, T. Senechal, M. Amr, J.F. Cohn, and R. Picard. 2013.
Affectiva-MIT facial expression dataset (AM-FED): Naturalistic and
spontaneous facial expressions collected in-the-wild. In 2013 IEEE
Conference on Computer Vision and Pattern Recognition Workshops (CVPRW).
881–888.
Selene Mota and Rosalind W. Picard. 2003. Automated posture analysis for detecting
learner’s interest level. In 2003 IEEE Conference on Computer Vision and
Pattern Recognition Workshops (CVPRW). 49–56.
Jaclyn Ocumpaugh, Ryan Baker, Ma. Mercedes Rodrigo, et al. 2015. HART: The
Human Affect Recording Tool. In Proceedings of the ACM Special Interest
Group on the Design of Communication (SIGDOC). New York, NY: ACM.
Jaclyn Ocumpaugh, Ryan Baker, Sujith Gowda, Neil Heffernan, and Cristina
Heffernan. 2014. Population validity for educational data mining models: A

Using Video to Automatically Detect Learner Affect in Computer-enabled Classrooms ??:29
ACM Transactions on xxxxxxxx, Vol. xx, No. xx, Article xx, Publication date: Month YYYY
case study in affect detection. British Journal of Educational Technology 45,
3 (May 2014), 487–501.
Jaclyn Ocumpaugh, Ryan Baker, and Ma. Mercedes T. Rodrigo. 2015. Baker Rodrigo
Ocumpaugh Monitoring Protocol (BROMP) 2.0 Technical and Training
Manual. In Technical Report. New York, NY: Teachers College, Columbia
University. Manila, Philippines: Ateneo Laboratory for the Learning Sciences.
Rosalind W. Picard, Elias Vyzas, and Jennifer Healey. 2001. Toward machine
emotional intelligence: analysis of affective physiological state. IEEE
Transactions on Pattern Analysis and Machine Intelligence 23, 10 (2001),
1175–1191.
Kaśka Porayska-Pomsta, Manolis Mavrikis, Sidney D’Mello, Cristina Conati, and
Ryan Baker. 2013. Knowledge elicitation methods for affect modelling in
education. International Journal of Artificial Intelligence in Education 22, 3
(January 2013), 107–140.
Rainer Reisenzein, Markus Studtmann, and Gernot Horstmann. 2013. Coherence
between emotion and facial expression: Evidence from laboratory
experiments. Emotion Review 5, 1 (January 2013), 16–23.
Thibaud Senechal, Kevin Bailly, and Lionel Prevost. 2014. Impact of action unit
detection in automatic emotion recognition. Pattern Analysis and
Applications 17, 1 (February 2014), 51–67.
Valerie J. Shute, Matthew Ventura, and Yoon Jeon Kim. 2013. Assessment and
learning of qualitative physics in Newton’s Playground. The Journal of
Educational Research 106, 6 (2013), 423–430.
Michel F. Valstar, Marc Mehu, Bihan Jiang, Maja Pantic, and Klaus Scherer. 2012.
Meta-analysis of the first facial expression recognition challenge. IEEE
Transactions on Systems, Man, and Cybernetics, Part B: Cybernetics 42, 4
(2012), 966–979.
Jacqueline Kory Westlund, Sidney K. D’Mello, and Andrew M. Olney. 2015. Motion
Tracker: Camera-based monitoring of bodily movements using motion
silhouettes. PLoS ONE 10, 6 (June 2015).
J. Whitehill, Z. Serpell, Yi-Ching Lin, A. Foster, and J.R. Movellan. 2014. The faces of
engagement: Automatic recognition of student engagement from facial
expressions. IEEE Transactions on Affective Computing 5, 1 (January 2014),
86–98.
Zhihong Zeng, Maja Pantic, Glenn I. Roisman, and Thomas S. Huang. 2009. A survey
of affect recognition methods: Audio, visual, and spontaneous expressions.
IEEE Transactions on Pattern Analysis and Machine Intelligence 31, 1 (2009),
39–58.

??:30 N. Bosch et al.
ACM Transactions on xxxxxxxx, Vol. xx, No. x, Article x, Publication date: Month YYYY
APPENDIX 8.
Details of results
Table VI. Results of cross-day compared to within-day detection.
Classification
Baseline
AUC
Within-
day AUC
Cross-
day AUC
Change
(Cross-day -
Within-day)
Change
(Cross-day -
Baseline)
Boredom .610 .574 .577 0.23% -3.34%
Confusion .649 .665 .639 -2.61% -1.02%
Engagement .679 .679 .662 -1.72% -1.70%
Frustration .631 .643 .631 -1.21% 0.02%
Mean Affect .642 .640 .627 -1.33% -1.51%
Off Task .816 .774 .781 0.72% -3.48%
Note. Cross-day change is percentage of change in AUC, which is bounded on [0, 1].
Table VII. Cross-period detection accuracy vs. combined (baseline results) accuracy.
Classification Baseline AUC Cross-period AUC
Change (Cross-period –
Baseline)
Boredom .610 .579 -3.10%
Confusion .649 .590 -5.83%
Delight .867 .862 -0.48%
Engagement .679 .672 -0.74%
Frustration .631 .638 0.72%
Mean Affect .687 .668 -1.89%
Off-task .816 .793 -2.27%
Note. Cross-period change is percentage of change in AUC, which is bounded on [0, 1].
Table VIII. Results (AUC) of within- and cross- perceived ethnicity testing.
Classification
Recreated
Baseline
Caucasian
→
Caucasian
Caucasian
→
Non-Caucasian
Non-Caucasian
→
Non-Caucasian
Non-Caucasian
→
Caucasian
Boredom .621 .638 .651 .645 .668
Confusion .644 .673 .766 .682 .684
Delight .850 .883 .874 .840 .927
Engagement .672 .663 .697 .721 .653
Frustration .645 .620 .673 .692 .626
Mean Affect .687 .695 .732 .716 .711
Off-task .806 .846 .756 .786 .834
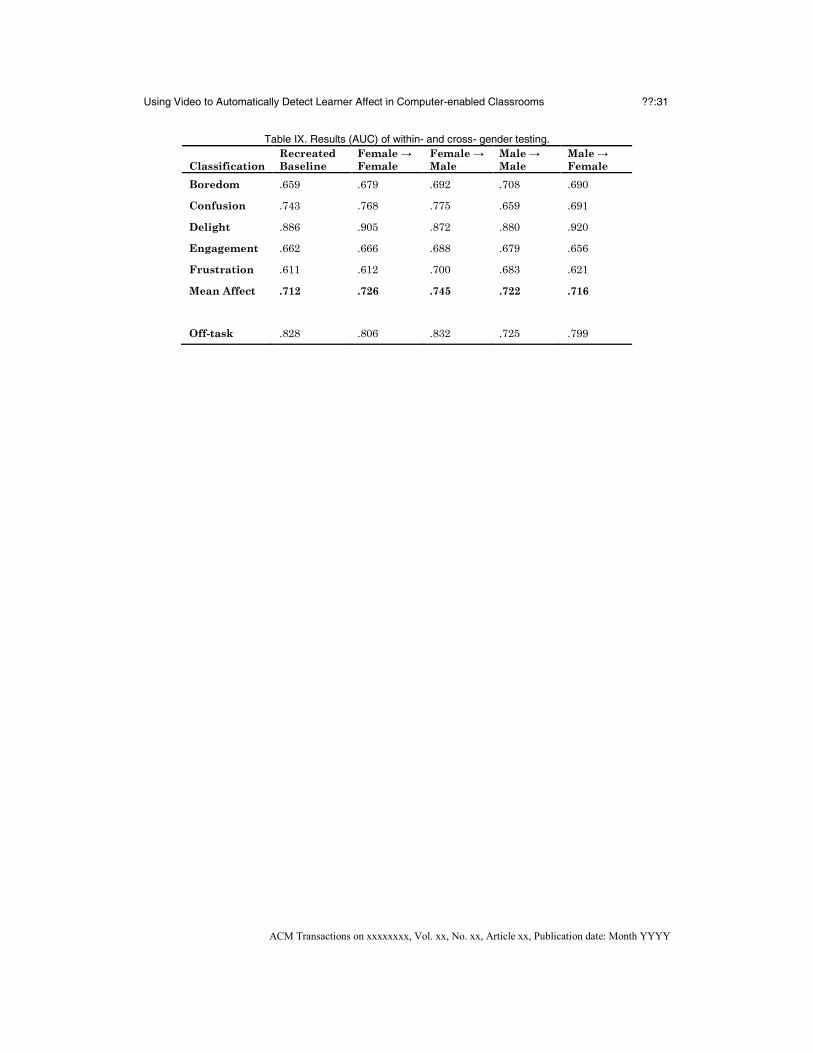
Using Video to Automatically Detect Learner Affect in Computer-enabled Classrooms ??:31
ACM Transactions on xxxxxxxx, Vol. xx, No. xx, Article xx, Publication date: Month YYYY
Table IX. Results (AUC) of within- and cross- gender testing.
Classification
Recreated
Baseline
Female →
Female
Female →
Male
Male →
Male
Male →
Female
Boredom .659 .679 .692 .708 .690
Confusion .743 .768 .775 .659 .691
Delight .886 .905 .872 .880 .920
Engagement .662 .666 .688 .679 .656
Frustration .611 .612 .700 .683 .621
Mean Affect .712 .726 .745 .722 .716
Off-task .828 .806 .832 .725 .799