Embed Size (px)
Citation preview

2010 Annual U.S. Disclosure Document
for the fiscal year ended September 30, 2010
Australia and New Zealand Banking Group Limited ABN 11 005 357 522

Table of Contents
Section 1: Key information 3 Forward-Looking Statements 3 Selected Financial Data 4 Summary of Consolidated Statements of Income 5 Summary of Consolidated Balance Sheets 6 Assets, Liabilities, Income and Profit before Tax 8
Section 2: Information on the Group 9 Overview 9 Principal Activities of Regions and Divisions 9 Organizational Structure 12 Capital Expenditure and Divestitures 12 The Group’s Strategic Priorities 13 Recent Developments 14 Supervision and Regulation 15 Risk Factors Relating to Business/Principal Risks and Uncertainties 21 Currency of Presentation, Exchange Rates and Certain Definitions 30
Section 3: Operating and Financial Review and Prospects 32 Operating Results 32 Profit and Loss 32 Analysis of Major Income and Expense Items 35 Net Income from Wealth Management 38 Other Operating Income 38 Operating Expenses 41 Pension Payments 42 Provision for Credit Impairment charge 43 Credit Risk on Derivatives 45 Income Tax Expense 46 Results by Geographic Region 47 Balance Sheet 56 Capital Management 61 Commitments 65 Credit Related Commitments 65 Contingent Liabilities 66 Supplementary Financial Information 71
Section 4: Directors, Senior Management/Executives and Employees 78 Directors 78 Directors’ Profiles 78 Senior Management and Executives 83 Corporate Governance 84
Section 5: Major Shareholders and Related Party Transactions 103 Major Shareholders 103 Change in Control 103 Related Party Transactions 103
Section 6: Additional Information 104 Exchange Controls 105 Limitations Affecting Security Holders 105 Withholding Taxes 106 Constitution 106 Material Contracts 106
GLOSSARY 107
Annex A – 2010 Annual Report 111
Annex B – 2009 Annual Report 112
Annex C – Constitution 113
2
Introduction
All references in this U.S. Disclosure Document (which term includes the Annexes attached hereto) to ‘ANZ’, the ‘ANZ Group’ the ‘Group’,’ the Bank’, ‘we’, ‘us’ and ‘our’ are to Australia and New Zealand Banking Group Limited (ABN 11 005 357 522) together with its subsidiaries. All references in this U.S. Disclosure Document to the ‘Company’ and to ’ANZBGL’ are to Australia and New Zealand Banking Group Limited.
Information contained in or accessible through the web sites mentioned in this U.S. Disclosure Document does not form part of this document unless we specifically state that it is incorporated by reference and forms part of this U.S. Disclosure Document. All references in this document to web sites are inactive textual references and are not active links.
ANZ is one of the four major banking groups headquartered in Australia. As of September 30, 2010, ANZ ranked fourth among Australian banking groups in terms of total assets and had a leading position in all market segments of the New Zealand banking market. ANZ’s principal ordinary share listing and quotation is on the Australian Securities Exchange (‘ASX’), and as of September 30, 2010 ANZ was ranked among the top ten largest companies listed on the ASX in terms of market capitalization.
Until June 2007, the Company had equity securities listed on the New York Stock Exchange (‘NYSE’). In July 2007, the Company delisted its American Depositary Shares (‘ADSs’) from the NYSE and applied to the U.S. Securities and Exchange Commission (‘SEC’) for termination of its ongoing reporting obligations under sections 13(a) and 15(d) of the Securities Exchange Act of 1934, as amended (the ‘Exchange Act’). The Company’s application became effective on October 11, 2007. Accordingly, ANZ no longer files annual or periodic reports, proxy statements or other public information with the SEC, except as may be required by Regulation AB if ANZ has certain material involvement with an asset backed issuer that is subject to Regulation AB. Previous filings with the SEC are available over the internet on the SEC’s website at www.sec.gov.
This U.S. Disclosure Document has been prepared in order to provide U.S. investors with certain additional information regarding ANZ’s business and operations, as well as its financial position, as of September 30, 2010 and the results of operations for the fiscal year then ended. All balances disclosed in this U.S. Disclosure Document relate to those of the Group. Excerpts of our 2010 Annual Report, as prepared and filed with the ASX in accordance with its rules, are attached to this U.S. Disclosure Document as Annex A. Excerpts of our 2009 Annual Report, as prepared and filed with the ASX in accordance with its rules, are attached to this U.S. Disclosure Document as Annex B.
Section 1: Key information Forward-Looking Statements
This U.S. Disclosure Document (including the Annexes) contains various forward-looking statements regarding events and trends that are subject to risks and uncertainties that could cause the actual results and financial position of the Company or the ANZ Group to differ materially from the information presented herein. When used in this U.S. Disclosure Document (including the Annexes), the words “estimate”, “project”, “intend”, “anticipate”, “believe”, “expect”, “may”, “probability”, “risk”, “will”, “seek”, “would”, “could”, “should” and similar expressions, as they relate to the Company or the ANZ Group and its management, are intended to identify such forward-looking statements. Readers are cautioned not to place undue reliance on these forward-looking statements, which speak only as of the date hereof. Such statements constitute “forward-looking statements” for the purposes of the United States Private Securities Litigation Reform Act of 1995. We do not undertake any obligation to publicly release the result of any revisions to these forward-looking statements to reflect events or circumstances after the date hereof or to reflect the occurrence of unanticipated events. For example, the forward-looking statements contained in this U.S. Disclosure Documents will be affected by:
• adverse conditions in global debt and equity markets; • general economic conditions in Australia, New Zealand and other jurisdictions in which we operate; • market liquidity and investor confidence; • changes to our credit ratings; • inflation, interest rate, exchange rate, market and monetary fluctuations and longer term changes; • the effect of, and changes in, laws, regulations, taxation or accounting standards or practices and government
policy, particularly those arising from the global financial crisis, including increased liquidity and capital requirements;
• changes in consumer spending, saving and borrowing habits in Australia, New Zealand and other jurisdictions in which we operate;
• the effects of competition in the geographic and business areas in which we operate; • our ability to adjust to and compete in the Asian geographic markets into which we are seeking to expand; • the ability to maintain or increase market share and control expenses;
3

• the timely development and acceptance of new products and services and the perceived overall value of these products and services by users;
• technological changes; • operational and environmental factors; • demographic changes and changes in political, social, and economic conditions in any of the jurisdictions in which
we operate; • our ability to complete, integrate or process acquisitions and dispositions; • the stability of Australian and international financial systems and disruptions to financial markets and any losses we
may experience as a result; • adverse impact on our reputation; and • various other factors beyond our control.
There can be no assurance that actual outcomes will not differ materially from the forward-looking statements contained in this U.S Disclosure Document. See “Principal Risks and Uncertainties Associated with ANZ” below.
Selected Financial Data
The consolidated balance sheet as of September 30, 2009 and 2010 and income statement data for the fiscal years ended September 30, 2009 and 2010 have been derived from the Group’s audited financial report for the financial year ended September 30, 2010 (the ‘2010 Financial Report’). The consolidated balance sheet as of September 30, 2008 and income statement data for the fiscal year ended September 30, 2008 have been derived from the comparative information in the Group’s audited financial report for the year ended September 30, 2009 (the ‘2009 Financial Report’). The Group’s 2010 Financial Report is contained within ANZ’s 2010 Annual Report (excerpts of which are attached as Annex A). The Group’s 2009 Financial Report is contained within ANZ’s 2009 Annual Report (excerpts of which are attached as Annex B).
The Financial Reports of the Group and the financial information included herein, except where otherwise noted, are prepared under International Financial Reporting Standards (‘IFRS’).The Group’s application of IFRS and related interpretations ensures that the 2009 and 2010 Financial Reports comply with IFRS.
Amounts are presented in Australian dollars unless otherwise stated. Amounts reported in United States dollars (‘USD’) have been translated at the September 30, 2010 Noon Buying Rate in New York City for cable transfers in Australian dollars as certified for customs purposes by the Federal Reserve Bank of New York (the ‘Noon Buying Rate’), which was USD$0.9640 = AUD$1.00.
4

Summary of Consolidated Statements of Income
2010 2010 2009 2008 2007 2006
Years ended September 30 USD$M $M $M $M $M $M
Interest income 25,650 26,608 26,286 32,604 26,210 22,301 Interest expense (15,172) (15,739) (16,398) (24,754) (18,908) (15,358)
Net interest income 10,478 10,869 9,888 7,850 7,302 6,943
Net income from wealth management 1,059 1,099 230 182 190 69
Other operating income (1) (2) 3,590 3,724 3,492 4,127 3,848 3,140
Operating income 15,127 15,692 13,610 12,159 11,340 10,152
Operating expenses (3) (7,041) (7,304) (6,225) (5,696) (4,953) (4,531)
Profit before provision for credit impairment
Charges and income tax 8,086 8,388 7,385 6,463 6,387 5,621
Provision for credit impairment charge (4) (1,723) (1,787) (3,005) (1,948) (522) (407)
Profit before income tax 6,363 6,601 4,380 4,515 5,865 5,214
Income tax expense(5) (2,021) (2,096) (1,435) (1,188) (1,678) (1,522)
Profit for the year 4,342 4,505 2,945 3,327 4,187 3,692
Net profit attributable to non-controlling interests (4) (4) (2) (8) (7) (4)
Profit attributable to shareholders of the Company 4,338 4,501 2,943 3,319 4,180 3,688
Total adjustments attributable to shareholders of the Company recognized directly into equity (6) (770) (799) (1,155) 56 (324) (181)
Total changes in equity other than those resulting
from transactions with shareholders as owners (7) 3,569 3,702 1,788 3,375 3,856 3,507
Non-interest income as a % of operating income (8) 30.7% 30.7% 27.3% 35.4% 35.6% 31.6% Dividends on ordinary shares (9) 2,571 2,667 2,452 2,506 2,363 2,068 Earnings per fully paid ordinary shares
Basic (cents) (10) 173 179 131 170 224 200
Diluted (cents) (10) 169 175 130 162 218 194
Dividend per ordinary share (cents) $1.21 $1.26 $ 1.02 $ 1.36 $1.36 $ 1.25 1. 2010 includes a loss of $217 million relating to valuation adjustments following the reconciliation of the fair value of the Group’s pre-existing 49% interest on acquisition
date of OnePath (formerly INGA) and INGNZ and adjustments to write off previously equity accounted debit available-for-sale reserves, an increase in other income relating to the policyholder tax gross up in OnePath of $215 million and a negative adjustment in relation to treasury shares held by OnePath. In addition, 2010 includes an adjustment of credit risk on derivatives of $35 million (2009: $135 million loss; 2008: $687 million loss) as per ‘Section 3: Operating and Financial Review and Propects – Credit Risk on Derivatives”. 2008 includes a gain from the allocation of shares in Visa Inc. of $353 million and 2007 includes profit on the sale of Esanda Fleetpartners of $195 million and other significant items.
2. Other operating income for 2007 has been reclassified to be comparable to 2008, 2009 and 2010. The reclassification relates to the transfer of an adjustment for credit risk on derivatives from provision for credit impairment to other operating income of $45 million. Refer “Section 3: Operating and Financial Review and Prospects – Credit risk on Derivatives”.
3. 2010 includes costs associated with the acquisition and integration of OnePath (formerly INGA), INGNZ, Landmark Financial Services and RBS businesses. 2009 includes costs associated with organizational transformation of $142 million (2008: $218 million) and other significant items.
4. The provision for credit impairment charge represents the individual and collective provision charge (refer “Section 3: Operating and Financial Review and Prospects – Provision for Credit Impairment Charge”).
5. 2010 includes Income tax expense attributable to income relating to policyholder income and contributions tax gross up in OnePath. 6. 2010 and 2009 principally relates to exchange differences on translation of foreign operations, refer page 85 of 2010 Financial Report. 7. Excludes non-controlling interests. 8. Operating income is the sum of net interest income and non-interest income. 9. Excludes preference share dividends and dividends taken under the bonus option plan. The proposed final dividend for 2010 of $1,895 million based on the forecast number
of ordinary shares on issue at dividend record date (2009 final dividend of $1,403 million; 2008 final dividend: $1,514 million; 2007 final dividend: $1,381 million) has not been provided for at September 30 in accordance with IFRS.
10. Amounts are based on weighted average number of ordinary shares outstanding for 2010 of 2,509.3 milliion (2009: 2,221.6 million; 2008: 1,921.1 million; 2007: 1,848.5 million). Profit after income tax excludes preference share dividends for 2010 of $11 million (2009: $33 million; 2008: $46 million; 2007: $37 million).
5
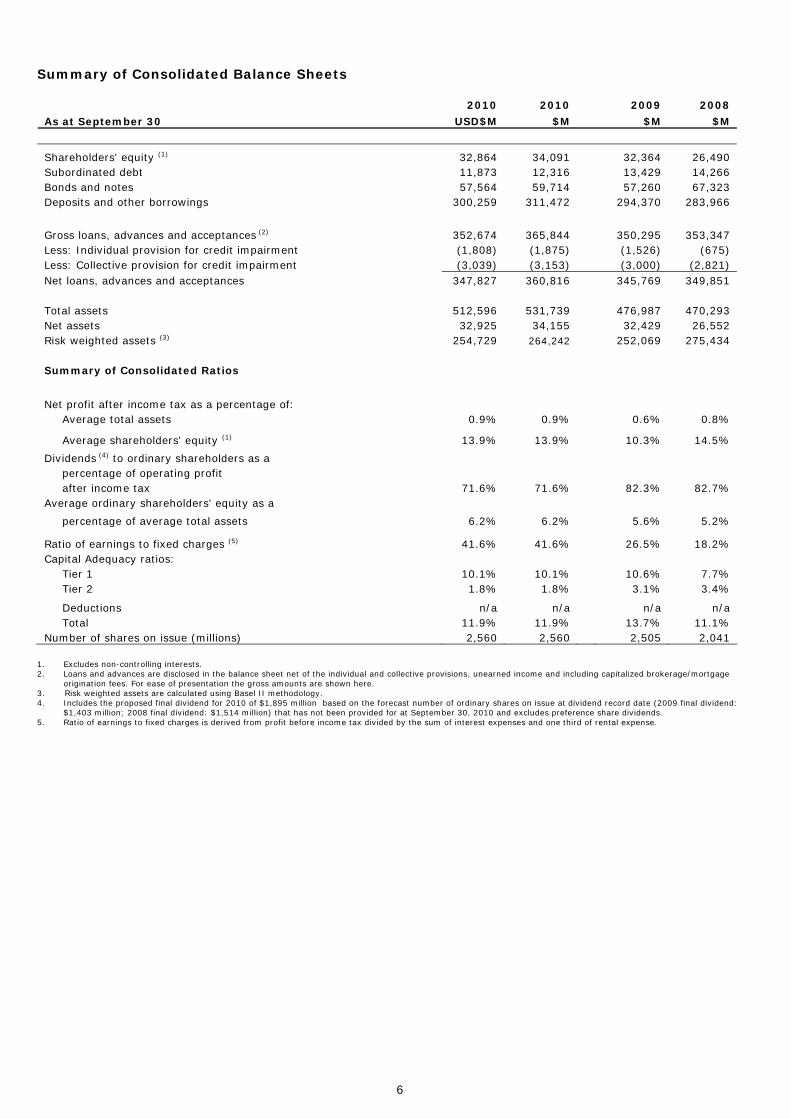
Summary of Consolidated Balance Sheets
2010 2010 2009 2008
As at September 30 USD$M $M $M $M
Shareholders' equity (1) 32,864 34,091 32,364 26,490 Subordinated debt 11,873 12,316 13,429 14,266 Bonds and notes 57,564 59,714 57,260 67,323 Deposits and other borrowings 300,259 311,472 294,370 283,966
Gross loans, advances and acceptances (2) 352,674 365,844 350,295 353,347 Less: Individual provision for credit impairment (1,808) (1,875) (1,526) (675) Less: Collective provision for credit impairment (3,039) (3,153) (3,000) (2,821) Net loans, advances and acceptances 347,827 360,816 345,769 349,851 Total assets 512,596 531,739 476,987 470,293 Net assets 32,925 34,155 32,429 26,552 Risk weighted assets (3) 254,729 264,242 252,069 275,434 Summary of Consolidated Ratios
Net profit after income tax as a percentage of: Average total assets 0.9% 0.9% 0.6% 0.8%
Average shareholders' equity (1) 13.9% 13.9% 10.3% 14.5%
Dividends (4) to ordinary shareholders as a percentage of operating profit after income tax 71.6% 71.6% 82.3% 82.7% Average ordinary shareholders' equity as a
percentage of average total assets 6.2% 6.2% 5.6% 5.2%
Ratio of earnings to fixed charges (5) 41.6% 41.6% 26.5% 18.2% Capital Adequacy ratios: Tier 1 10.1% 10.1% 10.6% 7.7% Tier 2 1.8% 1.8% 3.1% 3.4%
Deductions n/a n/a n/a n/a Total 11.9% 11.9% 13.7% 11.1% Number of shares on issue (millions) 2,560 2,560 2,505 2,041
1. Excludes non-controlling interests. 2. Loans and advances are disclosed in the balance sheet net of the individual and collective provisions, unearned income and including capitalized brokerage/mortgage
origination fees. For ease of presentation the gross amounts are shown here. 3. Risk weighted assets are calculated using Basel II methodology. 4. Includes the proposed final dividend for 2010 of $1,895 million based on the forecast number of ordinary shares on issue at dividend record date (2009 final dividend:
$1,403 million; 2008 final dividend: $1,514 million) that has not been provided for at September 30, 2010 and excludes preference share dividends. 5. Ratio of earnings to fixed charges is derived from profit before income tax divided by the sum of interest expenses and one third of rental expense.
6
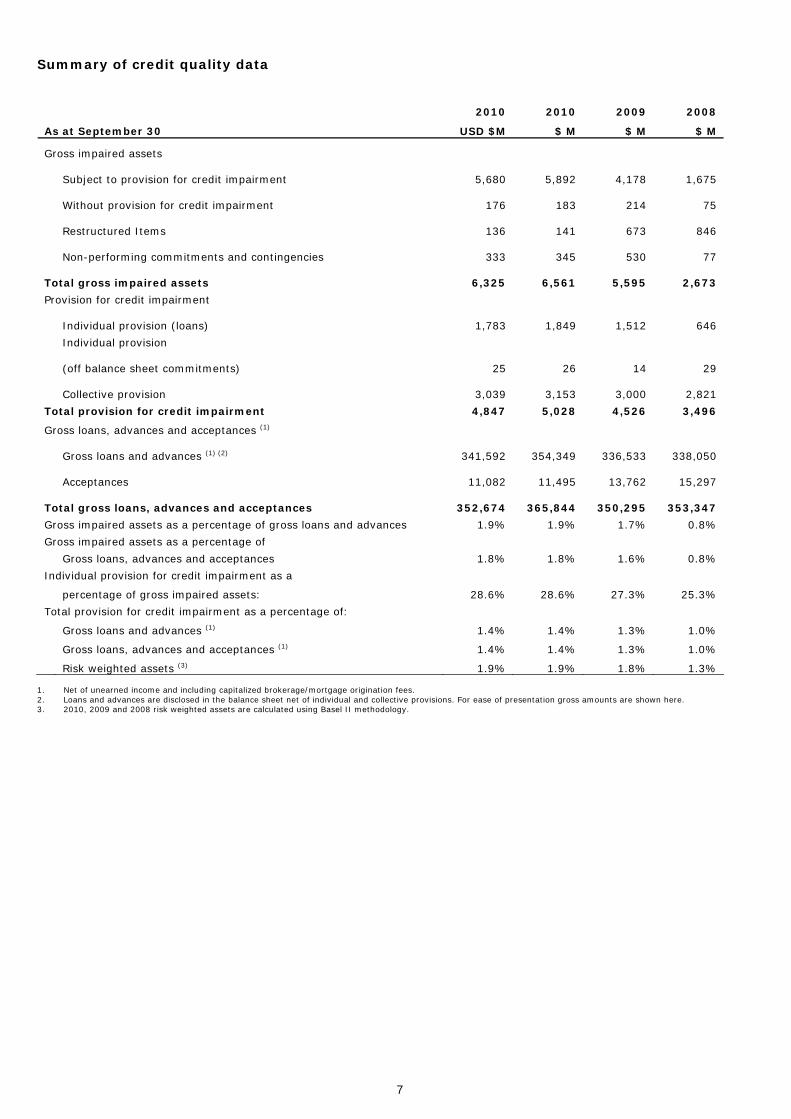
Summary of credit quality data
2010 2010 2009 2008
As at September 30 USD $M $ M $ M $ M
Gross impaired assets
Subject to provision for credit impairment 5,680 5,892
4,178
1,675
Without provision for credit impairment 176 183
214
75
Restructured Items 136 141
673
846
Non-performing commitments and contingencies 333 345
530
77
Total gross impaired assets 6,325
6,561 5,595 2,673
Provision for credit impairment
Individual provision (loans) 1,783 1,849
1,512
646
Individual provision
(off balance sheet commitments) 25 26 14
29
Collective provision 3,039 3,153
3,000
2,821
Total provision for credit impairment 4,847 5,028 4,526 3,496
Gross loans, advances and acceptances (1)
Gross loans and advances (1) (2) 341,592 354,349 336,533
338,050
Acceptances 11,082 11,495
13,762
15,297
Total gross loans, advances and acceptances 352,674 365,844
350,295
353,347
Gross impaired assets as a percentage of gross loans and advances 1.9% 1.9% 1.7% 0.8%
Gross impaired assets as a percentage of
Gross loans, advances and acceptances 1.8% 1.8% 1.6% 0.8%
Individual provision for credit impairment as a
percentage of gross impaired assets: 28.6% 28.6% 27.3% 25.3%
Total provision for credit impairment as a percentage of:
Gross loans and advances (1) 1.4% 1.4% 1.3% 1.0%
Gross loans, advances and acceptances (1) 1.4% 1.4% 1.3% 1.0%
Risk weighted assets (3) 1.9% 1.9% 1.8% 1.3% 1. Net of unearned income and including capitalized brokerage/mortgage origination fees. 2. Loans and advances are disclosed in the balance sheet net of individual and collective provisions. For ease of presentation gross amounts are shown here. 3. 2010, 2009 and 2008 risk weighted assets are calculated using Basel II methodology.
7

Assets, Liabilities, Income and Profit before Tax
2010 2009 2008 Years ended September 30 $M % $M % $M %
Region1
External Assets Australia 381,195 72% 325,132 68% 321,072 68% Asia Pacific, Europe & America 57,239 11% 50,410 11% 48,853 11% New Zealand 93,305 17% 101,445 21% 100,368 21% 531,739 100% 476,987 100% 470,293 100% External Liabilities Australia 357,551 72% 312,378 70% 307,994 69% Asia Pacific, Europe & America 64,886 13% 49,591 11% 46,954 11% New Zealand 75,147 15% 82,589 19% 88,793 20% 497,584 100% 444,558 100% 443,741 100% Income2 Australia 23,646 75% 20,875 69% 25,437 69% Asia Pacific, Europe & America 2,616 8% 2,873 10% 2,803 8% New Zealand 5,169 17% 6,260 21% 8,673 23% 31,431 100% 30,008 100% 36,913 100% Profit before tax Australia 5,064 77% 3,041 70% 2,863 64% Asia Pacific, Europe & America 570 9% 836 19% 473 10% New Zealand 967 14% 503 11% 1,179 26% 6,601 100% 4,380 100% 4,515 100%
1. For discussion of operating results by region see ‘Section 2: Operating and Financial Review and Prospects - Results by Geographic Region’ 2. Income largely comprises interest income, non-interest income and share of investments (refer note 3 of the 2010 Financial Report).
8

Section 2: Information on the Group Overview ANZ is one of the four major banking groups headquartered in Australia. ANZ began its Australian operations in 1835 and its New Zealand operations in 1840. ANZ is a public company limited by shares incorporated in Australia and was registered in the State of Victoria on July 14, 1977. ANZ’s registered office is located at Level 9, 833 Collins Street, Docklands, Victoria, 3008, Australia and the telephone number is +61 3 9683 9999. Its Australian Company Number is ACN 005 357 522. As at the close of trading on September 30, 2010, ANZ had a market capitalization of approximately A$61 billion. As at September 30, 2010, the Group had total assets of A$531.7 billion, and shareholders’ equity of A$34.2 billion. ANZ’s principal ordinary share listing and quotation is on the Australian Securities Exchange (‘ASX’). Its ordinary shares are also quoted on the New Zealand Stock Exchange (‘NZX’). The Group provides a broad range of banking and financial products and services to retail, small business, corporate and institutional clients. The Group conducts its operations primarily in Australia, New Zealand and the Asia Pacific region. It also operates in a number of other countries including the United Kingdom and the United States. As at September 30, 2010, the Group had over 1,394 branches and other points of representation worldwide excluding Automatic Telling Machines (‘ATMs’). The Group’s primary strategy is to become a super regional bank focusing on Australia, New Zealand and the Asia Pacific region. Consistent with this strategy, our aim includes increasing Asia Pacific’s profit contribution to the Group to around 20% by 2012. While there is a strong focus on organic growth, ANZ continues to explore appropriate acquisitions throughout the region where opportunities arise. Principal Activities of Regions and Divisions The Group is managed along the geographic regions of (i) Australia, (ii) Asia Pacific, Europe & America and (iii) New Zealand, as well as globally through our global institutional client business, which is viewed as a separate division but also impacts each geographic region. The results of the Institutional division are separately tracked and reported but are allocated to the geographic regions to which the Institutional division results relate for Group segment reporting purposes. See page 55 of this U.S. Disclosure Document. Our current structure has been in place since October 1, 2008. Until September 30, 2008, the Group operated four divisions (Personal, Institutional, New Zealand, Asia Pacific), a separate structure for the INGA Joint Venture Wealth Management business and a Group center for centralized group functions and Private Banking. Accordingly, the 2008 segment results for the Personal and Institutional segments have been reallocated to the geographic regions of Australia, New Zealand and Asia Pacific, Europe & America for purposes of comparability with the 2009 and 2010 segment results. The principal activities of the Group’s regions are outlined below. As the Group continuously reviews its business structure, this description is subject to change from time to time.
Australia The Australia region consists of (i) Retail, (ii) Commercial, (iii) Institutional, (iv) Wealth and (v) Group Center. Retail Retail is comprised of two business units: (i) Retail Distribution and (ii) Product Strategy and Marketing. • Retail Distribution operates the Australian branch network, Australian call center, specialist businesses (including
ATMs, retail foreign exchange centers, specialist mortgage sales staff, mortgage brokerage and franchisees and direct channels), online banking and distribution services.
• Product Strategy and Marketing is responsible for delivering a range of products including: • Mortgages, providing housing finance to consumers in Australia for both owner occupied and investment
purposes. • Consumer Cards and Unsecured Lending, providing a range of unsecured financial products to customers in
Australia. • Transaction banking and savings products, including term deposits and cash management accounts.
9

Commercial Commercial is comprised of four business units: (i) Esanda, (ii) Regional Commercial Banking, (iii) Business Banking and (iv) Small Business Banking. • Esanda provides motor vehicle and equipment finance and investment products. • Regional Commercial Banking provides a full range of banking services to retail customers and to small business
and agribusiness customers in rural and regional Australia. • Business Banking provides a full range of banking services, including risk management, to metropolitan based small
to medium sized business clients with a turnover of up to A$40 million. • Small Business Banking Products provides a full range of banking services to small business clients. Institutional Institutional provides a full range of financial services to institutional customers with a turnover of A$40 million or more within Australia along the product lines of Transaction Banking, Markets and Specialized Lending. It also provides balance sheet management, relationship and infrastructure services. Wealth Wealth is comprised of three business units: (i) ANZ Private, (ii) Investments and Insurance Products and (iii) OnePath. • ANZ Private specializes in assisting high net worth individuals and families to manage, grow and preserve their
family assets. • Investments and Insurance Products is responsible for ANZ's wealth management products and services including
E*Trade (online broker) and Investment Lending. • On August 5, 2010, OnePath replaced ING Australia Limited (‘INGA’) as the name and brand for our specialist funds
management and life insurance businesses in Australia. INGA was previously a joint venture between ANZ and ING Group. ANZ owned 49% of INGA and received proportional equity accounted earnings. On November 30, 2009, ANZ acquired the remaining 51% share held by ING Group and since then ANZ has had sole ownership of the business.
Group Center Group Center includes the Australian portion of (i) Operations, Technology and Shared Services, (ii) Financial Management, (iii) Risk, (iv) Strategy, M&A, Marketing and Innovation, (v) Human Resources, (vi) Corporate Communications and (vii) Corporate Affairs. • Operations, Technology and Shared Services was split into two separate divisions during the half year to March 31,
2010. The two divisions are (i) Global Services and Operations (‘GSO’), which is the Group’s core support division comprising Operations, Global Shared Services (responsible for the overall design and delivery of scalable processes and professional services to the Group globally) and Property and (ii) Technology, which is responsible for the Group’s information and technology solutions and infrastructure, including the development, maintenance and support of technology solutions for staff and customers globally.
• Financial Management comprises Group Finance, Finance Professional Services, Group Legal and Company Secretary's Office, Internal Audit, Group Taxation, Group Treasury and Investor Relations.
• Risk has global responsibility for the effectiveness of the Group’s risk management framework and risk strategies, policies and processes. Divisional Risk teams (Risk Australia, Risk New Zealand, Risk Asia Pacific, Europe & America, Risk Institutional, and Risk Global Services and Operations) provide an active business partnership to embed and manage the Group Risk Framework within the divisions. Central Risk teams (Governance, Risk Infrastructure, Credit & Market Risk and Risk Chief of Staff) provide common governance and capabilities intended to enable effective enterprise-wide risk management.
• Strategy, M&A Marketing and Innovation is responsible for the Group's global business strategy, including the expansion and re-shaping of the Group's businesses, mergers, acquisitions and divestments. It is also responsible for the Group's global brand positioning and marketing strategy and for overseeing the Group's strategic productivity.
• Human Resources delivers global human resources capabilities, including developing and managing strategies, policies, processes and initiatives relating to the employment and development of staff.
• Corporate Communications is responsible for all external communication between the Group, the media and other constituents, as well as internal communication across the Group and geographies.
• Corporate Affairs manages key external relationships within Community, Corporate Responsibility, Government and Regulatory Affairs. This includes leadership and governance of the Group's Corporate Responsibility agenda.
10

Asia Pacific, Europe & America The Asia Pacific, Europe & America region includes (i) Retail, (ii) Asia Partnerships, (iii) Wealth, (iv) Institutional and (v) Operations & Support. • Retail provides retail and small business banking services to customers in the Asia Pacific region.
• Asia Partnerships is a portfolio of strategic retail partnerships in the Asia Pacific Region. This includes partnerships
or joint venture investments in Indonesia with PT Panin Bank; in the Philippines with Metrobank; in China with Bank of Tianjin and Shanghai Rural Commercial Bank (‘SRCB’), China’s largest rural commercial bank; in Malaysia with AMMB Holdings Berhad; and in Vietnam with Sacombank and Saigon Securities Incorporated (‘SSI’).
• Wealth includes investment and insurance products and services across the Asia Pacific region and under the Private Bank banner assisting customers in the Asia Pacific region to manage, grow and preserve their assets.
• Institutional Asia Pacific, Europe & America provides a full range of financial services to institutional customers within Asia Pacific, Europe and the United States of America.
• Operations & Support provides the central support functions for the region and includes operations, technology and shared services support services across all geographic regions.
• Bangalore which includes operations, technology and shared services support services to all geographic regions. During 2010, ANZ acquired selected Royal Bank of Scotland Group PLC businesses in Asia. The acquisitions of the businesses in the Philippines, Vietnam and Hong Kong were completed during the March 2010 half, and the acquisition of the businesses in Taiwan, Singapore and Indonesia were completed during the September 2010 half.
New Zealand
The New Zealand region consists of (i) Retail, (ii) Commercial, (iii) Institutional, (iv) Wealth and (v) an operations and support area which includes Treasury and capital funding. Retail Retail is comprised of two business units: (i) National Bank Retail and (ii) ANZ Retail. • National Bank Retail, operating under the National Bank brand in New Zealand, provides a full range of banking
services to personal and business banking customers. • ANZ Retail, operating under the ANZ brand in New Zealand, provides a full range of banking services to personal
and business banking customers. Commercial Commercial is comprised of three business units: (i) Corporate and Commercial Banking, (ii) Rural Banking and (iii) UDC. • Corporate and Commercial Banking incorporates the ANZ and National Bank brands and provides financial solutions
through a relationship management model for medium-sized businesses with a turnover of up to NZ$150 million. • Rural Banking provides a full range of banking services to rural and agribusiness customers. • UDC provides motor vehicle and equipment finance, operating leases and investment products. Institutional Institutional provides a full range of financial services to institutional customers within New Zealand along the product lines of Transaction Banking, Markets and Specialized Lending. It also provides balance sheet management, relationship and infrastructure services. Wealth Wealth is comprised of two business units: Private Banking and ING New Zealand Limited. • Private Banking includes the private banking operations under the ANZ and National Bank brands.
11

• On August 5, 2010, OnePath replaced ING New Zealand Limited (‘INGNZ’) as the name and brand for the specialist funds management and life insurance businesses in New Zealand. INGNZ was previously a joint venture between ANZ and ING Group where ANZ owned 49% of INGNZ and received proportional equity accounted earnings. On November 30, 2009, ANZ acquired the remaining 51% share held by ING Group.
Operations and Support Operations and support includes the back-office processing, customer account maintenance, and central support areas including Treasury and capital funding.
Institutional The Institutional division, which impacts each regional segment and the results of which are allocated to the appropriate geographic regions for segment reporting purposes, consists of (i) Transaction Banking, (ii) Global Markets, (iii) Specialized and Relationship Lending, and (iv) Relationship and Infrastructure. The Institutional division provides a full range of financial services to institutional customers in Australia, New Zealand, Asia Pacific, Europe and the United States of America. Multinationals, institutions and corporates with sophisticated needs and multiple relationships are served globally. Institutional has a major presence in Australia and New Zealand and also has operations in Asia Pacific, Europe & America. • Transaction Banking provides working capital solutions including lending and deposit products, cash transaction
banking management, trade finance, international payments, securities lending, clearing and custodian services, principally to institutional and corporate customers.
• Global Markets provides risk management services to corporate and institutional clients in relation to foreign exchange, interest rates, credit and commodities markets. This includes the business of providing origination, underwriting, structuring and risk management services, advice and sale of credit and derivative products globally. Global markets also manages the Group’s interest rate risk position.
• Specialized and Relationship Lending provides complex financing and advisory services, structured financial products, leasing, project finance, leveraged finance and investment products to the Group’s global clients.
• Relationship and Infrastructure includes client relationship teams for global institutional customers and corporate customers in Australia, and central support functions.
Organizational Structure ANZ is not directly or indirectly owned or controlled by any other corporation or corporations, or by any government. ANZ’s material controlled entities as at September 30, 2010 are set out in Note 38 to the financial statements contained in ANZ’s 2010 Annual Report attached to this U.S. Disclosure Document as Annex A. Capital Expenditure and Divestitures
Acquisition of material controlled entities During the year ended September 30, 2010, the Group acquired the following businesses:
• ING Australia and ING New Zealand (‘ING’) - on November 30, 2009, the Group acquired the remaining 51% shareholding in the ANZ-ING joint ventures in Australia and New Zealand, taking its ownership interest to 100%. The financial year ended September 30, 2010 includes the financial impact of full ownership since November 30, 2009. For the period October 1, 2009 to November 30, 2009, the investments were accounted for as joint ventures. In the prior periods, the results include the financial impact of our 49% interest in the joint venture.
• Landmark Financial Services (‘Landmark’) - on March 1, 2010, the Group completed its acquisition of the
Landmark financial services business from the AWB Group. The financial results of Landmark for the period since acquisition are included in earnings for the financial year ended September 30, 2010.
• Royal Bank of Scotland Group plc (‘RBS’) businesses in Asia - during 2009, ANZ announced the acquisition of
selected RBS businesses in Asia. Acquisition completion was undertaken progressively with the Philippines business completed on November 21, 2009, Vietnam on the December 5, 2009, Hong Kong on March 20, 2010,
12

Taiwan on April 19, 2010, Singapore on May 17, 2010 and Indonesia on June 14, 2010. The financial results of these acquired businesses are included from these respective dates.
There were no material controlled entities acquired during the year ended September 30, 2009.
Disposal of material controlled entities
There were no material controlled entities disposed of during the years ended September 30, 2010 or September 30, 2009.
The Group’s Strategic Priorities
The strategic priority for the Group is to become a super regional bank focusing on Australia, New Zealand and the Asia Pacific region. This includes a rebalancing of profits across the geographies, whereby the profit contribution from Asia Pacific is intended to increase as a percentage of total Group profits.
Growth across the Australia, New Zealand and Asia Pacific geographies is supported by four core priorities:
• Customer Focus: Since October 1, 2008, the Group’s business has been restructured around its customers’ needs
rather than product lines. • Marketing and Sales: The Group business has undertaken a shift in its focus from selling commodity products to
serving customers. • Technology: The Group is seeking to improve the levels of technology it uses to be comparable to those used by
banks globally, particularly in relation to risk management. • Performance: The Group is developing an “out performance” culture on financial and customer service and work
ethic.
The Super Regional Strategy launched in December 2007 includes three key steps:
• Restore (1 to 2 years from launch): to restore the momentum in the domestic businesses and capture existing
opportunities, improve performance in Institutional, drive improved return from the Group’s business in Asia and undertake strategic cost management.
• Outperform (2 to 5 years from launch): to provide quality on par with global leaders in the Group’s markets, provide ‘best of breed’ customer experience, consider in-fill mergers and acquisitions in core geographies and unlock value of the Group’s franchise, including integrating and expanding operations in Bangalore (India), encouraging innovation and improving service.
• Transform (5+ years from launch): to transform the Group into a leading super regional bank with global quality and an Australian, New Zealand and Asia Pacific regional focus.
• Since December 2007, the Group has made good progress with the Super Regional Strategy.
13
Recent Developments
The following significant recent developments for ANZ have occurred between September 30, 2010 and the date of this U.S. Disclosure Document. • On November 12, 2010, ANZ announced a further investment of RMB832 million (A$126 million) in Bank of Tianjin
(‘BoT’) in China as part of a capital raising to support BoT’s strategic growth agenda. BoT is seeking to raise a total of RMB4.2 billion (A$629 million) in the capital raising and has invited a number of existing shareholders and new investors to participate. The additional investment means ANZ would maintain its current 20% stake in BoT. The BoT capital raising is subject to approval from its shareholders and regulator approvals.
• On November 11, 2010, ANZ announced a series of measures relating to mortgages, including the elimination of “exit fees” and establishment of fee discounts and subsidies for existing mortgage customers. The announcement followed a period of sustained attention by the Australian government on competition in the financial services sector. For instance, on October 28, 2010, the Australian Senate announced that it will hold an enquiry into competition within the Australian banking sector that will examine, among other things, fees and other charges levied by banks. See risk factor entitled “Competition may adversely affect ANZ’s results, especially in Australia, New Zealand and the Asian markets in which it operates.”
• On October 27, 2010, ANZ announced a further investment of RMB1.65 billion (AU$250 million) in SRCB pursuant to a rights offering by SRCB, which is subject to SRCB shareholder approval and local regulatory approvals. In addition to taking up its pro-rata allocation under the rights offering, ANZ also expects to increase its stake in SRCB from 19.9% to 20.0%. This would reinforce ANZ’s close cooperation with SRCB, including exploring further areas for business cooperation, such as credit cards and markets. Twenty percent is the maximum allowable ownership of a local Chinese bank by any foreign bank.
• On October 25, 2010, ANZ received final approval for a foreign bank license from the Reserve Bank of India (‘RBI’), thereby allowing ANZ to establish a foreign bank branch in Mumbai, India in the first half of 2011. Establishing a branch presence in India is a strategic priority for ANZ as part of its objective to become a super regional bank focused on Australia, New Zealand and the Asia Pacific region.
ANZ’s business in India will have an initial focus on corporate and institutional banking that is expected to broaden to include services for affluent personal banking clients over time. The Mumbai branch will continue to offer ANZ’s expertise in natural resources, agriculture and infrastructure for clients doing business in India and across the region. Services will include funding and hedging solutions, trade finance, cash and payments, foreign exchange and debt capital markets.
• In early October 2010, ANZ’s locally incorporated entity, ANZ China, commenced operations and ANZ also recently announced plans to establish a Chinese-language operations hub in Chengdu, western China.
• On September 13, 2010, ANZ announced the appointment of Mr David Hisco as Chief Executive Officer of ANZ National Bank Limited (‘ANZNBL’) subject to approval by the Reserve Bank of New Zealand (‘RBNZ’). Mr Hisco’s appointment as a Director and Chief Executive Officer of ANZNBL became effective on October 13, 2010, following receipt of the RBNZ's confirmation that it had no objection to the appointment. In addition to Mr Hisco’s role as Chief Executive Officer of ANZNBL, he will continue in his role of Global Head of Commercial Banking of ANZBGL.
• On August 16, 2010, ANZ announced that it is participating in a due diligence process in relation to the potential sale of a 57.27% shareholding in Korea Exchange Bank (‘KEB’). ANZ’s participation in the KEB sale process is part of a continuing examination of potential strategic growth opportunities that are designed to increase the profit contributions from the Asia Pacific region as a percentage of total Group profits.
According to publicly available information, KEB is a financial and banking service provider based in Seoul, South Korea that offers personal banking, business banking, foreign exchange and credit card services and, as of December 31, 2009, operated through 352 branches (including 27 depositary offices) and 3 subsidiaries in Korea and 25 branches (including 5 depositary offices and 5 offices) and 9 subsidiaries outside of Korea.
According to publicly available information, KEB had a market capitalization of approximately Korean Won (KRW) 8,706 billion as of November 10, 2010, which at the Federal Reserve Bank of New York’s noon buying rate on November 10, 2010 was equivalent to approximately US$7.8 billion.
For more information regarding KEB, see www.keb.co.kr/main/en/. The KEB website is not incorporated by reference into this U.S. Disclosure Document. No assurance can be given as to the accuracy or completeness of the information provided by KEB on its website.
The eventual outcome of the KEB sale process is subject to considerable uncertainty. The Group will comment further when a decision is made regarding whether or not to proceed with the acquisition.
14
Supervision and Regulation
Overview of APRA’s Regulation Since July 1, 1998, the Australian Prudential Regulation Authority (‘APRA’) has been responsible for the prudential and regulatory supervision of Australian authorized deposit-taking institutions (‘ADIs’), which covers banks (including ANZBGL), credit unions, building societies, insurance companies (including OnePath Life Limited) and superannuation funds. Prior to this, the Australian banking industry was regulated by the Reserve Bank of Australia (‘RBA’). The RBA has retained overall responsibility for monetary policy, financial system stability and payments system regulation. APRA draws authority from the Australian Prudential Regulation Authority Act 1998. APRA requires ADIs to meet certain prudential standards that are covered in a range of APRA Prudential Standards (‘APS’). APRA discharges its responsibilities in part by requiring ADIs subject to its supervision to regularly provide it with reports which set forth a broad range of information, including financial and statistical data relating to their financial position and information in respect of prudential and other matters. APRA gives special attention to capital adequacy, liquidity, earnings, credit quality and associated loan loss experience, concentration of risks, the maturity profile of assets and liabilities, operational risks, market risks, interest rate risk in the banking book, exposures to related entities, outsourcing, funds management, securitization activities and international banking operations. APRA may also exercise certain investigative powers if an ADI fails to provide information about its financial condition or becomes unable to meet its obligations or suspends payment. In carrying out its supervisory role, APRA supplements its analysis of statistical data collected from each ADI with selective 'on site' visits and formal meetings with the ADI's senior management and external auditors. APRA has also formalised a consultative relationship with each ADI's external auditors, with the agreement of the ADIs. The external auditors provide additional assurance to APRA that the ADI has observed all applicable prudential standards, and that statutory and other banking requirements are being met. External auditors also undertake targeted reviews of specific risk management areas as selected by APRA. In addition, an ADI's Chief Executive Officer attests to, and its board of directors endorses, the adequacy and operating effectiveness of the ADI’s risk management systems to control exposures and limit risks to prudent levels. Capital management and adequacy within APRA's regulations For further details of the Group's capital management and adequacy, liquidity and APRA's regulatory environment, refer to Section 3 –“Operating and Financial Review and Prospects - Capital Management” and “- Liquidity Management” below and Notes 31 ("Capital Management") and 33 (“Financial Risk Management – Liquidity Risk”) to the financial statements contained in ANZBGL's 2010 Annual Report attached to this U.S. Disclosure Document as Annex A. Basel II and other capital regulatory considerations The common framework for determining the appropriate quantum of bank regulatory capital is set by the Basel Committee and a framework was developed in 2004 that is commonly known as 'Basel II'. A key objective of Basel II is to improve the stability of the global financial system by encouraging improved risk management practices and requiring financial institutions, including ADIs, to hold levels of regulatory capital commensurate with their risk profile. In particular, Basel II introduced a more risk-sensitive and detailed regulatory capital regime for credit risk and introduced for the first time an explicit regulatory capital charge for operational risk. A major innovation of the accord is that Basel II allows ADIs of varying sophistication in their risk management practices to enter the regulatory capital framework at one of three levels, with incentives embedded (by way of the potential for reduced regulatory capital requirements) to attract ADIs with more sophisticated risk measurement and management approaches to reach the more advanced levels. ADIs are required to choose their approach and be accredited at a level of compliance in each of credit and operational risk. On December 10, 2007, APRA advised that the Group had achieved Advanced accreditation under the Basel II rules for the purposes of calculating its minimum capital requirements. Accreditation by APRA to use the Advanced Internal Ratings Based (‘AIRB’) methodology for credit risk weighted assets and Advanced Measurement Approach for the operational risk weighted asset equivalent, means the Group now uses the most sophisticated approaches for the three major types of risk facing banks, being credit risk, operational risk and market risk, for regulatory capital determination from January 1, 2008 when the Basel II principles took effect in Australia. While accreditation has been received, a number of aspects of the measurement of risk weighted assets and regulatory capital are still under review in conjunction with APRA and as a result some changes may occur. In 2008, APRA also placed a transitional cap of 10 per cent on any reduction in capital requirements arising from the Basel II changes, which continues to apply during 2010. It is currently unclear when APRA will amend, vary or terminate the transitional cap.
15

Under Basel II, financial institutions are required to make extensive qualitative and quantitative disclosures with respect to capital adequacy and credit risk management. ANZ provides this information quarterly in its Basel II Pillar III Report. In addition, on December 10, 2007 ANZNBL received accreditation from the RBNZ to use the AIRB methodology which took effect on January 1, 2008. Pre Basel III Liquidity Liquidity is controlled by individual agreements between APRA and each ADI which take into consideration the specific operations of each organization. APRA requires that ADIs have a comprehensive liquidity policy statement that defines the guidelines and systems for managing domestic and foreign currency liquidity, including a formal contingency plan for dealing with a liquidity crisis. The board of directors must approve this statement. An ADI's liquidity management policy should cater for a range of potential conditions and APRA requires an ADI’s liquidity risk to be assessed under two specific scenarios. • The first scenario is known as the 'going-concern' and refers to the normal behaviour of cash flows in the ordinary
course of business and forms the day-to-day focus of an ADI's liquidity management. APRA requires that an ADI must be able to meet all commitments and obligations under a going concern scenario, within the ADI's normal funding capacity ('available to fund' limit), over at least the following 30 calendar days.
• The second scenario, known as the 'name crisis', models the behaviour of cash flows where there is a problem
(real or perceived) which may include, but is not limited to, operational issues, doubts about the solvency of an ADI or adverse rating changes. Under the name crisis scenario, APRA requires an ADI to have sufficient liquidity to remain cash flow positive for at least the five following business days.
Proposed changes to the Capital and Liquidity Frameworks APRA On September 11, 2009, APRA released proposals to enhance liquidity risk management by ADIs. The objective is to strengthen the resilience of ADIs to liquidity risk and improve APRA's ability to assess and monitor ADIs' liquidity risk profiles. APRA has stated that the proposed changes to be incorporated as part of its revised approach to liquidity risk would include: • enhanced qualitative requirements consistent with the Principles for Sound Liquidity Risk Management and
Supervision issued by the Basel Committee in September 2008; • extending the "going concern" cash flow projection requirement to all ADIs and lengthening the projection to at
least 12 months; • strengthening the current APRA-defined stress testing to ensure ADIs meet a minimum acceptable level of
resilience, which would include:
• lengthening the minimum survival horizon for the current APRA-defined "name crisis" scenario from five business days to one month; and
• an additional APRA-defined three-month "market disruption" stress scenario; and
• a standardized reporting framework for collecting regular liquidity data from ADIs, including the ability to access
data at short notice in times of stress. The final APRA requirements are expected to incorporate any additional requirements from the Basel III framework as it relates to liquidity, including the introduction of a Net Stable Funding Ratio. Further, on March 18, 2010, APRA released a discussion paper in respect of the supervision of conglomerate groups which would include the Group as it contains material operations in more than one APRA regulated industry. The aim of APRA is to ensure that prudential supervision adequately captures the risks to which APRA regulated entities within a conglomerate group are exposed and which, because of the operations or structures of a group, are not adequately captured by the existing prudential frameworks. In conjunction with the conglomerate groups proposals, on May 13, 2010, APRA released proposals to update and align the prudential standards for general insurers and life insurers which applies to a number of Group entities. In each case, APRA's final regulations are expected to be influenced by the final global capital and liquidity regime implemented following further changes proposed by the Basel Committee and banking regulators in other countries.
16

Basel Committee For a summary of the regulatory changes which would result from the Basel Committee’s Basel III proposals, refer to Section 3 –“ Operating and Financial Review and Prospects - Capital Management” and “- Liquidity Management” below of this U.S. Disclosure Document. The Basel Committee is yet to release details of: • The methodology for calculating the countercyclical buffer; • The final requirements for Tier 1 and Tier 2 Capital instruments; • Contingent and ‘bail-in’ capital requirements; and • Any capital overlays for systematically important banks. Other Regulators In addition, ANZBGL is supervised and regulated in some respects by the Australian Securities and Investments Commission (‘ASIC’), the Australian Competition and Consumer Commission (‘ACCC’), the Australian Transaction Reports and Analysis Center (‘AUSTRAC’) and various securities exchanges. ASIC is Australia's corporate, markets and financial services regulator and regulates Australian companies, financial markets, financial services organizations and professionals who deal and advise in investments, superannuation, insurance, deposit-taking and credit. ANZBGL provides products and participates in markets regulated by ASIC. The ACCC is an independent Commonwealth statutory authority which promotes competition and fair trading in the Australian marketplace to benefit consumers, business and the community. It also regulates national infrastructure services. Its primary responsibility is to ensure that individuals and businesses, including ANZBGL, comply with the Australian competition, fair trading and consumer protection laws. The Group is required to comply with certain anti-money laundering and counter-terrorism financing legislation and regulations under Australian law and the local laws of all the countries in which it operates, including the Anti-Money Laundering and Counter-Terrorism Financing Act 2006 (the ‘AML Act’). The AML Act is administered by the AUSTRAC. The Group has equity securities listed on the ASX and the New Zealand Stock Exchange (‘NZX'), and has debt securities listed on this and some other overseas securities exchanges. As a result, the Group must comply with a range of listing and corporate governance requirements in Australia, New Zealand and overseas. In addition to the prudential capital oversight that APRA conducts over ANZBGL and its branch operations and details of the supervision and regulation described above, local banking operations in all of ANZBGL's offshore branches and banking subsidiaries are subject to host country supervision by their respective regulators such as the RBNZ, the Office of the Comptroller of the Currency (the ‘Comptroller’), the FRB, the UK Financial Services Authority, the Monetary Authority of Singapore, the Hong Kong Monetary Authority, the China Banking Regulatory Commission and other financial regulatory bodies in those countries and in other relevant countries. In addition, ANZ’s super regional strategy, expansion and growth in the Asia Pacific gives rise to a requirement to comply with a number of different legal and regulatory regimes across that region. These regulators may impose minimum capitalization requirements on those operations. United States A major focus of U.S. governmental policies affecting financial institutions in recent years has been combating money laundering and terrorist financing. The USA PATRIOT Act of 2001 (the ‘Patriot Act’) substantially broadened the scope of U.S. anti-money laundering laws by imposing significant new compliance and due diligence obligations, creating new crimes and penalties and expanding the extra-territorial jurisdiction of the United States. The U.S. Treasury Department has issued a number of regulations implementing various requirements of the Patriot Act that apply to U.S. financial institutions, such as ANZBGL's U.S. bank subsidiaries and U.S. broker-dealer subsidiary, as well as, ANZBGL's New York branch. Those regulations impose obligations on financial institutions operating in the United States to maintain appropriate policies, procedures and controls to detect, prevent and report money laundering and terrorist financing and to verify the identity of their customers. In addition, the U.S. bank regulatory agencies are imposing heightened standards and U.S. law enforcement authorities have been taking a more active role. Failure of a financial institution to maintain and implement adequate policies and procedures to combat money laundering and terrorist financing could have serious legal and reputation consequences for the institution. Following the passage of the U.S. Gramm-Leach-Bliley Act also known as the Financial Modernization Act (the ‘GLB’), ANZ successfully sought certification as a Financial Holding Company (a ‘FHC’) by the Federal Reserve Board. An FHC is allowed to engage, or acquire companies engaged, in the United States in activities that are determined by the Federal Reserve Board and the Secretary of the Treasury to be financial in nature or incidental thereto, and activities that are determined by the Federal Reserve Board to be complementary to financial activities.
17
Under the GLB, the activities of a FHC are subject to restrictions if it is determined that the FHC (in the case of ANZBGL, at the Group level only), or any of its U.S. subsidiary depository institutions, does not satisfy the definition of "well managed" or "well capitalized" or if any of its U.S. subsidiary depository institutions ceases to achieve at least a "satisfactory" rating under the U.S. Community Reinvestment Act of 1977. In addition, under the GLB, the FRB is the "umbrella" supervisor with jurisdiction over FHCs. ANZBGL's New York Branch is subject to supervision, examination and regulation by the Comptroller under the U.S. International Banking Act of 1978 (the ‘IBA’) and under regulations adopted pursuant to the IBA. The IBA provides, among other things, that a federal branch of a non-U.S. bank can exercise the same rights and privileges that are available to national banks. In addition, the exercise of any such right or privilege must be subject to the same duties, restrictions, penalties, liabilities, conditions and limitations that apply to national banks in the same jurisdiction. The federal branch must maintain its accounts and records separate from those of the non-U.S. bank and must comply with such additional requirements as may be prescribed by the Comptroller. Under the IBA, a federal branch of a non-U.S. bank is subject to the receivership provisions to the same extent as a national bank. The Comptroller may take possession of the business and property of a federal branch. Accordingly, the Comptroller has at its disposal a wide range of supervisory and enforcement tools for addressing violations of laws and regulations and breaches of safety and soundness, which can be imposed upon federal branches. The Comptroller may remove federal branch management and assess civil money penalties. In certain circumstances, the Comptroller may also terminate a federal branch license at its own initiative or at the recommendation of the FRB. Also, under the IBA, a non-U.S. bank is subject to certain restrictions with respect to opening new U.S. domestic deposit-taking branches and establishing new U.S. subsidiary banks in states outside of its "home-state", which in ANZBGL's case is New York. The Dodd-Frank Wall Street Reform and Consumer Protection Act (the ‘Dodd-Frank Act’) was signed into law on July 21, 2010. Implementation of the Dodd-Frank Act will require many lengthy rulemaking processes that are expected to result in the promulgation of 200 or more new regulations. Once fully implemented, the Dodd-Frank Act will affect many aspects, in the United States and internationally, of the business of banking, including securitization, proprietary trading, investing, OTC derivatives and other activities.
ANZ’s businesses may be affected by a variety of new regulations under the Dodd-Frank Act including, but not limited to, greater regulation of over-the-counter derivatives, including stricter capital and margin requirements, the central clearing of standardized over-the-counter derivatives, and heightened supervision of all over-the-counter derivatives dealers and major market participants. In addition, if ANZ is designated as “systemically important” under the Dodd-Frank Act, U.S. regulators may have increased regulatory authority over ANZ and may have the power to require ANZ to sell or transfer assets and terminate activities if U.S. regulators determine that the size or scope of activities of ANZ pose a threat to U.S. financial stability. The extent of these impacts will depend on the rules the U.S. regulatory agencies develop and implement under the Dodd-Frank Act over the next several years.
The Foreign Account Taxation Compliance Act (‘FATCA’) was enacted on March 18, 2010. FATCA requires foreign financial institutions (such as ANZ) to provide the U.S. Internal Revenue Service (‘IRS’) with information on certain foreign accounts held by U.S. persons. FATCA is expected to require significant investment by affected institutions in compliance and reporting framework that will meet FATCA standards.
18

Competition Australia
The Australian banking system is highly competitive. As of September 30, 2010, the four major banking groups in Australia (ANZ, Commonwealth Bank of Australia, National Australia Bank and Westpac Banking Corporation), held approximately two thirds of the total Australian assets of banks that carry on business in Australia. The operations of the smaller regional banks are typically limited to servicing customers in a particular state or region, and generally have an emphasis on retail banking. A number of international banks also provide banking services in Australia and typically focus on specific segments of the retail or institutional markets, holding a minority position in these segments.
The deregulation of the Australian financial system during the early 1980’s led to a proliferation of both bank financial institutions and non-bank financial institutions that compete in selected markets with the four major banking groups. Non-bank financial intermediaries such as building societies and credit unions compete principally in the areas of accepting deposits and residential mortgage lending. Some large building societies have been granted banking authorizations under the Banking Act 1959. Specialist non-bank residential mortgage lenders and direct (non-branch) banking operations have also become more prominent in recent years.
Competition has historically been particularly intense in the housing lending market, which initially resulted from the rise of mortgage originators, and then growth in the mortgage broker industry. In recent years, major banks have competed aggressively by offering significant discounts below the advertised rate. Additionally, the market turmoil experienced during the global financial crisis materially affected the business models of non-bank originators and resulted in an overall uplift in flows to the major banks.
The retail deposit market in Australia is also very competitive, with the introduction in recent years of a number of high rate cash management accounts and online accounts and increased competition for term deposit funds. The introduction of the Australian Government Guarantee for retail customer bank deposits in 2008 led to increased deposits with the major Australian banks and a decrease in deposits with structured deposit fund providers. We believe a strong focus on meeting non-price needs will help protect earnings in this segment.
Institutional offers a wide range of financial market services to our large corporate and institutional customer base including foreign exchange, derivative and fixed interest activities, project and structured finance, corporate finance (mergers and acquisitions, and other advisory), primary markets origination and syndication and leasing finance. Competitors gain recognition through the quality of their client base, perceived skill sets, reputation and brands. In domestic markets, Institutional’s competitors at the large corporate and institutional customer level are generally the other major Australian banks as well as some international investment banks operating in niche markets, the boutique operations of large multi-national banking conglomerates or domestic investment banks with a focus on niche areas. Institutional's key competitive strength is its focused geographic and sector experience, league table rankings and its established client base. Market turmoil created as a result of the global financial crisis saw a moderation in the level of margin decline with lower activity by foreign banks and an increase in net interest margins from reduced competition and appropriate repricing for risk. This followed a decline in margins over the majority of the previous 10 years. We would expect competition to intensify again as institutional lending activity increases in the Australian market, although to date these volumes have remained subdued.
The funds management industry is an area of strong competition among the four major Australian banks and Australia's insurance companies. Competition has increased as the Australian government has encouraged long-term saving through superannuation by means of taxation concessions and the imposition of a mandatory superannuation guarantee levy on employers. In May 2002 ANZ entered a wealth joint venture with ING Group in Australia and New Zealand. In September 2009, ANZ agreed to acquire the remaining 51% share held by ING Group and now has sole ownership of this business. We believe this acquisition brings greater certainty to our wealth management position through full ownership of what is an established wealth management and protection business. On October 28, 2010, the Australian Senate announced that it will hold an inquiry into competition within the Australian banking sector. Refer to the risk factor entitled “Competition may adversely affect ANZ’s results, especially in Australia, New Zealand and the Asian markets in which it operates”, for further discussion of this matter.
New Zealand
In December 2003, ANZ purchased NBNZ from Lloyds TSB Group plc. Combined with ANZ's existing New Zealand operations, the amalgamated entity holds around one third market share in New Zealand in most segments, and is the leading player in every major segment. ANZNBL’s principal competitors are the three major Australian bank owned banks, the New Zealand government owned Kiwibank and Rabobank New Zealand in the rural market. A key area of competition in New Zealand is in the deposit market, which has seen a reduction in net interest margins with competitors seeking to use price to gain market share and through the introduction and increased use of online accounts and term deposits. Increased demand for customer deposits and higher cost of wholesale debt has also
19

negatively impacted residential mortgage margins. Repricing for the higher cost of funding is occurring although the ability to reprice tends to lag due to the majority of mortgages being fixed rate. Asia Pacific Banking in the Asia Pacific is highly competitive with a large number of global and regional banks operating across the region in addition to local banks in each market. ANZ has had a long standing presence in Asia and the Pacific and today we have operations in 14 Asian markets and 12 countries across the Pacific. Our competitive position across these markets ranges from holding significant market share in a number of countries across the Pacific to being a new and emerging entrant in several Asian markets. This range is reflective of the length of presence and specific strategic approach that ANZ is taking in each market. A priority for ANZ is to build out a number of franchise markets in Asia that we see as high growth and where we see competitive space to grow.
20

Risk Factors Relating to Business/Principal Risks and Uncertainties Introduction
ANZ’s business activities are subject to risks that can adversely impact its business, future performance and financial condition. Prospective investors should carefully consider the risks and the other information contained in this U.S. Disclosure Document before investing in securities issued by ANZ. The risks and uncertainties described below are not the only ones ANZ may face. Additional risks and uncertainties that ANZ is unaware of, or that ANZ currently deems to be immaterial, may also become important factors that affect it. If any of the listed or unlisted risks actually occur, ANZ’s business, operations, financial condition or reputation could be materially adversely affected, with the result that the trading price of ANZ’s equity or debt securities could decline and investors could lose all or part of their investment.
Changes in general business and economic conditions, including disruption in regional or global credit and capital markets, may adversely affect ANZ’s results
ANZ’s financial performance is primarily influenced by the economic conditions and the level of business activity in the major countries and regions in which it operates or trades, i.e. Australia, New Zealand, the Asia Pacific Region, Europe and the United States of America. ANZ’s business, operations and financial condition can be negatively affected by changes to these economic and business conditions.
The economic and business conditions that prevail in ANZ’s major operating and trading markets are affected by domestic and international economic events, political events and by movements and events that occur in global financial markets.
The impact of the Global Financial Crisis (‘GFC’) in 2008 and 2009 saw a sudden and prolonged dislocation in credit and equity capital markets, a contraction in global economic activity and the creation of many challenges for financial services institutions worldwide that still persist.
The economic effects of the GFC in Australia included weakened retail sales, declines in personal and business credit growth, lower growth in housing credit and subdued business and consumer confidence. While some of these economic factors have since improved, there is no certainty as to the future sustainability of these improvements.
The New Zealand economy contracted sharply in 2008 and in the first quarter of 2009, and economic conditions in Australia, New Zealand and some Asia Pacific countries remain difficult especially in the rural, commercial and corporate sectors.
Should the difficult economic conditions of these countries persist or worsen, asset values in the housing, commercial or rural property markets could decline, unemployment could rise and corporate and personal incomes could suffer. Also, deterioration in global markets, including equity, property and other asset markets, could impact ANZ’s customers and the security ANZ holds against loans and other credit exposures, which may impact its ability to recover some loans and other credit exposures.
All or any of these negative economic and business impacts could cause a reduction in demand for ANZ’s products and services and/or an increase in loan and other credit defaults and bad debts, which could adversely affect ANZ’s business, operations and financial condition.
ANZ’s financial performance could also be adversely affected if it were unable to adapt cost structures, products, pricing or activities in response to a drop in demand or lower than expected revenues. Similarly, higher than expected costs (including credit costs) could be incurred because of adverse changes in the economy, general business conditions or the operating environment in the countries in which it operates.
Other economic and financial factors or events which may adversely affect ANZ’s performance and results, include, but are not limited to, volatility in foreign exchange rates and interest rates, changes in inflation and monetary supply, fluctuations in both debt and equity capital markets, declining commodity prices due, for example, to reduced Asian demand, and decreasing consumer and business confidence.
Geopolitical instability, such as threats of, potential for, or actual conflict, occurring around the world, may also adversely affect global financial markets, general economic and business conditions and ANZ’s ability to continue operating or trading in a country, which in turn may adversely affect ANZ’s financial performance.
Changes in the currency exchange rates may adversely affect ANZ’s results
An appreciation in the Australian or New Zealand dollar relative to other currencies could adversely affect the Australian or New Zealand economies, including agricultural exports and international tourism, whereas a depreciation would increase debt service obligations in Australia or New Zealand dollar terms. Also, a depreciation in the value of the New Zealand dollar against the Australian dollar could have a negative effect on the financial results of our New Zealand
21

businesses, which includes ANZ National Bank Limited (‘ANZNBL’). Similarly, to the extent the Australian dollar appreciates against the United States dollar, this could also negatively impact ANZ’s growing US$ earnings from the Group’s Asian businesses. Competition may adversely affect ANZ’s results, especially in Australia, New Zealand and the Asian markets in which it operates
The markets in which ANZ operate are highly competitive and could become even more so, particularly in those segments that are considered to provide higher growth prospects or are in greatest demand (for example customer deposits). Factors that contribute to competition risk include industry regulation, mergers and acquisitions, changes in customers’ needs and preferences, entry of new participants, development of new distribution and service methods and increased diversification of products by competitors. For example, changes in the financial services sector in Australia and New Zealand have made it possible for non-banks to offer products and services traditionally provided by banks, such as automatic payment systems, mortgages and credit cards. In addition, banks organized in jurisdictions outside Australia are subject to different levels of regulation and consequently some may have lower cost structures. Increasing competition for customers could also potentially lead to a compression in ANZ’s net interest margins, or increased advertising and related expenses to attract and retain customers.
The effect of the competitive market conditions, especially in ANZ’s main markets, may lead to erosion in ANZ’s market share and adversely affect ANZ’s business, operations and financial conditions.
On October 28, 2010, the Australian Senate announced that it will hold an inquiry into competition within the Australian banking sector. The broad ranging inquiry will be undertaken by the Senate Economics Committee and will examine, among other things, the products banks offer, their fees and charges, the current level of competition between bank and non-bank providers and any policies, practices and strategies that may enhance competition in banking, including legislative change.
Any regulatory changes that occur in response to the Senate inquiry into “Competition within the Australian banking sector” could have the effect of limiting or reducing ANZ’s revenue earned from its banking products or operations. These regulatory changes could also result in higher operating costs. A reduction or limitation in revenue or an increase in operating costs could adversely affect ANZ’s profitability. Changes in monetary policies may adversely affect ANZ’s results
The Reserve Bank of Australia (‘RBA’) and the Reserve Bank of New Zealand (‘RBNZ’) set official interest rates so as to affect the demand for money and credit in Australia and New Zealand, respectively. Their policies determine, in large part, ANZ’s cost of funds for lending and investing and the return that ANZ will earn on those loans and investments. Both these factors impact ANZ’s net interest margin and can affect the value of financial instruments it holds, such as debt securities and hedging instruments. The policies of the RBA, the RBNZ and any other relevant central monetary authority can also affect ANZ’s borrowers, potentially increasing the risk that they may fail to repay loans. Changes in the RBA’s and RBNZ’s policies are difficult to predict accurately. Sovereign risk may destabilize global financial markets adversely affecting all participants, including ANZ
Sovereign risk or the risk that foreign governments will default on their debt obligations or be unable to refinance their debts as they fall due has emerged as a risk to the recovery prospects of global economies. This risk is particularly relevant to a number of European countries, though it is not limited to Europe. Should one sovereign default, there could be a cascading effect to other markets and countries, the consequences of which, while difficult to predict, may be similar to or worse than that experienced during the GFC. Such an event could destabilize global financial markets adversely affecting all participants, including ANZ. Financial support packages jointly announced by EU authorities and the IMF in the first half of 2010 were designed to reassure global markets regarding the risk of sovereign default and avert further financial turmoil. It is not certain whether such packages will achieve their intended effect, and the impact of any withdrawal and modifications to such packages over time. The withdrawal of the Australian Government Guarantee Scheme for Large Deposits and Wholesale Funding and the New Zealand Government Wholesale Funding Guarantee Scheme may adversely impact ANZ’s access to funding and liquidity
With improvement in international capital market and liquidity conditions, and banks subsequently being able to again successfully raise non-government guaranteed funds in the international wholesale market, many government-sponsored financial stabilization packages are progressively being withdrawn. There is a risk that this may result in unexpected stress on the global financial system or regional financial systems, which could adversely impact ANZ and its customers and counterparties.
Specifically, on February 7, 2010, the Australian Federal Government announced the withdrawal of the Australian Government guarantee scheme for wholesale funding with effect from March 31, 2010. Similarly, on March 10, 2010, the New Zealand Government announced the withdrawal of its wholesale guarantee facility with effect from April 30,
22

2010. Other countries have also ended their guarantee schemes, are in the process of doing so or are likely to do so in the future.
The withdrawal of the Australian and New Zealand wholesale funding guarantee schemes could adversely affect ANZ’s ability to access sources of funding and lead to a decrease in ANZ’s liquidity position and increase in funding costs, particularly if credit market conditions are disrupted.
It is also possible that global financial conditions could again deteriorate, liquidity could tighten and new risks could emerge as a result of markets experiencing stress, or existing risks manifest in ways that are not currently foreseeable. Such conditions could adversely affect ANZ’s funding and liquidity position, negatively affecting ANZ’s business, operations and financial condition. ANZ is exposed to liquidity and funding risk, which may adversely affect its results
Liquidity risk is the risk that ANZ has insufficient capacity to fund increases in assets, or is unable to meet its payment obligations as they fall due, including repaying depositors or maturing wholesale debt. Liquidity risk is inherent in all banking operations due to the timing mismatch between cash inflows and cash outflows.
Reduced liquidity could lead to an increase in the cost of ANZ’s borrowings and possibly constrain the volume of new lending, which could adversely affect ANZ’s profitability. A significant deterioration in investor confidence in ANZ could materially impact ANZ’s cost of borrowings and ANZ’s ongoing operations and funding.
ANZ uses a variety of funding sources including customer deposits and wholesale funding (including from outside of Australia) to seek to help ensure that it continues to meet its funding obligations and to maintain or grow its business generally. In times of systemic liquidity stress, in the event of damage to market confidence in ANZ or in the event that funding outside of Australia is not available or constrained, ANZ’s ability to access sources of funding and liquidity may be constrained. Deterioration in global markets and systemic market liquidity stress may limit ANZ’s ability to access sources of funding and liquidity.
Since the second half of 2007, developments in the U.S. mortgage industry and in the U.S. and European markets more generally, have adversely affected the liquidity in global credit and capital markets. This has resulted in an increase in funding costs that currently continues. Future deterioration in these market conditions may limit ANZ’s ability to replace maturing liabilities and access funding in a timely manner necessary to fund and grow its business.
Global and domestic regulators have released proposals intended to strengthen liquidity requirements which, together with any risks arising from these regulatory changes, are set out below in the risk factor entitled “Regulatory changes or a failure to comply with regulatory standards, law or policies may adversely affect ANZ’s business, operations or financial condition”. ANZ is exposed to the risk that its credit ratings could change, which could adversely affect its ability to raise capital and wholesale funding
ANZ’s credit ratings have a significant impact on both its access to, and cost of, capital and wholesale funding. Credit ratings are not a recommendation by the relevant rating agency to invest in securities offered by ANZ. However, a downgrade or potential downgrade to ANZ’s credit rating may reduce access to capital and wholesale debt markets, potentially leading to an increase in funding costs, as well as affecting the willingness of counterparties to transact with it. Credit ratings may be withdrawn, subject to qualifiers, revised, or suspended by the relevant credit rating agency at any time. In addition, the ratings of individual securities (including, but not limited to, Tier-1 and Tier-2 securities) issued by ANZ (and banks globally) could be impacted from time to time by changes in the ratings methodologies used by rating agencies. Ratings agencies may revise their methodologies in response to legal or regulatory changes or other market developments. ANZ may experience challenges in managing its capital base, which could give rise to greater volatility in capital ratios
ANZ’s capital base is critical to the management of its businesses and access to funding. ANZ is required by regulators including, but not limited to, APRA, RBNZ, the UK Financial Services Authority (‘FSA’), U.S. regulators and various Asia Pacific jurisdictions where ANZ has operations, to maintain adequate regulatory capital.
Under current regulatory requirements, risk weighted assets and expected loan losses increase as a counterparty’s risk grade worsens. These additional regulatory capital requirements compound any reduction in capital resulting from increased provisions for loan losses in times of stress. As a result, greater volatility in capital ratios may arise and may require ANZ to raise additional capital. There can be no certainty that any additional capital required would be available or could be raised on reasonable terms.
Global and domestic regulators have released proposals, including the Basel III proposals, to strengthen, among other things, the liquidity and capital requirements of banks and funds management and insurance entities. These proposals,
23

together with any risks arising from any regulatory changes, are described below in the risk factor entitled “Regulatory changes or a failure to comply with regulatory standards, law or policies may adversely affect ANZ’s business, operations or financial condition”.
Further details about the capital management regime affecting ANZ are contained in the section entitled “Capital Management” under Section 3 (Operating and Financial Review and Prospects) of this U.S. Disclosure Document. ANZ is exposed to credit risk, which may adversely affect its results
As a financial institution, ANZ is exposed to the risks associated with extending credit to other parties. Less favorable business or economic conditions, whether generally or in a specific industry sector or geographic region, could cause customers or counterparties to experience adverse financial consequences, thereby exposing ANZ to the increased risk that those customers or counterparties will fail to meet their obligations in accordance with agreed terms. ANZ holds provisions for credit impairment. The amount of these provisions is determined by assessing the extent of impairment inherent within the current lending portfolio, based on current information. This process, which is critical to ANZ’s financial results and condition, requires difficult, subjective and complex judgments, including forecasts of how current and future economic conditions might impair the ability of borrowers to repay their loans. However, if the information upon which the assessment is made proves to be inaccurate or if ANZ fails to identify proper factors or fails to accurately estimate the impact of factors ANZ does identify, the provisions made for credit impairment may be insufficient, which could have a material adverse effect on ANZ’s financial performance.
Since 2009, stabilization has occurred, and in most cases a reduction in impairment costs. This has been driven by an improvement in global economic conditions and a slowdown in corporate defaults. While emerging economies, including in Asia, where ANZ has focused its recent growth strategy, have been resilient amidst a moderation in growth in some developed economies, the uneven recovery supports ANZ’s intention to retain a cautious approach to impairment charges and provisions.
In addition, in assessing whether to extend credit or enter into other transactions with customers, ANZ relies on information provided by or on behalf of customers, including financial statements and other financial information. ANZ may also rely on representations of customers as to the accuracy and completeness of that information and, with respect to financial statements, on reports of independent auditors. ANZ’s financial performance could be negatively impacted to the extent that it relies on information that is inaccurate or materially misleading. An increase in the failure of third parties to honor their commitments in connection with ANZ’s trading, lending, derivatives and other activities may adversely affect its results
ANZ is exposed to the potential risk of credit-related losses that can occur as a result of a counterparty being unable or unwilling to honor its contractual obligations. As with any financial services organization, ANZ assumes counterparty risk in connection with its lending, trading, derivatives and other businesses where it relies on the ability of a third party to satisfy its financial obligations to ANZ on a timely basis. ANZ is also subject to the risk that its rights against third parties may not be enforceable in certain circumstances.
There is a risk that subsequent events will not be the same as assumed in ANZ’s original assessment of the ability of a third party to satisfy its obligations. Such credit exposure may also be increased by a number of factors including declines in the financial condition of the counterparty, the value of assets ANZ holds as collateral and the market value of the counterparty instruments and obligations it holds. Credit losses can and have resulted in financial services organizations realizing significant losses and in some cases failing altogether.
To the extent ANZ’s credit exposure increases, the increase could have an adverse effect on ANZ’s business and profitability if material unexpected credit losses occur. Weakening of the real estate markets in Australia, New Zealand or other markets where it does business may adversely affect ANZ’s results
Residential, commercial and rural property lending, together with property finance, including real estate development and investment property finance, constitute important businesses to ANZ. Overall, the property market has been variable and in some locations there have been substantially reduced asset values. With respect to the New Zealand housing market in particular, the outlook remains subdued, albeit with some signs of stabilization, impacted by a strong market supply and an overall cautious economic outlook.
A decrease in property valuations in Australia, New Zealand or other markets where it does business could decrease the amount of new lending ANZ is able to write and/or increase the losses that ANZ may experience from existing loans, which, in either case, could materially and adversely impact ANZ’s financial condition and results of operations. In particular, a significant slowdown in the Australian and New Zealand housing markets or in other markets where it does business could adversely affect ANZ’s results of operations.
24

ANZ is exposed to market risk which may adversely affect its result
ANZ is subject to market risk, which is the risk to ANZ’s earnings arising from changes in interest rates, foreign exchange rates, credit spreads, equity prices and indices, prices of commodities, debt securities and other financial contracts, including derivatives. Losses arising from these risks may have a material adverse effect on ANZ. As ANZ conducts business in several different currencies, its businesses may be affected by a change in currency exchange rates. Additionally, as ANZ’s annual and interim reports are prepared and stated in Australian dollars, any appreciation in the Australian dollar against other currencies in which ANZ earns revenues (particularly to the New Zealand dollar and US dollar) may adversely affect the reported earnings.
The profitability of ANZ’s funds management and insurance businesses is also affected by changes in investment markets and weaknesses in global securities markets due to credit, liquidity or other problems. ANZ is exposed to the risks associated with credit intermediation and financial guarantors which may adversely affect its results
ANZ entered into a series of structured credit intermediation trades from 2004 to 2007. ANZ sold protection using credit default swaps over these structures and then, to mitigate risk, purchased protection via credit default swaps over the same structures from eight U.S. financial guarantors. The underlying structures involve credit default swaps (‘CDSs’) over synthetic collateralized debt obligations (‘CDOs’), portfolios of external collateralized loan obligations (‘CLOs’) or specific bonds/floating rate notes (‘FRNs’).
Being derivatives, both the sold protection and purchased protection are marked-to-market. Prior to the commencement of the GFC, movements in valuations of these positions were not significant and largely offset each other in income. Following the onset of the GFC, the purchased protection has provided only a partial offset against movements in valuation of the sold protection as: • one of the purchased protection counterparties defaulted and many of the remaining were downgraded, and
• ANZ makes a credit valuation adjustment on the remaining purchased protection counterparties reflective of
changes to credit worthiness.
ANZ is actively monitoring this portfolio with a view to reducing the exposure via termination and restructuring of both the bought and sold protection if and when the Bank deems it cost effective relative to the perceived risk associated with a specific trade or counterparty. Consistent with this approach the Bank took action on several transactions throughout 2010 which resulted in a total notional reduction of US$2.6 billion leaving the notional outstanding on the sold trades at US$8.4 billion as at September 30, 2010 (September 2009: US$11 billion).
The credit risk expense on structured credit derivatives still remains volatile reflecting the impact of market movements in credit spreads and USD/AUD rates. It is likely there will continue to be substantial volatility in this market value. ANZ is exposed to operational risk, which may adversely affect its results
Operational risk refers to the risk of loss resulting from inadequate or failed internal processes, people and systems, or from external events. Operational risk includes legal risk and the risk of reputational loss, but excludes strategic risk.
Loss from operational risk can include fines, penalties, loss or theft of funds or assets, legal costs, customer compensation, reputational loss, loss of life or injury to people and loss of property and / or information.
Examples of operational risk that ANZ is exposed to include the risks arising from theft, fraud and crime; process error or failure to follow established procedures; operational or system failures; inadvertent violations of money laundering, sanctions or other laws and regulations; external events such as natural disasters, other bank failures, civil unrest and other events that lead to the loss or unavailability of bank property, systems or staff; failure and breach of security, physical protection and recovery systems; failure of third party suppliers or outsourced functions; failure of customer services; product development and maintenance; failure to disclose, provide adequate advice or mis-selling; and breaches of ANZ’s internal policies and of laws and regulations. Similarly, there are operational risks in the management, design and implementation of major projects.
Direct or indirect losses that occur as a result of operational failures, breakdowns, omissions or unplanned events could adversely affect ANZ’s financial results. Disruption of information technology systems or failure to successfully implement new technology systems could significantly interrupt business
ANZ is highly dependent on information systems and technology and there is a risk that these, or the services ANZ uses or is dependent upon, might fail.
25

Most of ANZ’s daily operations are computer-based and information technology systems are essential to maintaining effective communications with customers. The exposure to systems risks includes the complete or partial failure of information technology systems or data center infrastructure, the inadequacy of internal and third-party information technology systems due to, among other things, failure to keep pace with industry developments and the capacity of the existing systems to effectively accommodate growth and integrate existing and future acquisitions and alliances.
To manage some of these risks, ANZ has disaster recovery and systems continuity plans in place. However, any failure of these systems could result in business interruption, loss of customers, financial compensation, damage to reputation and/or a weakening of ANZ’s competitive position and could adversely impact ANZ’s business and have a material adverse effect on ANZ’s financial condition and operations.
In addition, ANZ must update and implement new information technology systems, in part to assist it to satisfy regulatory demands, ensure information security, enhance computer-based banking services for ANZ’s customers and integrate the various segments of its business. ANZ may not organize these implementation projects effectively or execute them efficiently, which could lead to increased project costs, delays in the ability to comply with regulatory requirements, failure of ANZ’s information security controls or a decrease in ANZ’s ability to service its customers.
ANZ is exposed to risks associated with information security, which may adversely affect its financial results and reputation
Information security means protecting information and information systems from unauthorized access, use, disclosure, disruption, modification, perusal, inspection, recording or destruction. As a bank, ANZ handles a considerable amount of personal and confidential information about its customers and its own internal operations.
ANZ Technology employs a team of information risk subject matter experts who are responsible for the development and implementation of ANZ’s Information Security Policy. ANZ is conscious that threats to information security are continuously evolving and as such ANZ takes a proactive approach of conducting regular internal and external reviews to ensure new threats are identified, evolving risks are mitigated, policies and procedures are updated, and good practice is maintained. However, while significant efforts and precautions are taken by ANZ to protect and ensure the confidentiality, integrity and availability of this information, including the use of sophisticated firewalls, network intrusion detection systems, access control processes, data encryption, and the deployment of business controls and processes, there is nevertheless a risk that information may be inadvertently or inappropriately accessed or distributed or illegally accessed or stolen. Any unauthorized use of confidential information could potentially result in breaches of privacy laws, regulatory sanctions, legal action, and claims of compensation or erosion to our competitive market position. Such events could subsequently adversely affect ANZ’s financial position or reputation. ANZ is exposed to reputation risk, which may adversely impact its results
Reputation risk may arise as a result of an external event or ANZ’s own actions and adversely affect perceptions about ANZ held by the public (including our customers), shareholders, investors, regulators or rating agencies. The impact of a risk event on ANZ’s reputation may exceed any direct cost of the risk event itself and may adversely impact ANZ’s earnings, capital adequacy or value. Accordingly, damage to ANZ’s reputation may have wide-ranging impacts, including adverse effects on ANZ’s profitability, capacity and cost of sourcing funding and availability of new business opportunities. The unexpected loss of key staff or inadequate management of human resources may adversely affect ANZ’s results
ANZ’s ability to attract and retain suitably qualified and skilled employees is an important factor in achieving its strategic objectives. At ANZ, there are certain individuals and key executives whose skills, technical knowledge, creativity, inspiration and reputation are critical to setting the strategic direction, successful management and growth of ANZ, and whose unexpected loss due to resignation, retirement, death or illness may adversely affect its operations and financial condition. In addition, ANZ may in the future have difficulty attracting highly qualified people to fill important roles, which could adversely affect its financial performance and results of operations. ANZ may be exposed to the impact of future climate change, geological and other extrinsic events which may adversely affect its results
Scientific observations and climate modeling point to changes in the global climate system that may see extreme weather events increase in both frequency and severity. Among the possible effects of climate change are the risks of volcanoes, severe storms, cyclones, hurricanes, floods and rising sea levels. Such events, and others like them, pose the risk of inundation and damage to the houses and commercial assets of ANZ’s customers. In some cases, this impact may also adversely affect ANZ’s collateral position in relation to credit facilities extended to those customers.
While the future impact of climate change is difficult to predict accurately, it should nevertheless be considered among the risks that may adversely impact ANZ’s financial results in the future.
26
In addition to climatic events, geological events, such as volcanic or seismic activity, or other extrinsic events, such as flu pandemic, can also severely disrupt normal business activity and have a negative effect on ANZ’s customer’s ability to pay interest or repay principal on their loans.
Regulatory changes or a failure to comply with regulatory standards, law or policies may adversely affect ANZ’s business, operations or financial condition
ANZ is subject to laws, regulations, policies and codes of practice in Australia, New Zealand and in the other countries (including but not limited to the United Kingdom, the United States, Hong Kong, Singapore, China and other countries within the Asia Pacific region) in which it has operations, trades or raises funds or in respect of which it has some other connection. In particular, ANZ’s banking, funds management and insurance activities are subject to extensive regulation, mainly relating to our liquidity levels, capital, solvency, provisioning and insurance policy terms and conditions.
Regulations vary from country to country but generally are designed to protect depositors, insured parties, customers with other banking products and the banking and insurance system as a whole.
The Australian Government and its agencies, including APRA, the RBA and other financial industry regulatory bodies including ASIC, have supervisory oversight of ANZ. The New Zealand Government and its agencies, including the RBNZ, have supervisory oversight of ANZ’s operations in New Zealand. To the extent that ANZ has operations, trades or raises funds in, or has some other connection with, countries other than Australia or New Zealand, then such activities may be subject to the laws of, and regulation by agencies in, those countries. Such regulatory agencies include, by way of example, the U.S. Federal Reserve Board, the U.S. Department of Treasury, the U.S. Office of the Comptroller of the Currency, the U.S. Office of Foreign Assets Control (‘OFAC’), the UK’s Financial Services Authority, the Monetary Authority of Singapore, the Hong Kong Monetary Authority, the China Banking Regulatory Commission and other financial regulatory bodies in those countries and in other relevant countries. In addition, ANZ’s expansion and growth in the Asia Pacific gives rise to a requirement to comply with a number of different legal and regulatory regimes across that region.
A failure to comply with any standards, laws, regulations or policies in any of those jurisdictions could result in sanctions by these or other regulatory agencies, the exercise of any discretionary powers that the regulators hold or compensatory action by affected persons, which may in turn cause substantial damage to ANZ’s reputation. To the extent that these regulatory requirements limit ANZ’s operations or flexibility, they could adversely impact ANZ’s profitability and prospects.
Further details of the supervision and regulation of ANZ are contained in the section entitled “Supervision and Regulation” of this U.S. Disclosure Document.
These regulatory and other governmental agencies (including revenue and tax authorities) frequently review banking and tax laws, regulations, codes of practice and policies. Changes to laws, regulations, codes of practice or policies including changes in interpretation or implementation of laws, regulations, codes of practice or policies, could affect ANZ in substantial and unpredictable ways. These may include increasing required levels of bank liquidity and capital adequacy, limiting the types of financial services and products ANZ can offer and/or increasing the ability of non-banks to offer competing financial services or products, as well as changes to accounting standards, taxation laws and prudential regulatory requirements.
As a result of the GFC, regulators have proposed various amendments to financial regulation that may affect ANZ. APRA, the Basel Committee on Banking Supervision (the ‘Basel Committee’) and regulators in other jurisdictions where ANZ has a presence have recently released discussion papers and proposals in regards to strengthening the resilience of the banking sector, including proposals to strengthen capital and liquidity requirements for the sector. In addition, the United States has recently passed into law the Dodd-Frank Wall Street Reform and Consumer Protection Act which significantly affects financial institutions and financial activities in the United States and the potential impacts of this new law are uncertain. The Australian Senate has also announced that it will hold an inquiry into competition within the Australian banking sector as discussed above in the risk factor entitled “Competition may adversely affect ANZ’s results, especially in Australia, New Zealand and the Asian markets in which it operates”.
While uncertainty remains as to the final form that any proposed regulatory changes will take in Australia and other countries in which ANZ operate, any such changes may adversely affect ANZ’s results, operations or financial condition. The changes may lead ANZ to, among other things, incur additional costs as a result of increased management attention, raise additional amounts of higher-quality capital (such as ordinary shares) and hold significant levels of additional liquid assets and undertake additional wholesale long-term funding to replace short-term funding to more closely match ANZ’s long-term asset profile.
27
Unexpected changes to ANZ’s license to operate in any jurisdiction may adversely affect its results
ANZ is licensed to operate in the various countries, states and territories in which it operates. Unexpected changes in the conditions of the licenses to operate by governments, administrations or regulatory agencies which prohibit or restrict ANZ from trading in a manner that was previously permitted may adversely impact ANZ’s financial results. ANZ is exposed to insurance risk, which may adversely affect its results
Insurance risk is the risk of loss due to unexpected changes in current and future insurance claim rates. In life insurance business, insurance risk arises primarily through mortality (death) and morbidity (illness and injury) risks being greater than expected and, in the case of annuity business, should annuitants live longer than expected. For general insurance business, insurance risk arises mainly through weather-related incidents (including floods and bushfires) and other calamities, as well as adverse variability in home, contents, motor, travel and other insurance claim amounts. As a result of ING Australia Limited (‘INGA’) and ING New Zealand Limited (‘INGNZ’) becoming wholly owned subsidiaries of ANZ, ANZ has increased exposure to insurance risk in both life insurance and general insurance business, which may adversely affect its results.
ANZ may experience reductions in the valuation of some of its assets, resulting in fair value adjustments that may have a material adverse effect on its earnings
Under Australian Accounting Standards, ANZ recognizes at fair value:
• financial instruments classified as “held-for-trading” or “designated as at fair value through profit or loss”;
• financial assets classified as “available-for-sale”;
• derivatives; and
• financial assets backing insurance and investment liabilities.
Generally, in order to establish the fair value of these instruments, ANZ relies on quoted market prices or, where the market for a financial instrument is not sufficiently active, fair values are based on present value estimates or other accepted valuation techniques. In certain circumstances, the data for individual financial instruments or classes of financial instruments used by such estimates or techniques may not be available or may become unavailable due to changes in market conditions. In these circumstances, the fair value is determined using data derived and extrapolated from market data and tested against historic transactions and observed market trends.
The valuation models incorporate the impact of factors that would influence the fair value determined by a market participant. Principal inputs used in the determination of the fair value of financial instruments based on valuation techniques include data inputs such as statistical data on delinquency rates, foreclosure rates, actual losses, counterparty credit spreads, recovery rates, implied default probabilities, credit index tranche prices and correlation curves. These assumptions, judgments and estimates need to be updated to reflect changing trends and market conditions. The resulting change in the fair values of the financial instruments could have a material adverse effect on ANZ’s earnings. Changes to accounting policies may adversely affect ANZ’s results
The accounting policies and methods that ANZ applies are fundamental to how it records and reports its financial position and results of operations. Management must exercise judgment in selecting and applying many of these accounting policies and methods so that they not only comply with generally accepted accounting principles but they also reflect the most appropriate manner in which to record and report on the financial position and results of operations. However, these accounting policies may be applied inaccurately, resulting in a misstatement of financial position and results of operations.
In some cases, management must select an accounting policy or method from two or more alternatives, any of which might comply with generally accepted accounting principles and be reasonable under the circumstances, yet might result in reporting materially different outcomes than would have been reported under another alternative. ANZ may be exposed to the risk of impairment to capitalized software, goodwill and other intangible assets that may adversely affect its results
In certain circumstances ANZ may be exposed to a reduction in the value of intangible assets. As at September 30, 2010, ANZ carried a goodwill balance of $4,086 million which principally relates to its investment in ANZNBL and INGA; intangible assets of $1,327 million principally relating to assets recognized on the acquisition of INGA and capitalized software balances of $1,217 million. ANZ is required to assess the recoverability of the goodwill balance on at least an annual basis using either a discounted cash flow or a multiple of earnings calculation. Changes in the assumptions upon which the calculation is based, together with expected changes in future cash flows, could materially impact this
28
assessment, resulting in the potential write-off of a part or all of the goodwill balance. The recoverability capitalized software and other intangible assets is assessed at least annually. In the event that asset is no longer in use, or that the cash flows generated by the asset do not support the carrying value, an impairment may be recorded, adversely impacting ANZ's results. Litigation and contingent liabilities may adversely affect ANZ’s results
From time to time, ANZ may be subject to material litigation, regulatory actions, legal or arbitration proceedings and other contingent liabilities which, if they crystallize, may adversely affect ANZ’s results. Details regarding ANZ’s material contingent liabilities as at September 30, 2010 are contained in Note 44 (“Credit Related Commitments, Guarantees, Contingent Liabilities and Contingent Assets”) of the ANZ Annual Report for the full year ended September 30, 2010. There is a risk that these contingent liabilities may be larger than anticipated or that additional litigation or other contingent liabilities may arise. ANZ Group regularly considers acquisitions and divestments, and there is a risk that ANZ may undertake an acquisition or divestment that could result in a material adverse effect on its performance
ANZ regularly examines a range of corporate opportunities, including material acquisitions and disposals with a view to determining whether those opportunities will enhance ANZ’s financial performance and position. Any corporate opportunity that is pursued could, for a variety of reasons, turn out to have a material adverse effect on ANZ.
The successful implementation of ANZ’s corporate strategy, including its strategy to expand in the Asia-Pacific region, will depend on a range of factors including potential funding strategies and challenges associated with integrating and adding value to an acquired business, as well as new regulatory, market and other risks associated with increasing operations outside of Australia and New Zealand.
There can be no assurance that any acquisition would have the anticipated positive results, including results relating to the total cost of integration, the time required to complete the integration, the amount of longer-term cost savings or the overall performance of the combined entity or an improved price for ANZ’s securities. Integration of an acquired business can be complex and costly, sometimes including combining relevant accounting and data processing systems and management controls, as well as managing relevant relationships with employees, clients, suppliers and other business partners. Integration efforts could divert management attention and resources, which could adversely affect ANZ’s operations or results. Additionally, there can be no assurance that customers, counterparties and vendors of newly acquired businesses will remain as such post-acquisition and the loss of customers, counterparties and vendors could adversely affect ANZ’s operations or results.
Acquisitions and disposals may also result in business disruptions that cause ANZ to lose customers or cause customers to remove their business from ANZ to competing financial institutions. It is possible that the integration process related to acquisitions could result in the disruption of ANZ’s ongoing businesses or inconsistencies in standards, controls, procedures and policies that could adversely affect ANZ’s ability to maintain relationships with clients, customers, depositors and employees. The loss of key employees in connection with an acquisition or disposal could adversely affect ANZ’s ability to conduct its business successfully. ANZ’s operating performance, risk profile or capital structure may also be affected by these corporate opportunities and there is a risk that any of ANZ’s credit ratings may be placed on credit watch or downgraded if these opportunities are pursued.
29

Currency of Presentation, Exchange Rates and Certain Definitions Currency of Presentation
ANZ publishes consolidated financial statements in Australian dollars. In this U.S. Disclosure Document, unless otherwise stated or the context otherwise requires, references to ‘US$’, ‘USD’ and ‘U.S. dollars’ are to U.S. dollars and references to ‘$’, ‘AUD’ and ‘A$’ are to Australian dollars. For the convenience of the reader, this U.S. Disclosure Document contains translations of certain Australian dollar amounts into U.S. dollars at specified rates. These translations should not be construed as representations that the Australian dollar amounts actually represent such U.S. dollar amounts or could be converted into U.S. dollars at the rate indicated. Unless otherwise stated, the translations of Australian dollars into U.S. dollars have been made at the rate of US$0.9640 = A$1.00, the Noon Buying Rate in New York City for cable transfers in Australian dollars as certified for customs purposes by the Federal Reserve Bank of New York (the ‘Noon Buying Rate’) on September 30, 2010. As at November 5, 2010 the Noon Buying Rate was US1.0162 = A$1.00. Exchange Rates
For each of the periods indicated, the high, low, average and period-end Noon Buying Rates for Australian dollars were:
Noon buying rates for Australian dollars Year ended September 30 High Low Average Close
Annual periods
2005 0.7974 0.7207 0.7685 0.7643
2006 0.7781 0.7056 0.7473 0.7461
2007 0.8855 0.7434 0.8163 0.8855
2008 0.9797 0.7831 0.9065 0.7904
2009 0.8824 0.6122 0.7330 0.8824
2010 0.9675 0.8156 0.9013 0.9640 1. The average for annual periods is calculated from the Noon Buying Rate on the last day of each month during the period.
In the fiscal year ended September 30, 2010, 28% (2009: 34%; 2008: 32%) of our operating income was derived from New Zealand and Asia Pacific, Europe & America and was denominated principally in New Zealand dollars (‘NZ$’ or ‘NZD’), U.S. dollars, British pounds sterling (‘£’ or ‘GBP’), Euro (‘€’ or ‘EUR’), Chinese Yuan (‘CNY’) and Malaysian Ringgit (‘MYR’). Movements in foreign currencies against the Australian dollar can therefore affect ANZ’s earnings through the re-translation of overseas profits to Australian dollars. Based on exchange rates applied to convert overseas profits and losses from September 2005 to September 2010, the Australian dollar moved against these currencies as follows (refer also to Note 51 in the 2010 Annual Report):
Australian dollar movement against foreign currencies
Years ended September 30 2010 2009 2008 2007 2006 2005
EURO 23% -1% -1% 0% 1% 1%
GBP 22% 3% 12% -1% 0% 2%
NZD 3% 3% 5% -1% 5% -4%
USD 23% -19% 12% 8% -2% 5%
CNY 22% -22% 3% 4% -5% n/a
MYR 14% -13% 5% 2% -5% n/a ANZ monitors its exposure to revenues, expenses and invested capital denominated in currencies other than Australian dollars. These currency exposures are hedged in accordance with established hedging policies. Refer to note 1(e) of the 2010 Annual Report (contained in Annex A) for details of these hedging policies.
30

Certain Definitions
Our financial year ends on September 30. As used throughout this U.S. Disclosure Document, unless otherwise stated or the context otherwise requires, the fiscal year ended September 30, 2010 is referred to as “2010”, and other fiscal years are referred to in a corresponding manner. Our 2010 and 2009 audited financial results are contained in our 2010 Annual Report (attached as Annex A hereto). Results are analyzed by three geographic regions: (i) Australia, (ii) Asia Pacific, Europe & America and (iii) New Zealand, as well as our global institutional client business, which is viewed as a separate segment but also impacts each region. The results of the Institutional segment are separately tracked and reported but are allocated to the geographic regions to which the Institutional segment results relate for Group segment reporting purposes.
The Group revised its accounting policies on October 1, 2005 to enable the preparation of financial statements that comply with IFRS. The IFRS accounting policies have been consistently applied by all consolidated entities for the years ended September 30, 2010, 2009, 2008 and 2007.
31

Section 3: Operating and Financial Review and Prospects Operating Results
The following discussion of statutory profit is based on the 2010 and 2009 Financial Reports prepared under IFRS. (Refer to the section headed “Selected Financial Data” on page 4 above for a discussion of IFRS).
The analysis that follows discusses results after income tax, unless otherwise stated.
ANZ’s results for the past three years are summarized below and are discussed under the headings of ‘Analysis of Major Income and Expense Items’ and ‘Results by Region’, which follow.
Summary of ANZ’s results over the past three years
2010 2009 2008
$M $M $ M Years ended September 30
Net interest income 10,869 9,888 7,850
Net income from Wealth Management 1,099 230 182 Other operating income 3,724 3,492 4,127
Operating income 15,692 13,610 12,159
Operating expenses (7,304) (6,225) (5,696)
Profit before credit impairment and income tax 8,388 7,385 6,463
Provision for credit impairment charge (1,787) (3,005) (1,948)
Profit before income tax 6,601 4,380 4,515
Income tax expense (2,096) (1,435) (1,188)
Profit for the year 4,505 2,945 3,327
Comprising:
Profit attributable to non-controlling interests (4) (2) (8)
Profit attributable to shareholders of the company 4,501 2,943 3,319
Profit and Loss 2010 ANZ recorded a profit after tax of $4,501 million for the year ended September 30, 2010, an increase of $1,558 million (53%) from $2,943 million for the year ended September 30, 2009. Key factors influencing the increase in profit after tax were:
• Net interest income increased $981 million (10%) from $9,888 million for the year ended September 30, 2009 to $10,869 million for the year ended September 30, 2010. The increase in net interest income primarily resulted from an increase in average interest earning assets of 3% and an increase in average customer deposits of 13% as well as an increase in net interest margin of 16 basis points to 2.47%.
• Net income from wealth management increased $869 million from $230 million for the year ended September 30, 2009 to $1,099 million for the year ended September 30, 2010 primarily as a result of the increase in ownership in INGA and INGNZ from a 51% shareholding to full ownership in November 2009.
• Other operating income increased $232 million (7%) from $3,492 million for the year ended September 30, 2009 to $3,724 million for the year ended September 30, 2010. The main drivers of this increase were:
• An increase over 2009 of $160 million arising from increased volatility from the use of derivatives in economic hedging, including revenue and net investment hedges, with a loss of $328 million for the year ended September 30, 2009 declining to a loss of $168 million for the year ended September 30, 2010.
• An increase of $205 million relating to the ANZ share of the INGNZ investor settlement. During 2009, $173 million was recognized as a reduction to other operating income representing ANZ’s share of the INGNZ investor settlement. During 2010, a gain of $32 million was received associated with an increase in the value of the funds which were frozen in relation to this issue.
• An increase in credit risk on derivatives of $170 million. In 2010 a gain of $35 million was recognized compared to a loss of $135 million in 2009. Refer to page 46 of this U.S. Disclosure Document for further details.
32

• Acquisition valuation loss (-$217 million) in 2010 due to valuation adjustments following the recalculation of the fair value of the Group’s pre-existing 49% interest on acquisition date of INGA and INGNZ (-$185 million) and adjustments to write off previously equity accounted debit available-for-sale reserves (-$32 million).
• An improvement of $160 million in non-continuing businesses associated with the legacy Private equity business.
• Excluding the above items, other operating income decreased $246 million primarily due to Global Markets, with reduced market volatility leading to lower customer hedging activity and reduced trading opportunities.
• The above explanations include the impact of foreign exchange rates during the period. The retranslation of 2009 results at the average rates for the year ended September 30, 2010 would have resulted in an increase of other operating income of 12%.
• Operating expenses increased $1,079 million (17%) from $6,225 million for the year ended September 30, 2009 to
$7,304 million for the year ended September 30, 2010. Of this cost growth, $319 million was due to integration costs associated with the acquisitions of the remaining 51% of INGA and INGNZ, the loan and deposit books of Landmark Financial Services and selected RBS businesses and a further increase of $554 million related to ongoing expenses from these acquisitions. This was partially offset by expenses of $142 million incurred in 2009 in relation to the One ANZ restructure. The remaining cost growth was primarily in Asia Pacific, Europe & America and Institutional as a result of ongoing investment in key strategic markets and infrastructure and system enhancements to support future growth. The above explanations include the impact of foreign exchange rates during the period. The retranslation of 2009 results at the average rates for the year ended September 30, 2010 would have resulted in an increase in operating expenses of 21%.
• Provision for credit impairment charge decreased $1,218 million from $3,005 million for the year ended September 30, 2009 to $1,787 million for the year ended September 30, 2010. The decrease resulted from lower individual and collective provision charges. This reflected a slowing in single name large provisions, a stabilizing loan portfolio and growth in low risk assets.
• ANZ’s effective tax rate for the year ended September 30, 2010 was 31.8%, a decrease of 1.0% from 32.8% for the year ended September 30, 2009. The decrease was due primarily to the New Zealand conduit tax provision and unrealized losses associated with the Offshore Banking unit (‘OBU’) both in 2009 offset by the non-deductible fair value impairment of our interest in INGA and INGNZ, non-deductible RBS integration costs; an unfavorable impact resulting from changes in New Zealand tax legislation; and a higher overseas tax rate differential, all in 2010. Offsetting this reduction was an increase of 2.3% resulting from income tax expense attributable to income relating to policyholder income and contributions tax as a result of the consolidation of OnePath (formerly INGA).
Further details on movements within profit and loss accounts can be found on pages 36 to 43 of this U.S. Disclosure Document.
2009 The Group recorded a profit after tax of $2,943 million for the year ended September 30, 2009, down $376 million (-11%) from $3,319 million for the year ended September 30, 2008. Key factors influencing the decrease in profit after tax were: • Net interest income increased $2,038 million (26%) from $7,850 million for the year ended September 30, 2008 to
$9,888 million for the year ended September 30, 2009. The increase in net interest income primarily resulted from an increase in average interest earning assets of 9% and growth in average deposits and other borrowings of 12% as well as an increase in net interest margin of 28 basis points.
• Net income from wealth management increased by $48 million from $182 million the financial year ended
September 30, 2008 to $230 million for the financial year ended September 30, 2009. • Other operating income decreased $635 million (15%) from $4,127 million for the year ended September 30, 2008
to $3,492 million for the year ended September 30, 2009. The main drivers of this increase were:
• A decrease over 2008 of $639 million arising from volatility from the use of derivatives in economic hedging, which reduced from a gain of $311 million for the year ended September 30, 2008 to a loss of $328 million for the year ended September 30, 2009.
• A gain of $353 million on the sale of Visa shares during 2008, not repeated in 2009.
• A reduction in other operating income in 2009 of $173 million relating to ANZ’s share of the INGNZ investor settlement.
33

Offsetting these reductions were:
• Lower adjustment of $74 million for credit risk on derivatives, which reduced from a loss of $156 million for the year ended September 30, 2008 to a loss of $82 million for the year ended September 30, 2009.
• A reduction in other operating income in 2008 of $127 million relating to a structured transaction (offset in tax expense), not repeated in 2009.
• An increase over 2008 of $340 million resulting from the impact of non-continuing businesses which moved from a loss of $512 million for the year ended September 30, 2008 to a loss of $172 million for the year ended September 30, 2009.
• Operating expenses increased by $529 million (9%) from $5,696 million for the year ended September 30, 2008 to
$6,225 million for the year ended September 30, 2009 with the increase concentrated in our strategic growth area of Asia Pacific, Europe & America. Within the Australia and New Zealand regions, Institutional drove the majority of the cost growth through an increase in frontline staff and remuneration costs associated with attracting and retaining staff. Cost growth in New Zealand was limited to 1%. Offsetting this increase was a reduction in costs associated with organizational transformation and restructuring whereby $142 million was recognized in 2009 compared to $218 million in 2008.
• Provision for credit impairment charge increased $1,057 million from $1,948 million for the year ended September
30, 2008 to $3,005 million for the year ended September 30, 2009. The challenging economic environment, reduced business confidence and rising levels of commercial losses combined to put pressure on the provisioning levels. The individual provision charge increased across all regions, though it was partially offset by a decrease in collective provision charge, primarily as a result of a release of concentration risk provision taken up in 2008 as losses were crystallized, a lower economic cycle adjustment charge and reduced lending volumes.
• The Group’s effective tax rate for the year ended September 30, 2009 was 32.8%, an increase of 6.5% from 26.3%
for the year ended September 30, 2008. This was largely a result of a $196 million provision for New Zealand conduit transactions.
Further details on movements within profit and loss accounts can be found on pages 36 to 43 of this U.S. Disclosure Document.
34
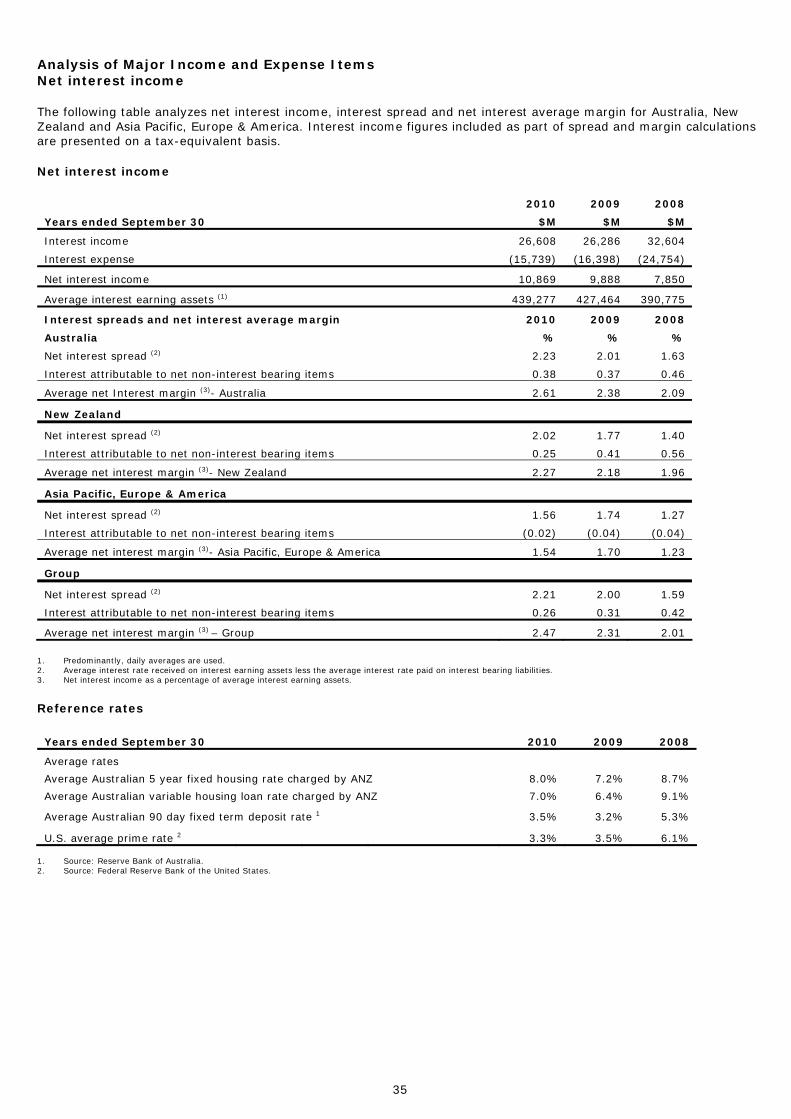
Analysis of Major Income and Expense Items Net interest income
The following table analyzes net interest income, interest spread and net interest average margin for Australia, New Zealand and Asia Pacific, Europe & America. Interest income figures included as part of spread and margin calculations are presented on a tax-equivalent basis.
Net interest income
2010 2009 2008
Years ended September 30 $M $M $M
Interest income 26,608 26,286 32,604
Interest expense (15,739) (16,398) (24,754)
Net interest income 10,869 9,888 7,850
Average interest earning assets (1) 439,277 427,464 390,775
Interest spreads and net interest average margin 2010 2009 2008
Australia % % %
Net interest spread (2) 2.23 2.01 1.63
Interest attributable to net non-interest bearing items 0.38 0.37 0.46
Average net Interest margin (3)- Australia 2.61 2.38 2.09
New Zealand Net interest spread (2) 2.02 1.77 1.40
Interest attributable to net non-interest bearing items 0.25 0.41 0.56
Average net interest margin (3)- New Zealand 2.27 2.18 1.96
Asia Pacific, Europe & America Net interest spread (2) 1.56 1.74 1.27
Interest attributable to net non-interest bearing items (0.02) (0.04) (0.04)
Average net interest margin (3)- Asia Pacific, Europe & America 1.54 1.70 1.23
Group Net interest spread (2) 2.21 2.00 1.59
Interest attributable to net non-interest bearing items 0.26 0.31 0.42
Average net interest margin (3) – Group 2.47 2.31 2.01
1. Predominantly, daily averages are used. 2. Average interest rate received on interest earning assets less the average interest rate paid on interest bearing liabilities. 3. Net interest income as a percentage of average interest earning assets.
Reference rates
Years ended September 30 2010 2009 2008
Average rates
Average Australian 5 year fixed housing rate charged by ANZ 8.0% 7.2% 8.7%
Average Australian variable housing loan rate charged by ANZ 7.0% 6.4% 9.1%
Average Australian 90 day fixed term deposit rate 1 3.5% 3.2% 5.3%
U.S. average prime rate 2 3.3% 3.5% 6.1% 1. Source: Reserve Bank of Australia. 2. Source: Federal Reserve Bank of the United States.
35

2010 Net interest income increased $981 million (10%) from $9,888 million for the year ended September 30, 2009 to $10,869 million for the year ended September 30, 2010.
Volume Average interest earning assets were up $11.8 billion (3%) over 2009. Key factors influencing this result included:
• Average advances increased $0.7 billion, or $5.8 billion (2%) when retranslating 2009 at 2010 average exchange rates, with an increase of $4.1 billion in Australia, primarily in Mortgages ($13.4 billion) (10%), resulted from growth in customer demand for housing loans resulting in increased market share. This was partially offset by reductions in Specialized and Relationship Lending ($7.6 billion) and Markets ($4.2 billion), reflecting a trend of slower business growth in 2010 versus 2009. New Zealand decreased $3.4 billion (4%) or $1.5 billion (2%) when translating 2009 results based on 2010 average exchange rates primarily in Institutional as businesses and households continued to de-leverage and business growth continued to slow. Asia Pacific, Europe & America was flat compared to 2009, however it increased $3.4 billion (19%) when translating 2009 results based on 2010 average exchange rates, reflecting our business acquisitions and other expansion in Asia.
• Other interest earning assets increased by $11.1 billion or 15% due primarily to an increase in trading and available-for-sale assets in response to regulatory liquidity requirements and increased trading activity.
Average deposits and other borrowings increased $15.1 billion (5%) or $24.1 billion (9%) when retranslating 2009 results based on 2010 average exchange rates. Key factors influencing this result included:
• Customer deposits grew by $21.4 billion (10%) or $27.9 billion (13%) when translating 2009 results based on 2010 average exchange rates, with good growth in Australia ($9.0 billion or 6%) due primarily to an uplift in term deposits resulted from competitive pricing and volume. Customer deposits in New Zealand decreased $1.4 billion (3%), however, deposits excluding exchange rates were flat. Customer deposits in Asia Pacific, Europe & America grew by $13.8 billion (46%) or $18.9 billion (77%) when translating 2009 results based on 2010 average exchange rates, resulted from deposit raising strategies and volume.
• Wholesale funding decreased by $6.3 billion (9%) resulted from a decrease in certificates of deposit ($5.2 billion) and commercial paper ($1.0 billion).
Loan capital and bonds and notes increased by $3.8 billion (5%) primarily due to new issuances.
Margin Net interest margin increased by 16 basis points to 2.47%. Key factors influencing this result included:
• Improved asset margin (+37 basis points) from the flow through of repricing activities, particularly in New Zealand and Institutional and improved fee returns in Institutional primarily due to higher commitment fees and line fees.
• Funding and Asset mix changes (+14 basis points) driven primarily by increased capital from the full year impact of the share placement plans in 2009 (+6 basis points), reduced reliance on wholesale funding due to higher customer deposits as a source of funding (+5 basis points), other net funding impacts (+ 1 basis point) and favorable asset mix impact from decline in low margin Institutional assets (+2 basis points).
• Higher cost of deposits (-16 basis points) and higher funding costs (-11 basis points). Deposits costs were higher primarily due to competitive pressures (-8 basis points), continued customer migration to lower margin deposit products (-4 basis points) and lower returns from the replicating portfolio (-4 basis points).
• Higher funding costs (-11 basis points) were mainly due to an increase in wholesale funding costs.
• Other items (+4 basis points) includes a favorable impact (+2 basis points) from the acquisition of higher margin assets (RBS businesses and Landmark), favorable movement in brokerage costs (+1 basis point) following a write down of Esanda capitalized brokerage costs in 2009 and other net impacts (+1 basis point).
• Global Markets had a -12 basis points impact on the total Group margin. Net interest movements (-3 basis points) due to the impact of funding costs associated with unrealized trading gains on derivatives (-8 basis points), mismatch outcome (+3 basis points) and other net impacts (+2 basis points). The dilution impact of the Global Markets balance sheet on the Group (-9 basis points) resulted from growth in trading and investment assets.
2009 Net interest income increased $2,038 million (26%) from $7,850 million for the year ended September 30, 2008 to $9,888 million for the year ended September 30, 2009.
36

Volume
Average interest earning assets increased $36.7 billion (9%). Key factors influencing this result included:
• Net advances grew by $23.0 billion (7%). Net advances in Australia grew by $16.7 billion (7%), primarily in Mortgages ($15.1 billion), reflecting increased market share and customer demand, and Specialized Lending ($1.4 billion). Net advances in New Zealand grew $1.8 billion or 2%. However, excluding the impact of exchange rate movements, growth was $3.9 billion or 5%, due mainly to the Rural, Retail and Commercial Banking businesses. Net advances in Asia Pacific, Europe & America grew by $4.5 billion or 26%. Growth, excluding the impact of exchange rate movements, was $1.1 billion, mainly in Asia, reflecting the ongoing business expansion in the region.
• Other interest earning assets increased by $13.7 billion or 22%. Excluding the impact of exchange rate movements, other interest earning assets increased by $8.0 billion resulted from increases in trading and available-for-sale assets ($6.2 billion), interbank lending ($1.6 billion) and higher liquid assets ($1.5 billion).
Average deposits and other borrowings increased $31.6 billion (12%) from $260.5 billion in 2008 to $292.1 billion in 2009. Key factors influencing this result included:
• Customer deposits grew by $31.1 billion (16%). Customer deposits in Australia grew by $19.8 billion (16%) due primarily to an uplift in term deposits resulted from competitive pricing and customer acquisition. Customer deposits in New Zealand grew by $0.6 billion (1%, or $1.9 billion, 4% excluding the impact of exchange rate movements), largely in the Retail and Markets businesses. Customer deposits in Asia Pacific, Europe & America grew by $10.7 billion (57% or $6.7 billion, 29% excluding the impact of exchange rate movements), across all countries resulted from deposit raising strategies and customer acquisitions.
• Wholesale funding increased by $0.5 billion. Excluding the impact of exchange rate movements, wholesale funding decreased by $1.6 billion or 2%, driven mainly by a decrease in commercial paper as a result of the global credit market conditions and growth in customer deposits.
Loan capital and Bonds and notes increased by $1.1 billion (1%), in part due to the switch from shorter term wholesale funding.
Margin
Net interest margin increased by 16 basis points to 2.29% after adjusting for the impact of funding benefits associated with unrealized trading gains and losses on derivatives (+12 basis points, $524 million) offset in profit on trading instruments. Key factors influencing this result included:
• Improved asset margin from asset repricing activities and rate adjustments (+45 basis points) offset by higher funding primarily due to an increase in wholesale funding costs (-6 basis points), lower margin on deposits (-28 basis points) and lower interest on capital (-7 basis points).
• Markets (+5 basis points) continued to perform strongly in its balance sheet businesses (+8 basis points) partly offset by the mix impact of Markets balance sheet on the Group (-3 basis points).
• Additional capital raised during 2009, mainly through the share purchase and share placement plans, had a +4 basis points mix impact on margin.
• Other Asset and Funding mix changes (+4 basis point) were due to a lower proportion of wholesale funding (+7 basis points) and a favorable benefit from non interest bearing items (-3 basis point). Asset mix impact was neutral.
• Other items (-1 basis point) include New Zealand lower mortgage prepayment income (-1 basis point) resulted from the downward movement in New Zealand market rates, higher subordinated debt premiums (-1 basis point) and other net impacts (+1 basis point).
37

Net Income from Wealth Management Years ended September 30 2010 2009 2008
$M $M $M
Net income from wealth management 1,099 230 182
2010 Net income from wealth management increased $869 million to $1,099 million for the year ended September 30, 2010. Major movements include the contribution from OnePath (formerly INGA) of $752 million and INGNZ of $98 million following the acquisition of INGA and INGNZ to take full ownership. 2009 Net income from wealth management increased $48 million to $230 million for the year ended September 30, 2010. The increase resulted in increased Private Banking and wealth management activities in New Zealand. Other Operating Income Years ended September 30 2010 2009 2008
$M $M $M
Net fee and commission income 2,324 2,397 2,474
Foreign exchange earnings 747 962 708
Profit on trading instruments 354 168 (377)
Other income/(loss) 299 (35) 1,322
Total other operating income 3,724 3,492 4,127
2010 Other operating income increased $232 million (7%) from $3,492 million for the year ended September 30, 2009 to $3,724 million for the year ended September 30, 2010. Major movements included: • Lending fee income decreased $50 million (7%) from $684 million for the year end ended September 30, 2009 to
$634 million for the year ended September 30, 2010. Movements included:
• Australia decreased $36 million due mainly to a reduction in exception fees and Global Markets’ fees partly
offset by increased fees in other parts of Institutional. • Asia Pacific, Europe & America increased $1 million due mainly to business expansion in China, Philippines
and Indonesia offset by a reduction due to the movement in foreign exchange rates. • New Zealand decreased $15 million due mainly to a reduction in exception fees. • Non-lending fee income decreased $23 million (1%) from $1,713 million for the year ended September 30,
2009 to $1,690 million for the year ended September 30, 2010. Movements include:
• Australia decreased $51 million with lower exception fees partly offset by higher fees in Institutional and other
Retail fees. • Asia Pacific, Europe & America increased $71 million due mainly to increased volumes in Singapore and Hong Kong
and increased non-lending fee income of $48 million due to the acquisition of RBS assets, partly offset by a reduction due to the movement in foreign exchange rates.
• New Zealand decreased $43 million mainly due to a reduction in exception fees and re-pricing New Zealand’s lending book for credit risk.
Foreign exchange earnings decreased $215 million (22%) from $962 million for the year ended September 30, 2009 to $747 million for the year ended September 30, 2010 with lower Global Markets income, partly offset by increased volumes and re-pricing of Global Markets’ lending book.
Profit on trading instruments increased $186 million from $168 million for the year ended September 30, 2009 to
$354 million for the year ended September 30, 2010 principally due to an increase in credit risk on derivatives of $170 million. In 2010 a gain of $35 million was recognized on the Group’s structured credit intermediation trades compared to a loss of $135 million in 2009. Refer to page 46 of this U.S. Disclosure Document for further details.
38

Other income increased by $334 million in 2010 from a loss of $35 million for the year ended September 30, 2009
to $299 million for the year ended September 30, 2010. Other income was impacted by the following factors:
Acquisition valuation loss (-$217 million) in 2010 due to valuation adjustments following the recalculation of the fair value of the Group’s pre-existing 49% interest on acquisition date ($185 million) and adjustments to write off previously equity accounted debit available-for-sale reserves ($32 million).
An increase in the adjustment for economic hedging of $160 million with fair value losses of $199 million in 2010
compared to fair value losses of $358 million in 2009, principally due to:
• Funding swaps hedged by derivatives (a reduction of $204 million) are primarily foreign exchange rate swaps which are used to convert the proceeds of foreign currency debt issuances into floating rate Australian dollar and New Zealand dollar debt.
• Volatility arising from the use of fair value options on own debt hedged by derivatives (a $275 million increase). This resulted from a widening of credit spreads since September 2009.
• The gain arising from the ineffective portion of cash flow and fair value hedges (an increase of $85 million). This largely relates to the valuation of floating legs of swaps.
• Other income in non-continuing businesses of $38 million, an increase of $153 million from a $115 million loss in 2009 primarily due to gains/ (losses) on assets in the alternative asset and private equity businesses.
Other income increased by $22 million in 2010 due to an increase in value of the ING Diversified Yield Fund and the
ING Regular Income Fund held by ANZ following the INGNZ investor settlement compared to the initial amount provided during 2009 of $173 million, resulting in an increase of $195 million. Refer to Note 44 of the 2010 ANZ Annual Report.
Excluding the items mentioned above, other income increased by $44 million:
• Australia decreased $33 million largely from reduced equity accounted earnings from the ANZ-ING joint venture partially offset by increased insurance premiums in Mortgages.
• Asia Pacific, Europe & America increased $104 million largely as a result of higher profit from our Asia Partnerships business. 2010 included a $25 million reversal of the write down of the investment in Saigon Securities Incorporation (‘SSI’) originally booked in 2009, non-recurrence of a $14 million mark-to-market loss on Panin warrants booked in 2009 and higher equity accounted earnings (up $39 million) in Panin and AMMB Holdings Berhad (‘AMMB’). These were partly offset by lower earnings in Shanghai Rural Commercial Bank (‘SRCB’) and Bank of Tianjin (‘BoT’). Higher other income of $69 million included an increase in Europe of $11 million, a $16 million increase in Singapore due mainly to the sale of available-for-sale securities.
• New Zealand decreased $27 million due mainly to the sale of 16 bank branches in 2009. Global Markets income revenue decreased by 12% in total across the various income categories with reduced market volatility leading to lower customer hedging activity and reduced trading opportunities. 2009 Other operating income decreased $635 million (15%) from $4,127 million for the year ended September 30, 2008 to $3,492 million for the year ended September 30, 2009. Significant factors impacting other operating income are as follows:
• Net fee and commission income decreased $77 million (3%) from $2,474 million for the year ended September 30, 2008 to $2,397 million for the year ended September 30, 2009:
• Lending fee income increased $89 million (15%) from $595 million for the year ended September 30, 2008 to $684 million for the year ended September 30, 2009 due mainly to the Institutional businesses across the regions. Movements include:
• Australia increased $110 million mainly due to Global Markets up $36 million with higher fees in the securitization business; growth in volumes drove a $24 million increase in Relationship Lending; Transaction Banking increased $11 million and Consumer Cards and Unsecured Lending increased $9 million primarily reflecting volume growth.
39

• Asia Pacific, Europe & America increased $40 million mainly resulted from an increase in Hong Kong of $26 million and a $10 million increase across countries within South Asia due to pricing initiatives.
• New Zealand decreased $61 million primarily reflecting a transfer to net interest income.
• Non-lending fee income decreased $166 million (9%) with the major movements being:
• Australia decreased $136 million with the major reductions being Investment & Insurance Products decreasing $48 million due to a decline in earnings as a result of the downturn in investment markets, Relationship Banking decreased $18 million and Specialized Lending reduced $17 million both resulted from lower volumes.
• Asia Pacific, Europe & America increased $34 million as a result of growth in card fees resulted from higher Indonesian volumes and an increase in Singapore due to volume growth in Specialized Lending.
• New Zealand decreased $64 million; however, excluding the impact of exchange rates, the decrease was $11 million, with a $9 million reduction in Retail primarily as a result of lower transactional volumes.
• Foreign exchange earnings increased $254 million (36%) from $708 million for the year ended September 30, 2008 to $962 million for the year ended September 30, 2009. Foreign exchange earnings in Australia increased $125 million, with a $134 million increase in Markets, primarily as a result of volatility in global currency markets and higher sales volumes and an $18 million increase in Transaction Banking resulted from exchange rate market volatility, but offset by a $30 million reduction in Group Center as a result of lower revenue hedge gains. Foreign exchange earnings in Asia Pacific, Europe & America grew $104 million, with North Asia up $33 million reflecting increased earnings in Taiwan and Korea. UK & Europe increased $27 million as a result of volatility in global currency markets and higher sales volumes. South Asia was $25 million higher due to market volatility resulting in increased earnings in Indonesia. Pacific was $12 million higher due to increased earnings in Papua New Guinea. Foreign exchange earnings in New Zealand increased $25 million due to strong Institutional earnings.
• Profit on trading instruments increased $545 million from a loss of $377 million for the year ended September 30, 2008 to $168 million for the year ended September 30, 2009. This was impacted by the following factors:
• An increase of $552 million for credit risk on derivatives, which reduced from a loss of $687 million for the year ended September 30, 2008 to a loss of $135 million for the year ended September 30, 2009.
• An increase of $127 million relating to a structured transaction in 2008 which reduced profit on trading instruments (with an offset in tax expense), not repeated in 2009.
Excluding the items mentioned above profit on trading instruments decreased by $134 million which included a $524 million decrease in unrealized trading gains directly offset in net interest income. Excluding this offset, the Markets business performed strongly, benefiting from increased volatility in the interest rate market and higher sales volumes.
• Other income decreased $1,357 million from $1,322 million for the year ended September 30, 2008 to a loss of $35 million for the year ended September 30, 2009. Other income was impacted by the following factors:
• A decrease over 2008 of $706 million arising from volatility from the use of derivatives in economic hedging, which reduced from a gain of $348 million for the year ended September 30, 2008 to a loss of $358 million for the year ended September 30, 2009.
• A decrease of $353 million following a gain on the sale of Visa shares during 2008, not repeated in 2009.
• A reduction in other operating income in 2009 of $173 million relating to ANZ’s share of the INGNZ investor settlement.
• A decrease of $113 million relating to non-continuing businesses (excluding credit intermediation trades) with losses during 2009 of $115 million compared to a loss of $2 million during 2008.
Excluding the items mentioned above, other income decreased by $12 million primarily due to:
• Asia Pacific, Europe & America increased $123 million with North Asia $170 million higher principally as a result of higher equity accounted income from our investments in Shanghai Rural Commercial Bank (‘SRCB’) and Bank of Tianjin (‘BoT’). ANZ’s equity accounted earnings benefited by approximately $95 million from adjustments relating to an improved assessment of credit provisioning requirements. South Asia decreased $35 million due to a $40 million turnaround in the mark-to-market value of Panin Warrants ($14 million loss in 2009 and a $26 million gain in 2008), a $25 million write-down of our investment in Saigon Securities Incorporated (‘SSI’) and a non recurrence of a $17 million mark-to-market gain on SSI options in 2008, offset by $47 million higher equity accounted earnings from our investment in AMMB Holdings Berhad (‘AMMB’) following the increase in our ownership to 24% from 19%.
• Australia decreased $141 million with Group Center $56 million lower principally due to property sale profits booked in 2008. INGA earnings declined $51 million as a result of the downturn in investment markets. Markets decreased $31 million due mainly to the deconsolidation of Stadium Australia during 2008.
40

Operating Expenses
2010 2009 2008
Years ended September 30 $M $M $M
Personnel expenses 4,227 3,598 3,261
Premises expenses 636 559 514
Computer expenses 866 768 609
Other expenses 1,541 1,170 1,131
Restructuring costs 34 130 181
Total Operating Expenses 7,304 6,225 5,696
2010
Operating expenses increased $1,079 million (17%) from $6,225 million for the year ended September 30, 2009 to $7,304 million for the year ended September 30, 2010 with cost growth primarily in Asia Pacific, Europe & America and Institutional as a result of ongoing investment in key strategic markets and infrastructure and system enhancements to support future growth. Significant factors impacting operating expenses are as follows:
• Personnel expenses increased $629 million (17%) including an increase of $75 million relating to costs associated with the ING, Landmark and RBS asset acquisitions. In addition, personnel expenses increased as a result of annual salary increases and a 10% increase in staff numbers, primarily in Asia Pacific, Europe & America. Staff numbers in Asia Pacific, Europe & America increased by 4,987 employees (including 2,786 from the RBS acquisitions) due to continued growth in Asia.
• Premises costs increased $77 million (14%) reflecting higher staff numbers and an investment in upgrading our premises. This includes a $26 million increase in utilities and other outgoings, including a $9 million increase in repairs and maintenance, a $6 million increase in security costs and a $5 million increase in power costs resulted from an increased space requirement for increased staff numbers. Depreciation was $19 million higher primarily due to the ANZ Center.
• Computer costs increased $98 million (13%) primarily due to a $60 million increase in depreciation and amortization from our significant investment in technology.
• Other expenses increased $371 million (32%) including an increase of $222 million relating to costs associated with the ING, Landmark and RBS asset acquisitions. In addition, professional fees increased $153 million with increases in Technology, Institutional and Group Center primarily due to ANZ’s expansion and process improvement initiatives.
• Restructuring costs decreased by $96 million from $130 million in 2009 to $34 million in 2010. In 2009, $118 million of restructuring costs were incurred during the One ANZ organizational restructure.
2009
Operating expenses increased $529 million (9%) from $5,696 million for the year ended September 30, 2008 to $6,225 million for the year ended September 30, 2009. Significant factors impacting operating expenses are as follows:
• Personnel costs were up $337 million (10%) as a result of growth in remuneration costs associated with attracting
and retaining talent and additional bankers and specialists to support growth. Asia Pacific, Europe & America increased staff numbers by 827 employees primarily due to continued growth in the business.
• Premises costs increased $45 million (9%), driven mainly by a $30 million higher rental expense reflecting additional space requirements, the impact of the sale and leaseback program and market rental growth.
• Computer costs grew $159 million (26%), primarily due to increased software purchased of $50 million including higher license costs and increasing technology initiatives, higher amortization charges of $31 million, a $24 million increase in software written-off, a $21 million increase on computer contractors, $11 million increase in rentals and repairs, $8 million higher data communications costs and a $13 million increase in other computer costs which include super regional network costs.
• Other expenses increased $39 million (3%) with minor movements across many categories. Professional fees grew $21 million including an increase in Group Center primarily due to various project work. Advertising costs increased $13 million due mainly to increased marketing costs in South Asia. Card processing costs increased $9 million reflecting increased volumes. New Zealand other expenses increased $26 million including the impact from the acquisition of a controlled entity during the second half of 2008. Travel costs reduced $20 million due to increased focus on cost management.
41

• Restructuring costs decreased by $51 million with costs of $130 million during 2009 relating to the One ANZ organizational restructure compared to costs of $181 million during 2008 relating to organizational transformation initiatives.
Pension Payments
Pension payments are the principal post-retirement benefit. Other post-retirement benefits are not material. Health care is provided to Australian citizens by the government. Accordingly, ANZ does not provide post-retirement health insurance in Australia. Some post-retirement health care is provided in Japan and the UK.
Under IFRS, the Group is required to recognize surpluses (assets) and/or deficits (liabilities) that arise within these schemes in the Balance Sheet. The Group elected to apply the option under IFRS to recognize actuarial gains and losses associated with these schemes in the Balance Sheet (i.e. the ‘direct to retained earnings’ approach). The non-cash expense (representing the notional cost of the benefits accruing to members in respect of service provided over the reporting period) is charged to the Income Statement.
Refer to Note 45 in the 2010 Annual Report (attached to this U.S. Disclosure Documents as Annex A) for further detail.
42

Provision for Credit Impairment charge
Provision for Credit
Impairment
Individual Provision for Credit
Impairment
Provision for Credit
Impairment
Individual Provision for Credit
Impairment
Provision for Credit
Impairment
Individual Provision for Credit
Impairment
2010 2010 2009 2009 2008 2008 Years ended September 30 $M $M $M $M $M $M
Australia 1,271 1,276 2,008 2,148 1,487 814 Asia Pacific, Europe & America 154 153 275 122 205 157
New Zealand 362 362 722 500 256 159
Totals 1,787 1,791 3,005 2,770 1,948
1,130
Under International Financial Reporting Standards (‘IFRS’), the provision for credit impairment charge represents management's best estimate of incurred loss. The estimated incurred loss is calculated as the difference between the asset’s carrying amount and the present value of estimated future cash flows discounted at the asset’s original effective interest rate.
The provision for credit impairment charge consists of two components: the net individual provision for credit impairment charge and the collective provision for credit impairment charge.
Credit impairment provisions are raised when there is objective evidence of impairment. Impairment is assessed individually for financial assets that are individually significant (or on a portfolio basis for small value loans) and then on a collective basis for those loans not individually known to be impaired.
Under IFRS, a discounted cash flow methodology is used to calculate the individual provision for credit impairment
Under IFRS, the collective provision for credit impairment charge is calculated for financial assets for which there is an incurred loss but the financial assets have not been individually identified as impaired.
The collective provision for credit impairment charge is calculated as the change in the collective provision for credit impairment during the reporting period. The collective provision for credit impairment at the end of the reporting period reflects the impact on estimated future cash flows for loans where there is an incurred loss and that loss will become observable over an emergence period. The emergence period represents the time from when a loss event occurs until the Group assesses the loan for individual impairment and raises a provision. The impact on estimated future cash flows is calculated based on historical loss experience for assets with credit characteristics similar to those in the collective pool.
The provision for credit impairment charge is calculated by identifying objective evidence of impairment. In assessing the impacts of adopting IFRS standards and preparing for Basel accreditation, the Group performed a detailed analysis of historical incurred losses in both the retail loan portfolio and the wholesale loan portfolio. This analysis identified the events that triggered the losses in these portfolios and resulted in an estimate of the average period between the time when the loss events occurred until the Group assessed the loans for individual impairment and made a provision for credit impairment. The Group considers this period to be the emergence period. The emergence period for retail portfolios was determined based on historical economic modeling. The “emergence period” for wholesale portfolios was determined based on a defaulted loan file review. 2010
Total credit impairment charge relating to lending assets, commitments and debt securities classified as available-for-sale assets decreased $1,218 million (41%) from $3,005 million as at September 30, 2009 to $1,787 million as at September 30, 2010, as the global economy began to recover from higher levels of bankruptcies, business liquidations and commercial losses and a reduction in the number of large single name impaired assets.
The individual provision charge decreased $979 million to $1,791 million (35%), primarily due to reductions in Australia and New Zealand. The decrease in Australia of $872 million mainly reflected the reduction in the number of large single
43
name provisions raised within the Australian Institutional portfolio. The decrease in New Zealand of $138 million was mainly due to a reduction of previously recorded impairment charges and recoveries. These reductions were partially offset by an increase of $31 million in Asia Pacific, Europe & America.
The collective provision charge decreased $239 million during the year to a release of $4 million, with decreases in New Zealand and Asia Pacific, Europe & America offset by an increase in Australia. The charge for Australia increased $128 million reflecting releases for migrations to impaired status in 2009. The New Zealand charge decreased $215 million following the high charge in 2009 and recognizing some stabilization in credit conditions. The charge for Asia Pacific, Europe & America decreased by $127 million as releases from large customer upgrades offset growth in the corporate business compared to the high charge for risk in 2009 which recognized the stress in global credit markets. 2009
Total credit impairment charge relating to lending assets, commitments and debt securities classified as available-for-sale assets increased $1,057 million (54%) from $1,948 million as at September 30, 2008 to $3,005 million as at September 30, 2009.
The challenging economic environment, reducing business confidence and rising levels of commercial losses combined to put pressure on the provisioning levels. The individual provision charge increased across all regions partially offset by a decrease in collective provision charge, primarily as a result of a release of concentration risk provision taken up in 2008 as losses were crystallized, a lower economic cycle adjustment charge and reduced lending volumes.
Total individual provision charge increased $1,640 million from $1,130 million as at September 30, 2008 to $2,770 million as at September 30, 2009. The increase in Australia of $1,334 million resulted from higher loss rates across all portfolios within the region, and rising levels of bankruptcies and commercial losses in line with higher business liquidations and lower realizable asset values, as well as the large single provisions raised for customers within the Commercial Property, Finance and Brokering Services portfolios in Institutional Australia. The increase in New Zealand of $341 million occurred across all segments as weaker global and local economic conditions impacted export, household incomes, consumer spending and business sectors. The Asia Pacific, Europe & America decreased $35 million with credit losses on assets held in the liquidity portfolio incurred in 2008 partially offset by an increase in 2009 primarily due to higher losses in South Asia, Indonesia Cards as well as commercial property downgrades in Cambodia and North Asia.
The collective provision charge decreased $583 million (-72%) from $818 million as at September 30, 2008 to $235 million as at September 30, 2009. The collective provision charge decreased in Australia by $809 million due mainly to lower institutional lending and concentration provision releases following defaults by a number of large customers within Institutional crystallizing losses which were provided for in 2008. This was partly offset by increases within the Cards portfolio primarily due to higher delinquencies and bankruptcies, and risk deterioration in Esanda and Investment and Insurance Products. The New Zealand charge increased $127 million reflecting a rise in unsecured consumer delinquencies and a weakening risk profile across the portfolio. Unfavorable risk movements were also experienced in Asia Pacific, Europe & America, particularly across Europe and America and this, coupled with refinements to methodology, resulted in increased charges of $106 million.
44

Credit Risk on Derivatives
ANZ recognized an expense of $35 million on credit risk on derivatives (comprising structured credit intermediation trades and impaired derivatives transacted with corporate customers) during the year ended September 30, 2010 (2009: $135 million, 2008: $687 million). Years ended September 30 2010 2009 2008 $m $m $m Credit intermediation trade related1 (69) 53 531 Credit risk on impaired derivatives 34 82 156
Credit risk on derivatives (35) 135 687 1.
In 2009 and 2010 ANZ partially hedged the foreign currency exposure relating to structured credit intermediation trades. Included in the 2010 result is a $14 million loss on foreign currency hedges (2009: $155 million). All hedges were closed out before March 2010.
Structured credit intermediation trades
ANZ entered into a series of structured credit intermediation trades from 2004 to 2007. The underlying structures involved credit default swaps (‘CDSs’) over synthetic collateralized debt obligations (‘CDOs’), portfolios of external collateralized loan obligations (‘CLOs’) or specific bonds/floating rate notes (‘FRNs’). ANZ sold protection using credit default swaps over these structures and then to mitigate risk purchased protection via credit default swaps over the same structures from eight U.S. financial guarantors.
Being derivatives, both the sold protection and purchased protection are marked-to-market. Prior to the commencement of the global financial crisis, movements in valuations of these positions were not significant and largely offset each other in income. Following the onset of the financial crisis, the purchased protection has provided only a partial offset against movements in valuation of the sold protection as: one of the purchased protection counterparties defaulted and many of the remaining were downgraded, and a credit valuation adjustment was applied to the remaining purchased protection counterparties reflective of
changes to their credit worthiness.
ANZ is actively managing this portfolio with a view to reduce the exposure via termination and restructuring of both the bought and sold protection. All of the sold protection trades on which the purchased protection counterparty has defaulted have been terminated or have matured. Other sold protection trades were also terminated or matured in 2010 with the notional amount on the outstanding sold trades at September 30, 2010 being US$8.4 billion (2009: US$11.0 billion).
The cumulative costs include realized losses relating to restructuring of trades in order to reduce risks and realized losses on termination of sold protection trades. It also includes foreign exchange hedging losses.
The credit risk expense on structured credit derivatives still remains volatile reflecting the impact of market movements in credit spreads and USD/AUD rates. It is likely there will continue to be volatility in this market value. The overall credit exposure however is significantly reduced reflecting reduction in credit spreads, relative stabilization in the credit markets and progress in unwinding these trades. The remaining trades continue to be actively managed with a view to termination where appropriate opportunities arise.
45
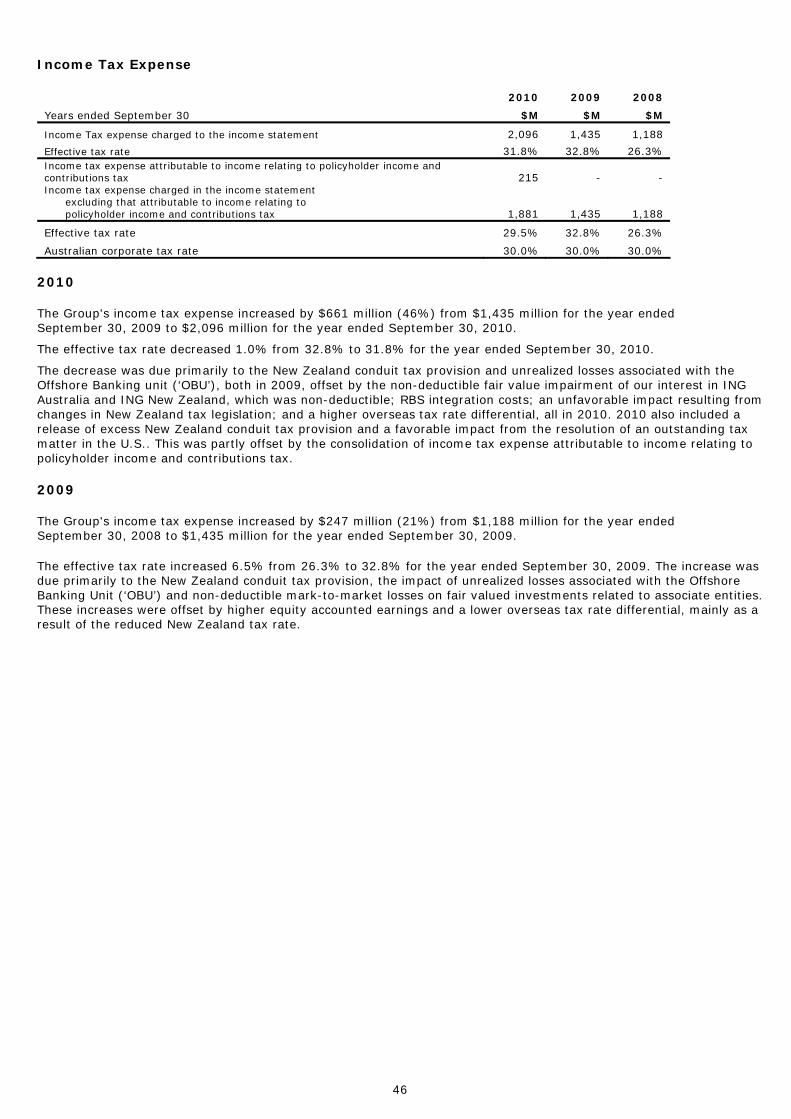
Income Tax Expense 2010 2009 2008
Years ended September 30 $M $M $M
Income Tax expense charged to the income statement 2,096 1,435 1,188
Effective tax rate 31.8% 32.8% 26.3% Income tax expense attributable to income relating to policyholder income and contributions tax 215 - - Income tax expense charged in the income statement excluding that attributable to income relating to policyholder income and contributions tax 1,881 1,435 1,188
Effective tax rate 29.5% 32.8% 26.3%
Australian corporate tax rate 30.0% 30.0% 30.0%
2010
The Group's income tax expense increased by $661 million (46%) from $1,435 million for the year ended September 30, 2009 to $2,096 million for the year ended September 30, 2010.
The effective tax rate decreased 1.0% from 32.8% to 31.8% for the year ended September 30, 2010.
The decrease was due primarily to the New Zealand conduit tax provision and unrealized losses associated with the Offshore Banking unit (‘OBU’), both in 2009, offset by the non-deductible fair value impairment of our interest in ING Australia and ING New Zealand, which was non-deductible; RBS integration costs; an unfavorable impact resulting from changes in New Zealand tax legislation; and a higher overseas tax rate differential, all in 2010. 2010 also included a release of excess New Zealand conduit tax provision and a favorable impact from the resolution of an outstanding tax matter in the U.S.. This was partly offset by the consolidation of income tax expense attributable to income relating to policyholder income and contributions tax. 2009
The Group's income tax expense increased by $247 million (21%) from $1,188 million for the year ended September 30, 2008 to $1,435 million for the year ended September 30, 2009.
The effective tax rate increased 6.5% from 26.3% to 32.8% for the year ended September 30, 2009. The increase was due primarily to the New Zealand conduit tax provision, the impact of unrealized losses associated with the Offshore Banking Unit (‘OBU’) and non-deductible mark-to-market losses on fair valued investments related to associate entities. These increases were offset by higher equity accounted earnings and a lower overseas tax rate differential, mainly as a result of the reduced New Zealand tax rate.
46

Results by Geographic Region On October 1, 2008 the Group moved to a new business model and organizational structure with the creation of three segments based on the geographic regions in which the Group operates (Australia, New Zealand and the combined Asia Pacific, Europe & America). The Institutional division is managed on a global basis. The results of the Institutional segment are separately tracked and reported but are allocated to the geographic regions to which the Institutional results relate for Group segment reporting purposes. Through September 30, 2008, the Group operated four divisions (Personal, Institutional, New Zealand and Asia Pacific), a separate structure for INGA joint venture and a Group Center for centralized group functions and Private Banking. The 2008 segment results for the Personal and Institutional segments have been reallocated to the geographic regions for purposes of comparability with the 2009 and 2010 segment results.
2010 2009 2008
Years ended September 30 $M $M $M
Profit before income tax
Australia 5,064 3,041 2,863
Asia Pacific, Europe & America 570 836 473
New Zealand 967 503 1,179
Total profit before income tax 6,601 4,380 4,515
Income tax expense Australia (1,760) (955) (754)
Asia Pacific, Europe & America (57) (136) (86)
New Zealand (279) (344) (348)
Total income tax expense (2,096) (1,435) (1,188)
Outside equity interests Australia - (2) (2)
Asia Pacific, Europe & America (4) - (6)
New Zealand - - -
Total non-controlling interests (4) (2) (8)
Profit after income tax and non-controlling interests Australia 3,304 2,084 2,107
Asia Pacific, Europe & America 509 700 381
New Zealand 688 159 831
Total profit attributable to shareholders 4,501 2,943 3,319
47
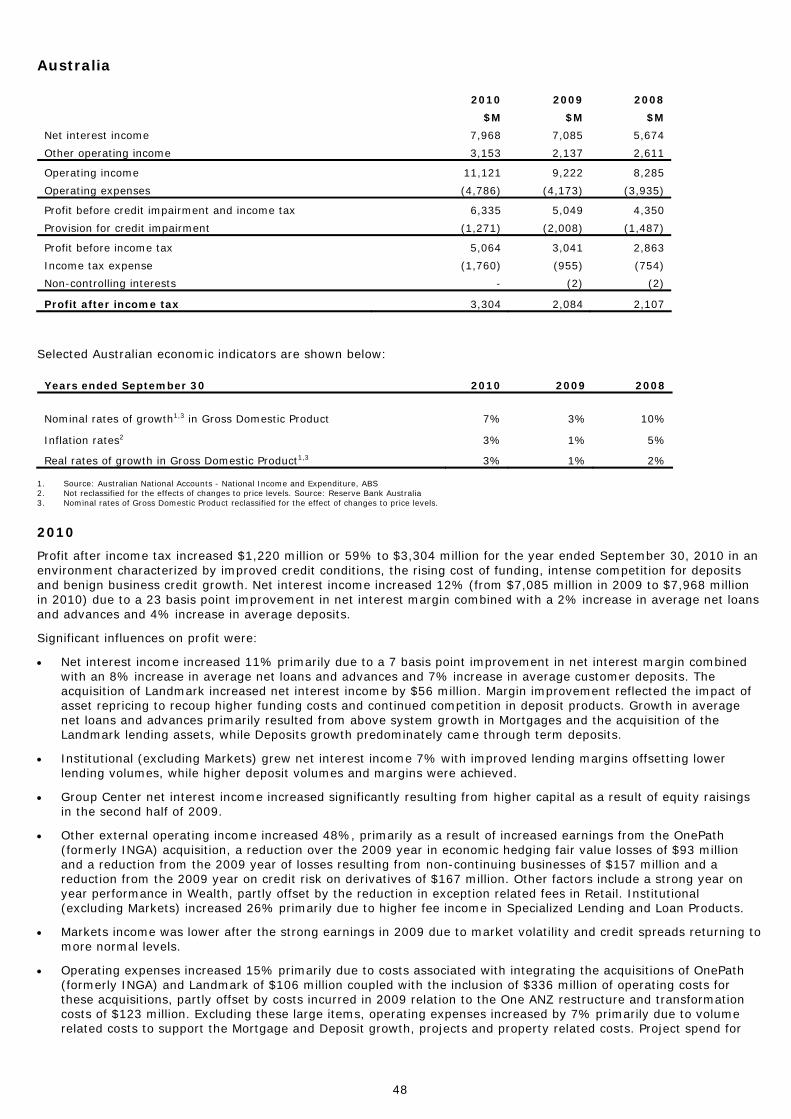
Australia 2010 2009 2008
$M $M $M
Net interest income 7,968 7,085 5,674
Other operating income 3,153 2,137 2,611
Operating income 11,121 9,222 8,285
Operating expenses (4,786) (4,173) (3,935)
Profit before credit impairment and income tax 6,335 5,049 4,350
Provision for credit impairment (1,271) (2,008) (1,487)
Profit before income tax 5,064 3,041 2,863
Income tax expense (1,760) (955) (754)
Non-controlling interests - (2) (2)
Profit after income tax 3,304 2,084 2,107
Selected Australian economic indicators are shown below: Years ended September 30 2010 2009 2008
Nominal rates of growth1,3 in Gross Domestic Product 7% 3% 10%
Inflation rates2 3% 1% 5%
Real rates of growth in Gross Domestic Product1,3 3% 1% 2% 1. Source: Australian National Accounts - National Income and Expenditure, ABS 2. Not reclassified for the effects of changes to price levels. Source: Reserve Bank Australia 3. Nominal rates of Gross Domestic Product reclassified for the effect of changes to price levels.
2010
Profit after income tax increased $1,220 million or 59% to $3,304 million for the year ended September 30, 2010 in an environment characterized by improved credit conditions, the rising cost of funding, intense competition for deposits and benign business credit growth. Net interest income increased 12% (from $7,085 million in 2009 to $7,968 million in 2010) due to a 23 basis point improvement in net interest margin combined with a 2% increase in average net loans and advances and 4% increase in average deposits.
Significant influences on profit were:
• Net interest income increased 11% primarily due to a 7 basis point improvement in net interest margin combined with an 8% increase in average net loans and advances and 7% increase in average customer deposits. The acquisition of Landmark increased net interest income by $56 million. Margin improvement reflected the impact of asset repricing to recoup higher funding costs and continued competition in deposit products. Growth in average net loans and advances primarily resulted from above system growth in Mortgages and the acquisition of the Landmark lending assets, while Deposits growth predominately came through term deposits.
• Institutional (excluding Markets) grew net interest income 7% with improved lending margins offsetting lower lending volumes, while higher deposit volumes and margins were achieved.
• Group Center net interest income increased significantly resulting from higher capital as a result of equity raisings in the second half of 2009.
• Other external operating income increased 48%, primarily as a result of increased earnings from the OnePath (formerly INGA) acquisition, a reduction over the 2009 year in economic hedging fair value losses of $93 million and a reduction from the 2009 year of losses resulting from non-continuing businesses of $157 million and a reduction from the 2009 year on credit risk on derivatives of $167 million. Other factors include a strong year on year performance in Wealth, partly offset by the reduction in exception related fees in Retail. Institutional (excluding Markets) increased 26% primarily due to higher fee income in Specialized Lending and Loan Products.
• Markets income was lower after the strong earnings in 2009 due to market volatility and credit spreads returning to more normal levels.
• Operating expenses increased 15% primarily due to costs associated with integrating the acquisitions of OnePath (formerly INGA) and Landmark of $106 million coupled with the inclusion of $336 million of operating costs for these acquisitions, partly offset by costs incurred in 2009 relation to the One ANZ restructure and transformation costs of $123 million. Excluding these large items, operating expenses increased by 7% primarily due to volume related costs to support the Mortgage and Deposit growth, projects and property related costs. Project spend for
48

the year was focused on revenue growth and productivity enhancements. Expenses in Institutional increased 10% with investment directed at key initiatives to grow the business.
• The credit impairment provision charge was significantly lower in 2010 mainly reflecting the reduction in the number of large single name provisions raised within the Institutional portfolio while within Retail, improvements to both delinquency trends and bankruptcies were steady. The collective provision release of $4 million reflects lending growth concentrated in lower risk assets and otherwise relatively stable portfolios.
2009 Profit after income tax decreased $23 million or 1% to $2,084 million for the year ended September 30, 2009. Significant influences on profit were:
• Net interest income increased 25%, resulted from an increase in net interest margin of 29 basis points, while average net loans and advances grew by 7% and average deposits grew by 11%. Higher funding benefits associated with unrealized trading gains (offset by a decrease in trading income) had an 11 basis point positive impact. Excluding this, margin improved by 18 basis points with higher margins in Retail and Commercial reflecting repricing for risk and recouping higher funding costs and increased margins in Institutional reflecting repricing on the corporate lending book and management of interest rate risk in Markets. Growth in balance sheet volume resulted from Retail customer deposits, up 28% reflecting increased market share and net loans and advances up 10% in Mortgages.
• Other external operating income decreased 18%. Included in this decrease are adjustments relating to a reduction over the 2008 year in economic hedging fair value losses of $598 million, a decrease following the recognition of a gain on sale of visa shares of $281 million during 2008, an increase over the 2008 year of $519 million resulting from the impact of non-continuing businesses, an increase over 2008 on credit risk on derivatives of $110 million and a structured transaction of $127 million. Also, included in this decrease was a reduction in the derivative funding benefit that is offset in net interest income. Adjusting for these items other external operating income increased 5% resulted from strong trading and sales revenues generated in a volatile market and favorable growth in Retail resulted from fee revenue mainly in Deposits. This was partially offset by a decline in income in Wealth from lower investment and advisory income and a lower contribution from the INGA business.
• Operating expenses increased 6% or $238 million including restructure/transformation costs of $123 million incurred in 2009 compared to $221 million in 2008. Institutional increased 21% or $178 million due primarily to investment in frontline staff and systems, salary inflation and remuneration costs. Retail and Commercial increased 4% or $114 million with increased volume growth related to personnel in service delivery and collections areas, salary inflation, premises costs and investment in systems, partly offset by savings primarily due to productivity, restructuring and offshoring activities. Increases of $61 million within Group Center include increased expenditure on transformation activity.
• Provision for credit impairment increased $521 million (35%). The individual provision charge increased by $1,334 million, resulted from higher loss rates across all portfolios and increased bankruptcies, liquidations and a significant reduction in Retail resale options. In addition, Institutional experienced several large single name provisions. The collective provision charge decreased by $813 million with the release of collective provision provided in 2008 as actual losses crystallized and flowed through the 2009 individual provision charge within Institutional, partly offset by increases within the Cards portfolio primarily due to higher delinquencies and bankruptcies and Esanda and Wealth due to risk deterioration.
49

Asia Pacific, Europe & America 2010 2009 2008 $M $M $M
Net interest income 921 846 474 Other operating income 1,086 1,114 759
Operating income 2,007 1,960 1,233 Operating expenses (1,283) (849) (555)
Profit before credit impairment and income tax 724 1,111 678 Provision for credit impairment (154) (275) (205)
Profit before income tax 570 836 473 Income tax expense (57) (136) (86) Non-controlling interests (4) - (6)
Profit after income tax 509 700 381 1. Includes inter-segment income/expense
2010 Asia Pacific, Europe & America is a business that is based largely on a functional currency of US dollars. Therefore, the result for Asia Pacific, Europe & America has been impacted by the devaluation of the USD against the AUD during the year ended September 30, 2010. Translation of the September 2010 results to AUD was at an average exchange rate for the year ended September 30, 2010 of US$0.8990 to A$1.00 compared to an average exchange rate for the year ended September 30, 2009 of US$0.7319 to A$1.00. Profit after tax decreased $191 million (27%) mainly due to costs associated with the integration of the RBS businesses including approximately $130 million due to the devaluation of the USD against the AUD. The Institutional business delivered a solid set of results after the exceptional additional earnings in 2009 arising from increased market volatility due to the global financial crisis. We completed the acquisitions of the RBS businesses in the Philippines, Vietnam and Hong Kong during the March 2010 half and in Taiwan, Singapore and Indonesia during the September 2010 half. Key factors affecting the result were: • Balance sheet growth contributed to net interest income increasing 9%, including the impact during 2010 of the
acquisition of RBS assets. • Other external operating income decreased $28 million (3%), driven primarily by a decrease in Institutional due to
the exceptional level of earnings in 2009 which was not repeated as market volatility and credit spreads returned to more normal levels, partly offset by higher earnings from Asia Partnerships and the positive impact of the reversal in 2010 of the impairment charge taken in 2009 relating to the carrying value of our investment in Saigon Securities Incorporation (‘SSI’) in Vietnam and higher other operating income following the acquisition of RBS assets.
• Operating expenses were 51% higher due to the costs associated with the integration of the RBS businesses and ongoing investments in the key strategic markets of Indonesia, Vietnam and China, and building regional operating and support capabilities coupled with inclusion of operating costs for these acquisitions. Employees increased by 4,987 including 2,786 from the RBS acquisition. We continued to invest in systems and build core front line capability in the region and increase our operations and technology support staff in Bangalore.
• Provisions for credit impairment were 44% lower, in line with an improving outlook and slowing rate of growth in impaired assets. Lower collective provision charges were mainly due to the write-backs associated with a few large Institutional customers and de-risking of the loan portfolio in Europe and America compared to the higher charge in 2009.
• The reduced tax rate for 2010 was positively impacted by the resolution of an outstanding tax matter in the U.S. and the higher proportion of earnings being derived from Asia Partnerships.
• Net loans and advances increased 31% primarily as a result of the acquisitions of the RBS businesses and growth in Transaction Banking. The growth momentum in customer deposits continued, resulting in an increase of 56%. Our deposits to loans ratio improved from 161% to 191%. Margins were 16 basis points lower primarily due to narrowing credit spreads and a higher proportion of lower yielding assets arising from increased liquidity from growth in customer deposits.
50

2009 Profit after tax increased $319 million or 84% to $700 million for the year ended 30 September, 2009. This increase resulted from growth in the Institutional business resulted from the high currency volatility in the region particularly in the early part of the year. Continued investment in front office sales capability generated a significant increase in trade sales. The Asia Partnerships also contributed significantly to the result driven by increased equity accounted earnings, particularly from Shanghai Rural Commercial Bank (‘SRCB’) and Bank of Tianjin (‘BoT’) in China and AMMB Holdings Berhad (‘AMMB’) in Malaysia (including adjustments to ANZ’s share of earnings from prior periods principally from an improved assessment of credit provisioning requirements), offsetting an impairment charge relating to the carrying value of our investment in Saigon Securities Incorporation (‘SSI’) in Vietnam booked in the March 2009 half. Operating expenses increased as a result of the continued investment in the key strategic markets of Indonesia, Vietnam and China as well as building our regions operating and support capabilities. Key factors affecting the 2009 result were:
• Net interest income increased by 78% primarily due to significant increases in our Global Markets business. While net loans and advances were down 11% year on year as we de-risked our balance sheet, overall external assets were up 3% due primarily to increased Markets activities. Customer deposits grew a healthy 35% improving our deposits to loans ratio to 160%. Margins increased by 47 basis points to 170 basis points.
• Other external operating income grew by 47%, of which more than half was contributed by equity accounted earnings from our Asia Partnerships which included benefit from reassessed credit provisioning requirements. Fee and other income were significantly higher in the Markets businesses leveraging off volatility in the currency markets.
• Operating expenses increased 53% through a combination of new investments, and growth across the region in employee numbers. Employees increased by 1,786 as we continue to build core capability in the region and increase our operations and technology support staff in Bangalore.
• Provision for credit impairment increased by 34% ($70 million) due primarily to risk grade decreases and an additional $43 million as a result of a refinement to the collective provision calculation in the September, 2009 half. This additional charge has been held centrally within the region.
51

New Zealand
2010 2009 2008 $M $M $M
Net interest income 1,980 1,957 1,702 Other operating income 584 471 939
Operating income 2,564 2,428 2,641 Operating expenses (1,235) (1,203) (1,206)
Profit before credit impairment and income tax 1,329 1,225 1,435 Provision for credit impairment (362) (722) (256)
Profit before income tax 967 503 1,179 Income tax expense (279) (344) (348) Non-controlling interests - - -
Profit after income tax 688 159 831 1. Includes inter-segment income/expense
2010 New Zealand is a business that is based largely on a functional currency of NZ dollars. Therefore, the result for New Zealand has been impacted by the devaluation of the NZD against the AUD during the year ended September 30, 2010. Translation of the September 2010 results to AUD was at an average exchange rate for the year ended September 30, 2010 of NZ$1.2603 to A$1.00 compared to an average exchange rate for the year ended September 30, 2009 of NZ$1.2248 to A$1.00.
Profit after tax increased by $529 million from $159 million in 2009 to $688 million in 2010, with the result including a $252 million after tax decrease in credit impairment charge. The Institutional contribution, whilst falling short of the exceptional 2009 result, was the second best result since the Group purchased NBNZ in 2004.
• Net interest income increased 1% after adjusting for a $5 million decrease in net interest income from derivative and liquidity positions that was offset by an increase in trading income. This result was driven by net interest margin improvement in the New Zealand Businesses (10 basis points), reflecting the lagged benefit from repricing the fixed rate lending book. The cost of funding remained at elevated levels and, together with intensified competition for deposits, continued to place pressure on margins. Other impacts on net interest income included higher break costs on mortgages, and a lower contribution from the management of interest rate risks. Lending and customer deposit volumes were substantially flat over the year.
• Other external operating income increased $113 million or 24%, primarily due to an increase over the 2009 year in economic hedging fair value gains of $73 million, an increase of $205 million relating to ING New Zealand investor settlement resulting from the initial amount provided during 2009 of -$173 million coupled with a gain in the current year on earnings of the funds of $32 million and a decrease due to a valuation adjustment on acquisition of ING NZ of $66 million. Excluding these items, there was a decrease of $99 million, which largely reflects the lower contribution from Markets, with the prior year result benefiting from exceptionally favorable trading conditions. Fee growth remained weak, with Retail fees down by $53 million largely due to the restructure of consumer fees implemented in December 2009. These impacts were moderated by a stronger contribution from the ING NZ acquisition resulting in an increase in other operating income of $88 million.
• Operating expenses increased 3%. Included in this increase are acquisition costs relating to the ING NZ acquisition of $23 million. Excluding this, operating expenses were largely consistent with 2009 largely reflecting the ongoing benefits from business transformation strategies implemented during 2009, and strong control of discretionary expenditure in the current environment.
• Provision for credit impairment charge reduced 50% million as risk levels stabilized. The individual provision charge decreased $138 million, with loss rates falling in Commercial and Retail as the credit cycle eased. The charge in Rural increased $25 million, with the agricultural recovery slightly lagging other sectors. The charge in Institutional decreased $36 million, largely reflecting recoveries on a single name exposure that was provisioned during 2009. The collective provision charge decreased $222 million, with risk levels moderating across the businesses. Credit cycle adjustments booked in 2009 (with smaller top-ups in 2010) contributed $97 million to the lower year on year charge. The total loss rate (total provision charge as a percentage of average net advances) for the 2010 year was 0.48%, down from 0.91% for 2009.
52
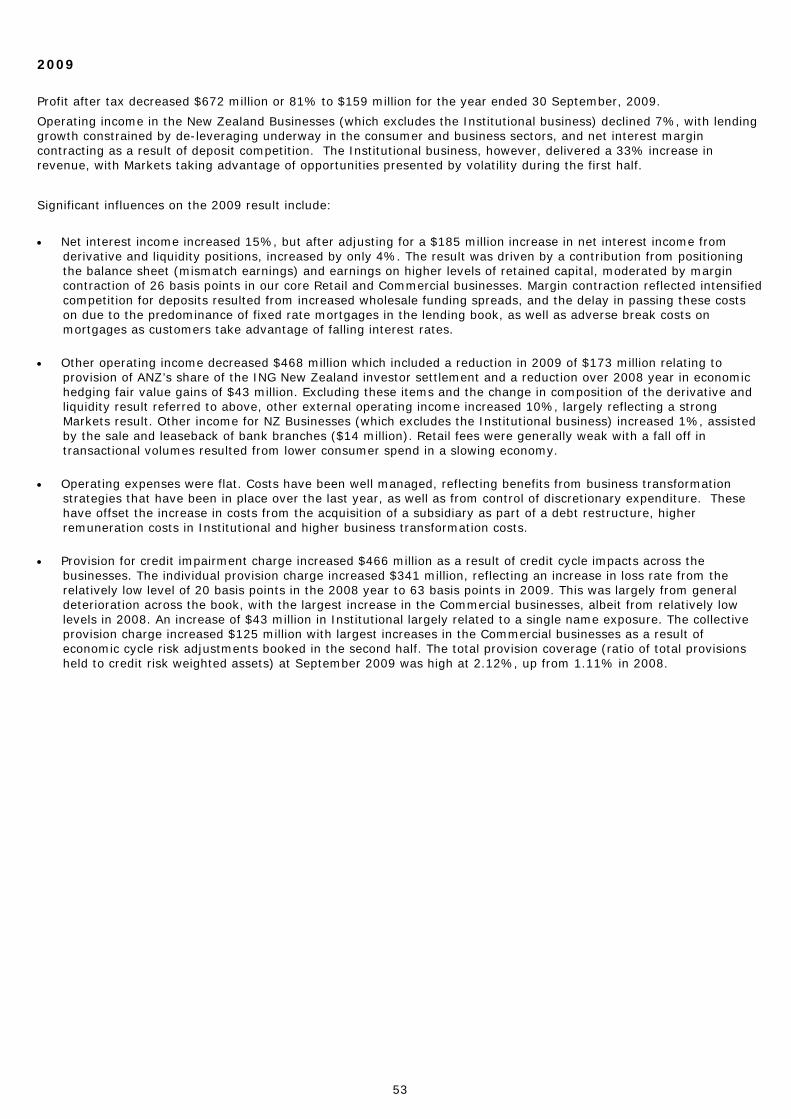
2009
Profit after tax decreased $672 million or 81% to $159 million for the year ended 30 September, 2009.
Operating income in the New Zealand Businesses (which excludes the Institutional business) declined 7%, with lending growth constrained by de-leveraging underway in the consumer and business sectors, and net interest margin contracting as a result of deposit competition. The Institutional business, however, delivered a 33% increase in revenue, with Markets taking advantage of opportunities presented by volatility during the first half.
Significant influences on the 2009 result include:
• Net interest income increased 15%, but after adjusting for a $185 million increase in net interest income from
derivative and liquidity positions, increased by only 4%. The result was driven by a contribution from positioning the balance sheet (mismatch earnings) and earnings on higher levels of retained capital, moderated by margin contraction of 26 basis points in our core Retail and Commercial businesses. Margin contraction reflected intensified competition for deposits resulted from increased wholesale funding spreads, and the delay in passing these costs on due to the predominance of fixed rate mortgages in the lending book, as well as adverse break costs on mortgages as customers take advantage of falling interest rates.
• Other operating income decreased $468 million which included a reduction in 2009 of $173 million relating to
provision of ANZ’s share of the ING New Zealand investor settlement and a reduction over 2008 year in economic hedging fair value gains of $43 million. Excluding these items and the change in composition of the derivative and liquidity result referred to above, other external operating income increased 10%, largely reflecting a strong Markets result. Other income for NZ Businesses (which excludes the Institutional business) increased 1%, assisted by the sale and leaseback of bank branches ($14 million). Retail fees were generally weak with a fall off in transactional volumes resulted from lower consumer spend in a slowing economy.
• Operating expenses were flat. Costs have been well managed, reflecting benefits from business transformation
strategies that have been in place over the last year, as well as from control of discretionary expenditure. These have offset the increase in costs from the acquisition of a subsidiary as part of a debt restructure, higher remuneration costs in Institutional and higher business transformation costs.
• Provision for credit impairment charge increased $466 million as a result of credit cycle impacts across the
businesses. The individual provision charge increased $341 million, reflecting an increase in loss rate from the relatively low level of 20 basis points in the 2008 year to 63 basis points in 2009. This was largely from general deterioration across the book, with the largest increase in the Commercial businesses, albeit from relatively low levels in 2008. An increase of $43 million in Institutional largely related to a single name exposure. The collective provision charge increased $125 million with largest increases in the Commercial businesses as a result of economic cycle risk adjustments booked in the second half. The total provision coverage (ratio of total provisions held to credit risk weighted assets) at September 2009 was high at 2.12%, up from 1.11% in 2008.
53

Institutional 2010 2009 2008
$M $M $M
Net interest income 3,151 3,117 1,824
Other operating income 1,714 1,848 1,755
Operating income 4,865 4,965 3,579
Operating expenses (1,706) (1,555) (1,207)
Profit before credit impairment and income tax 3,159 3,410 2,372
Provision for credit impairment (740) (1,410) (1,281)
Profit before income tax
2,419 2,000 1,091
Income tax expense (665) (567) (322)
Non-controlling interests - (3) (3)
Profit after income tax
1,754 1,430 766 The Group is managed along the geographic regions of Australia, New Zealand and Asia Pacific, Europe & America, and the matrix segment of its global institutional client business which is viewed as a separate segment but also impacts each region. 2010 2009 2008
Geographic Segments $M $M $M
Australia 1,056 668 321
Asia Pacific, Europe & America 421 462 211
New Zealand 277 300 234
Profit after income tax 1,754 1,430 766 2010
Institutional’s profit after tax grew 23% to $1.7 billion, with a lower credit impairment charge and a solid revenue result, increasing in a year in which market volatility stabilized and customer hedging activity returned to more normalized levels. Excluding Trading Revenues, customer franchise revenues were up 6%, reflecting the focus on customer growth (over 1,100 new relationships added in the year) and the growing strength of client relationships. The strength of our super-regional strategy is evident through inter-region client flows being up 10% year on year and flows into Asia from elsewhere in the network up 20%. Significant factors affecting the 2010 result include the following:
• Provision for credit impairment decreased 48% reflecting an improvement in the economic environment and disciplined risk management. Individual provisions of $798 million were predominantly in Australia, largely related to property exposures, agribusiness and a limited number of corporate names. The collective provision release of $58 million was primarily due to migration of certain names to impaired loans and a general improvement in credit quality. Net impaired loans grew to $2.5 billion.
• The reduced tax rate was impacted by the resolution of an outstanding tax matter in the U.S.. Significant factors affecting the 2010 result geographically included the following:
• Australian revenue increased 6%, resulted from repricing of the loan book, solid trade and deposit growth offset in part by a reduction in Markets’ revenue as the exceptional conditions of 2009 reverted to more normalized levels.
• Asia Pacific, Europe & America revenue increased 7% reflecting the strategic investment in the region.
• New Zealand revenue decreased 23% resulting from a reduction in New Zealand Markets’ opportunities. 2009 Profit after tax increased $664 million or 87% to $1,430 million for the year ended September 30, 2009. The refocus on Institutional’s global client segment propositions drove revenue in areas of core client demand. Interest rate and general market volatility and increased customer focus delivered Global Markets trading and sales revenue growth of 77%. Transaction Banking revenue grew by 12% and Specialized Lending revenue grew by 23%. Net lending
54
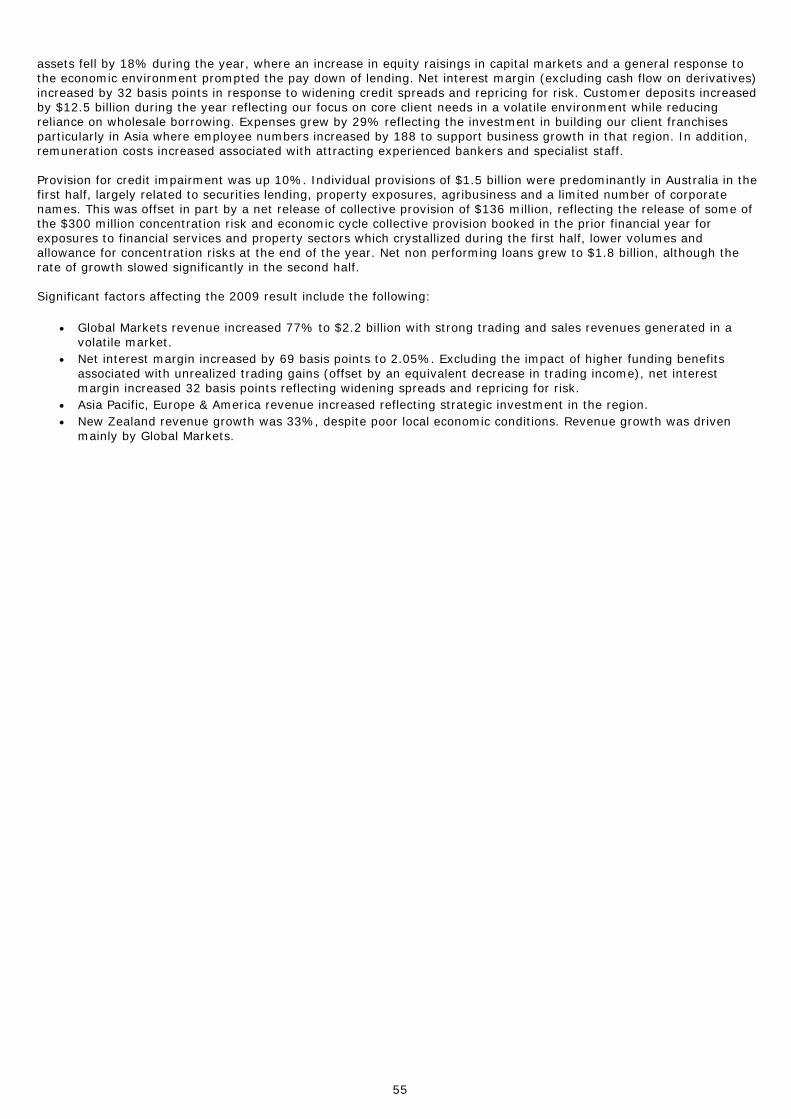
assets fell by 18% during the year, where an increase in equity raisings in capital markets and a general response to the economic environment prompted the pay down of lending. Net interest margin (excluding cash flow on derivatives) increased by 32 basis points in response to widening credit spreads and repricing for risk. Customer deposits increased by $12.5 billion during the year reflecting our focus on core client needs in a volatile environment while reducing reliance on wholesale borrowing. Expenses grew by 29% reflecting the investment in building our client franchises particularly in Asia where employee numbers increased by 188 to support business growth in that region. In addition, remuneration costs increased associated with attracting experienced bankers and specialist staff. Provision for credit impairment was up 10%. Individual provisions of $1.5 billion were predominantly in Australia in the first half, largely related to securities lending, property exposures, agribusiness and a limited number of corporate names. This was offset in part by a net release of collective provision of $136 million, reflecting the release of some of the $300 million concentration risk and economic cycle collective provision booked in the prior financial year for exposures to financial services and property sectors which crystallized during the first half, lower volumes and allowance for concentration risks at the end of the year. Net non performing loans grew to $1.8 billion, although the rate of growth slowed significantly in the second half. Significant factors affecting the 2009 result include the following:
• Global Markets revenue increased 77% to $2.2 billion with strong trading and sales revenues generated in a volatile market.
• Net interest margin increased by 69 basis points to 2.05%. Excluding the impact of higher funding benefits associated with unrealized trading gains (offset by an equivalent decrease in trading income), net interest margin increased 32 basis points reflecting widening spreads and repricing for risk.
• Asia Pacific, Europe & America revenue increased reflecting strategic investment in the region. • New Zealand revenue growth was 33%, despite poor local economic conditions. Revenue growth was driven
mainly by Global Markets.
55

Balance Sheet Years ended September 30 2010 2009 2008
$M $M $M
Assets
Liquid assets & due from other financial institutions 27,002 30,302 34,892
Trading and available for sale assets 54,257 47,566 32,657
Derivative financial instruments 37,821 37,404 36,941
Net loans and advances including acceptances 360,816 345,769 349,851
Investments relating to insurance business 32,171 - -
All other assets 19,672 15,946 15,952
Total Assets 531,739 476,987 470,293
Liabilities
Due to other financial institutions 20,521 19,924 20,092
Deposits and other borrowings 311,472 294,370 283,966
Derivative financial instruments 37,217 36,516 31,927
Liability for acceptances 11,495 13,762 15,297
Bonds and notes 59,714 57,260 67,323
Insurance policy liabilities 34,429 - -
All other liabilities 22,736 22,726 25,136
Total Liabilities 497,584 444,558 443,741
Net Assets 34,155 32,429 26,552
Assets
Total assets increased by $54.8 billion (12%) from $477.0 billion as at September 30, 2009 to $531.7 billion at September 30, 2010 mainly due to the acquisitions of INGA and INGNZ, Landmark and RBS assets. Growth in the existing business has been negatively impacted by movements in exchange rates (-$11.4 billion). Excluding exchange rates, growth in the existing business was 6%, principally resulted from:
• Net loans and advances, including acceptances, increased $17.8 billion (5%) primarily in Mortgages Australia with
housing loans increasing by $18 billion (12%). Growth of $7.7 billion across Asia, primarily in Singapore, Hong Kong and Taiwan was offset by reduced lending in Institutional.
• Trading and available-for-sale assets increased $7.7 billion (17%) primarily due to local regulatory requirements to hold increased government securities in part due to business growth in Singapore of $2.9 billion and increased trading securities in Institutional Australia and New Zealand of $4.5 billion.
Liquid Assets & Due From Other Financial Institutions
2010 Liquid assets and due from other financial institutions decreased by $3.3 billion to $27.0 billion at September 30, 2010. Growth was evident in Australia (up $2.5 billion) due mainly to an increase in surplus funds driven by customer growth. This was offset by reduction in New Zealand of $2.4 billion and other International Markets (-$3.5 billion). Due from other financial institutions increased $0.5 billion to $5.5 billion at September 30, 2010 primarily due to an increase in Singapore and Transaction Banking volumes in Australia. This was partially offset by a reduction in Banking Transaction volumes in New Zealand.
2009
Liquid assets increased $0.3 billion to $25.3 billion at September 30, 2009 (excluding the impact of exchange rates, liquid assets increased $1.5 billion or 6%). Growth was evident in America (up $4.5 billion) due primarily to an increase in Bills receivable and Singapore (up $2.2 billion) within bank certificates of deposits where funds were redeployed from interbank placements for better yields. This was partially offset by reductions in the United Kingdom of $2.9 billion, New Zealand of $1.4 billion and Group Treasury of $0.9 billion primarily due to changes in liquidity composition.
Assets due from other financial institutions decreased $4.9 billion to $5.0 billion at September 30, 2009 due mainly to a reduction in interbank lending volumes in Transaction Banking in Australia and Singapore.
56

Trading and Available-For-Sale Assets
2010
Trading and available-for-sale assets increased $6.7 billion (17%) due primarily to regulatory requirements to hold increased government securities following business growth in Singapore of $2.9 billion and increased trading securities in Institutional in Australia and New Zealand of $4.5 billion.
2009
Trading and available-for-sale assets increased $14.9 billion to $47.6 billion at September 30, 2009, primarily in trading securities within the Markets business in Australia due to an increase in liquidity requirements.
Derivative Financial Instruments
2010
Derivative financial instruments increased $0.4 billion to $37.8 billion at September 30, 2010, resulted from continued volatility in the foreign exchange, interest rate and credit derivative markets. Derivative balances have increased since March 31, 2010 following the strong appreciation of the AUD against other currencies during the second half of the 2010 fiscal year.
2009
Derivative financial instruments increased $0.5 billion to $37.4 billion at September 30, 2009, resulted from volatility in the foreign exchange, interest rate and credit derivative markets. Derivative balances have decreased since March 31, 2009 following the appreciation of the AUD against other currencies during the second half of the 2009 fiscal year.
Net Loans and Advances including Acceptances
2010
Net loans and advances, including acceptances, increased by 4% to $360.8 billion at September 30, 2010. Excluding the impact of exchange rates, the increase was $17.8 billion or 5%.
- Net loans and advances, including acceptances, in Australia grew by $15.6 billion, with housing loans in Mortgages
increasing by $18 billion (12%). - Net loans and advances, including acceptances, in New Zealand declined by $6.5 billion primarily due to reduced
customer demand, however was relatively flat excluding exchange rates. - Net loans and advances, including acceptances, in Asia Pacific, Europe & America increased by $6 billion (32%) or
$7.7 billion excluding exchange rates, mainly as a result of the acquisitions of the RBS businesses and growth in Transaction Banking and Specialized and Relationship Lending.
2009
Net loans and advances, including acceptances growth, contracted slightly by 1% to $345.8 billion at September 30, 2009. Excluding exchange rate movements, growth was flat.
- Net loans and advances, including acceptances in Australia grew by $0.7 billion, with housing loans in Mortgages
increasing by $12.7 billion (10%), partially offset by reduced lending in Institutional, primarily in Specialized Lending and Markets, of $12.1 billion (20%).
- Net loans and advances, including acceptances in New Zealand declined by $2.4 billion or 3%. Excluding the impact of exchange rates, the contraction was smaller at $0.7 billion (1%), with growth in Rural Banking of $1.2 billion (8%) being offset by reductions in the Institutional business of $0.9 billion (13%) and Corporate & Commercial Banking of $0.6 billion (5%).
- Net loans and advances, including acceptances in Asia Pacific, Europe & America decreased $2.4 billion (11%). Excluding the impact of exchange rates, lending decreased by $0.4 billion (2%) as growth across both Asia of $0.9 billion (9%) and Pacific of $0.2 billion (11%) was offset by a reduction in the United Kingdom and America of $1.4 billion (18%).
57

Investments relating to insurance business 2010
Investments relating to Funds Management and Insurance (formerly INGA and INGNZ) were valued at $32.1 billion (2009: nil). 2009 Funds Management and Insurance “FMI” (formerly INGA and INGNZ) was a joint venture between ANZ and ING Group. ANZ owned 49% of INGA and INGNZ and received proportional equity accounted earnings prior to ANZ acquiring the remaining 51% interest to take full ownership.
All Other Assets
2010
All other assets increased by $3.7 billion in 2010 mainly due to the acquisitions of INGA and INGNZ, Landmark and the former RBS businesses in the Philippines, Vietnam and Hong Kong, Taiwan, Singapore and Indonesia completed during 2010.
2009
All other assets were consistent with 2008.
58
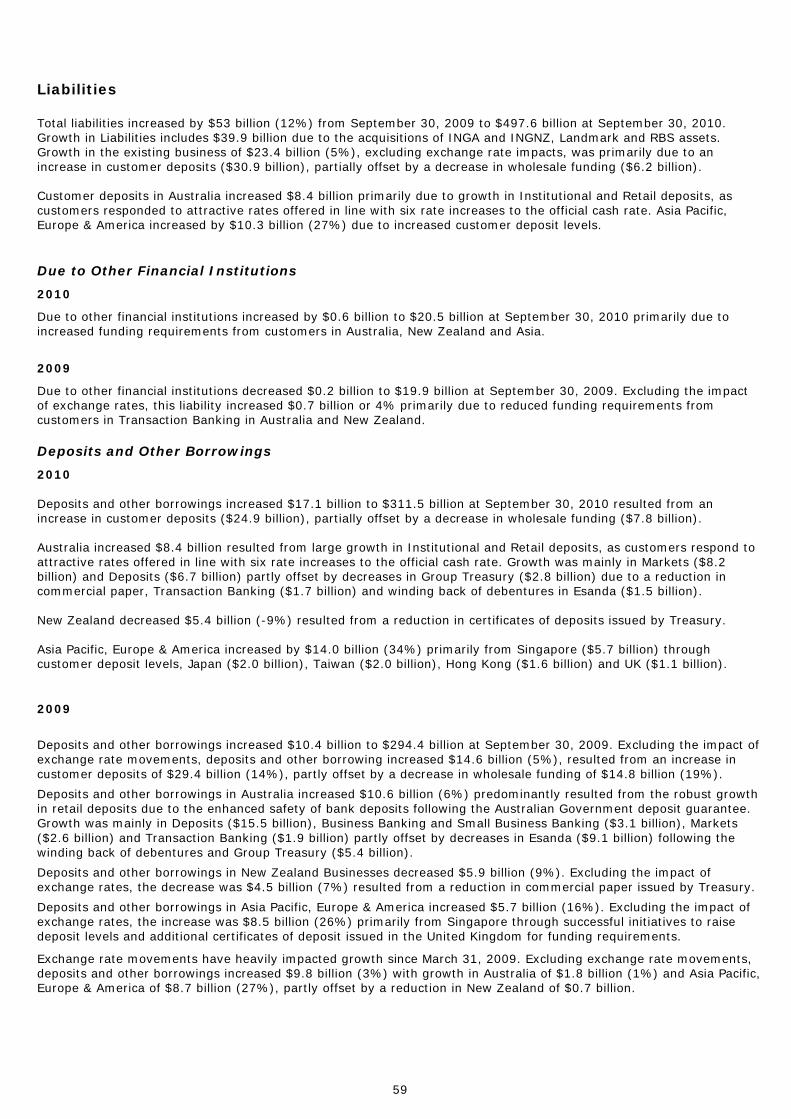
Liabilities Total liabilities increased by $53 billion (12%) from September 30, 2009 to $497.6 billion at September 30, 2010. Growth in Liabilities includes $39.9 billion due to the acquisitions of INGA and INGNZ, Landmark and RBS assets. Growth in the existing business of $23.4 billion (5%), excluding exchange rate impacts, was primarily due to an increase in customer deposits ($30.9 billion), partially offset by a decrease in wholesale funding ($6.2 billion). Customer deposits in Australia increased $8.4 billion primarily due to growth in Institutional and Retail deposits, as customers responded to attractive rates offered in line with six rate increases to the official cash rate. Asia Pacific, Europe & America increased by $10.3 billion (27%) due to increased customer deposit levels.
Due to Other Financial Institutions
2010
Due to other financial institutions increased by $0.6 billion to $20.5 billion at September 30, 2010 primarily due to increased funding requirements from customers in Australia, New Zealand and Asia.
2009
Due to other financial institutions decreased $0.2 billion to $19.9 billion at September 30, 2009. Excluding the impact of exchange rates, this liability increased $0.7 billion or 4% primarily due to reduced funding requirements from customers in Transaction Banking in Australia and New Zealand.
Deposits and Other Borrowings
2010 Deposits and other borrowings increased $17.1 billion to $311.5 billion at September 30, 2010 resulted from an increase in customer deposits ($24.9 billion), partially offset by a decrease in wholesale funding ($7.8 billion). Australia increased $8.4 billion resulted from large growth in Institutional and Retail deposits, as customers respond to attractive rates offered in line with six rate increases to the official cash rate. Growth was mainly in Markets ($8.2 billion) and Deposits ($6.7 billion) partly offset by decreases in Group Treasury ($2.8 billion) due to a reduction in commercial paper, Transaction Banking ($1.7 billion) and winding back of debentures in Esanda ($1.5 billion). New Zealand decreased $5.4 billion (-9%) resulted from a reduction in certificates of deposits issued by Treasury. Asia Pacific, Europe & America increased by $14.0 billion (34%) primarily from Singapore ($5.7 billion) through customer deposit levels, Japan ($2.0 billion), Taiwan ($2.0 billion), Hong Kong ($1.6 billion) and UK ($1.1 billion).
2009
Deposits and other borrowings increased $10.4 billion to $294.4 billion at September 30, 2009. Excluding the impact of exchange rate movements, deposits and other borrowing increased $14.6 billion (5%), resulted from an increase in customer deposits of $29.4 billion (14%), partly offset by a decrease in wholesale funding of $14.8 billion (19%).
Deposits and other borrowings in Australia increased $10.6 billion (6%) predominantly resulted from the robust growth in retail deposits due to the enhanced safety of bank deposits following the Australian Government deposit guarantee. Growth was mainly in Deposits ($15.5 billion), Business Banking and Small Business Banking ($3.1 billion), Markets ($2.6 billion) and Transaction Banking ($1.9 billion) partly offset by decreases in Esanda ($9.1 billion) following the winding back of debentures and Group Treasury ($5.4 billion).
Deposits and other borrowings in New Zealand Businesses decreased $5.9 billion (9%). Excluding the impact of exchange rates, the decrease was $4.5 billion (7%) resulted from a reduction in commercial paper issued by Treasury.
Deposits and other borrowings in Asia Pacific, Europe & America increased $5.7 billion (16%). Excluding the impact of exchange rates, the increase was $8.5 billion (26%) primarily from Singapore through successful initiatives to raise deposit levels and additional certificates of deposit issued in the United Kingdom for funding requirements.
Exchange rate movements have heavily impacted growth since March 31, 2009. Excluding exchange rate movements, deposits and other borrowings increased $9.8 billion (3%) with growth in Australia of $1.8 billion (1%) and Asia Pacific, Europe & America of $8.7 billion (27%), partly offset by a reduction in New Zealand of $0.7 billion.
59
Derivative Financial Instruments
2010
Derivative financial instruments liabilities increased $0.7 billion to $37.2 billion at September 30, 2010. The increase was driven principally by continuous volatility in foreign exchange, interest rate and credit derivative markets.
2009
Derivative financial instruments liabilities increased $4.6 billion to $36.5 billion at September 30, 2009. The increase was driven principally by significant volatility in foreign exchange, interest rate and credit derivative markets.
Liability for acceptances
2010
Liability for acceptances decreased $2.3 billion from $13.8 billion in 2009 to $11.5 billion at September 30, 2010. The decrease was driven principally by reduced demand for acceptances from ANZ’s customers.
2009
Liability for acceptances decreased $1.5 billion from $15.3 billion in 2008 to $13.8 billion at September 30, 2009. The decrease was driven principally by reduced demand for acceptances from ANZ’s customers.
Bonds and Notes
2010
Bonds and notes increased $2.4 billion to $59.7 billion at September 30, 2010 driven mainly by new issuances partly offset by currency exchange rate movements caused by a stronger Australian dollar in 2010.
2009
Bonds and notes decreased $10.1 billion to $57.3 billion at September 30, 2009. The appreciation of AUD from March 31, 2009 resulted in the decrease in the value of bonds and notes when translated from the original currency to AUD at end of period rates (as opposed to the issuer’s functional currency).
Insurance policy liabilities
2010
Insurance policy liabilities were valued at $34.4 billion (2009: nil).
Policy liabilities for life insurance contracts are computed using statistical or mathematical methods, which are expected to give approximately the same results as if an individual liability was calculated for each contract. The computations are made by suitably qualified personnel on the basis of recognized actuarial methods, with due regard to relevant actuarial principles and standards. The methodology takes into account the risks and uncertainties of the particular classes of life insurance business written. Deferred policy acquisition costs are connected with the measurement basis of life insurance liabilities and are equally sensitive to the factors that are considered in the liability measurement.
2009 Funds Management and Insurance “FMI” (formerly INGA and INGNZ) was a joint venture between ANZ and the ING Group. ANZ owned 49% of INGA and INGNZ and received proportional equity accounted earnings prior to ANZ acquiring the remaining 51% interest to take full ownership.
All Other Liabilities
2010
All other liabilities were consistent with 2009.
2009 All other liabilities decreased by $2.4 billion from $25.1 billion in 2008 to $22.7 billion in 2009.
60

Capital Management
2010 2009 2008
Years ended September 30 $M $M $M
Shareholders' equity (including outside equity interests) 34,155 32,429 26,552
Loan capital (subordinated debt) 12,316 13,429 14,266
Total 46,471 45,858 40,818
Liabilities excluding loan capital 485,268 431,129 429,475
Total assets 531,739 476,987 470,293
Basel II Basel II Basel II
Risk weighted assets 264,242 252,069 275,434
Tier 1 capital 26,691 26,619 21,229
Tier 2 capital 7,842 10,472 10,544
Deductions (3,026) (2,661) (1,206)
Total qualifying capital 31,507 34,430 30,567
Basel II Basel II Basel II
% % %
Tier 1 capital ratio 10.1% 10.6 7.7
Tier 2 capital ratio 1.8% 3.1 3.4
Total capital adequacy ratio 11.9% 13.7 11.1
1. 2010, 2009 and 2008 risk weighted assets are calculated using Basel II methodology.
The Basel II Accord principles took effect in Australia and New Zealand on January 1, 2008. For calculation of minimum capital requirements under Pillar 1 (Capital Requirements) of the Basel II Accord, ANZ has been accredited by Australian Prudential Regulation Authority (‘APRA’) to use Advanced Internal Ratings Based (‘AIRB’) methodology for credit risk weighted assets and Advanced Measurement Approach (‘AMA’) for the operational risk weighted asset equivalent.
2010 Tier 1 Ratio (Basel II) The Tier 1 ratio at September 30, 2010 of 10.1% represents a decrease from September 30, 2009 of 46 basis points. The key contributors to the decrease were:
• Profit after preference share dividends of $4.5 billion (+178 basis points).
• Ordinary share dividend commitments net of expected reinvestment through the DRP and BOP of $2.0 billion (-80 basis points).
• Increase in Risk Weighted Assets (RWA), excluding the impact of exchange rate movements and acquisitions, was $11.5 billion primarily due to:
• Portfolio mix (-23 basis points) • Risk migration incorporating decline in RWA and increase in Expected Loss versus Eligible Provision shortfall
(+4 basis points) • Portfolio data review (+5 basis points) • Higher non-credit risk RWA (-34 basis points), predominantly due to interest rate risk in the banking book
• Increase in investment/profit retention in funds management businesses, associates and commercial operations excluding the impact of exchange rate movements (-15 basis points)
• Other items (net -23 basis points) including movement in capitalized software expense (-11 basis points), impact of exchange rate movements (-12 basis points) principally on hybrid Tier 1 instruments.
• Acquisition of INGA and INGNZ (-79 basis points). • Acquisition of selected Asian assets from RBS (-24 basis points). • Acquisition of the loan book of Landmark Financial Services (-9 basis points). • Refinancing of ING Australia wealth management and life insurance entity funding by ANZ (-9 basis points). • Additional net hybrid capital issuances of $1.6 billion (+63 basis points) used to strengthen the balance sheet.
61
Hybrid Capital and Tier 1 Capital
ANZ raises hybrid Tier 1 capital to further strengthen the Group’s capital base and supplement its Core Tier 1 capital position, ensuring compliance with APRA’s prudential capital requirements and meeting Group operating targets for Tier 1. The total amount of qualifying hybrid capital is known as Residual Tier 1 capital which is limited to 25% of Tier 1 capital. Innovative Tier 1 capital, a sub category of Residual Tier 1 capital, is limited to 15% of Tier 1 capital. As at September 30 2010, ANZ’s hybrid usage and instrument details were as follows: Instrument $M % of Net
Tier 1 capital Limit Amount in
issue currency Accounting
classification Interest
rate
UK Hybrid 737 £450 million Debt Coupon 6.54% ANZ Convertible Preference Shares
1,081
$1,081 million
Debt
90 day BBSW + 2.50% (gross pay equivalent)
ANZ Convertible Preference Shares II
1,969
$1,969 million
Debt
90 day BBSW + 3.10% (gross pay equivalent)
Non-innovative instruments 3,787
Euro Trust Securities 871 €500 million Equity Euribor (3 month) + 0.66% US Stapled Trust Security 776 USD750 million Debt Coupon: 5.36%
Innovative instruments 1,647 6.2% 15%
Residual Tier 1 capital 5,434 20.4% 25%
Regulatory change (Basel III)
The Basel Committee on Banking Supervision has released a series of consultation papers (Basel III) containing a number of proposals to strengthen the global capital and liquidity framework to improve the banking sector’s ability to absorb shocks arising from financial and economic stress.
The consultation papers aim to increase the quality, quantity, consistency and transparency of the capital base, whilst strengthening the risk coverage of the capital framework by:
• Increasing the minimum level of capital, with new minimum capital targets for Core Tier 1 (4.5%), Tier 1 (6.0%) and Total Capital (8.0%) to be phased in between 2013 and 2015;
• Increasing the capital buffers that banks are required to hold for stress scenarios and to dampen the impact of pro-cyclical elements of the prudential regulations. A capital conservation buffer of 2.5% and a counter-cyclical buffer of 0.0% to 2.5% will be phased in between 2016 and 2019. Failure to maintain the full capital buffers will result in limitations on the amount of current year earnings that can be paid as discretionary bonuses and to Tier 1 and Tier 2 investors as coupons and capital returns;
• Increasing Tier 1 deductions, although a number of the proposals are consistent with the current APRA prudential standards;
• Increasing the focus on Fundamental Tier 1 capital and tightening the regulations for Residual Tier 1 and Tier 2 capital instruments including a proposal that at the time of ‘non-viability’, these instruments will be written off, with any potential compensation for investors limited to an issuance of ordinary shares. Existing Tier 1 and Tier 2 instruments that do not have these requirements will be phased out between 2013 and 2022. These proposals are to be supplemented, by yet to be released details around ‘contingent capital’ and ‘bail in’ instruments, which may not initially be prudential capital, but are converted in part or in full into Fundamental Tier 1 capital at predetermined trigger points;
• Supplementing the risk adjusted capital ratio targets with the introduction of a minimum leverage ratio (Tier 1 capital divided by Adjusted Total Assets including off balance sheet exposures) of 3.0% between 2013 and 2018;
• Introducing measures (yet to be released) to address the impact of systematic risk and inter connectedness risk;
• Improving transparency of reporting capital ratio calculations in the financial statements;
• Increasing the capital requirements for traded market risk, credit risk, and securitization transactions.
The Basel Committee is expected to finalize the majority of the reforms by the end of calendar year 2010, for implementation between 2012 and 2019. Following the release of the final reforms by the Basel Committee, ANZ expects APRA to engage the Australian banking and insurance industry ahead of the development and implementation of revised Australian prudential standards. It is not possible to accurately determine the impacts associated with these reforms on ANZ, including revised operating capital targets, until APRA’s position is finalized.
62

2009 Tier 1 Ratio (Basel II) The Tier 1 ratio at September 30, 2009 of 10.56% represents an increase from September 30, 2008 of 286 basis points. The key contributors to the increase were:
• additional ordinary share issuances of $5.7 billion (+207 basis points) used to strengthen the balance sheet through an institutional placement ($2.5 billion) in June 2009; a Share Purchase Plan issuance to existing shareholders ($2.2 billion) in July 2009, and an under write of the non-participation in the Dividend Reinvestment Plan (‘DRP’) and Bonus Option Plan (‘BOP’) for the final 2008 dividend ($1.0 billion) in December 2008
• statutory profit after preference share dividends of $2.9 billion (+106 basis points) which included non-core items of -$0.8 billion (-30 basis points)
• ordinary share dividend commitments net of expected reinvestment through the DRP and BOP of $1.6 billion (-59 basis points)
• decrease in Risk Weighted Assets (RWA), excluding the impact of exchange rate movements of $19.2 billion due to: • portfolio decrease and mix (+36 basis points) • risk migration incorporating growth in RWA and Expected Loss versus Eligible Provision shortfall (-34 basis
points) • portfolio data review (+52 basis points) • lower non-credit risk RWA (+9 basis points)
• increase in investment/profit retention in funds management businesses, associates and commercial operations excluding the impact of exchange rate movements (-14 basis points)
• changes in the prudential treatment of a number of items (+29 basis points), principally notional goodwill in associates and other equity investments changing from a Tier 1 capital deduction to a 50/50 deduction from Tier 1 and Tier 2 capital redemption of $600 million of hybrid Tier 1 capital (-22 basis points)
• other items (net -25 basis points) including impact of exchange rate movements (-15 basis points) principally on hybrid Tier 1 instruments, movement in capitalized software expense (-8 basis points), net deferred tax assets (-8 basis points), pension deficit (-5 basis points), lower mark-to-market of ANZ credit spread (+6 basis points) and other deductions (+5 basis points).
In August 2009, ANZ announced its intention to purchase selected Asian assets from RBS. Based on the application of the Basel II standardized methodology for RWA and the transaction costs, the Tier 1 capital base would be reduced by approximately 34 basis points. These transactions are subject to regulatory approval in each jurisdiction and are expected to be completed progressively from late 2009. On November 30, 2009, ANZ completed the acquisition of RBS’s institutional business in the Philippines and expects to complete the acquisitions in the remaining markets by mid-2010.
63

Deferred acquisition costs and deferred income
The Group recognizes deferred acquisition costs relating to the acquisition of interest earning assets as assets. The Group also recognized deferred income that is integral to the yield of an originated financial instrument, net of any direct incremental costs. This income is deferred and recognized as net interest income over the expected life of the financial instrument under AASB 139: ‘Financial Instruments: Recognition and Measurement’. Deferred acquisition costs relating to INGA and INGNZ are excluded from this analysis.
The balances of deferred acquisition costs and deferred income were:
Deferred Acquisition Costs1
Deferred Income
2010 2009 2010 2009 $M $M $M $M Australia 606 530 313 310
Asia Pacific, Europe & America 1 3 51 38
New Zealand 42 64 38 43
Total 649 597 402 391
1. Deferred acquisition costs largely include the amounts of brokerage capitalized and amortized in the Business segments: Australia and New Zealand Businesses.
Deferred acquisition costs also include capitalized debt raising expenses
Deferred acquisition costs analysis 2010
2009
Amortization
Charge Capitalized
Costs1
Amortization Charge
Capitalized Costs1
$M $M $M $M
Australia 293 369 326 308
Asia Pacific, Europe & America 2 - 2 2
New Zealand 40 18 46 19
Total 335 387 374 329
1. Costs capitalized during the year exclude brokerage trailer commissions paid
Software capitalization
At September 30, 2010, the Group’s intangibles included $1,217 million in relation to costs incurred in acquiring and developing software. Details are set out in the table below:
2010
$M 2009
$M Balance at start of period 849 625
Software capitalized during the period 532 411
Amortization during the period (207) (160)
Software impaired/written-off (17) (27)
INGA and INGNZ acquisitions 60 -
Total software capitalization 1,217 849
64
Commitments
The Group leases land and buildings under operating leases from one to five years. Leases generally provide the Group with a right of renewal at which time all terms are renegotiated. Lease payments comprise a base amount plus an incremental contingent rental. Contingent rentals are based on either movements in the Consumer Price Index or operating criteria. Contingent rentals are not included in lease rental commitments, and are not provided for due to their immateriality and therefore are expensed as incurred.
The table below shows total commitments for each of the three years ended September 30. Commitments
2010 2009 2008
Years ended September 30 $M $M $M
Capital expenditure Contracts for outstanding capital expenditure No later than 1 year 58 94 428
Later than 1 year but not later than 5 years 3 - 9
Later than 5 years 1 - -
Total capital expenditure commitments 62 94 437
Lease rentals Future rentals in respect of leases Land and buildings Not later than 1 year 327 252 271
Later than 1 year but not later than 5 years 729 559 597
Later than 5 years 389 324 362
Total land and building lease rental commitments 1,445 1,135 1,230
Furniture and equipment Not later than 1 year 45 38 37
Later than 1 year but not later than 5 years 76 68 47
Later than 5 years - - -
Total furniture and equipment lease rental commitments 121 106 84
Total lease rental commitments 1,566 1,241 1,314
Total commitments 1,628 1,335 1,751 1. Relates to premises and equipment
Credit Related Commitments
The credit risk of the following facilities may be less than the contract amount, however the relevant credit risk has been taken to be the contract amount.
2010 2009 2008
Years ended September 30 $M $M $M
Undrawn facilities 124,029 106,644 111,265
65

Contingent Liabilities
The Group guarantees the performance of customers by issuing standby letters of credit and guarantees to third parties. The risk involved is essentially the same as the credit risk involved in extending loan facilities to customers, therefore these transactions are subjected to the same credit origination, portfolio management and collateral requirements for customers applying for loans. As the facilities may expire without being drawn upon, the notional amounts do not necessarily reflect future cash requirements.
The credit risk of these facilities may in practice be less than the contract amount, however the credit risk has been taken to be the contract amount.
2010 2009 2008
Years ended September 30 $M $M $M
Financial guarantees 6,313 4,760 6,679
Standby letters of credit 1,991 1,528 1,651
Bill endorsements - - 10
Documentary letter of credit 2,498 3,195 4,957
Performance related contingents 16,103 14,924 15,568
Other 580 811 1,141
Total contingent liabilities 27,485 25,218 30,006
Customer Financings
Customer financing through redeemable preference shares is undertaken as part of an in-house debt/equity hybrid capability making investments in small medium enterprise (‘SMEs’) customers. Redeemable preference shares take the form of convertible redeemable preference notes, with an equity conversion right in the event of an Initial Public Offering, trade sale or other specified trigger event.
Although legally described as preference shares, advances to customers using this product meet the definition of financial assets under IFRS, and therefore would be recorded as part of net loans and advances or investments if appropriate. Income received on these products, consistent with their recognition as assets, would be recorded as part of interest income. Our policies for management of lending in the form of redeemable preference shares are consistent with our policies for general lending of similar amounts to similar clients. Liquidity Management
Liquidity risk is the risk that the Group has insufficient capacity to fund increases in assets or is unable to meet its payment obligations as they fall due, including repaying depositors or maturing wholesale debt. The timing mismatch of cash flows and the related liquidity risk is inherent in all banking operations and is closely monitored by the Group.
Capital market conditions were generally stronger in 2010 than the prior year, however periods of increased volatility continue to occur and funding costs remain elevated. ANZ has continued to manage liquidity risks by maintaining a strong funding profile that is supported by a portfolio of liquid assets that provides coverage of offshore wholesale debt maturities well in excess of one year.
Following the publication of earlier discussion papers relating to liquidity prudential requirements, APRA and the Basel Committee have both made further announcements on this topic. These proposals include enhancements to governance and other qualitative requirements, including the requirement for a clear risk appetite statement on liquidity risk from the Board. Many of these aspects have been integrated into ANZ's liquidity management framework for some time. The proposed changes to the quantitative requirements, including changes to scenario stress tests and structural liquidity metrics, are more significant. While ANZ has an existing stress scenario framework and effective structural liquidity risk metrics and limits in place, the requirements proposed are in general more challenging. These changes will impact the future composition and size of ANZ’s liquid asset portfolio as well as the size and composition of the Bank’s funding base. The management of the Group’s liquidity and funding risk incorporates the following key components.
• Scenario Modeling
The Global financial crisis highlighted the importance of differentiating between: stressed and normal market conditions in a name-specific crisis; and the different behavior that offshore and domestic wholesale funding markets can exhibit during market stress events. Scenario modeling stresses site and total bank cash flow projections against multiple ‘survival horizons’ (A ‘Survival Horizon’ is the period that the Group is required to remain cash flow positive under a specific scenario or stress). Scenarios modeled are either prudential requirements, i.e. a ‘going-concern’ scenario, or
66

‘name crisis’ scenario; or Board approved events including ‘Name-specific’ stresses and ‘Funding market’ events. Under these scenarios, customer and wholesale balance sheet asset/liability flows are stressed.
• Funding metrics
ANZ manages its funding profile using a range of funding metrics and balance sheet disciplines. This approach is designed to ensure that an appropriate proportion of the Group’s assets are funded by stable funding sources including core customer deposits, longer-dated wholesale funding (with a remaining term exceeding one year) and equity. ANZ’s funding profile strengthened further during 2010 as a result of solid growth in customer deposits and the continued focus on avoiding short-term wholesale funding maturity concentrations.
• Customer deposits Customer deposits and other funding liabilities increased by 10% to $267.1 billion at September 30, 2010 (58% of total funding) from $242.4 billion (55% of total funding) at September 30, 2009.
• Proportion of total funding The proportion of total funding from term wholesale source has been maintained. As a result, the Group’s proportional reliance on short-term wholesale funding decreased from 17% to 12% in the year to September 30, 2010. Proportionate short-term wholesale funding has approximately halved over the last two years (22% as at September 30, 2008).
• Wholesale funding
ANZ maintained access to all major wholesale funding markets. Benchmark term debt issues were executed in AUD, USD, EUR, JPY, CAD, CHF and NZD. Short-term wholesale funding markets continue to function effectively, both locally and offshore.
$26.4 billion of term wholesale funding (with a remaining term greater than one year at the end of the financial year) was issued during 2010 largely to replace maturing term debt and also to commence pre-funding the 2011 term funding issuance requirement:
The weighted average tenor of new term debt issuance lengthened to 4.7 years (from 3.9 years in 2009)
The weighted average cost of new term debt issuance decreased approximately 42 basis points during 2010 as a result of more stable market conditions relative to the prior year. Average portfolio costs remain substantially above pre-crisis levels and continue to increase as maturing term wholesale funding is replaced at higher spreads.
In February 2010 the Australian Government announced that the Guarantee Scheme for Large Deposits and Wholesale Funding would close to new liabilities on March 31, 2010. The withdrawal of the Australian Government Guarantee did not adversely impact ANZ’s funding activities. ANZ has not used the Australian Government Guarantee for a benchmark debt issue since June 2009.
Guaranteed wholesale funding comprises only 4.6% of ANZ’s total funding.
• Liquidity portfolio
The Group holds a diversified portfolio of cash and high-quality, highly-liquid securities that may be sold or pledged to provide same-day liquidity. This portfolio helps protect the Group’s liquidity position by providing cash in a severely stressed environment. All assets held in this portfolio are securities eligible for repurchase, under agreements with the applicable central bank (i.e. repo eligible).
At September 30, 2010 the volume of eligible securities available, post any repurchase (i.e. “repo”) discounts applied by the applicable central bank, was $66.7 billion. In addition, the liquidity portfolio provided cover well in excess of offshore wholesale debt maturing within one year.
The Liquidity portfolio is well diversified by counterparty, currency, and tenor. Under the liquidity policy framework securities purchased must be of a similar or better credit quality to ANZ’s external long-term or short-term credit ratings and continue to be repo eligible.
Supplementing the prime liquid asset portfolio the Group holds additional cash and liquid asset balances. Our Markets business also holds secondary sources of liquidity in the form of highly liquid instruments in its trading portfolios. These other assets are not included in the prime liquidity portfolio outlined below:
67

Eligible Securities (Market Values1) 2010 2009 2008
Years ended September 30 $m $m $m
Australia 20,974 18,694 12,899
New Zealand 7,547 8,771 6,620
United States 1,275 1,301 2,739
United Kingdom 2,183 2,939 4,157
Asia 4,204 1,984 -
Internal RMBS (Australia) 26,657 24,508 8,305
Internal RMBS (New Zealand) 3,812 1,954 -
66,652 60,151 34,720
Counterparty credit ratings as at September 30, 2010
Long term counterparty
Credit Rating2
Market Value (post haircut)
AUD $M
AAA 51,371
AA+ 8,094
AA 694
AA- 6,169
A+ 120
A 204
Total 66,652
1. Market value is post the repo discount applied by the applicable central bank 2. Where available, based on Standard & Poor’s long-term credit ratings
68

Funding Composition
The following table shows the Group’s funding composition at September 30. 2010 2009
$M $M
Customer deposits and other liabilities 1
Australia 164,795 153,481
Asia Pacific, Europe & America 47,699 30,487
New Zealand 45,470 49,173
Total customer deposits 257,964 233,141
Other2 9,113 9,297
Total customer deposits and other liabilities (funding) 267,077 242,438
Wholesale funding
Unsubordinated debt 59,714 57,260
Loan capital 12,316 13,429
Certificates of deposit (wholesale) 39,530 44,711
Commercial paper issued 11,641 14,227
Liability for acceptances 11,495 13,762
Due to other financial institutions 20,521 19,924
Other wholesale borrowings3 2,140 1,572
Total wholesale funding 157,357 164,885
Shareholders' equity5 33,284 31,558
Total funding maturity
Short term wholesale funding 9% 14%
Liability for acceptances 3% 3%
Long term wholesale funding4
- Less than 1 year residual maturity 6% 5%
- Greater than 1 year residual maturity 16% 15%
Total customer deposits and other liabilities (funding) 58% 55%
Shareholders' equity and hybrid debt5 8% 8%
Total funding and shareholders' equity5 100% 100% 1. Includes term deposits and other deposits (excluding Collateralized Loan Obligations and securitization deposits) 2. Includes interest accruals, payables and other liabilities, provisions and net tax provisions 3. Includes net derivative balances, special purpose vehicles, other borrowings and preference share capital Euro hybrids 4. Long term wholesale funding amounts are stated at original hedged exchange rates. Movements due to currency fluctuations in actual amounts borrowed are classified as
short term wholesale funding 5. Shareholders’ equity excludes preference share capital
69

Term debt maturity profile
0
5
10
15
20
25
30
FY11 FY12 FY13 FY14 >FY14
A$bn
Government Guaranteed term debt
Subordinated debt
Senior term debt
1. Government Guaranteed Term debt consists of debt that has been guaranteed by the Australian Government pursuant to the Australian Government Guarantee Scheme for
Large Deposits and Wholesale Funding or Her Majesty the Queen in right of New Zealand acting by and through the Minister of Finance pursuant to the New Zealand Crown Wholesale Funding Guarantee.
2. Subordinated debt consists of direct, subordinated and unsecured obligations of the relevant issuer in relation to which the claims of holders are, among other things, subordinated in right of payment to senior debt in the event of the winding up of the relevant issuer.
3. Senior term debt consists of direct, unconditional and unsecured obligations of the relevant issuer that, save for certain debts of the relevant issuer required to be preferred by relevant laws, rank pari passu with all other present and future unsubordinated and unsecured obligations of the relevant issuer.
70

Supplementary Financial Information
Credit Risk Management Central and divisional credit risk teams perform key roles in portfolio management such as the development and validation of credit risk measurement systems, loan asset quality reporting, stress testing, and the development of credit policies. Credit policies and procedures cover all aspects of the credit life cycle such as transaction structuring, risk grading, initial approval, ongoing management and problem debt management, as well as specialist policy topics. The Group’s grading system is fundamental to the management of credit risk, seeking to measure the probability of default (‘PD’), the exposure at default (‘EAD’) and the loss in the event of default (‘LGD’) for all transactions. From an operational perspective, the Group’s credit grading system has two separate and distinct dimensions that:
• Measure the PD, which is expressed by a 27-grade Customer Credit Rating (‘CCR’), reflecting the ability to service and repay debt. Within the programmed credit assessment sphere, the PD is typically expressed as a score which maps back to the PD.
• Measure the LGD, which is expressed by a Security Indicator (‘SI’) ranging from A to G. The SI is calculated by reference to the percentage of loan covered by security which can be realized in the event of default. The security-related SIs are supplemented with a range of other SIs to cover situations where ANZ’s LGD research indicates certain transaction characteristics have different recovery outcomes. Within the programmed credit assessment sphere, exposures are grouped into large homogenous pools – and the LGD is assigned at the pool level.
The development and regular validation of rating models is undertaken by specialist central risk teams. The outputs from these models drive many day-to-day credit decisions, such as origination, pricing, approval levels, regulatory capital adequacy, economic capital allocation and provisioning. The risk grading process includes monitoring of model-generated results to ensure appropriate judgment is exercised (such as overrides to take into account any out-of-model factors). Loan Quality
ANZ’s policy relating to the recognition and measurement of impaired assets conforms with APRA’s guidelines.
Loans are classified as either performing or impaired. Impaired assets are on and off-balance sheet facilities where there is doubt as to whether the full contractual amount (including interest) will be received. Impaired Loans Summary of impaired financial assets 2010 2009 2008
$M $M $M
Gross Impaired loans 6,075 4,392 1,750 Restructured items 141 673 846 Gross non-performing commitments and contingencies 345 530 77
Total 6,561 5,595 2,673 2010
Gross impaired assets at $6,561 million represent a $966 million or 17% increase over September 30, 2009, driven primarily by increases in the loan balance across all regions and acquisitions ($423 million), notwithstanding an overall reduction in the level of new and increased impaired assets during the year. The reduction in restructured items reflects upgrades to productive and downgrades to impaired loans during the second half of 2010. The increase in Australia was concentrated in the first half and resulted from higher customer defaults particularly within the middle market and commercial segments. The increase in New Zealand resulted from higher levels of default primarily in the Rural and Commercial segments and was also concentrated in the first half.
Net impaired loans at $4,226 million represent a $1,346 million increase over September 30, 2009. The Group has an individual provision coverage ratio of 29%, reflecting the well secured exposures within impaired assets.
2009 Gross impaired loans at $4,392 million represent a $2,642 million increase over September 30, 2008, driven mainly by increases in Australia and New Zealand. The increase in Australia was predominantly across entities within the Institutional Relationships, Corporate Banking and Financial Institution portfolios, with the ten largest impaired loan
71

customers representing 60% of the total Australia gross impaired loans balance. There was an increase in Australia division across most businesses, as deterioration in the economic environment during 2009 resulted in higher levels of default, particularly within Esanda, Business Banking and Investment and Insurance Products. The New Zealand increase of $699 million was driven primarily by customer downgrades in the small business, commercial, agribusiness segments and mortgages portfolios. Asia Pacific, Europe & America increased slightly, resulted from increases in Europe and America. Net impaired loans at $2,880 million represent a $1,776 million increase over September 30, 2008.
2010 2009 2008
As at September 30 $M $M $M
Total Gross impaired loans 6,075 4,392 1,750
Subject to specific provision for credit impairment 5,892 4,178 1,675
Without specific allowance for loan losses 183 214 75
Gross Impaired Loans by Region As at September 30
2010 $M
2009 $M
2008 $M
Australia 3,837 3,232 1,306
Asia Pacific, Europe & America 687 187 170
New Zealand 1,551 973 274
Total 6,075 4,392 1,750
New Impaired Loans by Region* As at September 30
2010 $M
2009 $M
2008 $M
Australia 3,518 4,485 2,211
Asia Pacific, Europe & America 324 256 199
New Zealand 1,690 1,392 379
Total 5,532 6,133 2,789
* Excludes impaired loans acquired from acquisitions.
72
Impaired Loans – five year summary Years ended September 30 2010 2009 2008 2007 2006
$M $M $M $M $M
Gross impaired loans subject to specific allowance Australia 3,717 3,110 1,272 478 488
Asia Pacific, Europe & America 630 145 149 26 19
New Zealand 1,545 923 255 92 126
Total 5,892 4,178 1,676 596 633
Individual provision for credit impairment (1,849) (1,512) (646) (260) (279)
Net exposure 4,043 2,666 1,030 336 354
Gross impaired loans not subject to specific provision Australia 120 123 34 36 19
Asia Pacific, Europe & America 57 41 21 27 3
New Zealand 6 50 19 7 6
183 214 74 70 28
Net impaired loans1 4,226 2,880 1,104 406 382
Gross impaired loans Australia 3,837 3,232 1,306 514 507
Asia Pacific, Europe & America 1,551 973 170 53 22
New Zealand 687 187 274 99 132
Total 6,075 4,392 1,750 666 661
Individual provision for credit impairment (1,849) (1,512) (646) (260) (279)
Net impaired loans1 4,226 2,880 1,104 406 382
Ratio of individual provision for credit impairment to gross impaired loans 28.5% 34.4% 36.9% 39.0% 42.2% 1. Excluding off-balance sheet commitments that have been classified as non-performing commitments and contingincies of $345 million (2009: $530 million, 2008: $77
million, 2007: $36 million,) net of a provision of $26 million (2009: $14 million, 2008: $29 million, 2007: $9 million;)
73

Restructured items
The Group distinguishes between facilities renegotiated on a commercial basis, on terms similar to those offered to new clients with similar risk, and those renegotiated on non-commercial terms as a result of a client’s inability to meet original contractual obligations. In the course of restructuring facilities due to financial difficulty, the Group may consider modifying its terms to include concessions such as a reduction in the principal amount, a deferral of repayments, and/or an extension of the maturity date materially beyond those typically offered to new facilities with similar risk.
Restructured facilities are classified as productive and must demonstrate sound prospects of being able to adhere to the modified contractual terms. Where doubt exists as to the capacity to sustain the modified terms, the facilities remain impaired and an appropriate level of individual provision is held. Years ended September 30 2010 2009 2008
$M $M $M
Australia 134 298 846 Asia Pacific, Europe & America - 374 - New Zealand 7 1 - Total restructured items 141 673 846
1. Represents customer facilities which for reason of financial difficulty have been re-negotiated on terms which the Bank considers as uncommercial but necessary in the
circumstances, and are not considered non-performing. Includes both on and off balance sheet exposures.
Non-performing commitments and contingencies
Set out below are off balance sheet facilities (such as standby letters of credit, bill endorsements, documentary letters of credit, guarantees to third parties) and undrawn on balance sheet facilities where the customer is defined as impaired.
2010 2009 2008
Years ended September 30 $M $M $M
Australia 312 503 72
New Zealand 24 27 5
Asia Pacific, Europe & America 9 - -
Gross impaired commitments and contingencies 345 530 77
Other potential problem loans
ANZ does not use the category ‘potential problem loans’ for loans that continue to accrue interest. ANZ’s risk grading systems identify customers that attract a higher probability of default and where necessary these customers receive specialist management attention.
Accruing loans – past due 90 days or more
Set out below are loans which are past due by over 90 days. A facility is past due when a contracted payment (principal or interest) has not been met or the facility is outside of contractual arrangements (e.g. an overdraft is over its limit). This category comprises accrual loans that are past due 90 days or more and that are well secured, or loans that are past due 90 days or more and are portfolio managed (typically unsecured personal loans and credit cards) that can be held on an accrual basis for up to 180 days. Years ended September 30 2010 2009 2008
$M $M $M
Australia 1,234 1,068 776
Asia Pacific, Europe & America 83 164 25
New Zealand 238 365 259
Total past due loans 1,555 1,597 1,060
74

Provision for Credit Impairment
The provision for credit impairment represents management's best estimate of the losses incurred in the loan portfolio at balance date based on its experienced judgment.
Credit exposures, including loans and advances and off-balance sheet items, such as commitments and guarantees, are reviewed at least at each reporting date for impairment. Credit impairment provisions are raised for exposures that are known to be impaired. Exposures are impaired and impairment losses are recorded if, and only if, there is objective evidence of impairment as a result of one or more loss events that occurred after the initial recognition of the loan and prior to the reporting date, and that loss event, or events, has had an impact on the estimated future cash flows of the individual loan or the collective portfolio of loans that can be reliably estimated. Impairment is assessed for assets that are individually significant (or on a portfolio basis for small value loans) and then on a collective basis for those exposures not individually known to be impaired.
Exposures that are assessed collectively are placed in pools of similar assets with similar risk characteristics. The required provision is estimated on the basis of historical loss experience for assets with credit risk characteristics similar to those in the collective pool. The historical loss experience is adjusted based on current observable data such as changed economic conditions. The provision also takes account of the impact of inherent risk of large concentrated losses within the portfolio.
The estimated impairment losses are measured as the difference between the assets’ carrying amount and the estimated future cash flows discounted to their present value. As this discount unwinds during the period between recognition of impairment and recovery of the cash flow, it is recognized in interest income. The process of estimating the amount and timing of cash flows involves considerable management judgment. These judgments are reviewed regularly to reduce any differences between loss estimates and actual loss experience.
The collective provision is estimated on the basis of historical loss experience for assets with credit characteristics similar to those in the collective pool. In order to reduce any differences between loss estimates and actual loss experience, the historical loss experience is reviewed and may be adjusted based on current observable data and events and an assessment of the impact of model deficiencies.
The collective provision is regularly reviewed to ensure it is adequate, having regard to the loss rate and term of the portfolio. The provision for credit impairment is determined from analysis of both individual loan and portfolio risk gradings, associated default and loss expectancy rates and an assessment of the emergence period for incurred losses.
75

Provision for credit impairment Years ended September 30 2010 2009 2008
$M $M $M
Individual provision for credit impairment
Australia 977 1,060 516
New Zealand 469 391 111
Principal domestic markets 1,446 1,451 627
Asia Pacific, Europe & America 429 75 48
Total individual provision for credit impairment 1,875 1,526 675
Collective provision for credit impairment 3,153 3,000 2,821
Total provision for credit impairment 5,028 4,526 3,496
Collective provision for credit impairment
Balance at start of period 3,000 2,821 1,992
Provisions acquired 240 - -
Adjustment for exchange rate fluctuations (83) (56) 11
Charge/(Credit) to income statement (4) 235 818
3,153 3,000 2,821
Individual provisions for credit impairment
Balance at start of period 1,526 675 270
Increase of provisions 1,770 2,750 1,032
Provisions acquired 394 - -
Adjustment for exchange rate fluctuations (100) (22) -
Discount unwind (165) (73) (28)
Bad debts written off (1,693) (1,889) (699)
Recoveries of amounts previously written-off 143 85 100
Balance at end of period 1,875 1,526 675
Total provisions for credit impairment 5,028 4,526 3,496
Provision movement analysis
New and increased provisions for credit impairment
Australia 1,620 2,387 978
New Zealand 559 540 187
Asia Pacific, Europe & America 171 118 72
2,350 3,045 1,237
Provision for credit impairment releases (437) (210) (105)
1,913 2,835 1,132
Recoveries of amounts previously written off (143) (85) (100)
Individual provision for credit impairment 1,770 2,750 1,032
Impairment of available-for-sale assets 21 20 98
Collective provision for credit impairment (4) 235 818
Charge to income statement 1,787 3,005 1,948
76

Concentrations of Credit Risk / Loans and Advances by Industry Category
Although ANZ’s loan portfolio is spread across many countries, at year end 2010 73% of gross loans and advances were booked in Australia (September 30, 2009: 72%), and 20% were booked in New Zealand (September 30, 2009: 23%). The inherent risk characteristics of ANZ’s loan portfolio are therefore very much linked to general economic conditions in Australia and New Zealand, where the portfolio is diversified across different regions, industries, customer types and products.
As at September 30, 2010, ANZ’s largest credit exposure in Australia was in the category ‘Personal Lending’ (66%) which includes consumer lending secured by a mortgage. Over the year, growth was recorded in ANZ’s Mortgages Australia portfolio (12%) as a result of continuing customer demand for retail housing and investment loans.
The Group monitors its portfolios, to identify and assess risk concentrations. The Group’s strategy is to maintain well-diversified low risk credit portfolios focused on achieving the best risk-return balance. Credit risk portfolios are actively monitored and frequently reviewed to identify, assess and guard against unacceptable risk concentrations. Concentration analysis will typically include geography, industry, credit product and risk grade. Risk management also applies single customer counterparty limits (‘SCCLs’) to protect against unacceptably large exposures to single name risk. These limits are established based on a combination of factors including nature of counter party, probability of default and collateral provided. Analysis and reporting of concentration risk is a core focus of Divisional & Group risk functions and where appropriate the Group applies ‘concentration’ controls.
Also refer to Note 33 of ANZ’s 2010 Annual Report, excerpts of which are attached to this U.S. Disclosure Document as Annex A, for details.
77

Section 4: Directors, Senior Management/Executives and Employees Directors
In accordance with the rules of the ANZ Constitution, as amended December 18, 2007 (the ‘Constitution’), and except as otherwise required by the Corporations Act 2001 (Cth) (‘Corporations Act’), any other applicable law, and the Listing Rules of the ASX, the Board of Directors has power to manage the business of the Group and may exercise all powers not required to be exercised at a general meeting of shareholders. At October 1, 2010, the Directors were: Director's Name Position held Year appointed Age
J P Morschel Chairman, Independent Non-Executive Director 2004 67
G J Clark Independent Non-Executive Director 2004 67
D E Meiklejohn Independent Non-Executive Director 2004 68
I J Macfarlane, AC Independent Non-Executive Director 2007 64
M R P Smith, OBE Chief Executive Officer, Executive Director 2007 54
A M Watkins Independent Non-Executive Director 2008 47
P A F Hay Independent Non-Executive Director 2008 60
Lee Hsien Yang Independent Non-Executive Director 2009 53
Under the Constitution, a non-executive Director must retire from office at the third annual general meeting after being elected or last re-elected and may seek re-election. At October 1, 2010, the Board comprised nine independent non-executive Directors and one executive Director, the Chief Executive Officer. Refer to Section 2: Information on the Group – Recent Developments for further update regarding the Board of Directors. Directors’ Profiles MR. J P Morschel DipQS, FAICD
Chairman, Independent Non-Executive Director, Chair of the Governance Committee Non-executive director since October 2004. Ex officio member of all Board Committees.
Skills, experience and expertise Mr Morschel has a strong background in banking, financial services and property and brings the experience of being a Chairman and Director of major Australian and international companies.
Current Directorships Director: CapitaLand Limited (from 2010), Tenix Group Pty Limited (from 1998) and Gifford Communications Pty Limited (from 2000).
Former Directorships include Former Chairman: Rinker Group Limited (Chairman and Director 2003 – 2007), Leighton Holdings Limited (Chairman and Director 2001-2004) and CSR Limited (Director 1996-2003, Chairman 2001-2003). Former Director: Singapore Telecommunications Limited (2001-2010), Rio Tinto Limited (1998-2005), Westpac Banking Corporation (1993-2001) and Lend Lease Corporation Limited (1983 – 1995).
Age: 67 Residence: Sydney.
78

MR. M R P SMITH, OBE BSc (Hons)
Chief Executive Officer Chief Executive Officer, Executive Director since October 1, 2007.
Skills, experience and expertise Mr. Smith is an international banker with 30 years experience in banking operations in Asia, Australia and internationally. Until June 2007, he was President and Chief Executive Officer, The Hong Kong and Shanghai Banking Corporation Limited, Chairman, Hang Seng Bank Limited, Global Head of Commercial Banking for the HSBC Group and Chairman, HSBC Bank Malaysia Berhad. Previously, Mr. Smith was Chief Executive Officer of HSBC Argentina Holdings SA. Mr. Smith joined the HSBC Group in 1978 and during his international career he has held a wide variety of roles in Commercial, Institutional and Investment Banking, Planning and Strategy, Operations and General Management.
Current Directorships Director: ANZ National Bank Limited (from 2007) and The Financial Markets Foundation for Children (from 2008). Member: Chongqing Mayor’s International Economic Advisory Council (from 2006), Australian Bankers’ Association Incorporated (from 2007), Business Council of Australia (from 2007), Asia Business Council (from 2008), Financial Literacy Advisory Board (from 2008), Visa International Senior Advisory Council (from 2009) and Shanghai International Financial Advisory Council (from 2009). Fellow: The Hong Kong Management Association (from 2005).
Former Directorships include Former Chairman: HSBC Bank Malaysia Berhad (2004-2007) and Hang Seng Bank Limited (2005-2007). Former CEO and Director: The Hong Kong and Shanghai Banking Corporation Limited (2004-2007). Former Director: HSBC Australia Limited (2004-2007), HSBC Finance Corporation (2006-2007) and HSBC Bank (China) Company Limited (2007). Former Board Member: Visa International (Asia Pacific) Limited (2005-2007).
Age: 54 Residence: Melbourne. DR G J CLARK BSc (Hons), PhD, FAPS, FTSE
Independent Non-Executive Director, Chair of the Technology Committee Non-executive director since February 2004. Member of the Governance Committee and Human Resources Committee.
Skills, experience and expertise Dr Clark is Principal of Clark Capital Partners, a U.S.-based firm that advises internationally on technology and the technology market place. Previously he held senior executive positions in IBM, News Corporation, and Loral Space and Communications. He brings to the Board international business experience and a distinguished career in micro- electronics, computing and communications.
Current Directorships Chairman: KaComm Communications Pty Ltd (Director from 2006).
Former Directorships include Former Chairman: GPM Classified Directories (2007-2008). Former Director: Eircom Holdings Ltd (formerly Babcock & Brown Capital Limited) (2006-2009).
Age: 67 Residence: New York and Sydney.
79

MR. P A F Hay LLB (Melb), FAICD Independent Non-Executive Director Non-executive director since November 2008. Member of the Risk Committee, Audit Committee and Human Resources Committee.
Skills, experience and expertise Mr Hay has a strong background in company law and investment banking advisory work, with a particular expertise in relation to mergers and acquisitions. He has also had significant involvement in advising governments and government-owned enterprises. Current Directorships Chairman: Lazard Pty Ltd Advisory Board (from 2009). Director: Alumina Limited (from 2002), Landcare Australia Limited (from 2008), GUD Holdings Limited (from 2009) NBN Co Limited (from 2009) and Mayer Holdings Limited (from 2010). Part Time Member: Takeovers Panel (from 2009). Former Directorships include Former Chief Executive Officer: Freehills (2000–2005). Former Director: Pacifica Group Limited (1989–2008) and Lazard Pty Ltd (2007–2009). Age: 60 Residence: Melbourne. Mr Lee Hsien Yang MSc, BA Independent Non-Executive Director Non-executive director since February 2009. Member of the Technology Committee and Risk Committee. Skills, experience and expertise Mr Lee Hsien Yang is one of Asia’s most respected business leaders and has considerable knowledge of the region. He has a background in engineering and brings to the Board his international business and management experience across a wide range of sectors including food and beverages, properties, publishing and printing, telecommunications, financial services, education, civil aviation and land transport. Current Directorships Chairman: Fraser & Neave, Limited (from 2007) and Civil Aviation Authority of Singapore (from July 2009). Director: Singapore Exchange Limited (from 2004), The Islamic Bank of Asia Limited (from 2007) and Kwa Geok Choo Pte Ltd (from 1979). Member: Governing Board of Lee Kuan Yew School of Public Policy (from 2005), Rolls Royce International Advisory Council (from 2007). Consultant: Capital International Inc Advisory Board (from 2007). Former Directorships include Former Chairman: Republic Polytechnic (2002–2009). Former Director: SingTel Optus Pty Limited (2002–2007), Singapore Post Limited (1995–2007), L & L Services Pte Ltd (2004–2008) and Board of INSEAD (1999–2007). Former Member: Textron International Advisory Council (1999–2008) and Merrill Lynch PacRim Advisory Council (2007-2010). Former Chief Executive Officer: Singapore Telecommunications Limited (1995–2007). Age: 53 Residence: Singapore.
80

MR. I J MACFARLANE, AC BEc (Hons), MEc, Hon DSc (Syd), Hon DSc (UNSW), Hon DCom (Melb), Hon DLitt (Macq), Hon LLD (Monash)
Independent Non-Executive Director, Chair of the Risk Committee Non-executive director since February 2007. Member of the Governance Committee and Technology Committee.
Skills, experience and expertise During his 28 year career at the Reserve Bank of Australia including a 10 year term as Governor, Mr Macfarlane made a significant contribution to economic policy in Australia and internationally. He has a deep understanding of financial markets as well as a long involvement with Asia.
Current Directorships Director: Woolworths Limited (from 2007), Leighton Holdings Limited (from 2007), and the Lowy Institute for International Policy (from 2004). Member: Council of International Advisors to the China Banking Regulatory Commission (from 2009), International Advisory Board of Goldman Sachs JB Were (from 2007) and International Advisory Board of CHAMP Private Equity (from 2007).
Former Directorships include Former Chairman: Payments System Board (1998 – 2006), Australian Council of Financial Regulators (1998 – 2006), Financial Markets Foundation for Children (1996 – 2006). Former Governor: Reserve Bank of Australia (Member 1992 – 2006, Chairman 1996 – 2006).
Age: 64 Residence: Sydney. MR. D E MEIKLEJOHN, AM BCom, DipEd, FCPA, FAICD, FAIM
Independent Non-Executive Director, Chair of the Audit Committee Non-executive director since October 2004. Member of the Human Resources Committee and Risk Committee.
Skills, experience and expertise Mr Meiklejohn has a strong background in finance and accounting. He also brings to the Board his experience across a number of directorships of major Australian companies spanning a range of industries.
Current Directorships Chairman: PaperlinX Limited (Director from 1999). Director: Coca Cola Amatil Limited (from 2005) and Mirrabooka Investments Limited (from 2006). President: Melbourne Cricket Club (Committee member from 1987).
Former Directorships include Former Director and Chief Financial Officer: Amcor Limited (1985-2000).
Age: 68 Residence: Melbourne.
81

Ms A M Watkins BCom, FCA, F Fin, MAICD Independent Non-Executive Director, Chair of the Human Resources Committee Non-executive director since November 2008. Member of the Audit Committee and Risk Committee. Skills, experience and expertise Ms Watkins is an experienced CEO and established director with a grounding in finance and accounting. Her experience includes retailing, agriculture, food manufacturing and financial services, and covers small to medium companies as well as large organizations. Current Directorships Chief Executive Officer: GrainCorp Limited (from 2010). Director: AICD Victorian Council (from 2007) and The Nature Conservancy Australian Advisory Board (from 2007). Member: Takeovers Panel (from 2010). Former Directorships include Former Chairman: Mrs Crocket’s Kitchen (2006-2007) Former Chief Executive Officer: Bennelong Group (2008-2010). Former Director: Just Group Limited (2004-2008), Woolworths Limited (2007-2010) and Yarra Capital Partners Pty Ltd (2008-2010). Former Partner: McKinsey & Company (1996–1999). Age: 47 Residence: Melbourne.
82

Senior Management and Executives
At October 1, 2010 the senior management and executives (excluding non-executive directors) of ANZ were:
Executive Officers Position held
Year appointed to position
Year joined Group
M R P Smith Age – 54
Chief Executive Officer Over 30 years experience in the Banking and Financial Services Industry. Roles prior to ANZ include: President and Chief Executive Officer, The Hong Kong and Shanghai Banking Corporation Limited; Chairman, Hang Seng Bank Limited; Global Head of Commercial Banking for the HSBC Group and Chairman, HSBC Bank Malaysia Berhad.
2007 2007
S Babani Age – 50
Group Managing Director, Human Resources Over 21 years experience in the Financial Services Industry. Roles prior to ANZ include: Global Head of Human Resources HSBC Insurance, Chief Operating Officer, Global Resourcing HSBC Group (East Asia) and Executive Vice President HSBC Bank USA
2008 2008
D Cartwright Age – 51
Chief Operating Officer Over 27 years experience in Operations and Technology in the Financial Services Industry. Roles prior to ANZ include: Chief Executive Officer of Intelligent Processing Solutions Limited (iPSL), Senior Technology roles within Barclays PLC.
2007 2007
P Chronican Age - 54
Chief Executive Officer, Australia Over 27 years experience in the Banking and Financial Services Industry. Roles prior to ANZ include: Group Executive, Westpac Institutional Bank, Chief Financial Officer, Westpac Banking Corporation.
2009 2009
S Elliott Age – 46
Chief Executive Officer, Institutional Over 24 years experience in the Banking and Financial Services Industry. Roles prior to ANZ include: Head of Business Development, EFG Hermes; Chief Operating Officer, EFG Hermes; various senior positions at Citigroup across geographies and business sectors over the course of 20 years which include: CEO Global Transaction Services Asia Pacific, CEO Corporate Bank Australia/NZ & Country Corporate Officer, Vice President Strategic Planning New York, Head of Investor Derivative Sales London, and Head of NZ Derivatives Sales and Trading.
2009 2009
D Hisco Age – 47
Chief Executive Officer, New Zealand Over 30 years experience in the Banking and Financial Services Industry. Previous roles within ANZ include Managing Director Esanda and Managing Director Retail Banking.
2010 1985
G K Hodges Age – 55
Deputy Chief Executive Officer Over 30 years experience across Corporate Banking and Commercial Banking. Previous roles within ANZ include: Chief Executive Officer, Australia (Acting), Chief Executive and Director of ANZ National Bank, Group Managing Director Corporate, Managing Director Corporate and Small to Medium Business, Head of Corporate Banking, Chief Economist.
2009 1991
P R Marriott Age – 53
Chief Financial Officer Over 30 years experience in International Banking, Finance and Auditing. Previous roles within ANZ include: Group General Manager Credit Risk Management, General Manager Group Accounting.
1997 1993
C Page Age – 59
Chief Risk Officer Over 35 years experience in the Banking and Financial Services Industry. Previous roles within ANZ include: Head of Risk, Asia Pacific. Roles prior to ANZ include: Chief Credit Officer, Asia Pacific with HSBC.
2008 2007
J Phillips Age – 48
Group Managing Director Strategy, M&A, Marketing and Innovation Over 25 years experience in the Banking and Financial Services Industry. Roles prior to ANZ include: President & Chief Operating Officer, American Life Insurance Company (ALICO); Head of International Retail Banking, New York, Citigroup; Country Business Manager, Citigroup Japan; President & CEO, Citicorp Diners Club, Citigroup Japan; Managing Director, GE Capital Global Consumer Finance, GE Japan; Director Marketing, GE Capital, GE USA.
2009 2009
A Thursby Age – 50
Chief Executive Officer, Asia Pacific, Europe and America Over 22 years experience in the Banking and Financial Services Industry. Roles prior to ANZ include senior Institutional roles with Standard Chartered Bank in Singapore, North East Asia, China, and United Arab Emirates.
2008 2007
A Weatherston Age - 53
Chief Information Officer Over 17 years experience in IT roles. Roles prior to ANZ include: Group Chief Information Officer, Bank of Ireland; IT Director, Abbey/Santander; Director of UK Business Integration, Gaz de France; Director of Business Strategy, Development and IT, Student Loans Company; Head of European Convergence/Head of Strategy and Architecture Europe, National Australia Group; Project Director IT Transformation/Head of Development - Operation Division, Royal Bank of Scotland.
2010 2010
There are no family relationships between or among any key management personnel. All executives can be contacted through our Company Secretary on (613) 8654-8576 or in writing to the Company Secretary, Australia and New Zealand Banking Group Limited, Level 9, 833 Collins Street, Docklands, Victoria 3008, Australia.
83

Corporate Governance Corporate Governance at ANZ
In relation to corporate governance, the ANZ Board seeks to:
• embrace principles and practices it considers to be best practice internationally;
• be an ‘early adopter’, where appropriate, by complying before a published law or recommendation takes effect; and
• take an active role in discussions regarding the development of corporate governance best practice and associated regulation in Australia and overseas.
Compliance with Corporate Governance Codes
ANZ has equity securities listed on the ASX and the NZX, and debt securities listed on these and other overseas securities exchanges. As such, ANZ must comply with a range of listing and corporate governance requirements from both Australia and overseas.
• Australia
As a company listed on the ASX, ANZ is required to disclose how it has applied the Recommendations contained within the ASX Corporate Governance Council’s Corporate Governance Principles and Recommendations (ASX Governance Principles) during the financial year, explaining any departures from them.
Full details of the location of the references in this statement (and elsewhere in this U.S. Disclosure Document) which specifically set out how ANZ applies each Recommendation of the ASX Governance Principles are contained on ANZ’s website at www.anz.com About us > Our company > Corporate Governance.
Changes to the ASX Governance Principles were announced in June 2010, and will come into effect for ANZ’s financial year beginning on October 1, 2011. In many cases ANZ is already in compliance with the revised ASX Governance Principles, and in other cases ANZ will seek to be an early adopter of the changes, where appropriate.
• New Zealand As an overseas listed issuer on the NZX, ANZ is deemed to comply with the NZX Listing Rules provided that it remains listed on the ASX, complies with the ASX listing rules and provides the NZX with all the information and notices that it provides to the ASX. The ASX Governance Principles may materially differ from the NZX’s corporate governance rules and the principles of the NZX’s Corporate Governance Best Practice Code. More information about the corporate governance rules and principles of the ASX can be found at www.asx.com.au and, in respect of the NZX, at www.nzx.com. Irrespective of any differences, ANZ has complied with all applicable governance principles both in Australia and New Zealand throughout the financial year.
• Other Jurisdictions
ANZ also monitors best practice developments in corporate governance across other relevant jurisdictions.
ANZ deregistered from the SEC with effect from October 2007. Despite no longer being required to comply with U.S. corporate governance rules, ANZ has decided to continue with certain governance practices required under U.S. regulations as being best practice, including practices in relation to the independence of Directors, the independence of the external auditor and the financial expertise of the Audit Committee, as described in this statement.
• Website Full details of ANZ’s governance framework are set out at www.anz.com > About us > Our Company > Corporate Governance.
This section of ANZ’s website also contains copies of all the charters and summaries of many of the documents and policies mentioned in this statement, as well as summaries of other ANZ policies of interest to shareholders and stakeholders. The website is regularly updated to ensure it reflects ANZ’s most recent corporate governance information.
84

Recognition In 2010, ANZ was assessed as the leading bank globally on the Dow Jones Sustainability Index (‘DJSI’) for the fourth consecutive year. ANZ received a rating of 92/100 for Corporate Governance as part of this assessment. Board Responsibility and Delegation of Authority
The Board is chaired by an independent non-executive director. The roles of the Chairman and Chief Executive Officer are separate, and the Chief Executive Officer is the only executive director on the Board.
• Role of the Chairman
The Chairman plays an important leadership role and is involved in:
• chairing meetings of the Board and providing effective leadership to it;
• monitoring the performance of the Board and the mix of skills and effectiveness of individual contributions;
• being a member of all principal Board Committees;
• maintaining ongoing dialogue with the Chief Executive Officer and providing appropriate mentoring and guidance; and
• being a respected ambassador for ANZ, including chairing meetings of shareholders and dealing with key customer, political and regulatory parties.
• Board Charter
The Board Charter clearly sets out the Board’s purpose, powers, and specific responsibilities. The Board is responsible for:
• charting the direction, strategies and financial objectives for ANZ and monitoring the progress in relation to such matters;
• monitoring compliance with regulatory requirements, ethical standards and external commitments, and the implementation of related policies;
• appointing and reviewing the performance of the Chief Executive Officer; and • reporting to shareholders on ANZ’s performance.
In addition to the above and any matters expressly required by law to be approved by the Board, powers specifically reserved for the Board include:
• approval of ANZ’s Remuneration Policy, including various remuneration matters as detailed in the Charter; • any matters in excess of any discretions delegated to Board Committees or the Chief Executive Officer; • annual approval of the budget and strategic plan; • significant changes to organizational structure; and • the acquisition, establishment, disposal or cessation of any significant business.
Under ANZ’s Constitution, the Board may delegate any of its powers and responsibilities to Committees of the Board. The roles of the principal Board Committees are set out in the 2010 Annual Report attached hereto as Annex A.
• Board Meetings
The Board normally meets at least eight times each year, including an offsite meeting to review in detail the Group’s strategy.
Typically at Board meetings the agenda will include:
• minutes of the previous meeting and outstanding issues raised by Directors at previous meetings;
• the Chief Executive Officer’s report;
• the Chief Financial Officer’s report;
• reports on major projects and current business issues;
• specific business proposals;
• reports from Chairs of Committees which have met since the last Board meeting on matters considered at those meetings;
• for review, the minutes of Committee meetings which have occurred since the last Board meeting.
There are two private sessions held at the end of each Board meeting which are each chaired by the Chairman of the Board.
85

The first involves all Directors including the CEO, and the second involves only the non-executive Directors.
The Chief Financial Officer, the Group General Counsel and a Company Secretary are also present at all Board meetings. Members of Senior Management attend Board meetings when an issue under their areas of responsibility is being considered or as otherwise requested by the Board. CEO and Delegation to Management
The Board has delegated to the Chief Executive Officer, and through the Chief Executive Officer to other senior management, the authority and responsibility for managing the everyday affairs of ANZ. The Board monitors management and performance on behalf of shareholders.
The Group Discretions Policy details the comprehensive discretions framework that applies within ANZ and to employees appointed to operational roles or directorships of related entities.
The Group Discretions Policy is maintained by the Chief Financial Officer and reviewed annually by the Audit Committee with the outcome of this review reported to the Board.
At a senior management level, ANZ has a Management Board which comprises the Chief Executive Officer and ANZ’s most senior executives.
As at 30 September 2010, the following senior executives, in addition to the Chief Executive Officer, were members of the Management Board: Graham Hodges – Deputy Chief Executive Officer; Peter Marriott – Chief Financial Officer; Phil Chronican - Chief Executive Officer, Australia; David Hisco – Chief Executive Officer, New Zealand; Shayne Elliott - Chief Executive Officer, Institutional; Alex Thursby – Chief Executive Officer, Asia Pacific, Europe & America; David Cartwright– Group Chief Operating Officer; Susie Babani– Group Managing Director, Human Resources; Chris Page – Chief Risk Officer; Joyce Phillips - Group Managing Director, Strategy, M&A, Marketing and Innovation; and Anne Weatherston – Chief Information Officer.
Typically, the Management Board meets every week and has a full day meeting each month to discuss business performance, review shared initiatives and build collaboration and synergy across the Group. See page 84 of this U.S. Disclosure Document. Board Composition, Selection and Appointment
The Board strives to achieve a balance of skills, tenure, experience, diversity, and perspective among its Directors.
The Governance Committee (see below) has been delegated responsibility to review and make recommendations to the Board regarding Board composition, and to assist in relation to the director nomination process.
The Governance Committee conducts an annual review of the size and composition of the Board, to assess whether there is a need for any new non-executive Director appointments. The review takes the following factors into account: relevant guidelines/legislative requirements in relation to Board composition; Board membership requirements as articulated in the Board Charter; and other considerations including ANZ’s strategic goals and the importance of having appropriate Board balance and
diversity.
In relation to balance and diversity, the guiding principle is that the Board’s composition should reflect balance in such matters as: • specialist skill representation relating to both functions (such as accounting/finance, law and technology) and
industry background (such as banking/financial services, retail, professional services); • tenure; • Board experience (amongst the members of the Board, there should be a significant level of familiarity with formal
Board and Governance processes and a considerable period of time previously spent working at senior level within one or more organizations of significant size);
• age spread; • diversity in general (including gender diversity); and • geographic experience.
Other matters for explicit consideration by the Committee are personal qualities, communication capabilities, ability and commitment to devote appropriate time to the task, the complementary nature of the distinctive contribution each director might make, professional reputation and community standing.
86

Potential candidates for new directors for new directors may be provided at any time by a Board member to the Chair of the Governance Committee. The Chair of the Governance Committee maintains a list of potential nominees to assist the Board in the succession planning process. Where there is a need for any new appointments, a formal assessment of nominees will be conducted by the Government Committee. In assessing nominees, the Governance Committee has regard to the principles set out above. Professional intermediaries may be used from time to time where deemed necessary and appropriate to assist in the process of identifying and considering potential candidates for Board membership. If found suitable, candidates are recommended to the Board. The Chairman of the Board is responsible for approaching potential candidates. The Committee also reviews and recommends the process for the election of the Chairman of the Board and reviews succession planning for the Chairman of the Board, making recommendations to the Board as appropriate.
• Appointment Documentation
Each new non-executive Director receives an appointment letter accompanied by a:
• Directors’ handbook – The handbook includes information on a broad range of matters relating to the role of a Director, including details of all applicable policies; and
• Directors’ Deed – Each Director signs a Deed in a form approved by shareholders at the 2005 Annual General Meeting which covers a number of issues including indemnity, directors’ and officers’ liability insurance, the right to obtain independent advice and requirements concerning confidential information.
• Undertaking Induction Training Every new Director takes part in a formal induction program which involves the provision of information regarding ANZ’s values and culture, the Group’s governance framework, the non-executive Directors Code of Conduct and Ethics, Director related policies, Board and Committee policies, processes and key issues, financial management and business operations. A briefing is also provided by senior management about matters concerning their areas of responsibility.
• Meeting Share Qualification Non-executive Directors are required to accumulate within 5 years of appointment, and thereafter maintain, a holding in ANZ shares that is equivalent to at least 100% of a non-executive Director’s base fee (and 200% of this fee in the case of the Chairman).
• Election at next Annual General Meeting Subject to the provisions of ANZ’s Constitution and the Corporations Act 2001, the Board may appoint a person as a non-executive Director of ANZ at any time, but that person must retire and, if they wish to continue in that role, must seek election by shareholders at the next Annual General Meeting.
• Fit and Proper
ANZ has a robust framework in place to ensure that individuals appointed to relevant senior positions within the Group have the appropriate fitness and propriety to properly discharge their prudential responsibilities on appointment and during the course of their appointment.
The framework, set out in ANZ’s Fit and Proper Policy, addresses the requirements of APRA’s Fit and Proper Prudential Standard. It involves assessments being carried out for each Director, relevant senior executive and the lead partner of ANZ’s external auditor prior to a new appointment being made. These assessments are carried out against a benchmark of documented competencies which have been prepared for each role, and also involve attestations being completed by each individual, as well as the obtaining of evidence of material qualifications and the carrying out of checks such as criminal record, bankruptcy and regulatory disqualification checks.
These assessments are reviewed thereafter on an annual basis. The Governance Committee and the Board have responsibility for assessing the fitness and propriety of non-executive Directors. The Human Resources Committee is responsible for assessing the fitness and propriety of the Chief Executive Officer and key senior executives. The Audit Committee is responsible for assessing the fitness and propriety of the external auditor.
Fit and Proper assessments were successfully carried out in respect of each non-executive Director, the Chief Executive Officer, key senior executives and the external auditor during the 2010 fiscal year.
87

• Independence and Materiality
Under ANZ’s Board Charter, the Board must contain a majority of non-executive Directors who satisfy ANZ’s criteria for independence.
The Board Charter sets out independence criteria in order to establish whether a non-executive Director has a relationship with ANZ which could (or could be perceived to) impede their decision-making.
All non-executive Directors are required to notify the Chairman of a potential change in their outside Board appointments. The Chairman reviews the proposed appointments and will consult with other Directors as the Chairman deems appropriate. In the 2010 financial year, the Board conducted its annual review of criteria for independence against the ASX Governance Principles and APRA Prudential Standards, as well as U.S. director independence requirements.
ANZ’s criteria are more comprehensive than those set in many jurisdictions including in particular criteria stipulated specifically for Audit Committee members. The criteria and review process are both set out in the Corporate Governance section of ANZ’s website.
In summary, a relationship with ANZ is regarded as material if a reasonable person would expect there to be a real and sensible possibility that it would influence a Director’s mind in: • making decisions on matters likely to come regularly before the Board or its Committees; • objectively assessing information and advice given by management; • setting policy for general application across ANZ; and • generally, carrying out the performance of his or her role as a Director.
During 2010, the Board reviewed each non-executive Director’s independence and concluded that the independence criteria were met by each non-executive Director.
Directors’ biographies (set out on pages 79 to 83 of this U.S. Disclosure Document) highlight their major associations outside of ANZ.
• Conflicts of Interest Over and above the issue of independence, each Director has a continuing responsibility to determine whether he or she has a potential or actual conflict of interest in relation to any material matter which comes before the Board. Such a situation may arise from external associations, interests or personal relationships.
Under the Directors Disclosure of Interest Policy and Policy for Handling Conflicts of Interest, a Director may not exercise any influence over the Board if a potential conflict of interest exists.
In such circumstances, the Director may not receive relevant Board papers and, unless the other Directors have resolved to the contrary, may not be present for Board deliberations on the subject, and may not vote on any related Board resolutions. These matters, should they occur, are recorded in the Board minutes.
• Independent Advice
In order to assist Directors in fulfilling their responsibilities, each Director has the right (with the prior approval of the Chairman) to seek independent professional advice regarding his/her responsibilities at the expense of ANZ. In addition, the Board and each Committee, at the expense of ANZ, may obtain whatever professional advice it requires to assist in its work.
• Tenure and Retirement
ANZ’s Constitution, consistent with the ASX Listing Rules, provides that a non-executive Director must seek re-election by shareholders every 3 years if they wish to continue in their role as a non-executive Director.
In addition, ANZ’s Board Renewal and Performance Evaluation Policy confirms that non-executive Directors will retire once they have served a maximum of three 3-year terms after first being elected by shareholders unless invited by the Board to extend their tenure due to special circumstances.
88

• Continuing Education
ANZ Directors take part in a range of training and continuing education programs. In addition to a formal induction program (described above), Directors also receive regular bulletins designed to keep them abreast of matters relating to their duties and responsibilities as Directors.
Each Committee also conducts its own continuing education sessions from time to time as appropriate. Internal and/or external experts are engaged to conduct all education sessions. Directors also receive regular business briefings at Board meetings. These briefings are intended to provide Directors with information on each area of ANZ’s business, in particular regarding performance, key issues, risks and strategies for growth. In addition, Directors have the opportunity to participate in site visits from time to time.
• Access to Directors
Management is able to consult Directors as required. Employees have access to the Directors directly or through the Company Secretary. Shareholders who wish to communicate with the Directors may direct correspondence to a particular Director, or to the non-executive Directors as a whole.
• Role of Company Secretary
The Board is responsible for the appointment of ANZ’s Company Secretaries. The Board has appointed three Company Secretaries. The Group General Counsel provides legal advice to the Board as and when required. He works closely with the Chair of the Governance Committee to develop and maintain ANZ’s corporate governance principles, and is responsible to the Board for the Company Secretary’s Office function.
The Company Secretary is responsible for the day-to-day operations of the Company Secretary’s Office including lodgments with relevant Securities Exchanges and other regulators, the administration of Board and Board Committee meetings (including preparation of meeting minutes), the management of dividend payments and associated share plans, the administration of the Group’s Australian subsidiaries and oversight of the relationship with ANZ’s Share Registrar.
The Chief Financial Officer is also appointed as a Company Secretary. Profiles of ANZ’s Company Secretaries can be found in the Directors’ Report within the 2010 Annual Report (attached to this U.S. Disclosure Document as Annex A).
• Performance Evaluations
The framework used to assess the performance of Directors is based on the expectation they are performing their duties: • in the interests of shareholders; • in a manner that recognizes the great importance that ANZ places on the values of honesty, integrity, quality and
trust; • in accordance with the duties and obligations imposed upon them by ANZ’s Constitution, Non-Executive Directors’
Code of Conduct and Ethics, and the law; and • having due regard to ANZ’s corporate responsibility objectives, and the importance of ANZ’s relationships with all
stakeholders and the communities and environments in which ANZ operates.
The performance criteria also take into account each Director’s contribution to: • charting the direction, strategy and financial objectives of ANZ; • monitoring compliance with regulatory requirements and ethical standards; • monitoring and assessing management’s performance in achieving strategies and budgets approved by the Board; • setting criteria for and evaluating the Chief Executive Officer’s performance; and • the regular and continuing review of executive succession planning and executive development activities.
The performance evaluation process is set out in ANZ’s Board Renewal and Performance Evaluation Policy.
• Non-Executive Directors
Non-executive Director performance evaluations are conducted in two ways:
Annual review – On an annual basis or more frequently if appropriate, the Chairman has a one-on-one meeting with each non-executive Director specifically addressing the performance criteria including compliance with the non-executive Directors’ Code of Conduct and Ethics. To assist the effectiveness of these meetings, the Chairman is
89

provided with objective information about each Director (e.g. number of meetings attended, Committee memberships, other current directorships, etc) and a guide for discussion to ensure consistency. A report on the outcome of these meetings is provided to the Governance Committee and to the Board.
Re-election statement – Non-executive Directors when nominating for re-election are given the opportunity to submit a written or oral statement to the Board setting out the reasons why they seek re-election. In the non-executive Director’s absence, the Board evaluates this statement and has regard to the performance criteria when it considers whether to endorse the relevant Director’s re-election.
• Chairman of the Board
An annual review of the performance of the Chairman of the Board is undertaken based on input from each Director individually on the performance of the Chairman of the Board against the competencies for the Chairman’s role approved by the Board.
The input from each Director is collated and an overview report is provided to the Governance Committee, as well as feedback to the Chairman of the Board.
• The Board
It is expected that externally facilitated reviews of the Board will occur approximately every three years. During 2008/2009 the performance of the Board in respect of the previous year was assessed using an independent external facilitator, who sought input from each Director and certain members of senior management when carrying out the assessment.
The review process in the intervening years is conducted internally, and considers progress against any recommendations implemented arising from the most recent externally facilitated review, together with any new issues that may have arisen.
• Board committees
Each of the principal Board Committees conducts an annual Committee performance self-assessment to review performance using Guidelines approved by the Governance Committee. The Guidelines set out that at a minimum, the self-assessments should review and consider the following:
• the scope of the Committee’s responsibilities and duties as enshrined in its Charter;
• the Committee’s performance against its Charter and annual calendar of business;
• the Committee’s performance against any goals or objectives it set itself for the year under review;
• major issues considered by the Committee during the year; and
• the identification of future topics for training/education of the Committee.
The outcomes of the performance self-assessments, along with plans and objectives for the new financial year, are submitted to the Governance Committee (and, in the case of the Governance Committee, to the Board) for discussion and noting.
• Senior Management
Details of how the performance evaluation process is undertaken by the Board in respect of the Chief Executive Officer and other key senior executives including how financial, customer, operational and qualitative measures are assessed, are set out in the Remuneration Report in the 2010 Annual Report attached to this U.S. Disclosure Document as Annex A.
• Review processes undertaken
Board, Board Committee and relevant senior management evaluations in accordance with the above processes have been undertaken in respect of the 2009/2010 reporting period, with one exception. It was believed not necessary or appropriate to carry out a performance review of the Chairman of the Board given the recent change of Chairman.
• Board Committees
As set out in this section above, under Corporate Governance of this U.S. Disclosure Document, the Board has the ability under its Constitution to delegate its powers and responsibilities to Committees of the Board. This allows the
90

Board to spend additional and more focused time on specific issues. ANZ’s Board has five principal Board Committees: Audit Committee, Governance Committee, Human Resources Committee, Risk Committee and Technology Committee.
• Membership and Attendance Each of the principal Board Committees is comprised solely of independent non-executive Directors, has its own Charter and has the power to initiate any special investigations it deems necessary. Membership criteria are based on each Director’s skills and experience, as well as his/her ability to add value and commit time to the Committee. Composition is reviewed annually by the Board. The Chairman is an ex-officio member of each principal Board Committee. The Chief Executive Officer is invited to attend Board Committee meetings as appropriate. His presence is not automatic, however, and he does not attend any meeting where his remuneration is considered or discussed, nor does he attend the non-executive Director private sessions of Committees. Non-executive Directors may attend any meeting of any Committee. Each Board Committee may, within the scope of its responsibilities, have unrestricted access to management, employees and information it considers relevant and necessary to carrying out its responsibilities under its Charter. Each Board Committee may require the attendance of any ANZ officer or employee, or request the attendance of any external party, at meetings as appropriate.
• Meetings The principal Board Committees plan their annual agendas following a process approved by the Board. The offices of the executives who are appointed to assist the Chair of each Board Committee liaise in order to review the calendars of business prepared by each Committee and identify any potential gaps and unnecessary overlaps between the Committees. Any issues arising from this are reported to, and resolved by, the relevant Committee Chairs. The results of this process are then reported to the Governance Committee to assist the Board in fulfilling its oversight responsibilities in respect of the delegations it has made to the various Board Committees. Committees report at the next Board meeting through the Committee Chairs. When there is a cross-Committee item, the Committees will communicate with each other through their Chairs. Throughout the year, each Committee Chair also conducts agenda planning meetings involving relevant stakeholders to take account of emerging issues. The number of Board meetings and meetings of Committees during the year the Director was eligible to attend, and the number of meetings attended by each Director were:
ANZ Board Committee Memberships – as at September 30, 2010 Audit Governance Human Resources Risk Technology
Mr D E Meiklejohn (C, FE)
Mr P A F Hay
Ms A M Watkins (FE)
Mr J P Morschel (ex officio)
Mr J P Morschel (C)
Dr G J Clark
Mr I J Macfarlane
Ms A M Watkins (C)
Dr G J Clark
Mr P A F Hay
Mr D E Meiklejohn
Mr J P Morschel (ex officio)
Mr I J Macfarlane (C)
Mr P A F Hay
Mr Lee Hsien Yang
Mr D E Meiklejohn
Ms A M Watkins
Mr J P Morschel (ex officio)
Dr G J Clark (C)
Mr. I J Macfarlane
Mr Lee Hsien Yang
Mr J P Morschel (ex officio)
C - Chair, FE – Financial Expert Mr C B Goode was an ex Offico member of all Board Committees prior to his retirement from the Board on February 28, 2010. Mr J P Morschel was a member of all Board Commitees from October 1, 2009 unitl he succeeded Mr C B Goode as Chairman of the Board when he continued to act as a member of each Committee on an ex officio basis, other than the Governanace Commitee, which he has chaired.
• Audit Committee
The Audit Committee is responsible for the oversight and monitoring of:
• ANZ’s financial reporting principles and policies, controls and procedures;
• the effectiveness of ANZ’s internal control and risk management framework in connection with financial governance;
• the work of Internal Audit which reports directly to the Chair of the Audit Committee (refer to Internal Audit on page 59 of the 2010 Annual Report for more information);
• the Audit Committees of significant subsidiary companies;
• prudential supervision procedures required by regulatory bodies relating to financial reporting; and
• the integrity of ANZ’s financial statements, compliance with related regulatory requirements and the independent audit thereof.
91

The Audit Committee is also responsible for:
• the appointment, annual evaluation and oversight of the external auditor, including reviewing their independence and fitness and propriety;
• compensation of the external auditor; and
• where appropriate, replacement of the external auditor.
Under the Committee Charter, all members of the Audit Committee must be appropriately financially literate. Both Mr Meiklejohn (Chair) and Ms Watkins were determined to be a ‘financial expert’ during the 2010 financial year under the definition set out in the Audit Committee Charter. While the Board has determined that Mr Meiklejohn and Ms Watkins each have the necessary attributes to be a ‘financial expert’ in accordance with the relevant requirements, it is important to note that this does not give rise to Mr Meiklejohn or Ms Watkins having responsibilities additional to those of other members of the Audit Committee. The Audit Committee meets with the external auditor and internal auditor without management being present. The Chair of the Audit Committee meets separately and regularly with the Group General Manager, Internal Audit, the external auditor and management. The Deputy Chief Financial Officer is the executive responsible for assisting the Chair of the Committee in connection with the administration and efficient operation of the Committee. Substantive areas of focus in the 2010 financial year included:
• Internal and External Audit – the Committee approved the annual plans for internal and external audit and kept progress against those plans under regular review. Adjustments to the internal audit plan were made during the year to accommodate changes arising from businesses acquired and high focus items arising from the integration of these businesses;
• Regulatory developments – reports on accounting developments were provided to the Committee outlining relevant changes and implications for ANZ;
• Financial Reporting Governance Program – the Committee continued to monitor the progress of the 2010 Financial Reporting Governance Program and received regular updates on key themes, areas of focus, and Program status; and
• Whistleblowing – the Committee received reports on disclosures made under ANZ’s Global Whistleblower Protection Policy.
• Governance Committee
The Governance Committee is responsible for: • identifying and recommending prospective Board members and ensuring appropriate succession planning for the
position of Chairman (see page 52 of the 2010 Annual Report); • ensuring there is a robust and effective process for evaluating the performance of the Board, Board Committees
and non-executive Directors (see pages 54 to 55 of the 2010 Annual Report); • ensuring an appropriate Board and Board Committee structure is in place; • reviewing and approving the Charters for each Board Committee except its own, which is reviewed and approved by
the Board; and • reviewing the development of and approving corporate governance policies and principles applicable to ANZ.
The Group General Counsel is the executive responsible for assisting the Chair of the Committee in connection with the administration and efficient operation of the Committee.
Substantive areas of focus in the 2010 financial year included:
• Succession Planning – two long serving Directors retired during the financial year, and a new Chairman was appointed. Mr Morschel was appointed to succeed Mr Goode as Chairman upon Mr Goode’s retirement in February 2010 following 19 years’ service as a Director and 15 years’ service as Chairman. In addition Mr Ellis retired at the 2009 AGM after 15 years’ service as a Director. All current non-executive Directors are subject to the Director tenure policy which limits the period of service to a maximum of three 3 year terms after election by shareholders;
• Board governance framework – the Committee conducted its annual review of the Board’s governance framework and principles including in relation to Board composition and size, Director tenure, outside commitments, Board and Committee education, nomination procedures and Director independence criteria;
• Board and Committee performance evaluations – the Committee reviewed the major themes arising from the annual Board performance review process, and considered whether any aspects of the Board’s oversight framework could be strengthened. The Committee also received annual performance self-assessment reports from each of the other principal Board Committees; and
• Review and approval of Group policies – the Committee reviewed and, where appropriate, approved
92

amendments to existing Group policies including the Continuous Disclosure Policy, Global Employee Securities Trading and Conflict of Interest Policy, Board Renewal and Performance Evaluation Policy, Fit & Proper Policy, Director independence criteria and assessment process, Shareholder Charter, Employee Code of Conduct and Ethics, and Policy on Provision of Banking Facilities to Directors and Senior Officers.
• Human Resources Committee The Human Resources Committee assists the Board in relation to remuneration matters and senior executive succession, including for the Chief Executive Officer. The Committee also assists the Board by reviewing and approving policies, as well as monitoring performance, with respect to Health and Safety issues and Diversity. The Committee’s Charter was reviewed and amended during the year to address new regulatory requirements issued by APRA. The Committee is responsible for reviewing and making recommendations to the Board on: • all remuneration matters relating to the Chief Executive Officer (details in the Remuneration Report on pages 16 to
45 of the 2010 Annual Report); • performance and remuneration, including incentive arrangements, for other Board Appointees and key senior
executives who may be able to affect ANZ’s financial soundness; • the design of remuneration structures and significant incentive plans; and • the Group’s Remuneration Policy and remuneration strategy. In addition, the Committee considers and approves the appointment of Board Appointees and senior executive succession plans. The Group Managing Director, Human Resources is the executive responsible for assisting the Chair of the Committee in connection with the administration and efficient operation of the Committee. Substantive areas of focus and in the 2010 financial year included: • Management roles and performance – the Committee reviewed the performance of the CEO, the CEO’s direct
reports and other key roles and ensured that succession plans were in place for Management Board and business critical roles;
• Regulatory changes – the Committee considered the impacts of APRA Prudential Standards on remuneration, the changes to taxation on employee equity plans, the Productivity Commission Review and the termination payments cap legislation. As a result, a number of changes to remuneration practices were made during the year to further strengthen the alignment of rewards with prudent risk taking. The Committee continues to closely monitor regulatory developments and implications for ANZ;
• Fitness and Propriety – the Committee completed fit and proper assessments for all existing and new Board Appointees; and
• Remuneration – the Committee approved the grant of up to $1,000 of shares to each eligible employee under the Employee Share Acquisition Plan, and reviewed and approved amendments to the bonus framework for the Institutional Division. The Committee conducted an annual review of remuneration for non-executive Directors and decided to maintain the existing freeze on director fees for the 2009/10 financial year (apart from a reduction in the Chairman’s fees and an increase in the fees payable to the Chair and Members of the Audit Committee), and also reviewed the compensation structure for senior executives and agreed not to increase their base salaries for the 2009/10 financial year.
For more details on the activities of the Human Resources Committee, please refer to the Remuneration Report on pages 16 to 45 of the 2010 Annual Report (Annex A to this U.S. Disclosure Document).
• Risk Committee
The Board is principally responsible for approving the Group’s risk tolerance, related strategies and policies, for the oversight of policy compliance and for the effectiveness of the risk and compliance management framework that is in place.
The Risk Committee is delegated responsibility for overseeing, monitoring and reviewing the Group’s risk management principles and policies, strategies, processes and controls including credit, market, liquidity, balance sheet, operational, compliance and other reputational risk control frameworks, as well as the culture of the organization in connection with such matters. The Committee is also authorized to approve credit transactions and other related matters beyond the approval discretion of executive management.
The Chief Risk Officer is the executive responsible for assisting the Chair of the Committee in connection with the administration and efficient operation of the Committee.
93

Substantive areas of focus in the 2010 financial year included:
• Economic Environment – the Committee received updates on the global economic environment and closely monitored the volatility in markets as aftershocks continued to work through the system following the global financial crisis;
• Regulatory Change – the Committee monitored proposed new financial regulations, both local and global, aimed at promoting the resilience of the banking systems in various jurisdictions;
• Acquisitions – updates were received and reviewed regarding the integration of businesses acquired from the Royal Bank of Scotland Group plc and Landmark Financial Services, and the acquisition of ING Group’s 51% shareholding in the ANZ-ING wealth management and life insurance joint ventures;
• Provisioning – the Committee regularly monitored provisioning levels; and
• Risk Control Frameworks – the Committee approved an updated Operational Risk Management Framework and revised Credit Approval Discretions.
In addition, Management reported to the Risk Committee during the year as to the effectiveness of ANZ’s risk and compliance management framework and the management of ANZ’s material business risks.
In August 2008, ANZ released the findings of the Review Committee which examined ANZ’s involvement in Securities Lending and its relationship with Broker clients including the Opes Prime group. ANZ pursued a remediation program to address the 13 recommendations arising from the Review. While ANZ will continue to report its progress on some longer-term aspects of the program to APRA, in January 2010 APRA advised ANZ that it was comfortable to formally close its oversight of the remediation program.
ANZ introduced a new training program (‘Understanding Risk in our World’) during the year as part of its commitment to embedding the principle that risk is every employee’s responsibility. The program, which is to be undertaken by all ANZ employees, focuses on increasing understanding of risk management to improve each employee’s ability to make more effective decisions on behalf of ANZ.
For further information on how ANZ manages its material financial risks, please see the disclosures in relation to AASB 7 ‘Financial Instruments: Disclosure’ in the notes to the financial statements in Annex A.
For further information on Risk Management Governance and related ANZ policies, please see the Corporate Governance section of www.anz.com
• Technology Committee
The Technology Committee assists the Board in the effective discharge of its responsibilities in relation to technology and operations related matters. The Committee is responsible for the oversight and evaluation of major technology and operations projects above $100 million, security issues relevant to ANZ’s technology, long term technology and operations planning, and the approval of policies, strategies and control frameworks for the management of technology risk.
The Chief Information Officer and Chief Operating Officer are responsible for assisting the Chair of the Committee in connection with the administration and efficient operation of the Committee.
Substantive areas of focus in the 2010 financial year included:
• Review of new and existing major projects – the Committee reviewed proposed new major projects and
monitored progress of existing major projects;
• Strategy – the Committee received reports on major strategic initiatives, including expected future technology
and operations investments;
• Security – updates were received on key information security issues, and various tactical and strategic
activities planned to remediate or control them; and
• Service and Systems Stability and Performance – the Committee received regular reports on operational
performance, and actions undertaken to maintain or improve service stability.
94

• Directors’ Meetings
The number of Board meetings and meetings of Committees during the year that each Director was eligible to attend, and the number of meetings attended by each Director were:
Board Audit Committee
Governance Committee
Human Resources Committee
Risk Committee
Technology Committee
Executive Committee*
Shares Committee*
Committee of the Board*
A B A B A B A B A B A B A B A B A B G J Clark 12 12 - - 4 4 5 4 - - 5 5 - - - - - - J K Ellis 4 3 - - - - - - - - - - - - - - - - C B Goode 6 6 5 4 2 2 3 3 2 2 3 3 - - 1 1 4 4 P A F Hay 12 12 9 8 - - 5 5 6 6 - - - - - - 1 1 Lee Hsien Yang 12 12 - - - - - - 6 6 5 5 - - - - - - I J Macfarlane 12 12 - - 4 4 - - 6 6 5 5 - - - - - - D E Meiklejohn 12 12 9 9 - - 5 4 6 6 - - 1 1 - - 3 3 J Morschel 12 12 9 9 4 4 5 5 6 6 5 5 1 1 2 2 6 6 M R P Smith 12 12 - - - - - - - - - - 1 1 2 2 6 6 A M Watkins 12 12 9 7 - - 5 5 6 5 - - - - 2 2 1 1
Column A - Indicates the number of meetings the Director was eligible to attend. Column B - Indicates the number of meetings attended. * The meetings of the Executive Commitee, Shares Committee and Committee of the Board as referred to in the table above include those conducted by written resolution.
• Additional Committees In addition to the five principal Board Committees, the Board has constituted an Executive Committee and a Shares Committee, each consisting solely of Directors, to assist in carrying out specific tasks. The Executive Committee has the full power of the Board and is convened as necessary between regularly scheduled Board meetings to deal with urgent matters. The Shares Committee has the power to manage on behalf of the Board the issue of shares and options (including under ANZ’s Employee Share Plan and Share Option Plan). The Board also forms and delegates authority to ad-hoc Committees of the Board as and when needed to carry out specific tasks. Audit and Financial Governance
• Internal Audit
Internal Audit is a function independent of management whose role is to provide the Board of Directors and Management with an effective and independent appraisal of the Company’s internal controls. Operating under a Board approved Charter, the Group General Manager Internal Audit reports directly and solely to the Chair of the Audit Committee, with a direct communication line to the Chief Executive Officer and the external auditors. The Global audit plan is derived utilizing a risk based approach and is refreshed on a quarterly basis. The Audit Committee approves the plan, the associated budget and any changes thereto quarterly. All audit activities are conducted in accordance with ANZ policies and values, as well as local and international auditing standards, and the results are reported to the fully conform to the Audit Committee, Risk Committee and Management. These results influence the performance assessment of business heads. Internal Audit monitors the remediation of audit issues and highlights the current status of any outstanding audits.
• External Audit
The external auditor’s role is to provide an independent opinion that ANZ’s financial reports are true and fair and comply with applicable regulations. The external auditor performs an independent audit in accordance with Australian Auditing Standards. The Audit Committee oversees ANZ’s Policy on Relationship with the External Auditor (‘the Policy’). Under the Policy, the Audit Committee is responsible for the appointment (subject to ratification by shareholders) and also the compensation, retention and oversight of the external auditor.
The Policy also stipulates that the Audit Committee: • pre-approves all audit and non-audit services on an engagement by engagement basis or pursuant to specific pre-
approval policies adopted by the Committee; • regularly reviews the independence of the external auditor; and • evaluates the effectiveness of the external auditor.
The Policy also requires that all services provided by the external auditor, including the non-audit services that may be provided by the external auditor, must be in accordance with the following principles:
95

• the external auditor should not have a mutual or conflicting interest with ANZ; • the external auditor should not audit its own work; • the external auditor should not function as part of management or as an employee; and • the external auditor should not act as an advocate of ANZ.
The Policy, which sets out in detail the types of services the external auditor may and may not provide, can be found on the Corporate Governance section of www.anz.com.
Details of the non-audit services provided by the external auditor, KPMG, during the 2010 financial year, including their dollar value, together with the statement from the Board as to their satisfaction with KPMG’s compliance with the related independence requirements of the Corporations Act 2001, are set out in the Directors’ Report on page 12 of the 2010 Annual Report (attached as Annex A).
In addition, ANZ requires a two year period before any former partner or employee of the external auditor is appointed as a Director or senior executive of ANZ. The lead partner of the external auditor is required to rotate off the ANZ audit after 5 years and cannot return for a further five years. Certain other senior audit staff are required to rotate off after a maximum of seven years. Any appointments of ex-partners or ex-employees of the external auditor as ANZ finance staff or at senior management level or higher, must be pre-approved by the Chair of the Audit Committee.
As disclosed in previous Disclosure Documents, in 2004 the U.S. Securities and Exchange Commission (‘SEC’) commenced an inquiry into non-audit services provided by ANZ’s auditor, KPMG. ANZ has provided the information requested by the SEC. This inquiry has not concluded. Should the SEC determine that services provided by KPMG did not comply with the U.S. auditor independence rules, the SEC may seek sanctions, the nature and amount of which are not known. Whilst ANZ cannot predict the outcome of the inquiry, based on information currently available, ANZ does not believe it will have a material adverse effect on the Company.
• Financial Controls
The Audit Committee of the Board oversees ANZ’s financial reporting policies and controls, the integrity of ANZ’s financial statements, the relationship with the external auditor, the work of Internal Audit, and the Audit Committees of various significant subsidiary companies.
ANZ maintains a Financial Reporting Governance (‘FRG’) Program which evaluates the design and tests the operation of key financial reporting controls. In addition half-yearly certifications are completed by senior management, including senior finance executives. These certifications comprise representations and questions about financial results, disclosures, processes and controls and are aligned with ANZ’s external obligations. The process is independently evaluated by Internal Audit and tested under the FRG Program.
Any issues arising from the evaluation and testing are reported to the Audit Committee. This process assists the Chief Executive Officer and Chief Financial Officer in making the certifications to the Board under the Corporations Act and ASX Governance Principles as set out in the Directors’ Report within the 2010 Annual Report. Ethical and Responsible Decision-Making
Codes Of Conduct And Ethics
ANZ has two main Codes of Conduct and Ethics, the Employee Code and the non-executive Directors Code. These Codes provide employees and Directors with a practical set of guiding principles to help them make decisions in their day to day work. Having two Codes recognizes the different responsibilities that Directors have under law but enshrines the same values and principles.
The Codes embody honesty, integrity, quality and trust, and employees and Directors are required to demonstrate these behaviors and comply with the Codes whenever they are identified as representatives of ANZ.
The principles underlying ANZ’s Codes of Conduct and Ethics are: • We act in ANZ’s best interests and value ANZ’s reputation; • We act with honesty and integrity; • We treat others with respect, value difference and maintain a safe working environment; • We identify conflicts of interest and manage them responsibly; • We respect and maintain privacy and confidentiality; • We do not make or receive improper payments, benefits or gains; • We comply with the Codes, the law and ANZ’s policies and procedures; and • We immediately report any breaches of the Codes, the law or ANZ policies and procedures.
96

The Codes are supported by the following detailed policies that together form ANZ’s Conduct and Ethics Policy Framework: • ANZ Anti-Money Laundering and Counter-Terrorism Financing Program; • ANZ Use of Systems, Equipment and Information Policy; • ANZ Global Fraud and Corruption Policy; • ANZ Group Expense Policy; • ANZ Equal Employment Opportunity, Bullying and Harassment Policy; • ANZ Health and Safety Policy; • ANZ Global Employee Securities Trading and Conflicts of Interest Policy; • ANZ Global Anti-Bribery Policy; and • ANZ Global Whistleblower Protection Policy.
ANZ has implemented Values and Ethics training sessions to be run by ANZ leaders with their direct reports at manager level or above. The sessions are designed to build line manager capability, equipping ANZ leaders and their teams with tools and knowledge to make value-based, conscious and ethical business decisions and create team behavior standards that are in line with the ANZ Values.
Within two months of starting work with ANZ, and thereafter on an annual basis, all employees are required to complete a training course that takes each employee through the eight Code principles and a summary of their obligations under each of the policies in the Conduct and Ethics Policy Framework. Employees are required to declare that they have read and understand the principles of the Employee Code, including key relevant extracts of the policies set out above.
To support the Employee Code of Conduct and Ethics, ANZ’s Global Performance Improvement and Unacceptable Behavior Policy sets out the process to be followed to determine whether the Code has been breached and the consequences that should be applied to employees who are found to have breached the Code. Under the ANZ Global Performance Management Framework, any breach of the Code that leads to a consequence (such as a warning) will result in an unacceptable risk/compliance/behavior flag being given at the time of the performance assessment. A flag must be taken into account when determining an employee’s performance and remuneration outcome and will almost always negatively impact those outcomes for the financial year in question.
Directors’ compliance with the non-executive Directors Code continues to form part of their annual performance review.
• Securities Trading
ANZ’s Global Employee Securities Trading and Conflicts of Interest Policy prohibits trading in ANZ securities or the securities of other companies by all employees and Directors who are aware of unpublished price-sensitive information.
The Policy specifically prohibits restricted employees and their associates trading in ANZ securities during ‘blackout periods’ leading up to the day following the half-yearly and annual results announcements.
Non-executive Directors are required to seek approval from the Chairman in advance of any trading in ANZ securities. The Chairman of the Board is required to seek approval from the Chairman of the Audit Committee. Senior Executives and other restricted employees are also required to seek approval before they, or their associates, trade in ANZ securities.
It is a condition of the grant of employee deferred shares, share options and rights that no schemes are entered into by any employee that specifically protect the value of such shares, options and rights before the shares have vested or the options or rights have entered their exercisable period. Any breach of this prohibition would constitute a breach of the grant conditions and would result in the forfeiture of the relevant shares, options or rights.
Directors and Management Board members are also prohibited from providing ANZ securities as security in connection with any margin loan or similar financing arrangement under which they may be subject to a margin call or loan to value ratio obligations.
• Whistleblower Protection
The ANZ Global Whistleblower Policy provides a mechanism by which ANZ employees, contractors and consultants may report or escalate serious matters on a confidential basis, without fear of reprisal, dismissal or discriminatory treatment.
Complaints may be made under the Policy to designated Whistleblower Protection Officers, or via an independently managed Whistleblower Protection hotline.
97

Commitment to Shareholders
Shareholders are the owners of ANZ and our approaches described below are enshrined in ANZ’s Shareholder Charter. A copy of the Shareholder Charter can be found on the Corporate Governance section of www.anz.com.
• Communication
In order to make informed decisions about ANZ, and to communicate views to ANZ, it is important for shareholders to have an understanding of ANZ’s business operations and performance.
ANZ encourages shareholders to take an active interest in ANZ, and seeks to provide shareholders with quality information in a timely fashion generally through ANZ’s reporting of results, ANZ’s Annual Report and Shareholder Review, briefings, half yearly newsletters and via its dedicated shareholder site on www.anz.com. ANZ strives for transparency in all its business practices, and recognizes the impact of quality and transparent disclosure on the trust and confidence of shareholders, the wider market and the community. To this end, ANZ, outside of its scheduled result announcements, issued additional Trading Updates to the market during the financial year.
Should shareholders require any information, contact details for ANZ and its Share Registrar are set out in the Shareholder Review, ANZ’s half yearly shareholder newsletters and the Investor Center section of www.anz.com.
• Meetings
To allow as many shareholders as possible to have an opportunity to attend shareholder meetings, ANZ rotates meetings around capital cities and makes them available to be viewed online using webcast technology.
Prior to the Annual General Meeting, shareholders are provided the opportunity to submit any questions they have for the Chairman or Chief Executive Officer to enable key common themes to be considered.
The external auditor is present at ANZ Annual General Meetings and available to answer shareholder questions on any matter that concerns them in their capacity as auditor.
The letter of appointment, which has been agreed to and signed by all non-executive Directors, states that Directors are also expected to attend and be available to meet shareholders at the Annual General Meeting each year.
Shareholders have the right to vote on various resolutions related to company matters. If shareholders are unable to attend a meeting they can submit their proxies via post or electronically. Where votes are taken on a poll, which is usual ANZ practice, shareholders are able to cast their votes on a confidential basis. ANZ appoints an independent party to verify the results, normally KPMG, which are reported as soon as possible to the ASX and posted on www.anz.com.
• Continuous Disclosure
ANZ’s practice is to release all price-sensitive information in a timely manner and as required under the ASX Listing Rules and then to all relevant Securities Exchanges on which ANZ’s securities are listed, and to the market and community generally through ANZ’s media releases, website and other appropriate channels.
Through ANZ’s Continuous Disclosure Policy, ANZ demonstrates its commitment to continuous disclosure. The Policy reflects relevant obligations under applicable securities exchange listing rules and legislation. For disclosure purposes, price-sensitive information is information that a reasonable person would expect to have a material effect on the price or value of ANZ’s securities.
Designated Disclosure Officers have responsibility for reviewing proposed disclosures and making decisions in relation to what information can be or should be disclosed to the market. Each ANZ employee is required to inform a Disclosure Officer regarding any potentially price-sensitive information concerning ANZ as soon as they become aware of it.
In carrying out the role, the Disclosure Officers recognize ANZ’s commitment to achieve best practice in terms of disclosure by acting in accordance with the spirit, intention and purposes of the applicable regulatory requirements by looking beyond form to substance.
A committee of senior executives (the Continuous Disclosure Review Sub-Committee) also meets on a regular basis each quarter to overview the effectiveness of ANZ’s systems and procedures for achieving compliance with applicable regulatory requirements in relation to the disclosure of price-sensitive information. This Sub-Committee reports to the Governance Committee of the Board on an annual basis.
98

• Corporate Responsibility ANZ aims to be a role model for responsible business growth and business behavior as it pursues its goal to become a super-regional bank. ANZ’s corporate responsibility framework responds to the priorities of customers, shareholders, employees, community groups, regulators and governments across ANZ’s business. It emphasizes the role ANZ plays in society – helping to create prosperity and build thriving communities while growing ANZ’s business responsibly. The following 5 priority areas guide ANZ’s corporate responsibility investments, initiatives and decisions globally: • education and employment opportunities; • bridging urban and rural social and economic divides; • financial capability; • responsible practices; and • urban sustainability.
The Corporate Responsibility Committee is chaired by ANZ’s Chief Executive Officer. The Committee provides strategic leadership on the corporate responsibility agenda and monitors progress and results.
Each year, ANZ sets public targets and a business-wide program of work to respond to the most material issues and opportunities for its industry. This year ANZ achieved or made strong progress on over 90% of its public targets.
ANZ keeps interested stakeholders abreast of developments through a monthly e-bulletin and annual corporate responsibility reporting. Detailed information on ANZ’s approach and result is available on www.anz.com > About us > Corporate Responsibility.
• Diversity at ANZ Workplace diversity is a strategic asset, helping ANZ to outperform its competitors and position ANZ as a super regional bank in all the geographies in which it operates. It is not just about doing the right thing; it’s about valuing and using people’s unique attributes and creating a level playing filed so every employee can fully contribute and help ANZ achieve superior business performance and deliver value to its customers and shareholders. ANZ’s goal is to have a workforce that reflects the diversity of the communities in which it operates. It supports an inclusive workplace where employee differences in areas like gender, age, culture, disability and lifestyle choice are valued. The unique perspectives, experiences ad contributions of ANZ’s people are the source of ANZ’s creativity, innovation and business success. That’s why diversity in the workplace is so important. ANZ established a Diversity Council in 2004 to introduce strategies and sponsor initiatives to create a more inclusive culture at ANZ. The Diversity Council is chaired by the Chief Executive Officer, and is responsible for setting the strategic direction and focus areas across ANZ in relation to diversity. It is also a decision-making forum of senior executive members across the Group, who are working together to build a diverse workforce and inclusive culture to enhance ANZ’s business performance.
• Diversity achievements for the year ended September 30, 2010 ANZ set an objective to increase the proportion of women in management from 36.8% to 38.0% during the year ended September 30, 2010. ANZ exceeded this target, with the proportion of women in management increasing from 36.8% to 38.4%. In addition, other diversity objectives set for the year ended September 30, 2010 and the outcome achieved include the following:
- 215 Indigenous trainees recruited against the target of 180; and
- 38 new employees with a declared disability were recruited against a full year target of 35.
As at September 30, 2010, the proportion of women employed globally at different levels of ANZ was as follows:
- Senior Executive level: 23.9% (including two new female appointees to ANZ’s Management Board)
- Senior Manager level: 27.6%
99

- Management level: 40.6%
- Across the organization: 56.9%
• ANZ’s participation in broader societal activities As one of the largest corporations operating in many of its markets, ANZ also recognizes the role it can play as a responsible corporate citizen in creating a more inclusive society for people from diverse and disadvantaged backgrounds. This year, for example, ANZ supported the Equal Opportunity for Women in Workplace Agency (EOWA) Women in Leadership Census; sponsored the Sydney Mardi Gras and participated in leadership forums aimed at encouraging more employment opportunities for Indigenous Australian people, people with a disability and refugees.
• Diversity Objectives for the year ending September 30, 2011
For the year ending September 30, 2011, ANZ has set the following measurable gender diversity objectives:
Group Baseline (September 30, 2010) Year end target Senior Executives 23.9% 25.8% Senior Manager 27.6% 29.3% Manager 40.6% 42.2% Total Women in Management 38.4% 42.2% Total across the organization 56.9% Maintain
In addition, ANZ has set the following objectives:
• provide 100 additional traineeships to Indigenous Australians and convert at least 65% of those who complete the program to permanent ANZ employees;
• support the advancement of people with a disability through a business mentoring program, which involves employing an additional 35 people with a declared disability across ANZ’s global businesses and achieving at least a 75% retention rate over the three year period from 2009-11;
• achieve a 100% completion rate for the 15 participants in ANZ’s refugee employment pathway program via ANZ’s Given the Chance program; and
• achieve a 2% increase in the number of Maori graduates on ANZ’s New Zealand internship program.
• Gender diversity on the Board Specific targets have not previously been set in relation to the representation of women on ANZ’s Board. In November 2008, Ms Alison Watkins was appointed to the Board, taking the number of female directors on the Board to two, including long-serving director Ms Margaret Jackson. Ms Jackson subsequently retired from the Board in March 2009 and there have been no new Board appointments since that time. As a result, the Board currently comprises eight Directors, including one Director who is a woman. The Board has a tenure policy which limits the period of service of a Non-Executive Director to three 3-year terms after first being elected by shareholders. In accordance with this policy, the next scheduled Board retirements will occur at the 2013 Annual General Meeting when Messrs Morschel and Meiklejohn and Dr Clark are due to retire as Directors. The Board’s objective is that the new Director appointments who will replace the three retiring Directors will include at least one woman, and it is expected these new appointments will be made in the period leading up to the 2013 Annual General Meeting in order to provide an appropriate transition. It is not the Board’s current intention to make Board appointments in the interim.
• Donations and Community Investment During the year ended September 30, 2010, ANZ contributed around $16 million in cash, time and in-kind services to communities in the regions where ANZ does business. More than $4 million of this contribution was invested in financial literacy and inclusion programs such as MoneyMinded (and its cultural adaptations in Australia, New Zealand and the Pacific), Saver Plus and Progress Loans (Australia). This year the Saver Plus program was expanded from 20 to 60 communities in Australia and is currently delivered by ANZ’s community partners the Brotherhood of St Laurence, Berry Street, The Benevolent Society, The Smith Family
100

and other community agencies. Funding of $13.5 million was provided by the Australian Government to support this expansion over 2009-2011 with the goal of reaching 7,600 participants. Building financial capability is a key element of ANZ’s Corporate Responsibility framework, targeting especially those in disadvantaged communities who are most at risk of financial exclusion. ANZ also contributed more than $1.5 million to support the recovery and rebuilding of communities in regions affected by disaster, including earthquakes in New Zealand, Indonesia and China; Typhoon Ketsana, which swept across Vietnam, the Philippines, Laos and Cambodia; flooding in Queensland and India; and the tornado which devastated the Chongqing region in China. Further details can be accessed at www.anz.com> About us> Corporate Responsibility. In addition, for the year to September 30, 2010, ANZ donated $100,000 to the Liberal Party of Australia and $100,000 to the Australian Labor Party.
101

Employees
At September 30, 2010, ANZ employed 46,917 people worldwide (2009: 37,687) on a full-time equivalent basis (‘FTEs’), of which 43,923 were permanent employees and 2,994 were temporary. There were 23,874 FTEs in Australia at September 30, 2010 compared with 19,976 FTEs at September 30, 2009 (refer to table below).
In Australia, terms and conditions of employment of most non-management staff, including salaries, may be negotiated between unions and management as part of a collective agreement subject to majority employee approval. Staff Numbers
Years ended September 301 2010 2009 Australia 23,874 19,976 Asia Pacific, Europe & America 13,625 8,791 New Zealand 9,418 8,920 Totals 46,917 37,687
1 Geographic FTE includes employees from Corporate Center, Institutional and Operations, Technology and Shared Services divisions.
Industrial Instruments
Approximately 19%2 (2009: 19%) of employees in Australia are members of the Finance Sector Union of Australia. ANZ has a specific industrial award that contains terms and conditions of employment that apply in differing degrees to all ANZ Australian staff. The award is supplemented by a collective enterprise bargaining agreement and in addition the majority of senior management and executive staff are covered by individual common law contracts of employment. ANZ's current Australian collective enterprise bargaining agreement was entered into in August 1998 and continues to legally operate despite passing its nominal expiry date of February 2001. ANZ has negotiated a proposed new collective employment agreement, known as the ANZ Collective Employment Agreement 2010-2012 (Australia), with the Finance Sector Union (‘FSU’). Should the agreement be approved, ANZ will pay 4% (2009: 3.5%) salary increase for 2010 to most non-management staff. Superannuation
The Group has established a number of pension, superannuation and post retirement medical benefit schemes throughout the world. Note 45 to the 2010 Annual Report (attached as Annex A) gives further detail on ANZ's superannuation commitments. ANZ also provides loans at concessional rates to eligible employees and senior management but excluding executives and directors. Employee Equity
ANZ operates a number of employee share and option schemes which operate under the ANZ Employee Share Acquisition Plan and the ANZ Share Option Plan. Refer to note 46 of the 2010 Annual Report (attached as Annex A) for further details.
2 Actual membership is likely to be higher as some employees choose to pay the Finance Sector Union of Australia directly rather then by payroll deduction.
102

Section 5: Major Shareholders and Related Party Transactions Major Shareholders
We are not directly or indirectly owned or controlled by another corporation, any government or any other natural or legal person(s), separately or jointly. As at November 15, 2010, we know of no person who is the beneficial owner of 5% or more of our ordinary shares. For further information regarding major shareholders (including share and option holdings by key management personnel (including directors)) refer to the Shareholder Information Section contained in our 2010 Annual Report attached as Annex A to this U.S. Disclosure Document.
The acquisition of shares in Australian companies by foreign interests is regulated by the Foreign Acquisitions and Takeovers Act 1975 (the ‘Foreign Takeovers Act’). The Foreign Takeovers Act applies (subject to certain monetary thresholds) to, amongst other things, any acquisition or issue of shares which results in either:
• a foreign person or foreign-controlled corporation alone or together with any associates being in a position to control 15% or more of the voting power or potential voting power or hold any legal or equitable interest in 15% or more of the issued shares, or rights to issued shares in a corporation carrying on an Australian business; or
• two or more foreign persons or foreign-controlled corporations together with any associates of any of those foreign persons or foreign-controlled corporations being in a position to control 40% or more of the voting power or potential voting power or hold any legal or equitable interest in 40% or more of the issued shares or rights to issued shares in a corporation carrying on an Australian business.
In either of these cases, and in certain other circumstances, the Treasurer may prohibit the acquisition if it would be contrary to the Australian national interest.
The Financial Sector (Shareholdings) Act 1998 prohibits a person (together with its associates, if any), or two or more persons under an arrangement, from acquiring shares in a financial sector company if the acquisition would result in a person, together with its associates, holding a stake in the company of more than 15%. However, the Treasurer may grant approval to a person to hold a stake of greater than 15% but only if satisfied that it is in the Australian national interest. No such approvals have been granted in respect of our shares.
Any person acquiring voting shares in a company is subject to the control of the acquisition of shares provisions contained in Chapter 6 of the Corporations Act. Subject to certain exceptions, Section 606 of the Corporations Act prohibits a person from acquiring a relevant interest in voting shares in a company if, because of a transaction, the person’s or someone else’s voting power in the company increases:
• from 20% or below to more than 20%; or • from a starting point that is above 20% and below 90%.
One of the exceptions to Section 606 allows a person to acquire voting power of an additional 3% in a company if that person had voting power in the company of at least 19% throughout the six months before the acquisition.
For the purposes of the Corporations Act, a person's voting power in a company is the total number of votes attached to voting shares in respect of which the person and its associates (which are broadly defined) have a 'relevant interest' (which is also broadly defined) as a proportion of the total number of votes attached to all voting shares in the company. Broadly speaking, subject to certain qualifications, a person has a ‘relevant interest’ in securities if the person is the holder of the securities; has the power to exercise, or control the exercise of, a right to vote attached to the securities; or has the power to dispose of, or control the exercise of a power to dispose of, a security. Change in Control
There are no arrangements known to ANZ, the operation of which may at a subsequent date result in a change in control of ANZ. Related Party Transactions
All related party loans were made in the ordinary course of business, were made on substantially the same terms, including interest rates and collateral, as those prevailing at the time for comparable transactions with other persons and entities, and did not involve more than the normal risk of collectability or present other unfavorable features. For further information on related party transactions refer to Notes 46, 47 and 48 together with the Remuneration Report in the 2010 Annual Report (attached as Annex A to this U.S. Disclosure Document).
103
Section 6: Additional Information
Any public documents referred to in this U.S. Disclosure Document may be inspected by contacting the Company Secretary on (613) 8654-8576 or in writing to the Company Secretary, Australia and New Zealand Banking Group Limited, Level 9, 833 Collins Street, Docklands, Victoria 3008, Australia.
Legal Proceedings
There are outstanding court proceedings, claims and possible claims against the Group, the aggregate amount of which cannot readily be quantified. Appropriate legal advice has been obtained and, in the light of such advice, provisions as deemed necessary have been made. In some instances we have not disclosed the estimated financial impact as this may prejudice the interests of the Group. Refer to Note 44 (“Credit Related Commitments, Guarantees, Contingent Liabilities and Contingent Assets”) for a discussion of legal proceedings as at September 30, 2010.
Significant events since the end of the financial year On October 27, 2010, ANZ announced the investment of additional RMB 1.65 billion (A$250 million) in Shanghai Rural Commercial Bank (‘SRCB’) as part of a major capital raising by SRCB. In addition, on November 12, 2010, ANZ announced a further investment of RMB832 million (A$126 million) in Bank of Tianjin (‘BoT’) as part of a capital raising to support BoT’s strategic growth agenda. Refer to the “Recent Developments” section of this U.S. Disclosure Document above for further discussion of these events and other material developments for ANZ since the financial year ended September 30, 2010.
Dividend Distribution Policy
The Board of Directors of ANZ will determine the amount and timing of dividend distributions to shareholders based on the financial performance and financial position of the Group.
ANZ has a dividend reinvestment plan (‘DRP’) and a bonus option plan (‘BOP’). For the 2010 final dividend, ANZ intends to provide shares under the DRP and BOP through the issue of new shares. A discount of 1.5% will be applied when calculating the “Acquisition Price” under the DRP and BOP terms and conditions. This discount will apply in respect of the 2010 final dividend and to future dividends until such time as ANZ announces otherwise.
104

Exchange Controls There are currently no general Australian exchange control regulations in force which restrict the payment of dividends, interest or other remittances to holders of our securities. Exchange controls are, however, implemented in Australia from time to time to reflect Australian public policy, and operate to prohibit the entry into certain transactions with specified persons or entities without the consent of the applicable Australian regulatory body. These include the following: 1. directions given by the Reserve Bank of Australia in accordance with the Banking (Foreign Exchange) Regulations 1959 in respect of foreign currency transactions involving the transfer of property, securities or funds owned or controlled by, or payments either to (or for the benefit of) or by (or on behalf of) certain persons or entities from time to time, including the following persons and entities: (a) specified supporters of the former government of the Federal Republic of Yugoslavia (the Milosevic regime); (b) specified ministers and senior officials of the Government of Zimbabwe; (c) certain entities or an individual associated with the Democratic People's Republic of Korea (North Korea); (d) specified individuals associated with the Burmese regime; and (e) specified certain Iranian entities and persons; 2. under Part 4 of the Charter of the United Nations Act 1945 and pursuant to the Charter of the United Nations (‘Dealings with Assets’) Regulations 2008, sanctions against using or dealing with financial or other assets of persons or entities listed by the Minister for Foreign Affairs in the Commonwealth of Australia Gazette from time to time. Such persons or entities include those in: (a) Liberia (see the Charter of the United Nations (Sanctions – Liberia) Regulations 2008); (b) Côte d'Ivoire (see the Charter of the United Nations (Sanctions – Côte d'Ivoire) Regulations 2008); (c) Democratic Republic of the Congo (see the Charter of the United Nations (Sanctions – Democratic Republic of
the Congo) Regulations 2008); (d) Democratic People's Republic of Korea (North Korea) (see the Charter of the United Nations (Sanctions –
Democratic People's Republic of Korea) Regulations 2008); (e) Sudan (see the Charter of the United Nations (Sanctions – Sudan) Regulations 2008); (f) Iran (see the Charter of the United Nations (Sanctions – Iran) Regulations 2008); (g) Iraq (see the Charter of the United Nations (Sanctions – Iraq) Regulations 2008); (h) Al-Qaida and the Taliban (see the Charter of the United Nations (Sanctions – Al-Qaida and the Taliban)
Regulations 2008); (i) Somalia (see the Charter of the United Nations (Sanctions – Somalia) Regulations 2008); (j) Lebanon (see the Charter of the United Nations (Sanctions – Lebanon) Regulations 2008); (k) Sierra Leone (see the Charter of the United Nations (Sanctions – Sierra Leone) Regulations 2008); and (l) Eritrea (see the Charter of the United Nations (Sanctions – Eritrea) Regulations 2010); 3. under the Financial Transaction Reports Act 1988 and subject to certain exemptions, 'cash dealers' (including Australian authorized deposit taking institutions such as ANZ) must report 'cash transactions' of A$10,000 (or the foreign equivalent) and above to the Australian Transaction Reports and Analysis Center. Cash transactions are those which involve the physical transfer of currency from one person to another. Limitations Affecting Security Holders The following Australian laws impose limitations on the right of non-residents or non-citizens of Australia to hold, own or vote on shares in our company. 1. Foreign Acquisitions and Takeovers Act 1975
The acquisition of shares in Australian companies by foreign interests is regulated by the Foreign Acquisitions and Takeovers Act 1975 (the ‘Foreign Takeovers Act’). The Foreign Takeovers Act applies (subject to certain monetary thresholds) to, amongst other things, any acquisition or issue of shares which results in either:
a foreign person or foreign-controlled corporation alone or together with any associates being in a
position to control 15% or more of the voting power or potential voting power or hold any legal or equitable interest in 15% or more of the issued shares or rights to issued shares in a corporation carrying on an Australian business; or
two or more foreign persons or foreign-controlled corporations, together with any associates of any of those foreign persons or foreign-controlled corporations being in a position to control 40% or more of the voting power or potential voting power or hold any legal or equitable interest in 40% or more of the issued shares or rights to issued shares in a corporation carrying on an Australian business.
105

In either of these cases, and in certain other circumstances, the Treasurer may prohibit the acquisition if it would be contrary to the Australian national interest.
2. Financial Sector (‘Shareholdings’) Act 1998
The Financial Sector (Shareholdings) Act 1998 prohibits a person (together with its associates, if any), or two or more persons under an arrangement, from acquiring shares in a financial sector company if the acquisition would result in a person, together with its associates, holding a stake in the company of more than 15%. However, the Treasurer may grant approval to a person to hold a stake of greater than 15% but only if satisfied that it is in the Australian national interest. No such approvals have been granted in respect of our shares.
3. Corporations Act 2001
Any person acquiring voting shares in a company is subject to the control of the acquisition of shares provisions contained in Chapter 6 of the Corporations Act. Subject to certain exceptions, Section 606 of the Corporations Act prohibits a person from acquiring a relevant interest in voting shares in a company if, because of a transaction, the person’s or someone else’s voting power in the company increases: from 20% or below to more than 20%; or from a starting point that is above 20% and below 90%.
One of the exceptions to Section 606 allows a person to acquire voting power of an additional 3% in a company if that person had voting power in the company of at least 19% throughout the six months before the acquisition.
For the purposes of the Corporations Act, a person's voting power in a company is the total number of votes attached to voting shares in respect of which the person and its associates (which are broadly defined) have a ‘relevant interest’ as a proportion of the total number of votes attached to all voting shares in the company. Broadly speaking, subject to certain qualifications, a person has a ‘relevant interest’ in securities if the person is the holder of the securities; has the power to exercise, or control the exercise of, a right to vote attached to the securities; or has the power to dispose of, or control the exercise of a power to dispose of, a security.
In addition, under the Corporations Act, any person who begins to have or ceases to have, a substantial holding in us, or if any person already has a substantial holding and there is movement of at least 1% in their holding, is required to give a notice to us and to the ASX Limited providing certain prescribed information, including their name and address and details or their relevant interests in our voting shares. Generally such notice must be provided within two business days after the person becomes aware of the information.
Withholding Taxes Australia imposes withholding taxes on certain payments to non-residents including certain dividend payments (to the extent such dividends are unfranked) and interest payments to non-residents. Constitution
The Company’s Constitution was most recently amended on December 18, 2007. There have been no changes to the Constitution since then. A copy of the Constitution dated December 18, 2007 is attached as Annex C. Material Contracts
There have been no material contracts entered into by the Group in the past two years, other than in the ordinary course of its business, upon which it is substantially dependent.
106

GLOSSARY
AAS - Australian Accounting Standards.
AASB - Australian Accounting Standards Board.
Asset margin measures the difference between the income earned and cost incurred from lending activities as a percentage of total interest earning assets. Calculation includes the impact of changing mix of lending products, change in lending product margins excluding the change in the cost of wholesale funds and the change in the amount of fees recognized as effective Net Interest Income.
Collective provision is the Provision for Credit Losses that are inherent in the portfolio but not able to be individually identified; presently unidentified impaired assets. A collective provision may only be recognized when a loss event has already occurred. Losses expected as a result of future events, no matter how likely, are not recognized.
Customer deposits represent term deposits, other deposits bearing interest, deposits not bearing interest and borrowing corporations debt excluding collateralized loan obligation and securitization vehicle funding.
Equity standardization Risk adjusted capital is allocated and charged against business units. Equity standardized profit is determined by eliminating the impact of earnings on each business unit’s book capital and attributing earnings on the business unit’s risk adjusted capital. This enhances comparability of business unit performance.
Exception fees are fees which may be charged when there are insufficient funds to cover a transaction, resulting in a dishonor or an approval to overdraw the account, when a credit card limit is exceeded or when a credit card payment is late.
IFRS – International Financial Reporting Standards.
Impaired assets are those financial assets where doubt exists as to whether the full contractual amount will be received in a timely manner, or where concessional terms have been provided because of the financial difficulties of the customer. Financial Assets are impaired if there is objective evidence of impairment as a result of a loss event that occurred prior to the reporting date, and that loss event has had an impact, which can be reliably estimated, on the expected future cash flows of the individual asset or portfolio of assets.
Impaired commitments and contingencies comprises undrawn facilities and contingent facilities where the customer’s status is defined as impaired.
Impaired loans comprises drawn facilities where the customer’s status is defined as impaired.
Individual provision charge is the amount of expected credit losses on those financial instruments assessed for impairment on an individual basis (as opposed to on a collective basis). It takes into account expected cash flow over the lives of those financial instruments.
Liquid assets are cash and cash equivalent assets. Cash equivalent assets are highly liquid investments with short periods to maturity, are readily convertible to cash at ANZ’s option and are subject to an insignificant risk of changes in value.
Net advances includes gross loans and advances and acceptances and capitalized brokerage/mortgage origination fees, less income yet to mature and allowances for credit on impairment.
Net inter business unit expenses (also known as Service Transfer Pricing) consists of the charges made between business units for the provision of support services. Both payments and receipts by business units are shown as net inter business unit expenses.
Net interest average margin is net interest income as a percentage of average interest earning assets. Non-assessable interest income is grossed up to the equivalent before tax amount for the purpose of these calculations.
107

GLOSSARY (CONTINUED)
Net tangible assets equals share capital and reserves attributable to shareholders of the Group less preference share capital and unamortized intangible assets (including goodwill and software).
Operating expenses excludes the provision for impairment of loans and advances charge.
Operating income in business segments includes equity standardized net interest and other operating income.
Repo discount is a discount applicable on the repurchase by a central bank of an eligible security pursuant to a repurchase agreement.
Restructured items represents customer facilities which for reason of financial difficulty have been re-negotiated on terms which the Bank considers as uncommercial but necessary in the circumstances, and are not considered non-performing. Includes both on and off balance sheet exposures.
Revenue includes net interest income and other operating income.
Segment review description:
• The Group is managed along the geographic regions of Australia, New Zealand and Asia Pacific, Europe & America, and the matrix segment of its global institutional client business which is viewed as a separate segment but also impacts each region.
• Australia.
• The Australia region consists of Retail, Commercial, Institutional and Wealth segments together with the Group Center.
Retail
- Retail Distribution operates the Australian branch network, Australian call center, specialist businesses (including specialist mortgage sales staff, mortgage broking and franchisees, direct channels (Mortgage Direct and One Direct)) and distribution services.
- Retail Products is responsible for delivering a range of products including mortgages, cards, unsecured lending, transaction banking, savings and deposits:
· Mortgages provide housing finance to consumers in Australia for both owner occupied and investment purposes.
· Cards and Unsecured Lending provides consumer credit cards, ePayment products, personal loans and ATM facilities in Australia.
· Deposits provide transaction banking and savings products, such as term deposits and cash management accounts.
Commercial
- Esanda provides motor vehicle and equipment finance and investment products.
- Regional Commercial Banking provides a full range of banking services to personal customers and to small business and agribusiness customers in rural and regional Australia and includes the recent acquisition of loans and deposits from Landmark Financial Services.
- Business Banking provides a full range of banking services, including risk management, to metropolitan based small to medium sized business clients with a turnover of up to A$50 million.
- Small Business Banking provides a full range of banking services for metropolitan-based small businesses in Australia with unsecured loans up to A$100,000.
Institutional
- A full range of financial services to institutional customers within Australia along the product lines of Transaction Banking, Markets and Specialized Lending. Also includes Balance Sheet Management and Relationship and infrastructure. Refer detailed description of the Institutional business under the paragraph below entitled “Institutional”.
108

109
GLOSSARY (CONTINUED)
Wealth - Private Bank specializes in assisting high net worth individuals and families to manage, grow and
preserve their family assets. - Investments and Insurance Products comprises Australia’s Financial Planning, Margin Lending,
Insurance distribution and Trustees businesses in addition to E*Trade, an online broking business. - Funds Management and Insurance “FMI” (formerly INGA) was a joint venture between ANZ and the
ING Group. ANZ owned 49% of INGA and received proportional equity accounted earnings prior to ANZ acquiring the remaining 51% interest to take full ownership. FMI manufactures and distributes investment and insurance products and advice.
Group Center
- Group Center includes the Australian portion of Operations, Technology & Shared Services, Treasury, Group Human Resources, Group Strategy, Group Financial Management, Group Risk Management and Group Items.
Asia Pacific, Europe & America
The Asia Pacific, Europe & America region includes the following:
• Retail which provides retail and small business banking services to customers in the Asia Pacific region.
• Asia Partnerships which is a portfolio of strategic partnerships in Asia. This includes investments in Indonesia with P.T. Panin Bank, in the Philippines with Metrobank, in China with Bank of Tianjin and Shanghai Rural Commercial Bank, in Malaysia with AMMB Holdings Berhad and in Vietnam with Sacombank and Saigon Securities Incorporation.
• Wealth which includes investment and insurance products and services across Asia Pacific and under the Private Bank banner assisting customers in the Asia Pacific region to manage, grow and preserve their assets.
• Operations & Support which includes the central support functions for the division.
• Institutional Asia Pacific, Europe & America matrix reports to the Asia Pacific, Europe & America division and is referred to in the paragraph below entitled "Institutional".
• Bangalore which includes operations, technology and shared services support services to all geographic regions. During the September 2010 full year, ANZ acquired selected Royal Bank of Scotland Group PLC businesses in Asia. The acquisition of the businesses in Philippines, Vietnam and Hong Kong were completed during the March 2010 half, and the acquisition of the businesses in Taiwan, Singapore and Indonesia during the September 2010 half. The acquisition impacts all business segments within the Asia Pacific, Europe & America region.
New Zealand
New Zealand comprises three customer segments, Retail, Commercial and Institutional, a Wealth segment and an operations and support area which includes Treasury funding:
• Retail - National Bank Retail, operating under the National Bank brand in New Zealand, provides a full range
of banking services to personal and business banking customers. - ANZ Retail, operating under the ANZ brand in New Zealand, provides a full range of banking services to
personal and business banking customers.
• Commercial
- Corporate & Commercial Banking incorporates the ANZ Banking Group Limited (‘ANZBGL’) and ANZ National Bank brands and provides financial solutions through a relationship management model for medium-sized businesses with a turnover of up to NZ$150 million.
- Rural Banking provides a full range of banking services to rural and agribusiness customers.
- UDC provides motor vehicle and equipment finance, operating leases and investment products.

GLOSSARY (CONTINUED)
• Institutional
- A full range of financial services to institutional customers within New Zealand along the product lines of Transaction Banking, Markets and Specialized Relationship Lending. Also includes Relationship and infrastructure. Refer detailed description of the Institutional business under the paragraph below entitled “Institutional”.
• Wealth
- Private Banking includes the private banking operations under the ANZBGL and ANZ National Bank brands and Bonus Bonds.
- Funds Management and Insurance “FMI” (formerly INGA/INGANZ) was a joint venture between ANZ and ING whereby ANZ owned 49% of INGNZ and received proportional equity accounted earnings prior to ANZ acquiring the remaining 51% interest to take full ownership. FMI manufactures and distributes investment and insurance products and advice.
• Operations and Support includes the back-office processing, customer account maintenance, and central support areas including Treasury funding.
Institutional The Institutional division provides a full range of financial services to institutional customers in all geographies. Multinationals, institutions and corporates with sophisticated needs and multiple relationships are served globally. Institutional has a major presence in Australia and New Zealand and also has operations in Asia, Europe and the United States. During the September 2010 full year, the Institutional business has been expanded following the acquisition of selected businesses from the Royal Bank of Scotland Group PLC. The acquisition impacts all business segments within Institutional.
• Transaction Banking provides working capital solutions including lending and deposit products, cash transaction banking management, trade finance, international payments, and clearing services principally to institutional and corporate customers.
• Global Markets provides risk management services to corporate and institutional clients globally in relation to foreign exchange, interest rates, credit and commodities. This includes the business providing origination, underwriting, structuring and risk management services, advice and sale of credit and derivative products globally. Markets also manages the Group’s interest rate risk position.
• Specialized & Relationship Lending provides complex financing and advisory services, structured financial products, leasing, project finance, leveraged finance and infrastructure investment products to the Group’s global client set.
• Relationship and infrastructure includes client relationship teams for global institutional customers and corporate customers in Australia, and central support functions.
110

Annex A – 2010 Annual Report
111

Annex B – 2009 Annual Report
112

Annex C – Constitution
113

![September 16, 2019€¦ · 16/09/2019 · September 16, 2019 To: [Recipient Address] From: [OnePath ] Subject Line: Recall of NATPARA (parath roid hormone)](https://img.dokumen.tips/doc/110x75/5f8c5d6852b2b344006ea584/september-16-2019-16092019-september-16-2019-to-recipient-address-from.jpg)

![September 16, 2019 - Takeda€¦ · 16/9/2019 · September 16, 2019 To: [Recipient Address] From: [OnePath ] Subject Line: Recall of NATPARA (parath roid](https://img.dokumen.tips/doc/110x75/604a6be8bb4941747c529b90/september-16-2019-takeda-1692019-september-16-2019-to-recipient-address.jpg)


![September 16, 2019 - Takeda · 9/16/2019 · September 16, 2019 To: [Recipient Address] From: [OnePath ] Subject Line: Recall of NATPARA (parath roid hormone)](https://img.dokumen.tips/doc/110x75/604a3b09584a3854ae35747f/september-16-2019-takeda-9162019-september-16-2019-to-recipient-address.jpg)