Embed Size (px)
Citation preview

1
© This is a licensed product of AM Mindpower Solutions and should not be copied

2
© This is a licensed product of AM Mindpower Solutions and should not be copied
TABLE OF CONTENTS
1. Global ATM Market Introduction and Market Size, 2006- 2011
2. Middle East and Africa ATM Market Introduction
3. Middle East and Africa ATM Market Size, 2006-2011
4. Middle East and Africa ATM Market Segmentation, 2006-2011
4.1. Saudi Arabia
4.1.1. Saudi Arabia ATM Market Introduction
4.1.2. ATM Terminals Installed and ATM Cards Issued in Saudi Arabia, 2006-2011
4.1.3. ATM Cash Withdrawals, 2006-2011
4.1.4. Total Number of Credit and Debit Cards Issued in Saudi Arabia, 2006-2010
4.1.5. Competitive Landscape of Major Banks in Saudi Arabia, 2011
4.1.6. Saudi Arabia ATM Market Future Projections, 2012-2015
4.2. Turkey
4.2.1. Turkey ATM Market Introduction
4.2.2. ATM Terminals Installed and ATM Cards Issued in Turkey, 2006-2011
4.2.3. ATM Cash Withdrawals, 2006-2011
4.2.4. Total Number of Credit and Debit Cards Issued in Turkey, 2006-2010
4.2.5. Competitive Landscape of Major banks in Turkey, 2011
4.2.6. Turkey ATM Market Future Projections, 2012-2015
4.3. UAE
4.3.1. UAE ATM Market Introduction
4.3.2. ATM Terminals Installed and ATM Cards Issued in UAE, 2006-2011
4.3.3. Competitive Landscape of Major banks in UAE, 2010
4.3.4. UAE ATM Market Future Projections, 2012-2015
4.4. Israel
4.4.1. Israel ATM Market Introduction

3
© This is a licensed product of AM Mindpower Solutions and should not be copied
4.4.2. ATM Terminals Installed and ATM Cards Issued in Israel, 2006-2011
4.4.3. Israel ATM Market Future Projections, 2012-2015
4.5. South Africa
4.5.1. South Africa ATM Market Introduction
4.5.2. ATM Terminals Installed and ATM Cards Issued in South Africa, 2006-2011
4.5.3. ATM Cash Withdrawals, 2006-2011
4.5.4. Competitive Landscape of Major Banks in South Africa, 2010
4.5.5. South Africa ATM Market Future Projections, 2012-2015
5. ATM Market Trends and Developments
Rising Popularity of Video Banking
Multivendor software Still a Key Issue for Deployers
New and Improved ATM Applications and Context Aware Tools
The Safety of ATM and Revolution in Branch Network
EMV
Biometric Technology
6. ATM Frauds
7. Threats to the ATM Market
8. SWOT Analysis of the Middle East and Africa ATM Market
Strengths
Weaknesses
Opportunities
Threats
9. Middle East and Africa ATM Market Future Projections, 2012-2015
10. Company Profiles of Major Players
10.1. NCR Corporation
10.1.1. Company Overview

4
© This is a licensed product of AM Mindpower Solutions and should not be copied
10.1.2. Financial Performance
10.2. Wincor Nixdorf
10.2.1. Company Overview
10.2.2. Financial Performance
10.3. Diebold
10.3.1. Company Overview
10.3.2. Financial Performance
10.4. KAL
10.4.1. Company Overview
11. Macro Economic Indicators: Current and Projections, 2006-2015
11.1. Urban Population
11.2. Banknotes and Coins in Circulation Outside Banks
11.3. ATM Cards Issued
12. Appendix
12.1. Market Definition
12.2. Abbreviation
12.3. Research Methodology
Data Collection Methods
Approach
Variables (Dependent and Independent)
Multi Factor Based Sensitivity Model
Final Conclusion
12.4. Disclaimer
5
© This is a licensed product of AM Mindpower Solutions and should not be copied
LIST OF FIGURES
Figure 1: Total number of ATM Terminals Installed in the World and in Middle East and Africa, in Thousands, 2006 – 2011
Figure 2: ATM Terminals Installed and ATM Cards Issued in Middle East and Africa, in Thousands and Million respectively, 2006 – 2011
Figure 3: Middle East and Africa ATM Market Segmentation by Country on the Basis of ATMs installed, in Percentage, 2006 – 2011
Figure 4: ATM Terminals Installed and ATM Cards Issued in Saudi Arabia, in Thousands and Million respectively, 2006 – 2011
Figure 5: ATM Cash Withdrawal Transactions inside Saudi Arabia in Volume and Value from Cards Issued Inside the Country, 2006-2011
Figure 6: ATM Cash Withdrawal inside Saudi Arabia in Value from Cards Issued Outside the Country, USD Billion, 2006-2011
Figure 7: ATM Cash Withdrawal Transactions outside Saudi Arabia in Volume and Value from Cards Issued Inside the Country, 2006-2011
Figure 8: Total Number of Credit and Debit Cards Issued in Saudi Arabia, in Millions, 2006–2010
Figure 9: Market Share of the Major Banks in Saudi Arabia on the Basis ATMs Deployed, in Percentage, 2011
Figure 10: ATM Terminals Installed and ATM Cards Issued in Saudi Arabia, in Thousands and Million respectively, 2012 – 2015
Figure 11: ATM Terminals Installed and ATM Cards Issued in Turkey, in Thousands and Million respectively, 2006 – 2011
Figure 12: ATM Cash Withdrawal Transactions inside Turkey in Volume and Value from Cards Issued Inside the Country, 2006-2011
Figure 13: ATM Cash Withdrawal Transactions inside Turkey in Volume and Value from Cards Issued Outside the Country, 2006-2011
Figure 14: ATM Cash Withdrawal Transactions outside Turkey in Volume and Value from Cards Issued Inside the Country, 2006-2011
Figure 15: Total Number of Credit and Debit Cards Issued in Turkey, in Millions, 2006 – 2010
6
© This is a licensed product of AM Mindpower Solutions and should not be copied
Figure 16: Market Share of the Major Banks in Turkey on the Basis ATMs Deployed, in Percentage, 2011
Figure 17: ATM Terminals Installed and ATM Cards Issued in Turkey, in Thousands and Million respectively, 2012 – 2015
Figure 18: ATM Terminals Installed and ATM Cards Issued in UAE, in Thousands and Million respectively, 2006 – 2011
Figure 19: Market Share of the Major Banks in UAE on the Basis ATMs Deployed, in Percentage, 2010
Figure 20: ATM Terminals Installed and ATM Cards Issued in UAE, in Thousands and Million respectively, 2012 – 2015
Figure 21: ATM Terminals Installed and ATM Cards Issued in Israel, in Thousands and Million respectively, 2006 – 2011
Figure 22: ATM Terminals Installed in Israel, in Thousands, 2012 – 2015
Figure 23: ATM Terminals Installed in South Africa, in Thousands, 2006 – 2011
Figure 24: ATM Cash Withdrawal Transactions inside South Africa in Volume and Value from Cards Issued Inside the Country, 2006-2011
Figure 25: Market Share of ATM Holdings by major Banks in South Africa, on the Basis of Number of ATMs Installed in Units Respectively, 2010
Figure 26: ATM Terminals Installed in South Africa, in Thousands, 2012 – 2015
Figure 27: Number of Non-Cash Transactions Globally, in Billion, 2007 – 2009
Figure 28: Segmentation of Global Non-Cash Transactions by Region, in Percentage, 2009
Figure 29: Segmentation of Non-Cash Transactions by Payment Instrument Mix, in Percentage, 2009
Figure 30: Number of E-Payments and M-Payments Transactions Globally, in Billion, 2009 – 2010
Figure 31: ATM Terminals Installed and ATM Cards Issued in Middle East and Africa, in Thousands and Million respectively, 2012 – 2015
Figure 32: NCR Corporation Revenue in USD Million, 2009 –2011
Figure 33: NCR Corporation Revenue from Financial Services Segment, USD Million, 2009-2011

7
© This is a licensed product of AM Mindpower Solutions and should not be copied
Figure 34: NCR Revenue Segmentation by Geographic Area, in Percentage, 2011
Figure 35: Wincor Nixdorf Corporation Revenue in USD Million, FY’2007–FY’2011
Figure 36: Wincor Nixdorf Corporation Revenue Segmentation by Banking and Retail, in Percentage, FY’2011
Figure 37: Diebold Corporation Revenue in USD Million, 2007 –2011
Figure 38: Diebold Revenue Segmentation by Geographic Area, in Percentage, 2011
Figure 39: Urban Population of Middle East and Africa, in Million, 2006-2015
Figure 40: Banknotes and Coins in Circulation outside Banks, in Middle East and Africa, USD Billion, 2006-2015
Figure 41: ATM Cards Issued in Middle East and Africa, in Million, 2006-2015

8
© This is a licensed product of AM Mindpower Solutions and should not be copied
LIST OF TABLES
Table 1: Market Share of ATM Holdings by Major Banks in Saudi Arabia, on the Basis of Number of ATMs Installed in Units Respectively, 2011
Table 2: Market Share of ATM Holdings by Major Banks in Turkey, on the Basis of Number of ATMs Installed in Units Respectively, 2011
Table 3: Market Share of ATM Holdings by Major Banks in UAE, on the Basis of Number of ATMs Installed in Units Respectively, 2010
Table 4: Market Share of ATM Holdings by Major Banks in South Africa, on the Basis of Number of ATMs Installed in Units Respectively, 2010
Table 5: NCR Revenue Segmentation by Geographic Area, in USD Million, 2011
Table 6: Wincor Nixdorf Corporation Revenue Segmentation by Banking and Retail, USD Million, FY’2011
Table 7: Wincor Nixdorf Revenue Segmentation by Geographic Region, in USD Million, FY’2007-FY’2011
Table 8: Diebold Revenue Segmentation by Geographic Area, in USD Million, 2011
Table 9: Correlation Matrix of the Middle East and Africa ATM Market
Table 10: Regression Coefficients Output of the Middle East and Africa ATM Market

9
© This is a licensed product of AM Mindpower Solutions and should not be copied
MIDDLE EAST AND AFRICA ATM MARKET INTRODUCTION
The Middle East market is growing well and is estimated to grow profoundly over the coming years. Iran is a strongly growing market in this region. Its omission from the western financial system aided in being affected less during times of economic crisis. The country is expected to
drive the growth of the Middle East region in the coming years.
The African continent as a whole has relatively lesser penetration of ATM usage as compared to the other regions. However as
the ATM usage increases over the period, the need for better security becomes critical. ATM manufacturers are employing surveillance technology and …
MIDDLE EAST AND AFRICA ATM MARKET SEGMENTATION
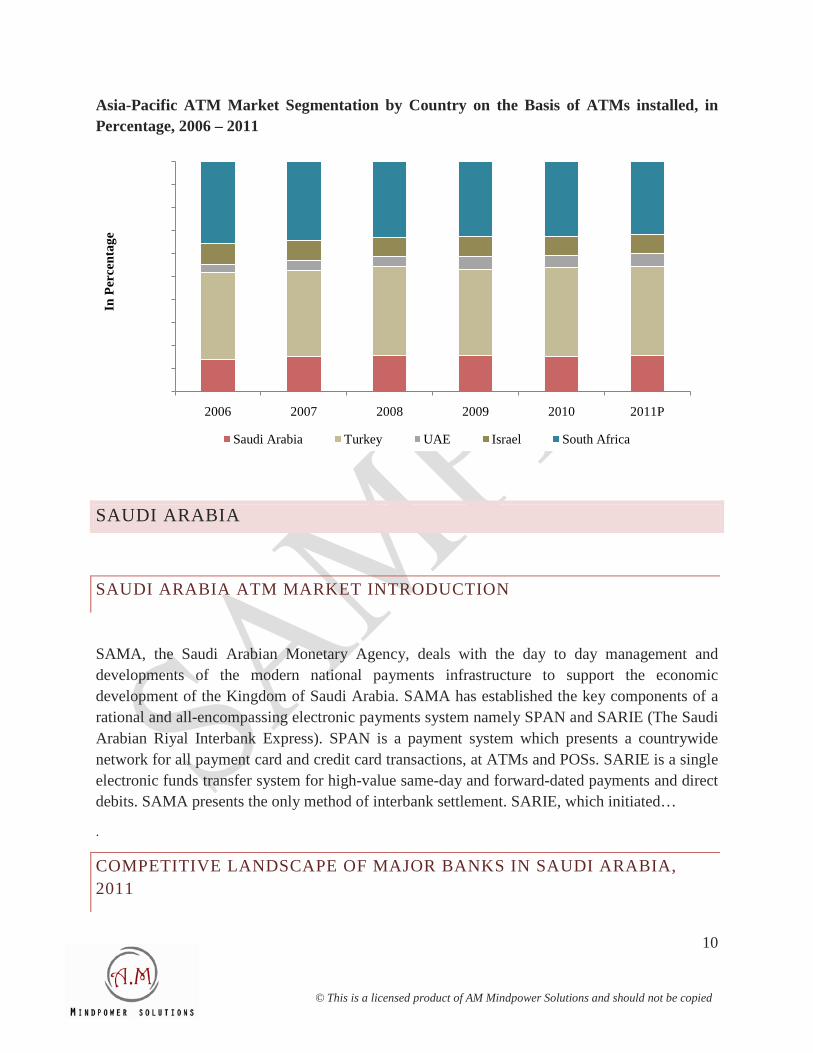
Turkey and South Africa are the largest ATM markets in the Middle East and Africa region respectively. Both of these countries accounted for a combined market share of ~% in 2011. Both of the countries have exhibited considerable growth potential over the period and are also expected to dominate this region over the period despite the fact that the market share of South Africa is decreasing. Saudi Arabia is the third largest country in this region in terms of the total number of ATM terminals installed. The market share of Saudi Arabia increased from 13.9% in 2006 to ~% in 2011.The ATM share of Israel decreased by ~% from 2006 to 2010 while the ATM share of UAE increased by ~% during the same timeframe.
The African continent as a whole has relatively lesser penetration of ATM usage as compared to the other regions. However as the ATM usage increases over the period, the need for better security becomes critical
10
© This is a licensed product of AM Mindpower Solutions and should not be copied
Asia-Pacific ATM Market Segmentation by Country on the Basis of ATMs installed, in Percentage, 2006 – 2011
SAUDI ARABIA
SAUDI ARABIA ATM MARKET INTRODUCTION
SAMA, the Saudi Arabian Monetary Agency, deals with the day to day management and developments of the modern national payments infrastructure to support the economic development of the Kingdom of Saudi Arabia. SAMA has established the key components of a rational and all-encompassing electronic payments system namely SPAN and SARIE (The Saudi Arabian Riyal Interbank Express). SPAN is a payment system which presents a countrywide network for all payment card and credit card transactions, at ATMs and POSs. SARIE is a single electronic funds transfer system for high-value same-day and forward-dated payments and direct debits. SAMA presents the only method of interbank settlement. SARIE, which initiated…
.
COMPETITIVE LANDSCAPE OF MAJOR BANKS IN SAUDI ARABIA, 2011
0.0%
10.0%
20.0%
30.0%
40.0%
50.0%
60.0%
70.0%
80.0%
90.0%
100.0%
2006 2007 2008 2009 2010 2011P
In P
erce
ntag
e
Saudi Arabia Turkey UAE Israel South Africa

11
© This is a licensed product of AM Mindpower Solutions and should not be copied
Al Rajhi Bank is the world’s leading Islamic bank and has a network covering over ~branches, over 100 dedicated ladies branches, above ~ ATM's, ~ POS terminals installed throughout the kingdom of Saudi Arabia. Their Saudi business model is Sharia-compliant adhering to the Islamic banking principles. This bank is the …
Market Share of the Major Banks in Saudi Arabia on the Basis ATMs Deployed, in Percentage, 2011
Market Share of ATM Holdings by major Banks in Saudi Arabia, on the Basis of Number of ATMs Installed in Units Respectively, 2011
Bank Number of ATMs Installed
Al Rajhi Bank
Riyad Bank
National Commercial Bank (NCB) or Alahli Bank
Arab National Bank
SABB (Saudi British Bank)
Banque Saudi Fransi (BSF)
Bank AlJazira
Saudi Holland Bank
Others
Total
Al Rajhi Bank
Riyad Bank
National Commercial Bank (NCB) or Alahli Bank
Arab National Bank
SABB (Saudi British Bank)
Banque Saudi Fransi (BSF)
Bank AlJazira
Saudi Holland Bank
Others
12
© This is a licensed product of AM Mindpower Solutions and should not be copied
TURKEY
ATM CASH WITHDRAWALS, 2006-2011
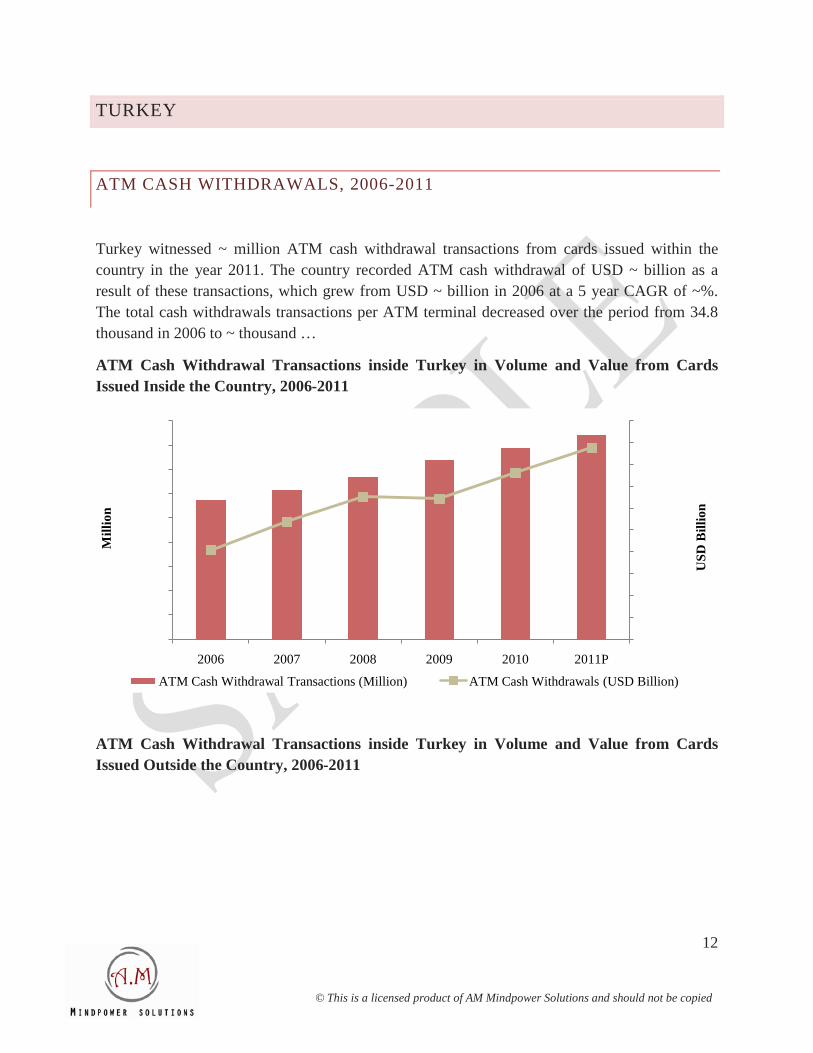
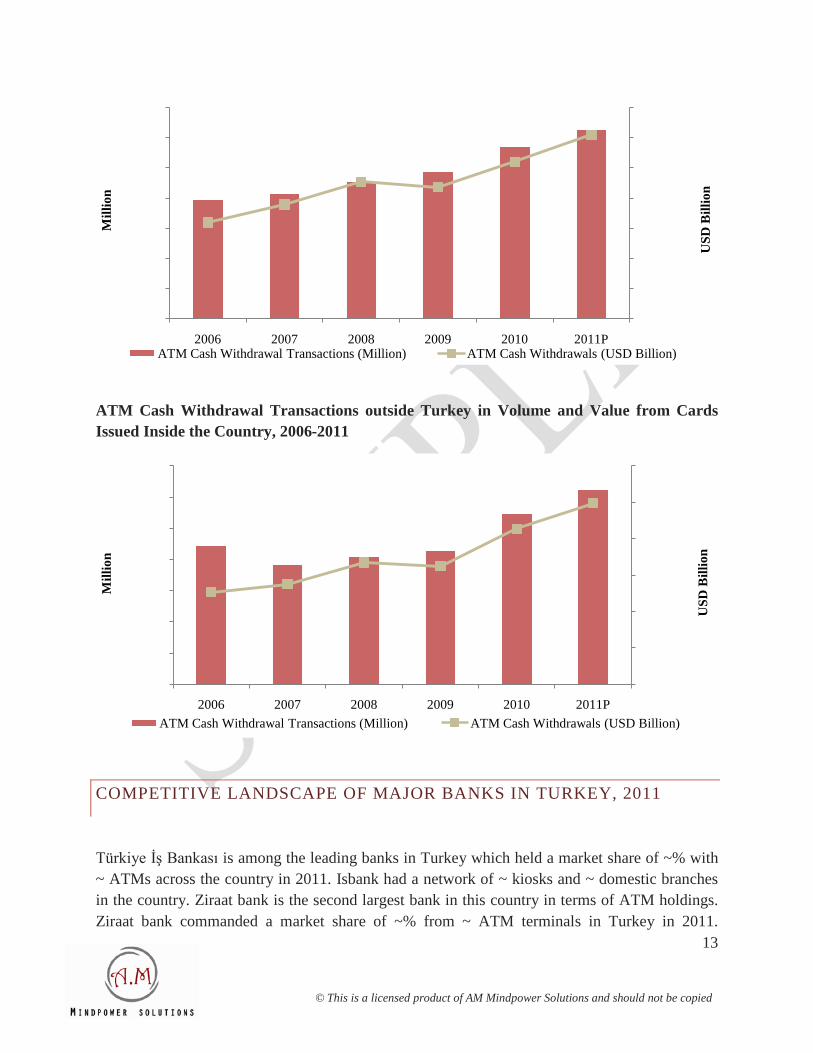
Turkey witnessed ~ million ATM cash withdrawal transactions from cards issued within the country in the year 2011. The country recorded ATM cash withdrawal of USD ~ billion as a result of these transactions, which grew from USD ~ billion in 2006 at a 5 year CAGR of ~%. The total cash withdrawals transactions per ATM terminal decreased over the period from 34.8 thousand in 2006 to ~ thousand …
ATM Cash Withdrawal Transactions inside Turkey in Volume and Value from Cards Issued Inside the Country, 2006-2011
ATM Cash Withdrawal Transactions inside Turkey in Volume and Value from Cards Issued Outside the Country, 2006-2011
0.0
20.0
40.0
60.0
80.0
100.0
120.0
140.0
160.0
180.0
200.0
0.0
100.0
200.0
300.0
400.0
500.0
600.0
700.0
800.0
900.0
2006 2007 2008 2009 2010 2011P
USD
Bill
ion
Mill
ion
ATM Cash Withdrawal Transactions (Million) ATM Cash Withdrawals (USD Billion)
13
© This is a licensed product of AM Mindpower Solutions and should not be copied
ATM Cash Withdrawal Transactions outside Turkey in Volume and Value from Cards Issued Inside the Country, 2006-2011
COMPETITIVE LANDSCAPE OF MAJOR BANKS IN TURKEY, 2011
Türkiye İş Bankası is among the leading banks in Turkey which held a market share of ~% with ~ ATMs across the country in 2011. Isbank had a network of ~ kiosks and ~ domestic branches in the country. Ziraat bank is the second largest bank in this country in terms of ATM holdings. Ziraat bank commanded a market share of ~% from ~ ATM terminals in Turkey in 2011.
0.0
0.5
1.0
1.5
2.0
2.5
3.0
3.5
0.0
2.0
4.0
6.0
8.0
10.0
12.0
14.0
2006 2007 2008 2009 2010 2011P
USD
Bill
ion
Mill
ion
ATM Cash Withdrawal Transactions (Million) ATM Cash Withdrawals (USD Billion)
0.0
0.1
0.2
0.3
0.4
0.5
0.6
0.0
0.5
1.0
1.5
2.0
2.5
3.0
3.5
2006 2007 2008 2009 2010 2011PU
SD B
illio
n
Mill
ion
ATM Cash Withdrawal Transactions (Million) ATM Cash Withdrawals (USD Billion)

14
© This is a licensed product of AM Mindpower Solutions and should not be copied
Akbank came third with market share of ~%. Founded in 1948, the bank has a distribution network of ~ branches and over ~ employees.
Market Share of the Major Banks in Turkey on the Basis ATMs Deployed, in Percentage, 2011
Market Share of ATM Holdings by major Banks in Turkey, on the Basis of Number of ATMs Installed in Units Respectively, 2011
Bank Number of ATMs Installed
İşbank's 4,618
Ziraat bank
Akbank
Garanti Bank
Yapi ve Kredi Bank
Vakifbank
Halk Bank
Türk Ekonomi Bank
Others
Total
İşbank's
Ziraat bank
Akbank
Garanti Bank
Yapi ve Kredi Bank
Vakifbank
Halk Bank
Türk Ekonomi Bank
Others

15
© This is a licensed product of AM Mindpower Solutions and should not be copied
UAE
COMPETITIVE LANDSCAPE OF MAJOR BANKS IN UAE, 2010
Emirates NBD is a major banking group in UAE. The bank has a network of over ~ branches through the country and employs over ~individuals from over 50 countries. With over ~ ATM terminals installed in UAE in 2010, Emirates NBD accounted for ~% market share.
The National Bank of Abu Dhabi was incorporated in 1968. The bank has a network of above ~ branches in UAE and ~ branches in 12 other countries….
Market Share of the Major Banks in UAE on the Basis ATMs Deployed, in Percentage, 2010
Market Share of ATM Holdings by major Banks in UAE, on the Basis of Number of ATMs Installed in Units Respectively, 2010
Bank Number of ATMs Installed
Emirates NBD
National Bank of Abu Dhabi
Dubai Islamic Bank
Emirates NBD
National Bank of Abu Dhabi
Dubai Islamic Bank
Mashreq Bank
Standard Chartered Bank
Commercial Bank of Dubai P.S.C
HSBC Bank Middle East
Abu Dhabi Islamic Bank
Others

16
© This is a licensed product of AM Mindpower Solutions and should not be copied
Mashreq Bank
Standard Chartered Bank
Commercial Bank of Dubai P.S.C
HSBC Bank Middle East
Abu Dhabi Islamic Bank
Others
Total
ISRAEL
ISRAEL ATM MARKET FUTURE PROJECTIONS, 2012-2015
The total number of ATM terminals in Israel is estimated to grow from ~ thousand in 2011 to ~ thousand in 2015 by growing at a 4 year CAGR of ~%. Israel’s ATM market would be marginally propelled by the developing tourism industry, rising population and developing economy.
ATM Terminals Installed in Israel, in Thousands, 2012 – 2015
0.01.02.03.04.05.06.07.08.09.0
10.0
2011 2012 2013 2014 2015
AT
M T
erm
inal
s In
stal
led
('000
s)
ATM Terminals Installed ('000s)

17
© This is a licensed product of AM Mindpower Solutions and should not be copied
SOUTH AFRICA
COMPETITIVE LANDSCAPE OF MAJOR BANKS IN SOUTH AFRICA, 2010
The Absa Group Limited is a prominent financial services group in South Africa. Absa is a subsidiary of Barclays Bank PLC which holds ~% stake in the group. Absa was the leading bank in South Africa with regard to the total ATM holdings. This bank held a market share of ~% in 2010 with ~ ATMs.
Standard Bank of South Africa was the second largest bank in South Africa in terms of total ATM holdings. This bank deployed around ~ ATMs in the country in 2010 commanding a market share …
Market Share of ATM Holdings by major Banks in South Africa, on the Basis of Number of ATMs Installed in Units Respectively, 2010
Market Share of ATM Holdings by major Banks in South Africa, on the Basis of Number of ATMs Installed in Units Respectively, 2010
Bank Number of ATMs Installed
ABSA Bank
ABSA Bank
Standard Bank of South Africa
Nedbank
Others
18
© This is a licensed product of AM Mindpower Solutions and should not be copied
Standard Bank of South Africa
Ned bank
Others
Total
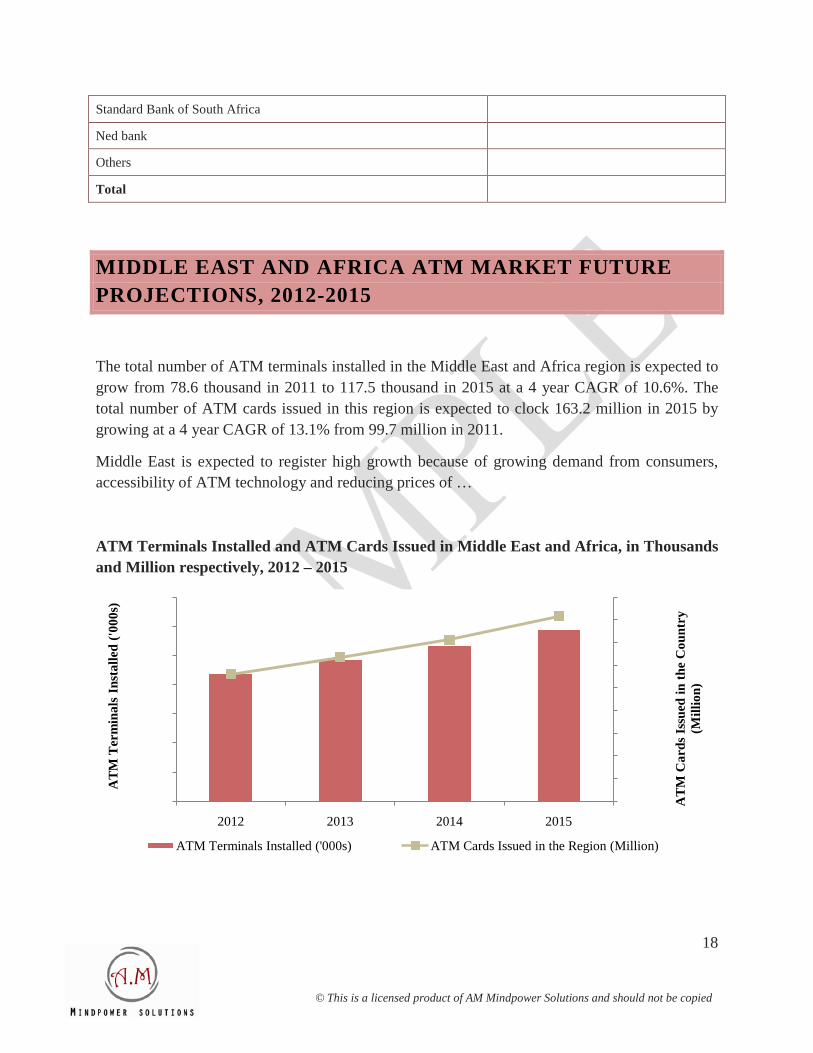
MIDDLE EAST AND AFRICA ATM MARKET FUTURE PROJECTIONS, 2012-2015
The total number of ATM terminals installed in the Middle East and Africa region is expected to grow from 78.6 thousand in 2011 to 117.5 thousand in 2015 at a 4 year CAGR of 10.6%. The total number of ATM cards issued in this region is expected to clock 163.2 million in 2015 by growing at a 4 year CAGR of 13.1% from 99.7 million in 2011.
Middle East is expected to register high growth because of growing demand from consumers, accessibility of ATM technology and reducing prices of …
ATM Terminals Installed and ATM Cards Issued in Middle East and Africa, in Thousands and Million respectively, 2012 – 2015
0.0
20.0
40.0
60.0
80.0
100.0
120.0
140.0
160.0
180.0
0.0
20.0
40.0
60.0
80.0
100.0
120.0
140.0
2012 2013 2014 2015
AT
M C
ards
Issu
ed in
the
Cou
ntry
(M
illio
n)
AT
M T
erm
inal
s In
stal
led
('000
s)
ATM Terminals Installed ('000s) ATM Cards Issued in the Region (Million)
19
© This is a licensed product of AM Mindpower Solutions and should not be copied
DISCLAIMER
The research reports provided by AM Mindpower Solutions are for the personal information of the authorized recipient and is not for public distribution and should not be reproduced or redistributed without prior permission. You are permitted to print or download extracts from this material for your personal use only. None of this material may be used for any commercial or public use.
The information provided in the research documents is from publicly available data and other sources, which are reliable. Efforts are made to try and ensure accuracy of data. With respect to documents available, neither the company nor any of its employees makes any warranty, express or implied, including the warranties of merchantability and fitness for a particular purpose, or assumes any legal liability or responsibility for the accuracy, completeness, or usefulness of any information, apparatus, product, or process disclosed, or represents that its use will not infringe privately owned rights.
The report also includes analysis and views expressed by our research team. The research reports are purely for information purposes. The opinions expressed are our current opinions as of the date appearing in the material and may be subject to change from time to time without notice. Investors should not solely rely on the information contained in the research documents and must make investment decisions based on their own investment objectives, risk profile and financial position. The recipients of this material should take their own professional advice before acting on this information.
AM Mindpower Solutions will not accept returns of reports once dispatched due to the confidentiality of information provided in our reports. In case, a report qualify for return, we will issue a credit, minus shipping charges, of equal value to the original purchase price, toward a future purchase—no refunds. The decision about whether the product return can be accepted or not is solely at our discretion. Any dispute will be subject to laws of India and exclusive jurisdiction of Indian Courts.
No part of this manual or any material appearing may be reproduced, stored in or transmitted on any other Web site without written permission of AM Mindpower Solutions and any payments of a specified fee. Requests to republish any material may be sent to us.