Embed Size (px)
Citation preview
Authors: Anke Herold (Öko-Institut), Anne Siemons (Öko-Institut), Lidia WojtalResponsible Administrator: Georgios Amanatidis ENEditorial Assistant: Irene VernacotolaPolicy Department A: Economy and Scientific Policy and Quality of Life PoliciesEuropean ParliamentPE 607.335
Climate and energy policies in Poland
KEY FINDINGS
GHG emissions in Poland decreased strongly by 37% in the period 1990-2002, but after 2002 emissions grew by 3% until 2015. Poland has agrowth target of 14% for the 2005-2020 period under the Effort SharingDecision (ESD), and it is on track to reach this target because the actualemission increase is lower than expected in the ESD target.
Comparative indicators such as emission intensity indicate that Polandperforms worse than most other Eastern European countries and averageEU-28 Member States in terms of emission reductions and decarbonisationin the energy sector which is due to its strong reliance on coal.
Recent decisions and revised legislation in 2017 in the energy sector willlead to an increased role of coal in energy supply compared to past plansand a much slower expansion of renewable energies than in recent years, inparticular for wind power.
Polish plans in the energy sector will not contribute to significant furtheremission reductions in the future. As Poland is the fifth largest EU emitter,this may slow down overall EU progress in emission reductions.
1. IntroductionThis briefing compiles background information for the ENVI’s delegation to Warsaw on 18-20 September 2017 which will look at Polish projects and initiatives contributing to the fightof climate change and to the decarbonisation of the economy and clean energy.
2. Energy policy and recent developments in the energy sector
2.1. Current situation in the energy sector
Energy consumption in Poland is strongly dominated by the use of coal. Consuming 77million tonnes of coal per year, Poland is the 10th largest coal consumer in the world andthe 2nd largest in the EU, after Germany. 92% of electricity and 89% of heat in Poland isgenerated from coal (World Energy Council 2017). Coal has a share of 51% in gross inlandconsumption, followed by 25% of petroleum products, 14% of gas and 9% of renewableenergies.
In 2016, Poland produced 70.7 million tonnes of hard coal and imported 8.3 milliontonnes, mainly from the Russian Federation (5.2 million tonnes) and Australia(energetyka24.com 2017). Polish exports amounted up to 9.1 million tonnes and mainly

Policy Department A: Economic and Scientific Policy
2 PE 607.335
went to Germany, Czech Republic, Austria, North African and Middle East countries (nettg.pl2017a). The production of lignite was 60.2 million tonnes (Central Statistical Office 2017).
It is estimated that around 80% of Polish coals mines (mainly concentrated in the south-west region of Silesia) are unprofitable (Focus 2017). Employment in the hard coal miningindustry has declined by 78% between 1989 and 2015 with around 90,000 employees in thehard coal sector at the end of 2015 (Euracoal 2017). The most recent data show that at theend of 2016 there were 84,600 employees which in the next 6 months further declined to81,700 which is 0.5% of total employment in Poland (nettg.pl 2017b). Despite governmentsubsidies the coal mining industry in Poland generated a loss of PLN 4.5 billion (=EUR 1.05billion) in 2015. This is due to the high level of coal production costs, coupled with a steadydecrease in the revenues from coal sales and growing debt (European Commission 2016).1
Poland’s power generation stock is ageing – about two-thirds of Poland’s installed coalcapacity is older than 30 years (Bankwatch network 2016). To meet increasing electricityconsumption, investment in new power generation capacities is urgently needed. Thedecisions on the type of replacement of these generation capacities will strongly shape thefuture emission trends.
One of the key laws governing the energy market and future power capacities is the draftCapacity Market Act published in 2016. The purpose of the Act is to prevent generationcapacity deficits by creating economic incentives encouraging the construction, maintenanceand modernisation of generating units and energy demand management on the end users’side. The mechanism is expected to help build and modernise coal infrastructure instead ofexpanding renewable energy provision for Poland. The capacity market operates throughcentralised auctions in which both generating units and Demand Side Response (DSR) unitscan participate. ClientEarth (2017) concludes in a legal study that the draft act is notcompatible with the EU internal market, as (a) it establishes a new measure enabling theaward of subsidies which are harmful for the environment; (b) it fails to provide that thecapacity obligation may be fulfilled by operators from other Member States and (c) it maypossibly fail to ensure the participation of a sufficient number of generators to establish acompetitive price of generation capacity. The costs of the capacity market as presented inthe Regulatory Impact Assessment will amount to PLN 4.15 billion (approx. EUR 0.96billion) in 2021 and will subsequently grow in successive years to PLN 5.1 billion (approx.EUR 1.19 billion) in 2026 to be incurred by all end users. The Capacity Market Act isexpected to enter into force already in 2017 aiming to outrun the Commission's proposal fora regulation on the internal market for electricity which limits the participation in nationalcapacity mechanisms to those new power plants that emit less than 550 grams of CO2/kWh(polityka.pl 2017). The planned most efficient new coal-fired blocks in Poland will emit atleast 700 grams CO2/kWh (energetyka.wnp.pl 2017). This was also the main trigger for thePolish government to launch the "yellow card" procedure – EU's subsidiarity controlmechanism – to block the so-called “winter package” plan to cut CO2 emissions(biznesalert.com 2017).
Poland still consumes a high level of different coal products in domestic heating whichcauses considerable air pollution. However, a draft regulation "On the qualityrequirements for solid fuels" published in February 2017 which was intended to tackle i.a.the smog issue does not discourage the sale of high-polluting coal products. The regulationcurrently contains provisions allowing for the sale of coal with 1.3% sulphur content and12% of ash content to households. Environmental experts requested these thresholds to belowered to 1% -
So far only around 10% of the EU funds for the transformation of the Polish powersector, mainly from free CO2 emission allowances (see section 3.1), have been spent oninvestments related to renewable energy sources (RES) (involving i.a. co-firing of coal and
1 PLN were converted with an average currency conversion rate of EUR 1 = 4.3 PLN based on the average Euro/national currency exchange rates published by EUROSTAT for the past 12 months.

Briefing for the ENVI delegation to Warsaw, Poland, on 18-20 September 2017
PE 607.335 3
biomass), while over 70% of investments were related to improving coal-burninginfrastructure. The biggest beneficiary in that respect is the state-owned company PGE(Polska Grupa Energetyczna) which operates the largest and the most emitting power plant
-Witkowska et al. 2015).
In November 2016, the European Commission has assessed the notified governmentalsupport of PLN 7.958 billion (approx. EUR 1.85 billion) to the Polish hard coal mining sectorto cover production losses and exceptional costs under the closure plan for the period 2015–2018. The Commission decided not to raise objections on the ground that the measuresconstitute state aid compatible with the internal market (European Commission 2017b).
2.2. Future plans and projects in the energy sector
For the Polish government coal will remain a strategic fuel guaranteeing Polish energysecurity. It perceives effective management and efficient coal mining as being in Polishnational interest. The key arguments for continuation of mining are the domestic availabilityof coal in Poland and the existing old power plants remain the cheapest energy source. Thecoal-based power sector is strongly connected to the Polish GDP since the funds invested inmining and the whole coal-based power sector are spent in Poland and received by Polishcompanies. Furthermore, the mining sector is seen as important for the Polish job marketwhereas its actual relative contribution to total employment fell to 0.5% (nettg.pl 2017b).Consequently, Poland plans to construct a capacity of 11,300 megawatts of coal power by2020 (Minister of Energy 2017a) with new coal plants planned in Kozienice, Opole andJaworzno, with a further two being considered in Ostroleka and Pulawy (Minister ofEnvironment 2017). The recent announcement of the Minister of Energy KrzysztofTchórzewski clears however, that the hard- will bethe last coal investment in the Polish energy sector (energetyka.wnp.pl 2017b). Three newlignite open-
(centralPoland) (wysokiena piecie.pl 2017c), and in Gubin, by the border to Germany (expecting toobtaining concession in 2020 and start mining in 2030) (wyborcza.pl 2017).
The document “Energy Policy of Poland until 2030” adopted in 2009 under the previous,Civic Platform government, foresaw an increase of final energy consumption by 29%between 2006 and 2030 (Minister of Energy 2017b). The steepest increase (90%) wouldcome from the services sector. The share of renewable energy in the total primary energyconsumption would rise from 5% in 2006 to 12.4% in 2030 (Ministry of Energy 2017).
In July 2017 the Deputy Minister of Energy Grzegorz Tobiszowski announced that thegovernment is preparing a new energy policy until 2050 with a main focus on 2030. Coaland lignite would still hold a share of around 60% in the energy mix in 2030 and slightlydrop to 50% in 2050 (nowa-energia.com 2017). A major role in the policy would also beplayed by offshore wind farms, development of gas-based power generation, as well asother renewable sources.
Constructing nuclear power capacity is currently considered as one option for the futuredevelopment of the Polish energy sector. The government’s plan for energy policy until 2030assumes nuclear energy would appear in the energy mix already in 2020 and reach a 6.5%share of primary energy (Ministry of Energy 2017). The decision on the development of thenuclear power plant (or plants) will be taken by the end of 2017 (pb.pl 2017;wysokienapiecie.pl 2017c). The cost of a nuclear power plant producing 1000 MWh per year,is estimated to be PLN 16 billion (EUR 3.7 billion). The Polish government is exploringpossibilities of cooperating with China, South Korea, the US and France for the constructionof new nuclear units. Two possible locations have been shortlisted (innpoland.pl 2017).
With regard to shale gas, there is currently no information about its possible role inPoland’s future energy mix. By the end of July 2017, the Ministry of Environment issued 20concessions for the exploration of hydrocarbons while the total number of exploratoryboreholes counts 72 and has not changed since 2015 (Ministry of Environment 2017).
Policy Department A: Economic and Scientific Policy
4 PE 607.335
In March 2017 the government adopted the plan for electromobility in Poland with thegoal of 1 million electric cars on the road by 2025. A legislation process on the act onelectromobilit
2.3. Emissions in the energy and power sector
Poland was the fifth largest GHG emitter in the EU in 2015 with 386 Mt CO2eq emissions(without LULUCF2). 82% of these emissions are caused by the energy sector. Among theGHG emissions from fuel combustion 53% arise from public electricity and heat production,19% from fuel combustion in the residential, commercial and agriculture sector, 16% fromtransport and 10% from manufacturing industries (Poland 2017). Poland experienced asharp decrease in GHG emissions in the early 90s similar to other economies in transition.Total energy emissions decreased by 4.3% in the period 2005-2015, but the trends werequite different in the energy subsectors: GHG emissions from energy industries dropped by8.2%, manufacturing industries by 17.7%, residential, services and agriculture by 7.9%while transport emissions grew by 32.0%. Combined heat and power generation (CHP)plants are the dominant way of electricity production and are responsible for 93% ofemissions from public electricity and heat production while heat plants are responsible for7%.3
Public electricity and heat production caused 155 Mt CO2 emissions in 2015. Coalcombustion caused more than 97% of these emissions, while gas was responsible for 2.2%.While coal consumption in Public electricity and heat production decreased by 11.2% in the2005-2015 period, gas consumption increased by 5.8% and biomass use grew almost 6-foldresulting in an overall emission decrease of 8.9%. Emissions from manufacturing industries(28 Mt CO2e) are dominated by emissions from non-metallic minerals (26.4%), followed bychemicals (22%) and iron and steel production (19%) (Poland 2017). The fuel combustionin the residential sector in those areas not connected to district heating is still stronglydominated by coal (50%) and wood (20%) while gas has a share of 25% and oil of 5%.73% or 26.3 Mt CO2e of emissions arise from coal combustion in the residential sector. Evenin the commercial sector coal is responsible for 16% of the emissions.
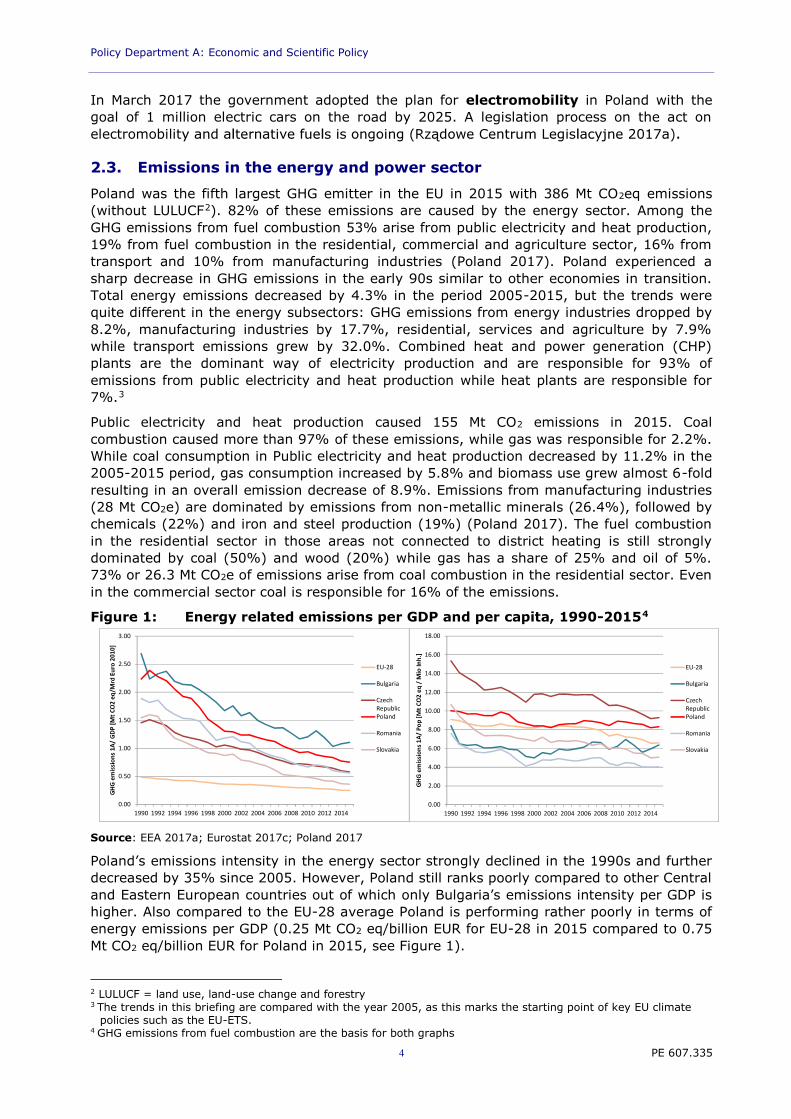
Figure 1: Energy related emissions per GDP and per capita, 1990-20154
Source: EEA 2017a; Eurostat 2017c; Poland 2017
Poland’s emissions intensity in the energy sector strongly declined in the 1990s and furtherdecreased by 35% since 2005. However, Poland still ranks poorly compared to other Centraland Eastern European countries out of which only Bulgaria’s emissions intensity per GDP ishigher. Also compared to the EU-28 average Poland is performing rather poorly in terms ofenergy emissions per GDP (0.25 Mt CO2 eq/billion EUR for EU-28 in 2015 compared to 0.75Mt CO2 eq/billion EUR for Poland in 2015, see Figure 1).
2 LULUCF = land use, land-use change and forestry3 The trends in this briefing are compared with the year 2005, as this marks the starting point of key EU climate
policies such as the EU-ETS.4 GHG emissions from fuel combustion are the basis for both graphs
0.00
0.50
1.00
1.50
2.00
2.50
3.00
1990 1992 1994 1996 1998 2000 2002 2004 2006 2008 2010 2012 2014
EU-28
Bulgaria
CzechRepublicPoland
Romania
Slovakia
0.00
2.00
4.00
6.00
8.00
10.00
12.00
14.00
16.00
18.00
1990 1992 1994 1996 1998 2000 2002 2004 2006 2008 2010 2012 2014
EU-28
Bulgaria
CzechRepublicPoland
Romania
Slovakia
Briefing for the ENVI delegation to Warsaw, Poland, on 18-20 September 2017
PE 607.335 5
Since 2005 Poland’s energy emissions per capita have declined only slightly by 4% to alevel of 8.3 Mt CO2eq/Mio inhabitants in 2015. This is higher than the EU-28 average of 6.6Mt CO2eq/Mio inhabitants and also relatively high compared to per capita emissions of otherCentral and Eastern European countries. Only Czech Republic has higher per capitaemissions in 2015, but started from a much higher level in 1990 (see Figure 1).
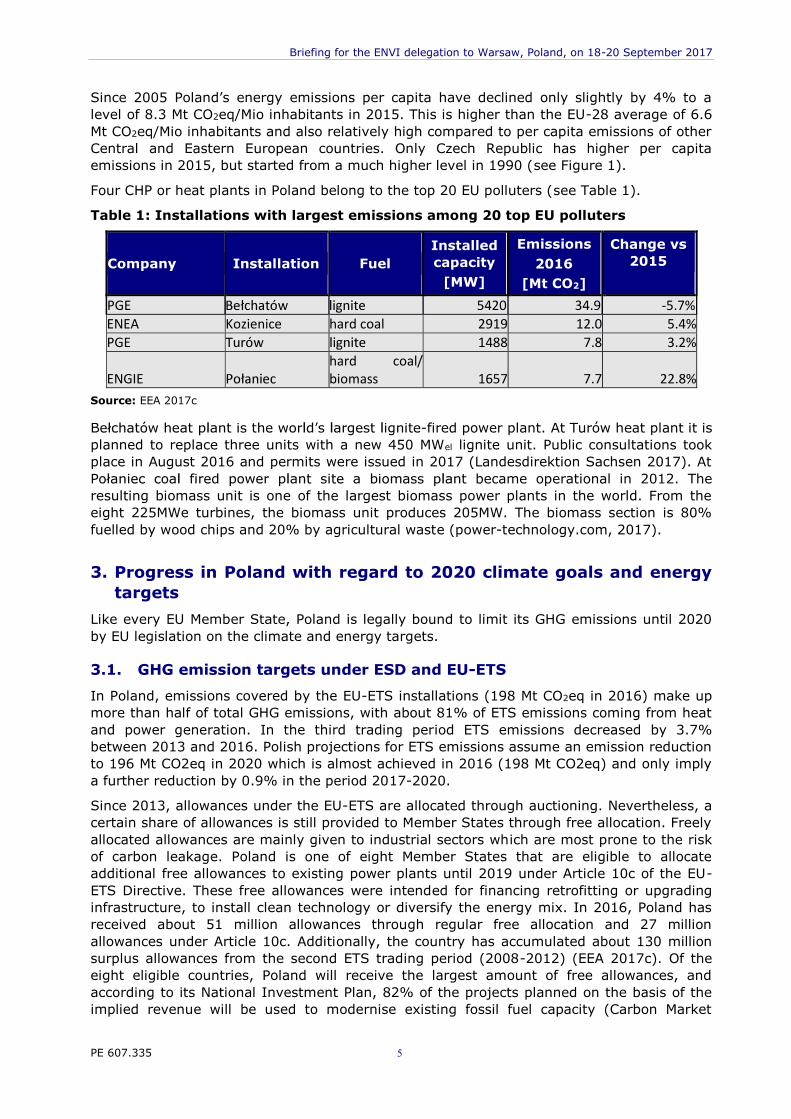
Four CHP or heat plants in Poland belong to the top 20 EU polluters (see Table 1).
Table 1: Installations with largest emissions among 20 top EU polluters
Company Installation FuelInstalledcapacity
[MW]
Emissions2016
[Mt CO2]
Change vs2015
PGE 5420 34.9 -5.7%ENEA Kozienice hard coal 2919 12.0 5.4%PGE 1488 7.8 3.2%
ENGIEhard coal/biomass 1657 7.7 22.8%
Source: EEA 2017c
-fired power plant. At Turów heat plant it isplanned to replace three units with a new 450 MWel lignite unit. Public consultations tookplace in August 2016 and permits were issued in 2017 (Landesdirektion Sachsen 2017). At
t became operational in 2012. Theresulting biomass unit is one of the largest biomass power plants in the world. From theeight 225MWe turbines, the biomass unit produces 205MW. The biomass section is 80%fuelled by wood chips and 20% by agricultural waste (power-technology.com, 2017).
3. Progress in Poland with regard to 2020 climate goals and energytargets
Like every EU Member State, Poland is legally bound to limit its GHG emissions until 2020by EU legislation on the climate and energy targets.
3.1. GHG emission targets under ESD and EU-ETS
In Poland, emissions covered by the EU-ETS installations (198 Mt CO2eq in 2016) make upmore than half of total GHG emissions, with about 81% of ETS emissions coming from heatand power generation. In the third trading period ETS emissions decreased by 3.7%between 2013 and 2016. Polish projections for ETS emissions assume an emission reductionto 196 Mt CO2eq in 2020 which is almost achieved in 2016 (198 Mt CO2eq) and only implya further reduction by 0.9% in the period 2017-2020.
Since 2013, allowances under the EU-ETS are allocated through auctioning. Nevertheless, acertain share of allowances is still provided to Member States through free allocation. Freelyallocated allowances are mainly given to industrial sectors which are most prone to the riskof carbon leakage. Poland is one of eight Member States that are eligible to allocateadditional free allowances to existing power plants until 2019 under Article 10c of the EU-ETS Directive. These free allowances were intended for financing retrofitting or upgradinginfrastructure, to install clean technology or diversify the energy mix. In 2016, Poland hasreceived about 51 million allowances through regular free allocation and 27 millionallowances under Article 10c. Additionally, the country has accumulated about 130 millionsurplus allowances from the second ETS trading period (2008-2012) (EEA 2017c). Of theeight eligible countries, Poland will receive the largest amount of free allowances, andaccording to its National Investment Plan, 82% of the projects planned on the basis of theimplied revenue will be used to modernise existing fossil fuel capacity (Carbon Market
Policy Department A: Economic and Scientific Policy
6 PE 607.335
Watch 2016). Thus, this particular provision under the EU-ETS further supports Poland’sfocus on coal.
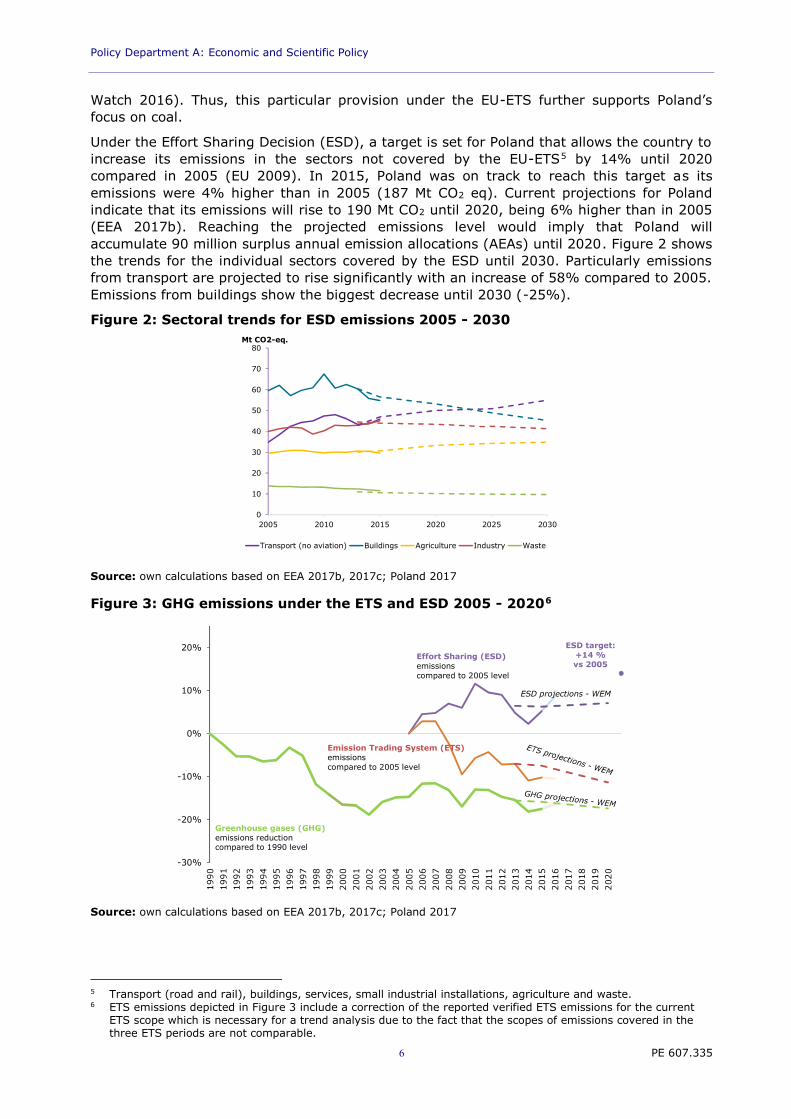
Under the Effort Sharing Decision (ESD), a target is set for Poland that allows the country toincrease its emissions in the sectors not covered by the EU-ETS5 by 14% until 2020compared in 2005 (EU 2009). In 2015, Poland was on track to reach this target as itsemissions were 4% higher than in 2005 (187 Mt CO2 eq). Current projections for Polandindicate that its emissions will rise to 190 Mt CO2 until 2020, being 6% higher than in 2005(EEA 2017b). Reaching the projected emissions level would imply that Poland willaccumulate 90 million surplus annual emission allocations (AEAs) until 2020. Figure 2 showsthe trends for the individual sectors covered by the ESD until 2030. Particularly emissionsfrom transport are projected to rise significantly with an increase of 58% compared to 2005.Emissions from buildings show the biggest decrease until 2030 (-25%).
Figure 2: Sectoral trends for ESD emissions 2005 - 2030
Source: own calculations based on EEA 2017b, 2017c; Poland 2017
Figure 3: GHG emissions under the ETS and ESD 2005 - 20206
Source: own calculations based on EEA 2017b, 2017c; Poland 2017
5 Transport (road and rail), buildings, services, small industrial installations, agriculture and waste.6 ETS emissions depicted in Figure 3 include a correction of the reported verified ETS emissions for the current
ETS scope which is necessary for a trend analysis due to the fact that the scopes of emissions covered in thethree ETS periods are not comparable.
0
10
20
30
40
50
60
70
80
2005 2010 2015 2020 2025 2030
Mt CO2-eq.
Transport (no aviation) Buildings Agriculture Industry Waste
-30%
-20%
-10%
0%
10%
20%
Greenhouse gases (GHG)emissions reductioncompared to 1990 level
ESD target:+14 %vs 2005
Effort Sharing (ESD)emissionscompared to 2005 level
ESD projections - WEM
Emission Trading System (ETS)emissionscompared to 2005 level
Briefing for the ENVI delegation to Warsaw, Poland, on 18-20 September 2017
PE 607.335 7
3.2. Renewable energy targets
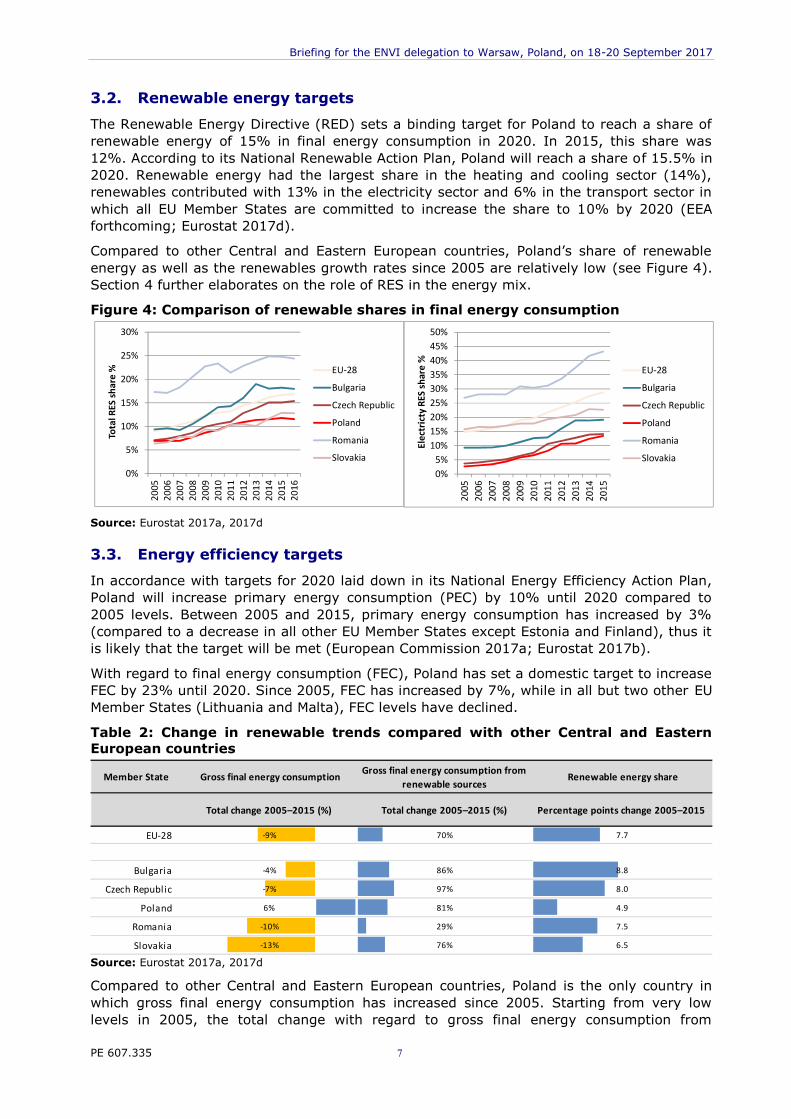
The Renewable Energy Directive (RED) sets a binding target for Poland to reach a share ofrenewable energy of 15% in final energy consumption in 2020. In 2015, this share was12%. According to its National Renewable Action Plan, Poland will reach a share of 15.5% in2020. Renewable energy had the largest share in the heating and cooling sector (14%),renewables contributed with 13% in the electricity sector and 6% in the transport sector inwhich all EU Member States are committed to increase the share to 10% by 2020 (EEAforthcoming; Eurostat 2017d).
Compared to other Central and Eastern European countries, Poland’s share of renewableenergy as well as the renewables growth rates since 2005 are relatively low (see Figure 4).Section 4 further elaborates on the role of RES in the energy mix.
Figure 4: Comparison of renewable shares in final energy consumption
Source: Eurostat 2017a, 2017d
3.3. Energy efficiency targets
In accordance with targets for 2020 laid down in its National Energy Efficiency Action Plan,Poland will increase primary energy consumption (PEC) by 10% until 2020 compared to2005 levels. Between 2005 and 2015, primary energy consumption has increased by 3%(compared to a decrease in all other EU Member States except Estonia and Finland), thus itis likely that the target will be met (European Commission 2017a; Eurostat 2017b).
With regard to final energy consumption (FEC), Poland has set a domestic target to increaseFEC by 23% until 2020. Since 2005, FEC has increased by 7%, while in all but two other EUMember States (Lithuania and Malta), FEC levels have declined.
Table 2: Change in renewable trends compared with other Central and EasternEuropean countries
Source: Eurostat 2017a, 2017d
Compared to other Central and Eastern European countries, Poland is the only country inwhich gross final energy consumption has increased since 2005. Starting from very lowlevels in 2005, the total change with regard to gross final energy consumption from
0%
5%
10%
15%
20%
25%
30%
EU-28
Bulgaria
Czech Republic
Poland
Romania
Slovakia
Member State Gross final energy consumption Gross final energy consumption fromrenewable sources
Renewable energy share
Total change 2005–2015 (%) Total change 2005–2015 (%) Percentage points change 2005–2015
EU-28 -9% 70% 7.7
Bulgaria -4% 86% 8.8
Czech Republic -7% 97% 8.0
Poland 6% 81% 4.9
Romania -10% 29% 7.5
Slovakia -13% 76% 6.5
0%5%
10%15%20%25%30%35%40%45%50%
EU-28
Bulgaria
Czech Republic
Poland
Romania
Slovakia
Policy Department A: Economic and Scientific Policy
8 PE 607.335
renewable sources has been high (81%), but the relative change of renewable energy sharelags behind progress made in other Central and Eastern European countries as well as in thewhole EU (see Table 2 for details) (Eurostat 2017a).
3.4. Additional information on Poland’s approach to climate policy
With regard to EU climate policy until 2050, Poland has been the only Member State whodid not agree on the adoption of two EU roadmaps: the Low-Carbon 2050 Roadmap (March2012) and Energy 2050 Roadmap (June 2012) (politico.eu 2017).
In the context of global climate negotiations under the UNFCCC, Poland ratified theParis Agreement in October 2016 under the assumption that the global, bottom-upapproach will allow every country to choose their own pathway to emission reductions.Poland states that such bottom-up approach should also be reflected in the EU climatepolicy and that continuation of the use of coal with concurrent increase of CO2 sinks(removals) should be possible (Ministry of the Environment 2017a).
With regard to the second commitment period of the Kyoto Protocol running until2020, the President of Poland Andrzej Duda vetoed the act ratifying the Doha Amendmentto the Kyoto Protocol in October 2015, arguing that the legal and economic impact of theratification has not been sufficiently analysed and explained (prezydent.pl 2017).
In 2018, COP24 under the UNFCCC will take place in Katowice, Poland, presided over byMinister of Environment Jan Szyszko. COP24 will be the forth climate summit presided overby Poland and third hosted in Poland.7
The pilot project on forest carbon farms is strongly supported by the Minister ofEnvironment. The Minister sees enhanced CO2 sequestration in forests as a way to fulfil thegoals included in the Paris Agreement as well as to avoid costly emission reductions fromthe industrial sectors (Minister of Environment 2017; swiatoze.pl 2017).
4. Role of the renewable energy sector in the energy mix and recentdevelopments
While gross final renewable energy consumption has nearly doubled between 2005 and2015, its share still remains relatively low at 12% (Eurostat 2017a, 2017d). It is estimatedthat 42% of renewable energy in Poland comes from co-firing coal and biomass and is thusinterdependent with fossil energy use (Olszewski 2014).
Amendments to the Renewable Energy Law which entered into force in 2016 introducedan auction scheme. All technologies are allowed to bid in the auction, except of hydro plantslarger than 20 MW and biomass plants larger than 50 MW. Auctions are performedseparately for technological baskets. Every year the government will announce the totalcapacity of renewable energy and a maximum price to be auctioned. RES generators whocannot take part in auctions remain in the old green certificate system. However, a largeoversupply of certificates of origin on the green certificate market reduces the prices of thecertificates. In July 2017, a compensation fee was introduced that installations which areobliged to hold green certificates can pay instead of purchasing certificates. Thiscompensation fee of around PLN 40/MWh (EUR 9.3/MWh) incentivizes companies to avoidpurchasing green certificates. The amendment of the Renewable Energy Law was adoptedby the Parliament in an expedited procedure, without participation of civil society andsigned by president Duda in August 2017 (reo.pl 2017b, money.pl 2017). The above systemis complemented by annual regulations of the Minister of Energy on the obligation tosurrender and cancel RES certificates. The current draft proposal for 2018 sets a level of17.5% (against 15.4% in 2017) for all RES technologies except for agricultural biogas forwhich the level is 0.5% (against 0.6% in 2017). With the current oversupply of certificates,
7 COP5 in 1999 in Bonn by Minister Jan Sz
Briefing for the ENVI delegation to Warsaw, Poland, on 18-20 September 2017
PE 607.335 9
the proposal is criticized not only by business organisations but also by the Ministry ofDevelopment which proposed to increase the level of surrendered certificates
rsupply ofcertificates on the market was mainly caused by the expansion of co-firing of hard coal andbiomass. Since 2012 production of renewable energy from co-firing has expanded rapidlyand was supported by the low cost of establishing this production (wysokienapiecie.pl2017a).
Particularly, wind energy has experienced growth in recent years with an almost 70-foldincrease between 2005 and 2016. In Poland, the installed capacity in wind farms amountsto 5.8 GW at the end of 2016 with a share of 69% in total RES capacity, putting Poland in7th place in the European Union in terms of wind capacity. According to the EnergyRegulatory Office (ERO), new wind farms with a total capacity of 1.2 GW were built inPoland in 2016 – a 26.7% increase compared to the previous year (The Polish Wind EnergyAssociation 2016). Yet, a new Wind Farm Act signed in 2016 specifically aimed atrestricting wind power development. The Act prohibits building turbines within 1.5 – 2 km ofother buildings or forests, which rules out 99% of land. In addition, the bill quadruples thetax rate on existing turbines which makes them unprofitable (Financial Times 2017).Developers need to apply for a license to operate a wind turbine every two years. Repairworks or modernisation of a turbine requires prior permission from two instances.Additionally, the government did not issue any auction for wind farms with a capacity above1 MW in 2016. In 2017, an auction for 150 MW of capacity was announced, which is only asmall part of the projects waiting for the auctions and ready to be built. Additionally, the lowprice of green certificates as a result of a large oversupply (see above) is not sufficient topay back the loans used to build a large share of Polish wind farms. In 2016, when theprices of certificates were higher, already 70% of the wind farms generated losses amassingto PLN 3 billion (EUR 0.7 billion) (wysokienapiecie.pl 2017b).
Poland co-fires biomass with coal and the Polish government supported co-firing between2005 and 2012 with EUR 1.7 billion (Olszewski 2014). In recent renewable legislation,subsidies for co-firing are maintained. The second amendment to the Renewable EnergyLaw of 2015 therefore allows the coal industry to capitalise on co-firing. (Focus 2017).Within the RES auction system the biggest technology basket (PLN 9 billion = EUR 2.1billion) will be dedicated to the “stable sources” such as biomass co-firing installationsbelonging to the Polish energy consortiums. The simulations for the auctions in this basketproved that most of the support will go to biomass co-firing installations. It is also possiblethat co-firing will enter other energy baskets (IEO 2017).
According to a recent report from IEO (2017b), total solar photovoltaic (PV) installationsreached 199 MW in 2016 which is only 2.3% of total renewable capacity. Of this capacity,around 99 MW is represented by installations built under the green certificate scheme, whilethe remaining 100 MW consists of PV systems installed under net metering. Theamendment of the legislation has created an auction mechanism for PV installations with apower of more than 40 kW and a net-metering scheme for PV systems up to 40 kW.
Geothermal energy is considered as a way to help Poland cope with both CO2 restrictionsas well as with air pollution by the Ministry of Environment, and it is stressed as one of thepriorities in the resources policy of the state. The total amount of financial resourcesdirected towards development of geothermal energy will be a round PLN 1 billion (EUR0.233 billion) (Polish Press Agency 2017).
5. Conclusions and recommendations for the ENVI delegationAs two-thirds of Poland’s installed coal capacity is older than 30 year, the Polish energypolicy is at a very critical point because decisions about the construction of new power andheat generation capacities will lock in investments as well as related GHG emissions for thenext 20-40 years.

Policy Department A: Economic and Scientific Policy
10 PE 607.335
The Polish energy policy is currently under revision and recent decisions such as the draftCapacity Market Act or the amendments to the Renewable Energy Law are likely to evenstronger support the reliance on coal in the energy sector. Also they will likely limit thegrowth of renewable energies, in particular wind, after this growth gained some speed inrecent years. These developments do not support the EU’s objectives as outlined in the low-carbon economy roadmap suggesting that the EU should cut its emissions to 80% below1990 levels until 2050 through domestic reductions. The scenario underlying this cut inemissions assumes an almost total elimination of CO2 emissions from the power sector until2050. A share of 50% of coal in the power sector in Poland in 2050 - as currently foreseenin the government plans - counteracts these long-term EU objectives.
The envisaged energy policy does not seem to acknowledge cost-effectiveness in the waythat the cheapest future generation options are promoted, in particular if plans forsignificant amounts of new coal capacities as well as new nuclear plants will beimplemented. This may cause problems for the Polish competitiveness due to potential highfuture electricity prices.
Some of the developments described in this briefing are based on very recent informationreported in the media, but related government proposals have not yet been published.Therefore it would be useful to gather further insights during the visit in the stage ofevolution of the planned new legislation and plans related to the construction of new coal-fired power plants or new nuclear units during the visit.
As explained above, some studies assume that planned legislation in the energy sector isnot in line with EU legislation (e.g. the draft Capacity Market Act). This would also beanother relevant area for further discussion during the visit.
6. ReferencesBankwatch network (2016). Coal-fired power plants in Poland. http://bankwatch.org/our-work/projects/coal-fired-power-plants-poland, last accessed 16 Aug 2017.biznesalert.com (2017). Winter package will determine the future of Polish economy. http://biznesalert.com/winter-package-will-determine-the-future-of-polish-economy/, last accessed 22 Aug 2017.Carbon Market Watch (2016). Free allowances for power sector through Article 10c: lessons learned for the post-2020 revision ofthe EU ETS. http://carbonmarketwatch.org/wp-content/uploads/2016/09/Free-allowances-for-power-sector-through-Article-10c-lessons-learned-for-the-post-2020-revision-of-the-EU-ETS.pdf, last accessed 24 Aug 2017.Central Statistical Office (2017). Energia 2016. http://stat.gov.pl/obszary-tematyczne/srodowisko-energia/energia/energia-2016-folder,1,4.html#, last accessed 22 Aug 2017.ClientEarth (2017). The Polish Draft Act on the Capacity Market in light of EU law. www.documents.clientearth.org/wp-content/uploads/library/2017-03-01-the-polish-draft-act-on-the-capacity-market-in-light-of-eu-law-ce-pl.pdf, last accessed 01 Sep 2017.Council of the European Union (2007). Brussels European Council 8/9 March 2007. Presidency Conclusions (No. 7224/1/07).http://www.consilium.europa.eu/ueDocs/cms_Data/docs/pressData/en/ec/93135.pdf, last accessed 29 Sep 2014.energetyka.wnp.pl (2017a). Rynek mocy w Polsce - Available at: http://energetyka.wnp.pl/rynek-mocy-w-polsce-kogo-wykluczyloby-kryterium-550-kg-co2-mwh,288138_1_0_2.html, last accessed 22 Aug 2017.ener http://energetyka.wnp.pl/koniec-z-budowa-nowych-elektrowni-weglowych-w-polsce,305594_1_0_0.html , last accessed at 07 Sep 2017
www.energetyka24.com/553120,arp-w-2016-roku-polskie-kopalnie-tracily-prawie-7-zl-na-tonie-wegla, last accessed 22 Aug 2017.EU (2009). Decision No 406/2009/EC of the European Parliament and of the Council of 23 April 2009 on the effort of MemberStates to reduce their greenhouse gas emissions to meet the Community’s greenhouse gas emission reduction commitments up to2020 (OJ L 140, 05.06.2009, pp. 136–148). http://eur-lex.europa.eu/LexUriServ/LexUriServ.do?uri=OJ:L:2009:140:0136:0148:EN:PDF, last accessed 05 Aug 2014.Euracoal (2017): The voice of coal in Europe: Poland. https://euracoal.eu/info/country-profiles/poland/, last accessed 07 Sep 2017.European Commission (2016). State Aid SA.41161 (2015/N) – Poland. State aid to Polish coal mining in the period 2015-2018 (No.C (2016) 7510 final). http://ec.europa.eu/competition/state_aid/cases/257337/257337_1866791_407_2.pdf, last accessed 22 Aug2017.European Commission (2017a). 2016 assessment of the progress made by Member States in 2014 towards the national energyefficiency targets for 2020 and towards the implementation of the Energy Efficiency Directive 2012/27/EU as required by Article 24(3) of the Energy Efficiency Directive 2012/27/EU. Report from the Commission to the European Parliament and The Council.https://ec.europa.eu/commission/sites/beta-political/files/report-energy-efficiency-progress_en.pdf, last accessed 17 Jul 2017.European Commission (2017b). Commission clears PLN 7.95 billion Polish support for closing coal mines. Press release.http://europa.eu/rapid/press-release_IP-16-3824_en.htm, last accessed 22 Aug 2017.European Environment Agency (EEA) (forthcoming). RES proxy. to be added, last accessed to be added.
Briefing for the ENVI delegation to Warsaw, Poland, on 18-20 September 2017
PE 607.335 11
European Environment Agency (EEA) (2017a). EEA dataset GDP at 2010 constant prices: derived from Ameco / Ecfin. Estimatesgap-filled with World Bank data and other sources for BG 1991, EE 1991-93, HU 1991, MT 1991, SK and HR 1991-94.European Environment Agency (EEA) (2017b). Eionet reporting obligations database (ROD) - Deliveries for projections.http://rod.eionet.europa.eu/obligations/697/deliveries, last accessed 04 Jul 2017.European Environment Agency (EEA) (2017c). EU ETS data viewer. http://www.eea.europa.eu/data-and-maps/data/data-viewers/emissions-trading-viewer, last accessed 04 Jul 2017.Eurostat (2017a). ‘Final energy consumption’, Simplified energy balances - annual data [nrg_100a], code B_101700.http://ec.europa.eu/eurostat/tgm/table.do?tab=table&init=1&language=en&pcode=tsdcc320&plugin=1, last accessed 11 Jul 2017.Eurostat (2017b). ‘Gross inland energy consumption’, Simplified energy balances - annual data [nrg_100a], code B_100900.http://ec.europa.eu/eurostat/tgm/table.do?tab=table&init=1&language=en&pcode=tsdcc320&plugin=1, last accessed 11 Jul 2017.Eurostat (2017c). Population on 1 January by age and sex.http://appsso.eurostat.ec.europa.eu/nui/show.do?dataset=demo_pjan&lang=en, last accessed 23 Aug 2017.Eurostat (2017d). SHARES 2015 results. http://ec.europa.eu/eurostat/web/energy/data/shares, last accessed 04 Jul 2017.Financial Times (2017). Bill threatens Polish wind power, warns industry. https://www.ft.com/content/d8362bac-030b-11e6-9cc4-27926f2b110c, last accessed 01 Sep 2017.Focus (2017). Reforming Poland’s renewable industry. http://www.renewableenergyfocus.com/view/44664/reforming-poland-s-renewable-industry/, last accessed 16 Aug 2017.
do nowych regulacji dla rynku OZE. http://gramwzielone.pl/trendy/27829/ministerstwo-rozwoju-ma-zastrzezenia-do-nowych-regulacji-dla-rynku-oze, last accessed 22 Aug 2017.
https://biznes.newseria.pl/news/prezes-ieo-aukcje-energii,p945083350, last accessed 22 Aug 2017.IEO (2017b) In Poland total installed solar capacity reached 199 MW at the end of 2016.http://www.energycentral.com/news/poland-total-installed-solar-capacity-reached-199-mw-end-2016. Last accessed 1.9.2017.innpoland.pl (2017). Budowa polskiej elektrowni atomowej jak scenariusz “Mody na sukces”. Jeden potwierdza, drugi zaprzecza,termin ucieka. http://innpoland.pl/136477,budowa-polskiej-elektrowni-atomowej-jak-scenariusz-mody-na-sukces-jeden-potwierdza-drugi-zaprzecza-termin-ucieka, last accessed 22 Aug 2017.Kenig-Witkowska, M. M.; Stoczkiewicz, M. & Warso-ETS dla elektroenergetyki w Polsce. https://www.documents.clientearth.org/library/download-info/derogacje-od-transformacji/, lastaccessed 22 Aug 2017.Landesdirektion Sachsen (2017). Immissionsschutz - Landkreis Görlitz - Kraftwerk Turów über die Entscheidung zum Antrag aufÄnderung der integrierten Genehmigung zur Errichtung und zum Betrieb eines 450MWel-Blockes in Bogatynia, Republik Polen.https://www.lds.sachsen.de/bekanntmachung/index.asp?ID=12894&art_param=634, last accessed 01 Sep 2017.Minister of Energy (2017a). Information on Energy Clusters: Minister of Energy Krzysztof Tchórzewski. http://www.me.gov.pl/node/27308, last accessed 22 Aug 2017.
on depedency of Poland on imported coal). http://orka2.sejm.gov.pl/INT8.nsf/klucz/283B8401/%24FILE/z03747-o1.pdf, lastaccessed 22 Aug 2017.Minister of Environment (2017). Our aim is to present the forest carbon farms to the world: Minister of Environment Jan Szyszko.https://www.mos.gov.pl/en/news/details/news/minister-szyszko-our-aim-is-to-present-the-forest-carbon-farms-to-the-world/, lastaccessed 22 Aug 2017.Ministerstwo Energii (Ministry of Energy) (2017). Polityka energetyczna Polski do 2030 roku.http://www.me.gov.pl/files/upload/8134/Polityka%20energetyczna%20ost.pdf, last accessed 22 Aug 2017.Ministry of Environment (2017). Information on the state of play on shale gas exploration. http://lupki.mos.gov.pl/gaz-z-lupkow/stan-prac-w-polsce, last accessed 22 Aug 2017.Ministry of the Environment (2017a). Porozumienie Paryskie ratyfikowanehttps://www.mos.gov.pl/aktualnosci/szczegoly/news/porozumienie-paryskie-ratyfikowane-przez-polske/, last accessed 22 Aug 2017.
https://www.money.pl/gospodarka/wiadomosci/artykul/prezydent-podpisal-kontrowersyjna-nowelizacje,47,0,2354735.html?src01=6a4c8&src02=facebook_money, last accessed 22 Aug 2017.nettg.pl (2017a). Górnictwo: tegoroczne eksport http://nettg.pl/news/140483/gornictwo-weglokoks-planuje-wyeksportowac-4-mln-t-wegla, last accessed 22 Aug 2017.nettg.pl (2017b).http://nettg.pl/news/144809/weglowy-remanent-cz-1, last accessed 07 Sep 2017.nowa-
http://nowa-energia.com.pl/2017/07/04/minister-tchorzewski-potrzebujemy-nowoczesnego-gornictwa-ktore-bedzie-stanowilo-trzon-naszego-bezpieczenstwa-energetycznego/, last accessed 22 Aug 2017.Olszewski, M. (2014). A Polish appetite for biomass. https://energytransition.org/2014/09/polish-appetite-for-biomass/, last accessed24 Aug 2017.pb.pl (2017). Pol https://www.pb.pl/polska-nadal-bedzie-weglowa-866204, last accessed 22 Aug 2017.Poland (2017). Inventory submission 2017. http://unfccc.int/national_reports/annex_i_ghg_inventories/national_inventories_submissions/items/10116.php, last accessed 20 Jul 2017.Polish Press Agency (2017). Min. http://www.pap.pl/aktualnosci/news,889910,szyszko-geotermia-to-nasza-przyszlosc-.html, last accessed 22 Aug 2017.politico.eu (2017). Poland blocks energy roadmap. http://www.politico.eu/article/poland-blocks-energy-roadmap/, last accessed 22Aug 2017.

Policy Department A: Economic and Scientific Policy
12 PE 607.335
na nierentowne elektrownie? 6 faktów o pisowskim rynku mocy.http://www.polityka.pl/tygodnikpolityka/rynek/1712998,1,bedziemy-sie-zrzucac-na-nierentowne-elektrownie-6-faktow-o-pisowskim-rynku-mocy.read, last accessed 22 Aug 2017.prezydent.pl (2017). The official website of the President of the Republic of Poland, information on the vetoed acts.http://www.prezydent.pl/prawo/ustawy/zawetowane/art,2,prezydent-zawetowal-trzy-ustawy.html, last accessed 22 Aug 2017.reo.pl (2017a). Tobiszowski: na http://www.reo.pl/wiadomosci/tobiszowski-na-cop24-pokazemy-czysty-wegiel-nW8R9t, last accessed 22 Aug 2017.reo.pl (2017b). Ustawa http://www.reo.pl/wiadomosci/ustawa-o-oze-sejm-uchwalil-poselska-nowelizacje-p11mAl, last accessed 22 Aug 2017.
https://legislacja.rcl.gov.pl/projekt/12297850/katalog/12430708#12430708, last accessed 22 Aug 2017.
, miejsc i sposobów
http://legislacja.rcl.gov.pl/projekt/12294404/katalog/12407940#12407940, last accessed 22 Aug 2017.
https://legislacja.rcl.gov.pl/projekt/12294809/katalog/12412027#12412027, last accessed 22 Aug 2017.
. https://legislacja.rcl.gov.pl/docs//567/12300960/12449954/12449957/dokument303183.pdf, lastaccessed 22 Aug 2017.
http://spalaniebiomasy.pl/pl/component/content/article/1-aktualnosci/4456-zeszoroczny-udzia-oze-w-krajowym-miksie-wytwarzania-wynios-8.html, last accessed 22 Aug 2017.
http://swiatoze.pl/expo-2017-polskim-akcentem-lesnym/, last accessed22 Aug 2017.The Polish Wind Energy Association (2016). The state of wind energy in Poland. http://psew.pl/wp-content/uploads/2017/06/Stan-energetyki-wiatrowej-w-Polsce-w-2016-r.pdf, last accessed 16 Aug 2017.UN (2017). Prime Minister Beata Sz -level ceremony for the Paris Agreement.http://www.un.org/sustainabledevelopment/wp-content/uploads/2016/04/PolandE.pdf, last accessed 22 Aug 2017.World Energy Council (2017). Coal in Poland. https://www.worldenergy.org/data/resources/country/poland/coal/, last accessed 16Aug 2017.wyborcza.pl (2017). Kontrowersyjne plany budowy nowych kopalni odkrywkowych. PGE przyparta do muru przez akcjonariusza. Co
http://wyborcza.pl/7,155287,22085473,pge-rozwaza-budowe-gigantycznej-kopalni-odkrywkowej-przy-granicy.html, lastaccessed 22 Aug 2017.wysokienapiecie.pl (2017a). Co dalej z zielonymi certyfikatami. http://wysokienapiecie.pl/oze/1861-zielone-certyfikaty-cena-nadpodaz-obowiazek-2016-2020, last accessed 22 Aug 2017.
http://wysokienapiecie.pl/prawo-energetyczne/2430-lex-energa-pomoze-panstwowemu-koncernowi, last accessed 22 Aug 2017.
http://wysokienapiecie.pl/energetyka-konwencjonalna/2412-strategia-energetyczna-polski-czyli-ile-wegla-w-weglu.html, last accessed 22 Aug 2017.


![Constraint Satisfaction Problems: Complexity and Algorithmsabulatov/papers/siglog.pdf · Colouring, to its final resolution by the author [Bulatov 2017b; 2017c] and indepen-dently](https://img.dokumen.tips/doc/110x75/5e2d14e81fc6b84eea400359/constraint-satisfaction-problems-complexity-and-algorithms-abulatovpapers-.jpg)