Embed Size (px)
Citation preview

– Strategic Management Journal, under 2nd review –
Knowledge Transfer in Vertical Alliances: Advantages for whom?
Luiz F. Mesquita* Assistant Professor of Strategy and International Management
School of Global Management and Leadership Arizona State University
4701 West Thunderbird Rd. FAB N130. Phoenix, AZ. 85306-4908
Jaideep Anand Associate Professor of Corporate Strategy and International Business
Fisher College of Business Ohio State University
2100 Neil Ave Columbus, OH. 43210-1144.
Thomas H. Brush Associate Professor of Strategic Management
Krannert Graduate School of Management Purdue University
403 W State St. West Lafayette, IN. 47907-2056
*Corresponding author
We thank Patricia Friedrich, Robert Hoskisson, Sergio Lazzarini, Michael Leiblein, Frank Rothaermel, Fred Walumbwa, Jane Zhao, and seminar participants at the W.P. Carey School of Business of Arizona State University for comments and suggestions on earlier drafts. We also thankfully acknowledge the support of CNH Global, Caterpillar Inc., Deere & Company and Morton Metalcraft, Inc. This research was funded by the IBM Corporation and the Dauch Center for the Management of Manufacturing Enterprises at Purdue University (DCMME).

1
Knowledge Transfer in Vertical Alliances: Advantages for whom?
ABSTRACT
Previous research has shown that vertical learning alliances help suppliers acquire
knowledge to forge new capabilities and attain performance improvements. We ask whether
such supplier improvements are exclusive to the learning partnership, or available in other
average partnerships. We integrate theoretical elements from the resource-based and
relational views to theorize that partnership exclusive performance, termed here ‘relational
performance’, is a function of suppliers acquiring know how within the dyad, developing
dyad-specific assets and capabilities and structuring buyer-supplier relational governance
mechanisms. Based on empirical evidence from a survey with 253 suppliers to the equipment
industry, we find that only parts of the supplier’s newly acquired capabilities are exclusive to
the learning partnership, while the rest seems to permeate to the supplier’s average customer
base. We discuss implications for research and practice.

2
Recently, scholars have portrayed learning alliances as key factors for sustained
competitive advantages (e.g. Anand et al., 2000; Dussauge et al., 2004; Grant, 1996; Hamel,
1991; Hatch et al., 2004; Kale et al., 2000; Khanna et al., 1998; Mowery et al., 1996, 1998;
Simonin, 1999, 2004; Spender, 1996; von Hippel, 1988). Based on the resource based view –
RBV (Barney, 1991; Peteraf, 1993) and the dynamic capabilities approach (Teece et al.,
1997), these scholars explain, that firms earn advantages by forging new capabilities through
knowledge acquisition. This rationale has been especially relevant for a vast array of
industries, from automobiles to semiconductors, which have experienced the dismantling of
vertically integrated empires and seen the matter of managing supplier networks become
more salient. Following the learning alliances motivation, these industries have seen the
emergence of supplier development programs, i.e. concerted knowledge transfer efforts
whereby buyers educate suppliers on the principles of advanced production systems, such as
“lean”, “flow”, or “just in time” (Dyer & Nobeoka, 2000; Kotabe, Martin, & Domoto, 2003;
Takeishi, 2001). The logic is rather simple: buyers accumulate a body of cutting edge
knowledge, taking advantage of their center-hub position of a network, and then teach less
knowledgeable suppliers so as to garner supply chain competitiveness.1
But it is not clear whether or under what conditions buyers stand to gain from training
their suppliers. Though trained suppliers may out-perform untrained ones, if this performance
gain is not exclusive to the learning partnership, then training buyers would see no
advantages to their knowledge transfer efforts, as other buyers could potentially free ride the
investments by simply partnering with the trained supplier. The magnitude of this problem
can be illustrated through the following example. Toyota and John Deere, two leaders in the
automotive and equipment industries respectively, have made substantial investments in their
supplier development programs, believing they can establish a supply-base advantage (Dyer
1 For matters of simplicity we take the knowledge source’s and recipient’s identities to be those of buyers and suppliers respectively. We acknowledge these identities can also function in reverse, e.g. suppliers to buyers.

3
& Nobeoka, 2000; Nelson, 2001). Some of their rivals, however, have taken strikingly
different approaches. For example, one leading contender of Deere prefers to routinely pick
first-rate suppliers from the market and pressure them to continuously upgrade their
capabilities with investments of their own – an approach we refer to as “cream-off the
supplier market” – in an attempt to accrue similar supply chain benefits. An executive of this
firm remarked to us during an interview “If Deere invests so much in knowledge transfer to
suppliers, if the market also offers numerous training programs and if the costs of training
suppliers are as large as benefits are uncertain, why not just cream the market off?” This
paradox translates back to the RBV framework as follows: if supplier’s performance gains
are not exclusive to the learning partnership, then Deere would see no advantages to its
training investments, as competitors can potentially free ride them.
In the event Toyota and Deere’s beliefs are correct in that their trained suppliers’
superior performance is partnership exclusive, the following research question results: what
factors explain a supplier’s performance gains to materialize exclusively within its learning
alliance? A related question would be, in the event Deere’s competitor above is correct in that
it can free ride Deere’s supplier training investments, to what extent do the trained supplier’s
performance gains permeate to its average customer base performance?
To address these questions, we model factors involved in the knowledge acquisition
process by suppliers. In doing so, we contrast theoretical elements from the resource-based
view – RBV (e.g. Barney, 1991; Dierickx & Cool, 1989) and the relational view (Dyer &
Singh, 1998). While the RBV seeks to understand the sources of firm advantage (Barney,
1991), the relational view seeks to understand the sources of inter-organizational advantage,
where the focus lies on the dyad as the unit of analysis, not the firm (Dyer & Singh, 1998;
Gomes Casseres, 1984; Smith, Carroll, & Ashford, 1995). We argue that the RBV is useful to
explain how trained suppliers out-perform untrained ones through the acquisition of valuable

4
and costly to imitate capabilities; however, the RBV is less useful to explain a supplier’s
superior performance that is exclusive to the learning partnership. To examine the latter, we
rely on the relational view to argue that the extent to which a trained supplier’s performance
advantage is partnership exclusive depends on the locus of its acquired capabilities. If these
are held at the trained supplier / training buyer dyad interface they will be exclusively
deployable in that very partnership, but if they reside entirely within the trained supplier
boundaries, they will be re-deployable across to other average buyers. Additionally, we
theorize that partnership exclusive performance also depends on how the trained supplier’s
capabilities were forged; particularly, we argue that partnership exclusive performance
associates with special forms of knowledge transfer as well as inter-firm governance
mechanisms. We test this model with exclusive survey data from 253 U.S. parts suppliers.
Our study contributes to existing learning alliances and buyer-supplier relationship
literatures in significant ways. For example, previous research primarily builds on the RBV
and dynamic capabilities frameworks to explain the association between a trained firms’
competitive advantages and valuable but difficult to acquire capabilities; our study, in
contrast, also integrates insights from the relational view (Dyer & Singh, 1998) to investigate
the knowledge transfer processes resulting in superior performance exclusively within the
learning alliance. Thus our focus is not on the mechanisms that prevent alliance knowledge
spillover (e.g. our concern is not with Deere’s competitors acquiring Deere’s knowledge), but
on mechanisms that make it costly for suppliers to re-deploy their capabilities in other
average partnerships after the knowledge is transferred (e.g. our concern is with the supplier
learning-dyad exclusive performance). Ultimately, by contrasting processes leading to a
supplier’s relational performance (the difference between its performance with a focus
partner vis-à-vis with its average partner base) with its re-deployable performance (the

5
performance levels trained suppliers can replicate across average customers), we attempt to
advance and integrate the resource-based and relational views.
KNOWLEDGE TRANSFER AND PERFORMANCE
Referring to the model in Figure 1, we begin with the motivation from the resource-
based logic (hypothesis 1), which helps us review useful literature and explain sources of a
supplier’s re-deployable performance. We then elaborate on factors involved in the relational
view (hypotheses 2, 3, and 4) which explain this supplier’s relational performance.
<<Insert Figure 1 about here>>
Knowledge Acquisition and Re-deployable Performance
Management scholars assert that one’s competitive advantage results from the possession
of valuable, rare, and costly to imitate resources and capabilities (Barney, 1991; Dierickx &
Cool, 1989; Peteraf, 1993). Teece, et al (1997) extended this notion by proposing a dynamic
capabilities approach to firm advantage; they propose that one’s ability to continually acquire
new knowledge to adapt and upgrade its capabilities is crucial to sustaining such advantages.
But not all knowledge translates into competitive advantages (Barney, 1991; Peteraf,
1993). It is only when the markets for knowledge are imperfect (e.g. this knowledge is
‘sticky’, or the resources and capabilities based on such knowledge accumulate slowly over
time, or the acquisition of this knowledge is subject to path dependence) that one is likely to
see sustainable advantages (Barney, 1991; Dierickx & Cool, 1989). Based on the above
market imperfection logic, scholars have proposed that advantages accrue mostly to those
focusing on the acquisition of tacit and team-based (i.e. collective) as opposed to explicit and
individually held knowledge (Spender, 1996; Zhao, Anand, & Mitchell, 2004).
Collective knowledge in buyer-supplier partnerships
Taking the RBV and dynamic capabilities framework above to the context of buyer-
supplier partnerships we posit that suppliers who acquire collective production know-how

6
out-compete those which do not. This acquisition of collective production know-how is
defined as the implementation of a broader set of capabilities involving far-reaching
organizational and technological adaptations inherent in advanced production systems (as
opposed to the implementation of one or another specific technique). These include, for
example, the abilities to perform large-scale plant changeovers and reductions of buffer
inventories through just-in-time management, as well as various other multifaceted activities
that lie across different layers of the firm’s hierarchical ladder, such as the coordination of
data gathering, the establishment of quality inspection responsibilities, and the integration of
root cause analyses (Nishiguchi, 1994). Because this acquisition involves the understanding
of socially complex nuances in these team-based capabilities (Hatch & Dyer, 2004), firms
resort to multi-period learning efforts (what Ohno, 1988 referred to as kaizen), and social
interactions with training organizations (Dyer & Nobeoka, 2000; McEvily & Zaheer, 1999).2
The above described acquisition of collective know-how, in turn, enables trained
suppliers to more speedily and more flexibly respond to changes in demand patterns of its
customer base, thus observing improvements in its production and delivery abilities. For
example, because of the temporal discrepancy between buyers’ orders and goods production,
suppliers often cushion against lost sales by stockpiling inventory (Hopp & Spearman, 2000).
As they acquire the know-how above, suppliers are now able to more flexibly and swiftly
promote changes in plant set up so as to respond accordingly to changes in mix and volume.
These capabilities enable suppliers to reduce the size of the temporal discrepancy, and
operate with smaller piles of buffer inventories (Dyer & Nobeoka, 2000; Lieberman &
Asaba, 1997). Likewise, these suppliers are also likely to improve the efficiency with which
they deliver goods to buyers; that is, with increased production flexibility (i.e. increased
2 Such training organizations may be large customers (e.g. Dyer & Nobeoka, 2000, describe how Toyota's suppliers rely on this auto maker's successful knowledge transfer program), or even market available institutions (e.g. McEvily & Zaheer, 1999, describe how parts manufacturers acquire knowledge through extensive multi-period training efforts in publicly supported agencies, training centers and universities).

7
speed to respond) suppliers are less likely to delay delivery of particular orders, thus saving in
costs such as “expediting”, “follow up work” and “extra inventory” all of which are
recognized as some of the most expensive costs of product exchange (Dyer & Nobeoka,
2000; Ferdows et al., 1986; Kotabe et al., 2003; Ward et al., 1995).
Notably, the rationale above implies that once a supplier possesses valuable and costly
to imitate resources, it will outperform rivals who do not own similar resources. At the same
level, our theory implies that the possession of newly learned capabilities enables suppliers to
improve performance in general, across different contexts; the theory is not deterministic
when it comes to partnership exclusive performance improvements. Thus, we posit that such
suppliers increase their re-deployable as opposed to their relational performance:
Hypothesis 1: A supplier’s knowledge acquisition efforts associate more positively with its re-deployable performance than with its relational performance. Hypothesis 1 above helps establish a basis for comparison with our central theses,
presented below. Specifically, an exclusive focus on the RBV and dynamic capabilities
literature helps explain re-deployable performance, but not relational performance. Below,
we borrow theoretical elements from the relational view to explain that a supplier’s relational
performance is a function of their (a) acquiring knowledge in joint efforts with partners, as
opposed to acquiring them from unrelated partners or even from publicly available agencies;
(b) developing partnership specific assets and capabilities; and (c) structuring buyer-supplier
relational governance mechanisms to safeguard specific assets and coordinate the use of
complementary assets. We explore each of these in turn.
Joint Knowledge Acquisition and Relational Performance
When suppliers develop knowledge acquisition efforts jointly with a given buyer, they
are more likely to attain relational performance gains with that buyer. Joint buyer-supplier
knowledge acquisition efforts are defined as the acquisition of collective or complex
manufacturing know-how by suppliers where the focus buyer has direct participation in the

8
process. Direct participation relates to buyers being involved in the supplier acquisition
efforts either by “teaching” and / or “co-participating”. “Teaching” involves hands on
instructing and consulting, such as for example when buyers send their own employees into
supplier plants for weeks or months to help implement kaizen routines, redesign work
stations, reorganize process flow, modify equipment, and establish problem-solving groups
(e.g. MacDuffie & Helper, 1997: 118). “Co-participating”, in turn, involves buyers’ and
suppliers’ staff joining for training offered by third parties, such as when buyer and supplier
firms each send engineers to learning programs at a given university or a government agency.
The effect of joint knowledge acquisition efforts on relational performance occurs in two
ways. First, joint learning efforts lead to greater rates of learning, resulting in improvements
which firms outside the dyad are unable to comprehend and unable to match. Where partners
work in physical and social proximity, they are able to more serendipitously and swiftly
cross-fertilize each other’s systems with new ideas and suggestions for co-adaptations (Kogut
& Zander, 1996). For instance, Kogut & Zander (1996) explain that knowledge within an
organization flows faster across its members than to outsiders because these members share
an identity, and are more socially integrated. Here, we take this logic to infer that the same
knowledge flow effects can be observed in groups of buyer’s and supplier’s members
integrated in joint purposes and efforts to share knowledge, even if they do not formally
belong to the same organization (Zhao et al, 2004). Moreover, scholars also believe there is a
‘learning to learn’ effect as well. For example, Anand & Khanna (2000) explain that alliance
partners observe greater knowledge transfer effects overtime, as their learning alliance
becomes more efficient. Also, in such complex systems, where partners hold separate but
complementary sets of knowledge, the identification of forms of knowledge co-adaptation is
often knowable only to those physically and socially involved (Nelson & Winter, 1982).

9
Second, the frequent and serendipitous system improvements made over the course of
several periods of interaction are more immediately apparent for those directly involved in
the learning process and less apparent to outsiders. As Lane & Lubatkin (1998) explain, the
social complexity of the interaction between two parties increases their ‘relative absorptive
capacity’ and thus, although outsiders may eventually partner with either firm in the dyad,
they are unable to grasp, assimilate, or take advantage of such changes. In sum, supplier
performance gains associated with joint buyer supplier knowledge acquisition efforts are
more likely to be available to firms within that dyad than to outsiders.
Hypothesis 2: Joint buyer-supplier knowledge acquisition efforts more positively relate with a supplier’s relational performance than with its re-deployable performance.
Joint Knowledge Acquisition Efforts and Dyad-Specific Assets and Capabilities
Joint buyer-supplier knowledge acquisition efforts not only have a direct effect on a
supplier’s relational performance, but also positively relate to a supplier’s investments in
dyad-specific assets and capabilities, which in turn, further enhance supplier relational
performance. The first step of this mediating effect relates to abilities of buyers to influence
the supplier’s decisions to invest in assets and capabilities that complement those of the buyer
(von Hippel, 1988). In a way, a supplier’s investments in dyad-specific capabilities must be
guided by intimate interaction and decision making of both parties. Our logic is based on
suggestions by organization and economics scholars that parties are more likely to build a
tightly knit system when they more closely coordinate joint knowledge acquisition; this joint
effort helps them work out the complex ways in which their capabilities will evolve
symbiotically (March & Simon, 1958; Milgrom & Roberts, 1992; Simon, 2002).
As a case example, a large supplier firm we visited for this research had actively been
involved with a supplier development program, sponsored by one of its largest customers, for
the past 2 years. This buyer’s consultants and engineers had been visiting this firm and
working closely with its production and sales personnel to implement a more nimble JIT

10
system. As this joint workforce re-designed routines, they made specific recommendations
for the supplier’s investments in assets and capabilities, such as the development of more
appropriately designed storage bins, the separation of an exclusive loading dock and the
training and deployment of two exclusive account managers to more closely control the order
flows for this customer. Thus, the buyer-supplier team was able to pinpoint detailed ways in
which specific forms of investments and developments would benefit the greater
complementarity of the two firms. Given the above:
Hypothesis 3a: Joint buyer-supplier knowledge acquisition efforts positively associate with the degree to which a supplier’s investments in new assets and capabilities are dyad-specific.
Supplier Dyad Specific Assets and Capabilities, and Relational Performance
These dyad-specific assets and capabilities can have a further positive effect on relational
performance. The rationale is three pronged. First, one’s specific assets and capabilities are
known to have better fit with assets owned by the relationship partner, and as a result enable
the attainment of extra marginal performance which is unavailable to outsiders (Milgrom &
Roberts, 1992: 108). Second, when supplier’s assets are tailored to fit its complementary
buyer’s resources, suppliers face a situation of small numbers bargaining (Williamson, 1985)
whereby they are unable to easily find partners with capabilities that bear similar levels of
complementarity in the market. Indeed, scholars from the economics and strategy fields have
described how specific assets relate to performance gains unavailable in other partnerships
(e.g. Asanuma, 1989; Dyer, 1996; Milgrom & Roberts, 1992). For example, the geographical
proximity of immobile assets in successive production stages (what Williamson, 1985 refers
to as site specificity), leads to greater productivity because it enables reduced timing-
discrepancies in the interactions of information and product exchange (Dyer, 1996; Saxenian,
1994). Likewise, the degree to which partners tailor capital investments such as machinery,
tooling and dies to particular exchanges (what Williamson, 1985 refers to as physical

11
specificity), has been linked to greater inter-firm process integrity and quality (e.g Clark &
Fujimoto, 1991; Nishiguchi, 1994). Further, the degree to which know-how and routines are
partner specific (what Williamson, 1985 refers to as human specificity) also enables alliance
partners to coordinate communication and product exchange more effectively, thus helping
reduce costs and speed access to market (Dyer, 1996; Kogut & Zander, 1992).
Thirdly, specific resources and capabilities impose difficulties for a partnership outsider
to comprehend how such specificity associates to superior performance. Simon (1947; 2002)
explained that where partners’ assets are specific, they are intricately tangled. Such intricacy
is unique and important to the system’s performance outcome; because the intricate manner
in which relationship specific resources relate to one another, outsiders are less able to
comprehend the fit and role of dyad-specific assets and capabilities within a system. As a
result, they are less able to match the same complementary investments and obtain the same
performance enhancements. In sum, the degree of specificity of a given resource or capability
enhances the costs for re-deployability (Dierickx & Cool, 1989), thus impeding suppliers
from replicating equal performance levels with partners outside the focus dyad (Amit &
Schoemaker, 1993; Dyer & Singh, 1998; Perry, 1989):
Hypothesis 3b: A supplier’s dyad-specific assets and capabilities more positively associate with its relational performance than with its re-deployable performance.
Dyad-specific Assets and Capabilities and Alliance Governance Mechanisms
Another set of effects in the model relates to alliance governance mechanisms. As
suppliers increase their investments in dyad-specific assets, they are also likely to structure
alliance governance mechanisms more carefully; such mechanisms in turn relate to supplier
relational performance. We analyze each of these effects in turn. First, the choice to structure
given forms of alliance governance mechanisms is contingent upon previous choices of
attributes present in the transactions, such as the levels of asset specificity (Masten, Meehan,
& Snyder, 1991). This rationale stems from transaction cost (TCE) scholars, who establish

12
that specific assets trigger a threat of opportunism by unprincipled partners (Klein, Crawford,
& Alchian, 1978); such threats may materialize in the form of hold up, as such assets can
only be deployed in a second alternative use, at a substantial loss (Williamson, 1985). It is to
counter such threats that parties resort to structuring alliance governance mechanisms.
Based on the above rationale, we conjecture that the more suppliers invest in dyad-
specific assets and capabilities, the more they will rely on alliance relational governance
mechanisms. Relational governance mechanisms are defined as “informal agreements and
unwritten codes of conduct that powerfully affect the behaviors of firms when dealing with
other firms” (Baker, Gibbons, & Murphy, 2002: 39-40). Our focus on relational governance
mechanisms is not meant to deny the existence of other forms of agreements, such as formal
contracts or equity agreements which are also often used in close buyer-supplier agreements
(Dyer, 1997; Helper, 1991). We acknowledge such alliances may include several forms of
contracting concomitantly3. Indeed, recent literature testing “discriminating alignment” (e.g.
Leiblein, Reuer, & Dalsace, 2002; Silverman, Nickerson, & Freeman, 1997) suggest that
different governance choices (e.g. make vs. buy, equity vs. non-equity) are also likely to
enhance performance. However, given the greater complexities involved in the knowledge
transfer process, it becomes costly for parties to establish ex ante what they will do ex post
for all existing contingencies; as a consequence, such contracting mechanisms must also be
self enforced4. Thus, through tacit rules, buyers and suppliers rely mostly on ex post adaptive
negotiations as opposed to trying to specify a complete set of terms and conditions for all
future contingencies ex ante or even guarantee enforcement of ex post behavior by
establishing equity partnerships ex ante (Helper, 1991: 783). Our focus is consistent with
3 Whether relational governance “substitutes” or “complements” other forms of alliance mechanisms (e.g. formal contracts or equity agreements) is a topic reviewed in Poppo & Zenger (2002). 4 Theories of contractual self-enforcement posit that parties may honor unwritten agreements in order to preserve their reputation and avoid the termination of valuable, long term relationships (Axelrod, 1984: 124; Heide & Miner, 1992: 267). As parties continue transacting over time, social norms and trust will also tend to emerge and further support a collaborative orientation (Fichman & Levinthal, 1991).

13
Dyer & Singh’s (1998) relational view model which focuses on relational governance. Our
conjecture also parallels the thesis of Chung, Singh & Lee (2000), in which resource
complementarity serves as a basis for the formation of alliances.
In sum, as suppliers make greater investments in dyad-specific assets and capabilities,
they are more likely to rely on alliance relational governance mechanisms.
Hypothesis 4a: The degree to which a supplier’s assets and capabilities are dyad-specific positively associates with the relational content of their buyer-supplier alliance. The alliance relational content identified above, in turn, positively relates to higher
relational performance. This effect can be explained by both the ‘coordination’ and the
‘transaction costs’ logics. The former explains that relational alliance mechanisms affect the
efficiency with which parties mutually coordinate their interdependent systems (Gulati &
Singh, 1998; Lorenzoni & Liparini, 1999; Thompson, 1967). The second logic explains that
through relational governance parties also observe a lower likelihood that one will
opportunistically hold up the other (Masten, 1996; Williamson, 1985), for example by cutting
back on product deliveries (Noordewier, John, & Nevin, 1990).
Three particular forms of relational governance mechanisms help suppliers achieve
greater levels of relational performance. First, based on commitments for extensive
information exchange, especially on market demand conditions, parties are able to more
accurately track the expectations of each other (Van de Ven & Walker, 1984). As a result,
they can size up the need for inventory provisions against demand contingencies the two
agree are more likely to happen, thus helping parties reduce the costs of coordination.
Moreover, as parties voice their concerns over the problems that arise, they are more likely to
resolve their differences and avoid ex post negotiation hazards (Helper, 1991). Second, based
on commitments for mutual assistance, parties prevent unwanted supply interruptions or even
react quicker to avert major losses when disruptions inadvertently occur (e.g. production line
breakdowns). Thus, such commitments help firms enhance the reliability of each part of the
14
system (Milgrom & Roberts, 1992). Moreover, the attitude of assistance also creates an
environment that is more conducive to future cooperation (Kale et al., 2000). Third, based on
commitments for reciprocity, partners more effectively coordinate when and how to draw on
each other’s resources, contribute resources to the relationship (Asanuma, 1989; Kotabe et
al., 2003), and leverage their complementary capability sets according to shared expectations
of industry conditions (Dyer & Nobeoka, 2000: 360). As with specific assets, relational
governance is partnership specific, and thus is more likely to associate with relational
performance than with re-deployable performance. Thus:
Hypothesis 4b: Buyer supplier relational governance more positively associates with a supplier’s relational performance than with its re-deployable performance.
DATA AND METHODS
We tested our hypotheses on a sample of vendors supplying recurrently purchased parts to
equipment manufacturers (i.e. makers of farm, construction, and industrial tractors). This
industry has been subject to a special set of common trends and pressures that make firms
adopt advanced production systems and invest in learning partnerships. These trends include
higher competition and cost pressures due to industry overcapacity (Bossong Martinez, 2000)
and customer inclinations to buy less on impulse and more on cost-benefit trade-offs (Menes,
2000). We also have evidence of increasing investments in supplier development programs,
as demonstrated by public statements of large buyers (e.g.Nelson, 2001; Siekman, 1999) or
even by research conducted in the automotive industry, known to also invest in supplier
development efforts and rely on the same supplier base (e.g. Dyer & Nobeoka, 2000).
Moreover, our preliminary field work confirmed that several of the suppliers to be surveyed
aggressively boasted their constant investment in capabilities upgrading.
Research Design and Data Collection
Data on inter organizational processes and knowledge acquisition are often difficult to
obtain. While some scholars have been able to gauge knowledge transfer through explicit

15
measures, such as counts of cross patent citations (e.g. Mowery, Oxley & Silverman, 1996;
1998), our study requires measures and data collection processes that allows us to handle the
team-based and hard-to-identify nature of the knowledge involved. As such, we follow the
lead of Dyer (1996; 2003) and McEvily & Zaheer (1999), who developed research work that
is more akin to ours, and collect data with a survey instrument. In our survey, we mostly
followed prescriptions by Dillman (2000). We first developed a questionnaire by identifying
construct items used in previous literature. We then obtained the help of other academics and
managers to develop items where the literature was missing, to refine survey wording and to
check overall validity of questions vis-à-vis the industry environment.
We compiled a mailing list of approximately 900 suppliers from the largest equipment
manufacturers. Following the advice from operations management scholars we consulted, we
selected a sample of supplier firms with like production activities, in order to ensure
comparability of performance. Specifically, we selected approximately 500 firms producing
goods that involve machining, stamping, or cutting of basic material (e.g. sheet metal), and
assembly of a component. Our response rate was just above 50%, yielding 253 responses.
To minimize key-informant bias we surveyed the most knowledgeable informant (Kumar
et al, 1993). Here, we contacted each supplier by phone, prior to sending the survey, and
identified the manager who, according to indications, would be most knowledgeable about
their relationships with their customer in this industry group, as well as production related
information. One may query the use of single informants as to whether they have sufficient
knowledge and ability to assess the collective orientation of the supplier towards the buyer.
Though responses from multiple informants may have been preferred (at a cost of a much
smaller sample), we believe that our informants are well positioned to make the assessment
asked of them for the following reasons. First, key informants have been employed at their
respective organizations for an average of 12 years; they also had a long history of working in
16
their current position. These individuals had primary responsibility for managing the day-to-
day relationship with the customer, and were well aware of the history of interactions
between their and their buyer’s employees. Further, for 40 suppliers, we surveyed a second
top executive, separately from the key informant, to evaluate inter-rater reliability (see Dyer,
2003, for similar treatment). The degree of similarity across the responses was remarkable.
Rarely did we find the responses to vary by more than one point. Thus, we believe the key
informant responses do represent the overall orientation of supplier firms in a reliable way.
In the survey, asked respondents to qualify the past three years of their relationship to
avoid biased responses due to abnormal experiences (see Artz & Brush, 2000 for similar
treatment). We also assessed non-respondent bias by t-test comparing early with late
respondents (Armstrong & Overton, 1977). We found no significant differences. Lastly, we
asked respondents to assess relationship and performance characteristics related to “this”
customer, defined as “a customer the respondent was most knowledgeable about”. In case the
supplier serviced multiple facilities of “this” customer and / or serviced “this” customer with
multiple products, the respondent was to answer the questions relative to the facility and
product-family that were most representative for her business. If the respondent’s company
had multiple divisions, we asked her to refer to the division she was a manager of. We also
asked respondents to indicate performances of her firm with another “average” customer,
defined as “a customer that is representative of the supplier’s average performance”.
We performed Harman’s single factor test (Harman, 1967); here, if a significant amount of
common method bias (CMB) exists in the data, then a factor analysis of all the variables in
the model will generate a single factor that accounts for most of the variance. Unrotated
factor analysis using the eigenvalue-greater-than-one criterion revealed that the first factor
explains 17.1% of the variance in the data. We thus conclude our data is not subject to CMB.
Measures

17
Multi-item constructs below were measured through a 5-point Likert scale, where 1
represents ‘not at all’, and 5, ‘to a large degree’. Appendix 1 lists our survey questions.
Supplier knowledge acquisition efforts. Our multi-item scale measures the degree to
which suppliers had “invested” or “participated” in any of a series of knowledge acquisition
programs listed. Based on literature searches (e.g. Liker, 1996; Ohno, 1988) and interviews
with managers, we inventoried several programs associated with the acquisition of team-
based capabilities, such as kaizen (i.e. constant improvement techniques), lot-size
optimization, machinery and plant set-up techniques as well as total quality management.
Joint buyer-supplier knowledge acquisition efforts. We measured the degree to which
suppliers had “invested” or “participated” in any of the above listed knowledge acquisition
programs where “this” buyer had “direct participation”. We defined ‘direct participation’ as
this buyer having taught, or consulted (e.g. buyer’s personnel teach supplier’s personnel), or
co-participated (e.g. teams of from both companies join efforts in a given training program).
Supplier dyad-specific assets and capabilities. Our multi-item scale identifies the degree
to which the supplier has invested in new or modified existing capabilities (e.g. order taking,
production processes) and physical assets (e.g. production equipment, new facilities)
primarily to serve the unique needs of this customer. We based these construct items on
previous work by Artz & Brush (2000) who captured dimensions related not only to physical
assets but also to personnel and routines which were specialized to the focal partner.
Buyer-supplier relational governance. We measure the degree to which partners rely on
social commitments of collaboration as gauged by their efforts to share information, assist
each other and promote fair sharing of cost savings and benefits arising out of joint efforts.
The two first survey items were adapted from Heide & John (1992), Noordewier, et al.
(1990) and Artz & Brush (2000). The third was adapted from Ring and Van de Ven (1992).

18
Supplier performance. As we model the production efficiencies arising from the
acquisition of complex production know-how, we turn to research done by scholars working
closely with the implementation of such production systems for measures (Boyer et al., 1997;
De Meyer & Ferdows, 1985; Ferdows et al., 1986; Miller & Vollmann, 1884; Ward et al.,
1995). According to these scholars, measures of inventory turn over and effectiveness in
delivering goods on a timely manner can capture such performance dimensions. Thus, we
measure “the number of inventory turns to support 12 months of sales” and “the percentage
of goods delivered on time”. The choice of these measures is consistent with those by other
strategy scholars working with buyer-supplier relations (e.g. Dyer & Nobeoka, 2000; Kotabe
et al, 2003). For re-deployable performance (the performance suppliers are usually able to
replicate across customers) we used the respondents input for performance they achieve with
an “average” customer. For relational performance we subtracted the performance a supplier
obtained with an “average” customer from that it obtained with “this” customer. This
conceptualization is consistent with our definition of relational performance presented earlier
as well as with the concept of “relational rent” as presented in Dyer & Singh’s (1998)
relational view. For example, where respondents indicated that the inventory necessary to
support sales to “this” customer turned 18 times a year, and the inventory for average
customers turned 11, then relational inventory performance was 7 turns (i.e. 18 minus 11).
We did the same for timely delivery (e.g. 99% of goods delivered on time for a given
customer, versus 92% of goods delivered on time for another average customer resulted in a
7% relational performance in timely delivery). Our analysis of construct validity suggests that
the two performance dimensions (i.e. inventory turns and timely delivery) measure the same
underlying construct, production performance, and we therefore factored them together.
Control variables. While we are interested in developing a parsimonious model, we are
also aware that other alternative factors may influence supplier performance. Thus, we

19
include control variables to ensure results are not unjustifiably influenced by these factors.
First we control for supplier firm size. Because larger firms have larger resource pools, and
the consequent ability to compete more effectively, the performance gains we observe may be
explained by such asset endowment, as opposed to the mechanisms we model. We measure
firm size as the log of 3-year average yearly revenue. A second possible confounding effect
relates to the importance the business of the specified customer has for the supplier. The more
relevant the customer is for the supplier, the more likely the supplier may be eager to hold on
to relationship loyalty in being more responsive to one customer vis-à-vis others; thus we
believe relational performance could arise out of necessity. We measure importance of
customer as a ratio of the 3 year average supplier sales to the specified customer to total sales.
Another variable which could explain preferred treatment by suppliers to a given buyer
relates to the competitive pressure of the market place. If a supplier faces stiff competition in
selling to a given customer but not in selling to others, it could establish internal decisions
that would lead to preferred performance enhancements regardless of it developing dyad-
specific capabilities. Thus, we control for the log number of ‘direct competitors’, defined as
suppliers selling the same products to the same OEM customer.
Structural Equation Method
We performed a structural equation analysis (SEM), which, by definition, is a hybrid of
factor and path analysis. Our preference for SEM as opposed to other methods, such as
multiple-regression, results from 3 specific traits of our research design. First, most of our
measures are multi-item; because SEM integrates factor analysis in the computations, the
measurement error of these multi-item constructs are incorporated in the model, enabling one
to obtain unbiased parameter estimates (Anderson & Gerbing, 1988; Bentler, 1989). Second,
SEM simultaneously tests the fit of an integrated set of dependence links, as opposed to
testing coefficients in individual equations. This allows us to test the fit of alternative model

20
configurations. Third, SEM allows for the testing of the reciprocal (causality) structure of
covariances (Berry, 1984; Frone et al., 1994; Wong et al., 1999), as we do below.
To implement our SEM, we followed Anderson & Gerbing’s (1988) two step approach. In
the first stage – the measurement model – we used confirmatory factor analysis. The goal
here is to obtain an acceptable fit to the data (Anderson & Gerbing, 1988; Bentler, 1989;
Joreskog & Sorbom, 1989). For convergent (i.e., whether items are fairly correlated with one
another) and discriminant (i.e., whether items across constructs clearly measure different
constructs) validities, we examined values from the correlation matrix, in Table 1. Here, we
observe that all values greater than 0.56 involve intra factor correlations, while inter factor
correlations do not surpass the 0.36 level. We thus believe we have initial evidence of good
convergent and discriminant validities. Additionally, for convergent validity, we computed t-
tests for factor loadings (Anderson & Gerbing, 1988); we kept indicators for which loadings
were greater than twice their standard errors (see Table 2). Also, for discriminant validity, we
performed chi-square difference tests for constrained and unconstrained models. The
constrained model sets the correlation between two constructs equal to one; a significantly
lower chi-square for the unconstrained model supports the discriminant validity criterion. As
shown in Table 3, all constructs exhibit satisfactory discriminant validity.
In the second stage of SEM, we compute the structural model, based on the measurement
model found in the first stage. Here, inter factor correlations are estimated for all factors,
making this an oblique, rather than an orthogonal analysis. As such, we specified given
associations between constructs, as hypothesized in our theoretical model, and assessed the
overall goodness of fit. To test the hypotheses, we used the maximum likelihood estimation
procedure, often preferred in management and social sciences studies (Ping, 1996).
Most of our hypotheses represent a comparison between the coefficients for two separate
paths (i.e. hypothesis 1, 2, 3a, 3b, and 4b). Thus, our testing required constraining each pair

21
of paths noted in the hypothesis statement to be equal (Bentler, 1995) and comparing each
model with the theoretical model (Satorra, 1989). In such a test (Table 6), a significant
increase in chi-square implies the constraint is invalid and the path coefficients are
significantly different. Comparing the signs and magnitudes of coefficients in which the chi-
square increased significantly, then, indicates support or lack of support for these hypotheses.
<<Insert Figure 2; Tables 1, 2, 3, 4, 5, 6, and 7 about here>>
RESULTS and DISCUSSION
In Table 5, we look at various fit indices to test our measurement model (model 1). The
first index, chi-square statistic (χ2), tests the correspondence between the model and the
underlying data. Though a non significant χ2 value is desirable to indicate the model is not
significantly different from the underlying data, we observe that our chi-square is significant
(χ2 = 233.947; p < 0.002). Following Joreskog & Sorbom (1989), we treat this chi-square
simply as a general goodness of fit index, but not a statistical test in the strictest sense.
Instead, we supplement the chi-square analysis with 5 other goodness of fit indices: GFI,
NFI, NNFI, CFI, and RMSEA.5 A commonly accepted rule of thumb is that the first four fit
indices should be greater than 0.90, whereas RMSEA should be below 0.05 (Hatcher, 1998).
As seen in Table 5, all fit indices are within the expected range. Thus, we accept model 1.
In regards to our theoretical model (model 2), our chi-square difference test indicated no
significant differences vis-à-vis the measurement model (∆χ2 = 22.44, ∆df = 8, p > 0.1). We
hence accepted the theoretical model as the most parsimonious (Anderson & Gerbing, 1988).
All other goodness-of-fit indices indicate model 2 is indeed acceptable (Table 5). 5 The GFI indicates the relative amount of variance and covariance jointly explained by the model. The NFI AND NNFI (Bentler & Bonnett, 1980) are defined as “the percentage of observed-measure covariation explained by a given measurement or structural model … that solely accounts for the observed measure variances” (Anderson & Gerbing, 1988: 421). The NNFI is often viewed as a superior variation of the Bentler & Bonnett’s (1980) normed fit index (NFI) since it has been shown to be more robust in reflecting model fit regardless of sample size (Anderson & Gerbing, 1988; Bentler, 1989). The last index, Bentler’s (1989) CFI, is similar to the NNFI in that it provides an accurate assessment of fit regardless of sample size. The CFI tends to be more precise than the NNIF however in describing comparative model fit as it corrects for small sample size by subtracting the degrees of freedom from their corresponding χ2 values (Bentler, 1989).

22
Results of hypotheses tests
Our findings, shown in Table 4, column D, are as follows. Hypothesis 1 (i.e. suppliers’
knowledge acquisition efforts positively associate with their re-deployable performance more
than with their relational performance), is strongly supported. The path coefficient between
knowledge acquisition and re-deployable performance is positive and statistically significant
(PF1F5 = 0.185, t = 3.528, p < 0.001), whereas the one between knowledge acquisition and
relational performance is negative, and statistically not significant (PF1F6 = -0.041; t = -
0.748; p > 01). As shown in table 6, the significant increase in chi-square (∆χ2 = 18.972, ∆df
= 1, p < 0.001) indicates that the path coefficients are significantly different, whereas the
signs and magnitudes of the respective coefficients indicate that suppliers’ knowledge
acquisition efforts more positively associate with re-deployable performance.
Hypothesis 2 (i.e. joint knowledge acquisition efforts positively associate with supplier’s
relational performance more than with its re-deployable performance), is not supported. The
path between joint knowledge acquisition and re-deployable performance is positive but
statistically not significant (PF2F5 = 0.0.028, t = 0.545, p > 0.1), while the link between joint
knowledge acquisition and relational performance is positive and statistically significant
(PF2F6 = 0.110; t = 2.218; p < 0.001). Though the magnitudes of these coefficients are as
expected, and would seem to indicate a support for hypothesis 2, results from table 6 indicate
the path coefficients are not statistically different (∆χ2 = 1.586, ∆df = 1, p > 0.1).
Hypothesis 3a (i.e. joint buyer supplier knowledge acquisition efforts more positively
associate with supplier dyad specific assets and capabilities than does suppliers’ knowledge
acquisition efforts) is supported. The path coefficient between suppliers’ knowledge
acquisition and dyad specific assets and capabilities is negative and statistically not
significant (PF1F3 = -0.0022, t = -0.412, p > 0.1), whereas the association between joint
buyer supplier knowledge acquisition and specific assets and capabilities is positive and

23
statistically significant (PF2F3 = 0.194; t = 3.092; p < 0.001). The signs and magnitudes of
these coefficients indicate a support for hypothesis 3a, whereas the significant increase in chi-
square, shown in Table 6 (∆χ2 = 14.228, ∆df = 1, p < 0.001) confirms our claim.
Hypothesis 3b (i.e. a supplier’s dyad specific assets and capabilities associate more
positively with its relational performance than with its re-deployable performance), is
strongly supported. The path coefficient between specific assets and capabilities and re-
deployable performance is negative and statistically not significant (PF3F5 = -0.022, t = -
0.412, p > 0.1), whereas that with relational performance is positive and statistically
significant (PF3F6 = 0.262; t = 4.498; p < 0.001). The signs and magnitudes of these
coefficients indicate a support for hypothesis 3b, whereas the significant increase in chi-
square, shown in Table 6 (∆χ2 = 24.221, ∆df = 1, p < 0.001) confirms our claim.
Hypothesis 4a (i.e. supplier’s dyad specific assets and capabilities associates positively
with buyer supplier relational governance mechanisms), is strongly supported. The path
coefficient is positive and statistically significant (PF3F4 = 0.177, t = 2.859, p < 0.001).
Hypothesis 4b (i.e. buyer supplier relational governance associate more positively with
relational performance than with re-deployable performance), is strongly supported. The path
coefficient between relational governance and re-deployable performance is negative and
statistically not significant (PF4F5 = -0.035, t = -0.645, p > 0.1), whereas the association
between relational governance and relational performance is positive and statistically
significant (PF4F6 = 0.209; t = 3.499; p < 0.001). The signs and magnitudes of these
coefficients indicate a support for hypothesis 3b, whereas the significant increase in chi-
square, shown in Table 6 (∆χ2 = 18.07, ∆df = 1, p < 0.001) confirms our claim.
Lastly, we found only partial support for the predicted relationships with control variables.
As indicated in table 5, firm size – though it seems to have marginal correlations with both
re-deployable and relational performances (see Table 1) – does not help explain any form of

24
performance in the structural equation model (PF7F5 = 0.038, p>0.10; and PF7F6 = 0.044,
p>0.10). Importance of customer, on the other hand, does seem to play a significant role in
explaining relational performance (PF8F6 = 0.143, p<0.01). Here, the larger the proportion of
total sales going to “this” customer, the more does the supplier seem to confer preferred
treatment to this particular customer. Importance of customer, however, has no association
with re-deployable performance (PF8F5 = -.077, p>0.10). As far as competitive pressure is
concerned, it has a positive and significant impact on re-deployable performance, as expected
(PF9F5 = 0.176, p<0.001). However, unexpectedly it has a negative and significant effect on
relational performance (PF9F6 = -0.135, p<0.01). It appears that the larger the competitive
pressure, the greater a supplier’s re-deployable performance; this higher competitive pressure
however also seems to deteriorate relational performance.
From the Theoretical to the Best Model
As a last step in developing our model, we follow Anderson & Gerbing (1988) and trim
off insignificant parameters estimates to obtain a most constrained version of the theoretical
model. We refer to this model as our best model. Based on the marginal significance cutoff of
p<0.10, and z-statistic of 1.645, we dropped several paths, as shown in Table 4, column E.
We however retain paths involving control variables even if their coefficients were
insignificant. In Table 5, we see that our best model gains 4 degrees of freedom vis-à-vis the
theoretical model, while the increase in chi-square is insignificant.
Testing reciprocal relations
SEM has become a common technique to test the reciprocal (i.e. causal) relations between
two constructs using cross-sectional data in management research (Wong & Law, 1999: 69).
On the one hand, using longitudinal models is often argued to be more appropriate to test
reciprocal relations since ‘causes antecede effects’ (Cook et al., 1979: 10; Organ et al., 1991:
43). However, from a pragmatic point of view, using SEM analysis with cross-sectional data
25
is preferable in circumstances when one has difficulties in determining cause-effect time lags,
or even finding true time-lagged data (Frone et al., 1994; Wong et al., 1999: 69-71).
With the availability of SEM, one can test if two constructs are reciprocally related by
analyzing the observed covariance structure against a prespecified non recursive causal
model, using cross sectional data (Berry, 1984; Frone et al., 1994; Wong et al., 1999; James
et al., 1978). Wong & Law (1999) studied the reliability of this methodology, i.e. they
empirically analyzed the chances of one erroneously identifying relationships among
constructs to be either unidirectional, reverse, or reciprocal, when they are not. By comparing
a SEM cross-sectional model with a true time lagged model, Wong & Law showed that the
above methodology results in parameter estimates which are a good proxy for the true time-
lagged effects with a reliability of p < 0.05. They identified three conditions for such
nonrecursive SEM models to be reliable proxies for true time lagged models. First, the time
lag between the occurrences of the two effects should be short. With longer effect delay,
SEM cross-sectional models will be less effective in computing reciprocal relations. Second,
the model has to be identified; specifically, reciprocal relations can only be computed for
endogenous variables, which are themselves affected by two different instrumental variables.
In this case, an independent variable for one of the reciprocal constructs cannot
simultaneously explain the other reciprocal construct. If such is not the case, parameters have
no unique solutions, and their interpretation becomes meaningless (Wong & Law, 1999: 71;
Berry, 1984). Third, to reduce the possibility that instrumental variables affect the relative
size of disturbance terms of reciprocal constructs, a covariance path between such
disturbance terms is to be included (Wong & Law, 1999: 71; Frone et al, 1994).
We applied the above methodology to our study, to test the directionality proposed in our
theory. To ensure we had endogenous variables in each of our reciprocal analyses, we
26
switched the place of firm size across the model. Because this variable was already included
in all models tested previously, our reciprocal analyses were based on nested models.
In Table 7, the relation between knowledge acquisition efforts (F1) and re-deployable
performance (F5) is significant from F1 to F5, but not significant from F5 to F1. Thus, we
conclude that the relationship is unidirectional, from F1 (knowledge acquisition efforts) to F5
(re-deployable performance). Applying the same logic to the other relationships in Table 7,
we find that almost all relationships are unidirectional, with the causality as theorized in our
hypotheses. The exception here involves the association between supplier dyad specific
assets and capabilities (F3) and relational performance (F6), as well as the association
between supplier dyad specific assets and capabilities (F3) and relational governance (F4).
These relationships seem to be reciprocal, in that F3 causes F6 and in return F6 causes F3,
while F3 causes F4 and in return F4 causes F3.
Testing an interpreting an alternative model
Because SEM provides information regarding the fit of a proposed model but cannot
determine if that model is the “correct” one, we examine an alternative model. Specifically,
we explore the moderating, as opposed to the mediating, effects of (a) supplier dyad specific
assets and capabilities and (b) buyer supplier relational governance mechanisms, on the
association between joint buyer supplier knowledge acquisition efforts and relational
performance.6 Though our logic above clearly implies a mediating effect, we refer to the
work of Baron & Kenny (1986) to inquire whether these could be in fact moderating effect.
6 Analyses of latent variable interactions are not common in strategy studies and only recently have they been adopted in marketing and psychology (see Bollen & Curran, 2005 for a review). Here, we use Ping’s (1995; 1996) techniques for interaction terms with a single indicant. The single indicant for two factors X and Y, with respective indicants as x1, x2 and y1, y2, is computed as X:Y = (x1 + x2)(y1 + y2). In such case, Ping proposes that the loadings and errors for X:Y be given respectively by λx:y = (λx1 + λx2)(λy1 + λy2) and θεx:y = (λx1 + λx2)2 Var(X)(θεy1 + θεy2) + (λz1 + λz2)2 Var(Y)(θεx1 + θεx2) + (θεx1 + θεx2)(θεy1 + θεy2). As far as specification of the measurement model is concerned, based on Anderson & Gerbing (1988: 418), Ping (1995: 339) indicates that the unidimensionality of X and Y enables the omission of the nonlinear latent variables from the linear-terms-only measurement model. Because X and Y are each unidimensional, their indicants are unaffected by the presence or absence of other latent variables in a measurement or structural model. Stated differently, this provides similar measurement parameter estimates between measurement and structural models.
27
Specifically, using the terminology of Baron & Kenny (1986: pp1173), it is possible that the
factors above partition relational performance into subgroups that establish its domains of
maximal effectiveness. If such is the case, then the effect from joint buyer supplier
knowledge acquisition efforts to relational governance would become stronger, the more
suppliers invest in specific assets and capabilities and structure relational governance.
To contrast the moderating and mediating theoretical models we use the Akaike
Information Criteria (AIC), the Browne-Cudeck Criteria (BCC) and the Bayes Information
Criteria (BIC). Lower indices are preferred.7 In Table 5 the alternative (i.e. moderating)
model is inferior to the best (i.e. mediating) model across all three indices. Specifically,
∆AIC, ∆BCC, and ∆BIC from the best to the alternative model are all positive (886.2; 890.1;
114.6 respectively); these results indicate that the mediating model is the best representation
of the phenomenon under study. The alternative moderating model’s fit indices also support
our conclusion for its inferiority; all fit indices (GFI, NFI, NNFI, and CFI) are below our 0.90
threshold, whereas RMSEA is well above 0.05. Lastly, in Table 4, column F, the parameters
of moderating effects are statistically not significant.
What results mean
Our results highlight important aspects of buyer supplier knowledge transfer interfaces.
First, from hypothesis 1, we know that trained suppliers outperform untrained ones. As this
comparison contrasts average performances, we conclude that a significant portion of the
knowledge transferred permeates to the supplier’s average performance. This implies that
7 The AIC can be said to represent an operational way of trading off the complexity of an estimated model against how well the model fits the data (Akaike, 1987). Another measure with a similar intent, the BCC is known to impose a slightly greater penalty for model complexity than does the AIC (Browne & Cudeck, 1993). In comparison to AIC and BCC, the BIC assigns a greater penalty to model complexity, and so has a greater tendency to pick parsimonious models (see Raftery, 1995; Schwartz, 1978 for reviews).
Here, we avoid comparisons through chi-square statistics since our alternative model is non nested. The non nested nature of our model arises from our implementing Ping’s interaction term procedure (1995, 1996), which, as explained above, creates a new single-indicant variable from two other factors.

28
average customers outside of the learning dyad benefit from partnerships with supplier. We
can thus infer that cream off approaches do add value. Buyers who do not invest in supplier
training can free ride on knowledge acquired by suppliers from other sources.
Second, from hypothesis 2, we find that joint buyer supplier knowledge acquisition efforts
per se do not seem to improve a supplier’s relational performance more than it improves that
supplier’s re-deployable performance. However, as we integrate a full analysis of other
factors (Hypotheses 3a, 3b, 4a, and 4b), as well as an analysis of moderating vis-à-vis
mediating effects, we can see that not all knowledge transferred to suppliers translates into
superior supplier’s average performance. Instead, some of this knowledge yields performance
gains which are exclusive to the learning partnership. Specifically, based on our analyses of
hypotheses 3b and 4b, it appears that (a) supplier dyad specific assets and capabilities and (b)
buyer supplier relational governance mechanisms have a significant effect in generating
performance gains which are exclusive to the learning alliance, i.e. relational performance.
Moreover, based on analyses of hypotheses 3a and 4a, it is also clear that joint knowledge
acquisition efforts affect these two generators of relational performance.
The system of hypotheses above implies a mediation effect of (a) specific assets and (b)
relational governance on the association between joint knowledge acquisition and relational
performance. Our testing the alternative moderating model allows us to ascertain the
appropriateness of our mediating framework. Specifically, our analysis of the alternative
model shows that the factors (a) and (b) above really mediate the association between joint
knowledge acquisition and relational performance. This representation of how the constructs
interact to produce relational performance can be interpreted using Baron & Kenny’s
terminology (1986: 1173). Specifically, in vertical alliance knowledge transfer contexts, it
seems that both (a) supplier dyad specific assets and capabilities and (b) buyer supplier
relational governance mechanisms function less as mechanisms that partition the effect of

29
joint buyer supplier knowledge acquisition onto relational performance into subgroups of
higher and lower outcomes; instead, they function more as direct generative mechanisms of
relational performance changes. In sum, maximizing relational performance from joint buyer
supplier knowledge acquisition efforts seems to involve the mediation effects of relationship
specific assets and capabilities, and relational governance mechanisms
CONCLUSION
In this paper we investigate the extent to which knowledge acquisition processes enable
a firm’s relational (i.e. learning-partnership exclusive) and re-deployable (i.e. replicable with
other average customers) performance enhancements. By integrating theoretical elements
from the resource-based and relational views, our model formulates propositions in the
context of buyer-supplier exchanges. Beginning with the resource-based logic, we argue that
suppliers acquiring tacit, team-based capabilities attain competitive advantages vis-à-vis
rivals which do not acquire those capabilities. We also argue that a significant portion of
these acquired capabilities are re-deployable; as such, the supplier attains improvements in its
overall average performance. Then, following with the relational view, we explain that
suppliers can further attain relational performance, i.e. performance enhancements that are
above their average performance levels, but which are learning-partnership exclusive. We
theorize that relational performance is a function of the mediating effects of (a) suppliers’
dyad specific assets and capabilities and (b) alliance relational governance mechanisms, on
the association between joint buyer supplier knowledge acquisition efforts and relational
performance. Our empirical examination confirms the effects of our constructs on both re-
deployable and relational performances; moreover, an extended analysis of alternative
models confirms the mediating effects of asset specificity and relational governance between
joint knowledge acquisition and relational performance.

30
Theoretically and empirically, our approach represents a significant departure from
previous literature. First, our research illustrates the usefulness of the resource-based and
relational views for strategy research. Though controversy remains as to whether the
relational view is a different theory or just an extension vis-à-vis the RBV (e.g. Dyer &
Singh, 1998; Molina, 1999), even if it is just an extension, we believe that both the RBV and
relational view perspectives offer distinct, yet complementary contributions, and where
combined, allow for richer analysis of competitive advantages than it appears at first.
Specifically, the RBV helps us trace firm performance advantages back to firm-level tacit,
team-based capabilities, as confirmed by empirical analysis of hypothesis 1. However, an
exclusive focus on the RBV keeps us from understanding performance gains which
materialize exclusively within the learning alliance. By modeling learning alliances through
the relational view, our research identifies and empirically confirms that three factors
associate with partnership exclusive performance enhancements: (a) joint knowledge
acquisition, (b) suppliers’ investments in dyad-specific assets and capabilities, and (c) buyer-
supplier alliance relational governance. Our testing alternative moderating and mediating
models confirms that (b) and (c) above seem to mediate the effect of joint knowledge
acquisition onto relational performance. In sum, our model highlights that while the RBV
helps establish the fundamental link between a supplier’s advantages from its valuable yet
costly to imitate assets and capabilities, the relational view suggests how portions of those
advantages are interlocked within a particular symbiotic relationship with a focus customer.
Further, we also believe our research informs the knowledge management literature. While
much of the scholarly debate thus far has focused on spillover prevention factors (e.g. firms
should focus on acquiring ‘tacit’, as opposed to ‘explicit’ knowledge), little has been
investigated about re-deployability prevention factors. The tension between spillover and re-
deployability is an important one, and can be traced back to previous alliance knowledge

31
transfer literature (e.g. Hamel, 1991 and more recently, Dyer & Nobeoka, 2000; Kale et al,
2000). Re-deployability helps erode appropriability advantages for training buyers, and thus
must be taken into consideration to the same degree of importance to which tacitness is
concerned. We acknowledge the contribution of current literature as it outlines mechanisms
and factors related to transferring tacit knowledge faster than this knowledge spills over in
undesired ways to benefit competitors. Here, we add to this literature to explain the factors
involved in locking the knowledge acquired and resulting performance gains within the
learning alliance. The factors helping prevent re-deployability have in part been explored in
previous research. For example Lorenzoni & Liparini (1999) explain that a firm’s relational
capabilities – i.e. its ability to interact with other firms – accelerates this firm’s knowledge
access and transfer with relevant effects on company growth and innovativeness. Moreover,
Dyer (1996) explored the link between dyad specific assets and capabilities and superior
performance. Our work integrates both firm and inter-firm perspectives on these factors to
explain the mediating effects within the context of joint inter firm knowledge acquisition
efforts. As such, we identify circumstances when dyad partners are more likely to develop
partnership exclusive capabilities and advantages.
Our research also represents an empirical supplement to previous research on knowledge
transfer alliances. Specifically, previous scholars have established a primary focus on linking
various factors which antecede knowledge transfer (such as knowledge ambiguity, as in
Simonin, 1999; tacitness and knowledge complexity, as in Khanna, et al, 1998; Kotabe et al,
2003; Mowery et al, 1996; partner relational capital, as in Kale, et al, 2000). Thus, these
studies have often relied on dependent variables that highlight the effectiveness of the
learning processes (e.g. Simonin, 1999) or performance improvements of trained suppliers
(e.g. Kotabe et al, 2003). We acknowledge the importance of these studies, and supplement
this literature by also investigating performance advantages that are exclusive to learning

32
partnerships. Specifically, by explicitly measuring performance gains while controlling for
the portion of such gains which firms can re-deploy across an ‘average’ partner base, our
findings illustrate the circumstances under which learning alliances create advantages not
only for trained firms, but also for their training partners. Moreover, we hope our applying
SEM techniques for testing moderating and reciprocal relations will help other strategy
scholars understand and leverage their usefulness in future research.
As far as managerial practice is concerned, we believe our model and empirical results
offer a useful picture about the strength of alternative approaches to supplier development.
Referring back to our Deere example, it appears that both ‘cream off’ and ‘supplier
development’ approaches seem to have different, yet complementary forms of pay off.
Through cream off approaches buyers can access performance gains from suppliers that re-
deploy improvements arising out of knowledge acquisition from other sources. Through
supplier development, buyers attain from their suppliers performance gains which are
superior to these suppliers’ average (re-deployable) performance, and which are learning
partnership exclusive. It is clear the effects are not substitutes. Lastly, because our model
highlights the anteceding factors of relational performance, it informs practitioners about
important factors leading to sustainability of supply chain advantages.
Our findings also bring implications for public policy. Specifically, in the competitive race
to benchmark the latest capabilities, competitors are at least likely to try and free ride a more
knowledgeable supplier base without paying for its development costs (Sako, 1999: 115).
Because knowledge transfers are known to be costly for both source and recipient firms
(Szulanski, 1996), “re-deployability” can actually become a potent drain of resources, as
opposed to a source of competitive advantages. Thus, where training-firms are unable to
attain advantages from their knowledge transfer programs, the spread of production
capabilities across industries may suffer from a problem of market failure (Sako, 1999); this

33
failure occurs as the incentives for individual firms to provide such knowledge-transfer would
tend to zero, as knowledge becomes a free-good. As Teece (1987) and Sako (1999) indicate,
where such zero incentive exists, government agencies may be required to provide such basic
training. Both government and firms have separate yet complementary roles in industrial
development as they spread valuable management and production skill across industries.
Limitations and directions for future research
Despite our contributions, our work raises further questions. First, our study is limited to
an analysis of suppliers’ asset investments and relational mechanisms; it thus may have
missed the effects of buyers’ complementary asset investments. Moreover, though relational
performance implies a positive outcome for buyers’ knowledge transfer programs, it is
unclear whether financial investments in such programs receive their due capital return. If the
relational performance earned by training-firms is less than their capital investments justifies,
all buyers would be better off simply creaming-off supplier markets, treating knowledge as a
public good, and expecting government agencies to invest in spreading best practices. Thus,
future research needs to better integrate these dyad and financial perspectives.
Our analysis of reciprocal relations assumes that cause and effect occur close to one
another in time. Because this assumptions is easier to make and harder to prove (Wong &
Law, 1999), the probability we incurred in error Type I (i.e. concluded for the unidirectional
causality, when we in fact have a reciprocal association), may be greater than p < 0.05. Future
research has to confirm our causal predictions with panel data.
Despite the growing attention scholars have given to understanding alliance knowledge
transfer processes, research has devoted little attention to the tension between knowledge
transfer, knowledge appropriation, re-deployable performance and relational performance.
We believe our current study is one step towards integrating these perspectives and shining
some light on the phenomenon of (vertical) alliance competitive advantages.

34
FIGURES AND TABLES
Figure 1 Model and Hypotheses
Supplier Knowledge Acquisition Efforts (F1)
Supplier RE-DEPLOYABLE Performance (F5)
H1 Firm Size (F7)
Importance of Customer (F8)
Joint Buyer Supplier Knowledge Acquisition Efforts (F2) H2
H3a Competitive Pressure (F9)
Supplier Dyad-Specific Assets and Capabilities (F3)
H3bSupplier RELATIONAL
Performance (F6)
H4aH4b
Buyer-Supplier Relational Governance Mechanisms (F4)
Figure 2 Theoretical Model, with Parameter Estimates (column D, Table 5)
kaq1 kaq2 kaq3 kaq4
PF1F5 = 0.185***
dployDEL dployINVPF1F3 = -0.046
PF1F6 = -0.041
kaqsp1 kaqsp2 kaqsp3 kaqsp4PF7F5 = 0.038
PF2F5 = 0.028 PF7F6 = 0.044
PF8F5 = -0.077PF2F6 = 0.110*
PF5F6 = 0.143**
spass1 spass2 spass3 spass4PF2F3 = 0.194** PF9F5 = 0.176**
relatDEL relatINV PF5F6 = -0.135*
PF3F5 = -0.022
PF3F6 = 0.262***
rel1 rel2 rel3 PF3F4 = 0.177**
PF4F5 = -0.035
PF4F6 = 0.209***
(F7) Firm Size
(F5) Supplier RE-DEPLOYABLE Performance
(F1) Supplier Knowledge Acquisition Efforts
(F8) Importance of Customer(F2) Joint Buyer Supplier Knowledge Acquisition Efforts
(F4) Buyer Supplier Relational Governance Mechanisms
(F3) Supplier Dyadic Specific Assets & Capabilities
(F9) Competitive Pressure
(F6) Supplier RELATIONAL Performance
Note: Figures 1 and 2 are simplified versions of the actual models. They exclude error terms, co variances, disturbance terms, or correlations between exogenous factors. Full line and dotted lines represent hypothesized and control effects, respectively.
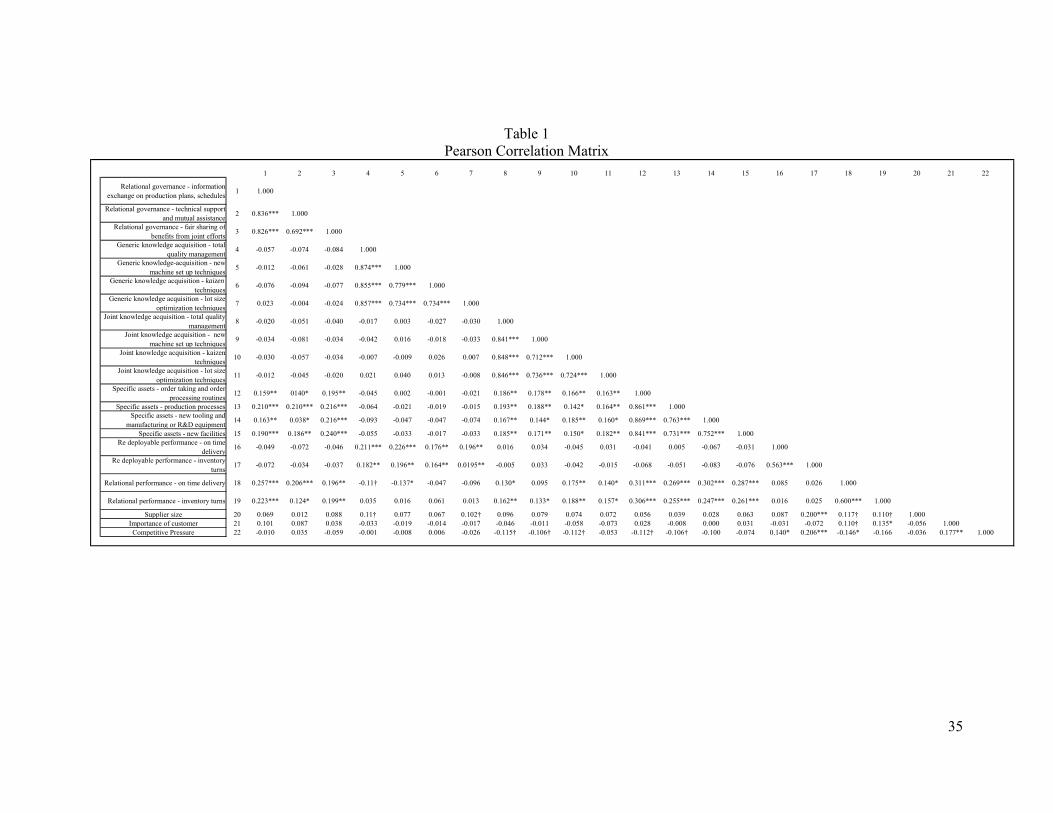
35
Table 1 Pearson Correlation Matrix
1 2 3 4 5 6 7 8 9 10 11 12 13 14 15 16 17 18 19 20 21 22
Relational governance - information exchange on production plans, schedules 1 1.000
Relational governance - technical support and mutual assistance 2 0.836*** 1.000
Relational governance - fair sharing of benefits from joint efforts 3 0.826*** 0.692*** 1.000
Generic knowledge acquisition - total quality management 4 -0.057 -0.074 -0.084 1.000
Generic knowledge-acquisition - new machine set up techniques 5 -0.012 -0.061 -0.028 0.874*** 1.000
Generic knowledge acquisition - kaizen techniques 6 -0.076 -0.094 -0.077 0.855*** 0.779*** 1.000
Generic knowledge acquisition - lot size optimization techniques 7 0.023 -0.004 -0.024 0.857*** 0.734*** 0.734*** 1.000
Joint knowledge acquisition - total quality management 8 -0.020 -0.051 -0.040 -0.017 0.003 -0.027 -0.030 1.000
Joint knowledge acquisition - new machine set up techniques 9 -0.034 -0.081 -0.034 -0.042 0.016 -0.018 -0.033 0.841*** 1.000
Joint knowledge acquisition - kaizen techniques 10 -0.030 -0.057 -0.034 -0.007 -0.009 0.026 0.007 0.848*** 0.712*** 1.000
Joint knowledge acquisition - lot size optimization techniques 11 -0.012 -0.045 -0.020 0.021 0.040 0.013 -0.008 0.846*** 0.736*** 0.724*** 1.000
Specific assets - order taking and order processing routines 12 0.159** 0140* 0.195** -0.045 0.002 -0.001 -0.021 0.186** 0.178** 0.166** 0.163** 1.000
Specific assets - production processes 13 0.210*** 0.210*** 0.216*** -0.064 -0.021 -0.019 -0.015 0.193** 0.188** 0.142* 0.164** 0.861*** 1.000Specific assets - new tooling and
manufacturing or R&D equipment 14 0.163** 0.038* 0.216*** -0.093 -0.047 -0.047 -0.074 0.167** 0.144* 0.185** 0.160* 0.869*** 0.763*** 1.000
Specific assets - new facilities 15 0.190*** 0.186** 0.240*** -0.055 -0.033 -0.017 -0.033 0.185** 0.171** 0.150* 0.182** 0.841*** 0.731*** 0.752*** 1.000Re deployable performance - on time
delivery 16 -0.049 -0.072 -0.046 0.211*** 0.226*** 0.176** 0.196** 0.016 0.034 -0.045 0.031 -0.041 0.005 -0.067 -0.031 1.000
Re deployable performance - inventory turns 17 -0.072 -0.034 -0.037 0.182** 0.196** 0.164** 0.0195** -0.005 0.033 -0.042 -0.015 -0.068 -0.051 -0.083 -0.076 0.563*** 1.000
Relational performance - on time delivery 18 0.257*** 0.206*** 0.196** -0.11† -0.137* -0.047 -0.096 0.130* 0.095 0.175** 0.140* 0.311*** 0.269*** 0.302*** 0.287*** 0.085 0.026 1.000
Relational performance - inventory turns 19 0.223*** 0.124* 0.199** 0.035 0.016 0.061 0.013 0.162** 0.133* 0.188** 0.157* 0.306*** 0.255*** 0.247*** 0.261*** 0.016 0.025 0.600*** 1.000
Supplier size 20 0.069 0.012 0.088 0.11† 0.077 0.067 0.102† 0.096 0.079 0.074 0.072 0.056 0.039 0.028 0.063 0.087 0.200*** 0.117† 0.110† 1.000Importance of customer 21 0.101 0.087 0.038 -0.033 -0.019 -0.014 -0.017 -0.046 -0.011 -0.058 -0.073 0.028 -0.008 0.000 0.031 -0.031 -0.072 0.110† 0.135* -0.056 1.000Competitive Pressure 22 -0.010 0.035 -0.059 -0.001 -0.008 0.006 -0.026 -0.115† -0.106† -0.112† -0.053 -0.112† -0.106† -0.100 -0.074 0.140* 0.206*** -0.146* -0.166 -0.036 0.177** 1.000

36
Table 2 Comparison of Measurement Model to Theoretical Model
PARAMETER PATH DESCRIPTION BEST MODEL MEASUREMENT MODEL
LF1KAQ1 Supplier Knowledge Acquisition <-- total quality management training 1.000 1.000LF1KAQ2 Supplier Knowledge Acquisition <-- New machine set up training 0.932(27.066)*** 0.930(27.049)***LF1KAQ3 Supplier Knowledge Acquisition <-- Kaizen training 0.886(25.029)*** 0.884(25.012)***LF1KAQ4 Supplier Knowledge Acquisition <-- lot size optimization training 0.874(25.058)*** 0.873(25.067)***
LF2KAQSP1 Joint Buyer Supplier Knowledge Acquisition <-- total quality management training 1.000 1.000LF2KAQSP2 Joint Buyer Supplier Knowledge Acquisition <-- New machine set up training 1.040(23.394)*** 1.041(23.405)***LF2KAQSP3 Joint Buyer Supplier Knowledge Acquisition <-- Kaizen training 1.058(23.992)*** 1.058(23.993)***LF2KAQSP4 Joint Buyer Supplier Knowledge Acquisition <-- lot size optimization training 1.042(23.901)*** 1.042(23.903)***LF3SPASS1 Supplier Dyad Specific Assets & Capabilities <-- Order taking & Processing 1.000 1.000LF3SPASS2 Supplier Dyad Specific Assets & Capabilities <-- Production processes 0.929(25.551)*** 0.930(25.568)***
LF3SPASS3 Supplier Dyad Specific Assets & Capabilities <-- New tools, manufacturing, or R&D equipment 0.909(26.518)*** 0.909(26.532)***
LF3SPASS4 Supplier Dyad Specific Assets & Capabilities <-- new facilities 0.858(23.724)*** 0.858(23.728)***LF5dployDEL Supplier REDEPLOYABLE performance <-- Percentage goods delivered on time 1.000 1.000LF5dployINV Supplier REDEPLOYABLE performance <-- Inventory turns 1.806(4.617)*** 1.871(8.716)***LF6relatDEL Supplier RELATIONAL performance <-- Percentage goods delivered on time 1.000 1.000LF6relatINV Supplier RELATIONAL performance <-- Inventory turns 2.020(7.137)*** 1.714(10.104)***
LF4rel1 Buyer Supplier Relational Governance <-- Information exchange on production plans & schedules 1.000 1.000
LF4rel2 Buyer Supplier Relational Governance <-- mutual assistance 0.981 (21.042)*** 0.966 (20.320)***LF4rel3 Buyer Supplier Relational Governance <-- share benefits from joint efforts 0.899 (20.046)*** 0.971 (19.903)***
† p < 0.1; * p < 0.05; ** p < 0.01; *** p < 0.001
Table 3 Chi Square Difference Test
Constrained Model (d.f. = 81)
Unconstrained Model (d.f. = 80)
CF1F2 Supplier Knowledge Acquisition Efforts
Joint Buyer Supplier Knowledge Acquisition Efforts 289.4 233.9 55.5
CF1F3 Supplier Knowledge Acquisition Efforts
Supplier Dyadic-Specific Assets & Capabilities 290.8 233.9 56.9
CF1F4 Supplier Knowledge Acquisition Efforts
Buyer-Supplier Relational Governance 297.5 233.9 63.6
CF1F5 Supplier Knowledge Acquisition Efforts Re-deployable Performance 238.6 233.9 4.7
CF1F6 Supplier Knowledge Acquisition Efforts Relational Performance 242.1 233.9 8.2
CF2F3 Joint Buyer Supplier Knowledge Acquisition Efforts
Supplier Dyadic-Specific Assets & Capabilities 259.3 233.9 25.4
CF2F4 Joint Buyer Supplier Knowledge Acquisition Efforts
Buyer-Supplier Relational Governance 297.5 233.9 63.6
CF2F5 Joint Buyer Supplier Knowledge Acquisition Efforts Re-deployable Performance 240.4 233.9 6.5
CF2F6 Joint Buyer Supplier Knowledge Acquisition Efforts Relational Performance 244.2 233.9 10.3
CF3F4 Supplier Dyadic-Specific Assets & Capabilities
Buyer-Supplier Relational Governance 262.8 233.9 28.9
CF3F5 Supplier Dyadic-Specific Assets & Capabilities Re-deployable Performance 245.7 233.9 11.8
CF3F6 Supplier Dyadic-Specific Assets & Capabilities Relational Performance 247.3 233.9 13.4
CF4F5 Buyer-Supplier Relational Governance Re-deployable Performance 247.4 233.9 13.5
CF4F6 Buyer-Supplier Relational Governance Relational Performance 239.1 233.9 5.2
CF5F6 Re-deployable Performance Relational Performance 252.9 233.9 19
χ2 statistics Difference (d.f. = 1) - significant if chi-square
> 3.85Latent VariablesCovariance

37
Table 4 Parameter Estimates for Structural Equation Model
Column A Column B Column C Column D Column E Column FHYPOTHESIS / COVARIANCE PARAMETER PATH DESCRIPTION THEORETICAL
MODEL BEST MODEL ALTERNATIVE MODEL
PF1F5 Supplier Knowledge Acquisition Efforts --> Re-deployable Performance 0.185(3.528)*** 0.167(3.686)*** 0.165(3.568)***PF1F6 Supplier Knowledge Acquisition Efforts --> Relational Performance -0.041(-0.748)PF2F5 Joint buyer supplier knowledge acquisition efforts --> Re-deployable performance 0.028(0.545)PF2F6 Joint buyer supplier knowledge acquisition efforts --> Relational Performance 0.110(2.128)* 0.115(2.343)* 0.169(1.918)†
PF1F3 Supplier Knowledge Acquisition Efforts --> Supplier Dyad Specific Assets & Capabilities -0.046(-0.737)
PF2F3 Joint buyer supplier knowledge acquisition efforts --> Supplier Dyad Specific Assets & Capabilities 0.194(3.092)** 0.193(3.084)**
PF3F5 Supplier Dyad Specific Assets & Capabilities --> Supplier RE-DEPLOYABLE performance -0.022(-0.412)
PF3F6 Supplier Dyad Specific Assets & Capabilities --> Supplier RELATIONAL Performance 0.262(4.498)*** 0.250(4.983)*** 0.233(4.845)***
H4a (supported) PF3F4 Supplier Dyad Specific Assets & Capabilities --> Buyer Supplier Relational Governance Mechanisms 0.177(2.859)** 0.177(2.864)**
PF4F5 Buyer Supplier Relational Governance Mechanisms --> Supplier RE-DEPLOYABLE Performance -0.035(-0.645)
PF4F6 Buyer Supplier Relational Governance Mechanisms --> Supplier RELATIONAL Performance 0.209(3.499)*** 0.190(3.699)*** 0.244(4.836)***
Moderating Effect (NOT supported) P(F3xF2)F6 Interaction (Joint Buyer Supplier knowledge acquisition x Supplier Dyad Specific Assets) --
> relational performance 0.000(0.307)
Moderating Effect (NOT supported) P(F4xF2)F6 Interaction (Joint Buyer Supplier knowledge acquisition x Buyer supplier relational
governance) --> relational performance -0.001(0.-1.245)
CONTROL (NOT supported) PF7F5 Firm Size --> Supplier RE-DEPLOYABLE Performance 0.038(0.747) 0.036(.723) 0.036(0.683)
CONTROL (NOT supported) PF7F6 Firm Size --> Supplier RELATIONAL Performance 0.044(0.804) 0.046(.851) 0.046(0.850)
CONTROL (NOT supported) PF8F5 Importance of Buyer --> Supplier RE-DEPLOYABLE Performance -0.077(-1.369) -0.083(-1.488) -0.083(-1.497)
CONTROL (supported) PF8F6 Importance of Buyer --> Supplier RELATIONAL Performance 0.143(2.361)** .149(2.462)** 0.165(2.678)**CONTROL (supported) PF9F5 Competitive Pressure --> Supplier RE-DEPLOYABLE Performance 0.176(3.469)*** .175(3.493)*** 0.174(3.492)***
CONTROL (NOT supported) PF9F6 Competitive Pressure --> Supplier RELATIONAL Performance -0.135(-2.524)* -0.134(-2.550)* -0.149(-2.758)**
H3a (supported)
H1 (supported)
H2 (NOT supported)
H4b (supported)
H3b (supported)
† p < 0.1; * p < 0.05; ** p < 0.01; *** p < 0.001 As far as variable nomenclature is concerned, we follow the Bentler (1989) EQS convention of identifying latent (i.e. unobserved) variables with the letter “F” (for Factor), and labeling manifest (i.e. observed) variables with the letter “V” (for Variable). We use the notation “P” (for Path) followed by the identification of variables linked by such path (e.g. PF3F2 indicates a causal path from the factor F3 to factor F2). The sign and statistical significance of the “P” path coefficients serve as a test of the hypothesized relationships.

38
Table 5 Model Statistics and Testing Sequence across Models
Model Model Name Chi-Sq Df Probability GFI NFI NNFI CFI RMSEA AIC BCC BIC1 Measurement 233.947 176 <0.002 0.926 0.945 0.951 0.986 0.036 387.947 403.414 660.0182 Theoretical 256.389 184 <0.000 0.920 0.939 0.941 0.978 0.039 392.389 406.048 632.6593 Best Model 257.867 188 <0.001 0.919 0.939 0.942 0.983 0.038 385.867 398.723 612.0044 Alternative model 1120.089 76 <0.000 0.818 0.795 0.796 0.828 0.126 1272.089 1288.829 1616.627
∆ from 3 to 4 886.222 890.106 1004.623
Table 6 Results of Tests for Differences in Parameter Estimates for Theoretical Model
COMPARATIVE HYPOTHESES χ2
∆χ2 (compare model 2) - significant if ∆χ2 > 3.85
∆df p-value
H1 (supported) PF1F5 = 0.185 PF1F6 = -0.041 275.361 18.972 1 < 0.001H2 (NOT supported) PF2F6 = 0.098 PF2F5 = 0.028 257.975 1.586 1 > 0.100
H3a (supported) PF2F3 = 0.194 PF1F3 = -0.046 270.617 14.228 1 < 0.001
H3b (supported) PF3F6 = 0.262 PF3F5 = -0.022 278.654 22.265 1 < 0.005H4b (supported) PF4F6 = 0.209 PF4F5 = -0.035 272.351 15.962 1 < 0.001
PARAMETER ESTIMATES
Table 7 Testing of Reciprocal Relations between Main Constructs for Best Model
Causal Paths
Point Estimates
Standard Deviation
F1 --> F5 .128* 0.061F5 --> F1 0.125 0.136
F2 --> F6 0.137* 0.068F6 --> F2 -0.065 0.131
F2 --> F3 .428* 0.191F2 --> F3 0.155 0.196
F3 --> F6 .750* 0.32F6 --> F3 0.455† 0.257
F3 --> F4 .357* 0.061F4 --> F3 0.173† 0.109
F4 --> F6 .710** 0.135F6 --> F4 0.099 0.277
† p < 0.1; * p < 0.05; ** p < 0.01; *** p < 0.001

39
Appendix 1 Construct Items and Related Survey Questions:
F1 – Supplier Re-deployable performance: Performance dimensions are:
a. percentage of goods delivered on time b. number of inventory turns necessary to support 12 month sales
F2 – Supplier relational performance: difference between performance of supplier with ‘this’ buyer vis-à-vis its performance with average buyer. Performance dimensions are:
a. percentage of goods delivered on time b. number of inventory turns necessary to support 12 month sales
F3 – Supplier knowledge acquisition efforts: degree to which supplier has invested in or participated in (i.e. been involved with) programs to acquire any of the following improvement packages
a. total quality management programs b. new machine set up techniques programs c. kaizen programs d. lot size optimization techniques programs
F4 – Joint buyer supplier knowledge acquisition efforts: degree to which supplier has invested in or participated in (i.e. been involved with) programs to acquire any of the following improvement packages with ‘co-participation’ of ‘this’ buyer, that is, where this buyer participated in these knowledge acquisition efforts either by ‘teaching’, ‘consulting’ or ‘joint-participating’ (e.g. this buyer’s and supplier’s employees jointly participated in someone else’s programs)
a. total quality management programs b. new machine set up techniques programs c. kaizen programs d. lot size optimization techniques programs
F5 – Supplier dyadic specific assets and capabilities: degree to which investments within past 3 years in assets and capabilities listed below were primarily made to serve the unique and exclusive needs of ‘this’ buyer.
a. order taking and order processing b. production processes c. new tooling and new manufacturing or R&D equipment d. new facilities
F6 – Buyer supplier relational governance mechanisms between supplier and ‘this’ buyer: degree to which supplier and ‘this’ buyer
a. keep each other informed relative to production plans, schedules and demand forecasts
b. extend technical support during emergencies and breakdown and/or on site support for implementation of improvements
c. promote ‘fair sharing’ of cost savings and benefits arising out of joint efforts

40
REFERENCES Aiken M, Hage J. 1968. Organizational interdependence and intraorganizational structure. American sociological review 33: 912-930
Akaike H. 1987. Factor analysis and AIC. Psychometrika 52: 317-332
Amit R, Schoemaker P. 1993. Strategic assets and organizational rent. Strategic management journal 14: 33-46
Anderson JC, Gerbing DW. 1988. Structural equation modeling in practice: a review and recommended two-step approach. Psychological bulletin 103: 411-423
Anand BN, Khanna T. 2000. Do firms learn to create value? The case of alliances. Strategic management journal 21: 295-315
Armstrong JS, Overton TS. 1977. Estimating nonresponse bias in mail surveys. Journal of marketing research 14(3): 396-403
Artz K, Brush TH. 2000. Asset specificity, uncertainty and relational norms: an examination of coordination costs in collaborative strategic alliances. Journal of economic behavior and organization 41(4): 337-362
Asanuma B. 1989. Manufacturer-supplier relationships in Japan and the concept of relationship-specific skill. Journal of the Japanese and international economies 3: 1-30
Axelrod R. 1984. The evolution of cooperation. Basic books: New York, NY
Baker G, Gibbons R, Murphy KJ. 2002. Relational contracts and the theory of the firm. Quarterly journal of economics 117(1): 39-84
Barney JB. 1991. Firm resources and sustained competitive advantage. Journal of management 17: 99-120
Bentler PM. 1989. Comparative fit indexes in structural models. Psychological bulletin 107(March): 238-246
Bentler PM, Bonnett DG. 1980. Significance tests and goodness of fit in the analysis of covariance structures. Psychological bulletin 88(588-606)
Berry WD. 1984. Nonrecursive causal models. Sage publications: Beverly Hills, CA
Bossong Martinez EM. 2000. Standard & Poor's industry surveys. In doMH Standard & Poor (Ed.): New York, NY
Boyer KK, Leong GK, Ward PT, Krajewski LJ. 1997. Unlocking the potential of advanced manufacturing technologies. Journal of operations management 15: 331-347
Browne MW, Cudeck R. 1993. Alternative ways of assessing model fit. In KA Bollen, JS Long (Eds.), Testing structural equation models: 136-162. Sage: Newbury Park, CA
Clark KB, Fujimoto T. 1991. Product development performance. Harvard Business School Press: Boston, MA
Cook TD, Campbell DT. 1979. Quasi-experimentation: design and analysis issues for field settings. Houghton Mifflin: Boston
Chung, S.A.; Singh, H. & Lee, K. (2000). Complementarity, status similarity and social capital as drivers of alliance formation. Strategic Management Journal, 21(1): 1-22.

41
De Meyer A, Ferdows K. 1985. Integration of information systems in manufacturing. International journal of operations and production management 5(2): 5-12
Deutsch M. 1973. The resolution of conflict: constructive and destructive processes. Yale university press: New Haven, CT
Dierickx I, Cool K. 1989. Asset stock accumulation and sustainability of competitive advantage. Management science 35: 554-571
Dillman DA. 2000. Mail and internet surveys: the tailored design method. John Wiley & Sons: New York, NY
Dussauge P, Garrette B, Mitchell W. 2004. Asymmetric performance: the market share impact of scale and link alliances in the global auto industry. Strategic management journal 25: 701-711
Dyer JH, Nobeoka K. 2000. Creating and managing a high-performance knowledge-sharing network: the Toyota case. Strategic management journal 21(3): 345-368
Dyer JH. 1996. Specialized supplier networks as sources of competitive advantage: evidence from the auto industry. Strategic management journal 17(4): 271-291
Dyer JH. 1997. Effective interfirm collaboration: how firms minimize transaction costs and maximize transaction value. Strategic management journal 18: 553-556
Dyer JH, Singh H. 1998. The relational view: cooperative strategy and sources of interorganizational competitive advantage. Academy of management review 23(4): 660-680
Dyer J, Chu W. 2003. The role of trustworthiness in reducing transaction costs and improving performance: empirical evidence from the United States, Japan, and Korea. Organization science 14(1): 57-68
Ferdows K, Miller JG, Nakane J, Vollmann TE. 1986. Evolving global manufacturing strategies: projections into the 1990s. International journal of operations and production management 6(4): 6-16
Fichman M, Goodman PS. 1996. Customer supplier ties in interorganizational relations. In BM Staw, LL Cummings (Eds.), Research in organizational behavior, Vol. 18: 286-329. JAI Press: Greenwich, CT
Fichman M, Levinthal DA. 1991. History dependence and professional relationships: ties that bind. Research in the sociology of organizations 8: 119-153
Frone MR, Russell M, Cook ML. 1994. Relationship between job and family satisfaction: causal and noncausal covariation? Journal of management 20: 565-579
Frone MR, Russell M, Cooper ML. 1992. Antecedents and outcomes of work-family conflict: testing a model of the work-family interface. Journal of applied psychology 77(1): 65-78
Gomes Casseres B. 1984. Group versus group: how alliance networks compete. Harvard business review 4(July-August): 4-11
Grant R. 1996. Prospering in dynamically-competitive environments: organizational capability as knowledge integration. Organization science 7(4): 375-387
Gulati R, Lawrence PR, Puranam P. 2005. Adaptation in vertical relationships: beyond incentive conflict. Strategic management journal forthcoming

42
Gulati R, Singh H. 1998. The architecture of cooperation: managing coordination costs and appropriation concerns in strategic alliances. Administrative science quarterly 43(4): 781-814
Hamel G. 1991. Competition for competence and inter-partner learning within international strategic alliances. Strategic management journal 12(Summer special issue): 83-103
Harman, H.H. (1967). Modern Factor Analysis. 2nd ed. University of Chicago Press. Chicago, IL.
Hatch N, W., Dyer J. 2004. Human capital and learning as a source of sustainable competitive advantage. Strategic management journal 25(12): 1155-1179
Hatcher L. 1998. A step-by-step approach to using the SAS system for factor analysis and structral equation modeling. SAS Institute, Inc.: Cary, NC
Heide JB, John G. 1992. Do norms matter in marketing reltionships? Journal of marketing 56(2): 32-44
Heide JB, Miner AS. 1992. The shadow of the future: effects of anticipated interaction and frequency of contact on buyer-seller cooperation. Academy of management journal 35(2): 265-291
Helper S. 1991. Strategy and irreversibility in supplier relations: the case of the U.S. automobile industry. Business history review 65(4): 781-824
Hopp WJ, Spearman ML. 2000. Factory physics: foundations of manufacturing management. McGraw Hill higher education: New York, NY
James L, R., Mulaik SA, Brett JM (Eds.). 1992. Causal analysis: assumptions, models, and data. Sage Publications: Beverly Hills, CA
James L, R., Singh BK. 1978. An introduction to the logic, assumptions, and basic analytic procedures of two-stage least squares. Psychological bulletin 85: 1104-1122
Joreskog KG, Sorbom D. 1989. LISREL 7: a guide to the program and applications (2nd ed.). SPSS, Inc.: Chicago, IL
Kale P, Singh H, Perlmutter H. 2000. Learning and protection of proprietary assets in strategic alliances: building relational capital. Strategic management journal 31(3): 217
Khanna T, Gulati R, Nohria N. 1998. The dynamics of learning alliances: competition, co-operation and relative scope. Strategic management journal 19: 193-210
Klein B, Crawford A, Alchian A. 1978. Vertical integration, appropriable rents and the competitive contracting process. Journal of law and economics 21: 297-326
Klein BA, Leffler KB. 1981. The role of market forces in assuring contractual performance. Journal of political economy 89(4): 615-632
Kogut B, Zander U. 1992. Knowledge of the firm, combinative capabilities, and the replication of technology. Organization science 3(3): 383-397
Kogut B, Zander U. 1996. What firms do? Coordination, identity, and learning. Organization science 7(4): 502-518

43
Kotabe M, Martin X, Domoto H. 2003. Gaining from vertical partnerships: knowledge transfer, relationship duration, and supplier performance improvement in the U.S. and Japanese automotive industries. Strategic management journal 24: 293-316
Kumar N, Stern LW, Anderson JC. 1993. Conducting interorganizational research using key informants. Academy of management journal 36: 1633-1651
Lane PJ, Lubatkin M. 1998. Relative absorptive capacity and interorganizational learning. Strategic management journal 19(5): 461-477
Leiblein MJ, Reuer JJ, Dalsace F. 2002. Do make or buy decisions matter? The influence of governance on technological performance. Strategic management journal 23: 817-833
Levinthal DA, Fichman M. 1988. Dynamics of interorganizational attachments: auditor-client relationshps. Administrative science quarterly 33: 345-369
Lieberman MB, Asaba S. 1997. Inventory reduction and productivity growth: a comparison of the Japanese and U.S. automotive sectors. Managerial and decision economics 18(2): 73-85
Liker J (Ed.). 1996. Becoming lean: experiences of U.S. manufacturers. Productivity Press
MacDuffie JP, Helper S. 1997. Creating lean suppliers: diffusing lean production through the supply chain. California management review 39(4): 118-151
Macneil IR. 1978. Contracts: adjustments of long-term economic relationship under classical, neoclassical, and relational contract law. Northwestern university law review 72: 854-906
March JG, Simon HA. 1958. Organizatins. Wiley & Sons, Inc.: New York, NY
Masten SE. 1996. Case studies in contracting and organization. Oxford: Cambridge, MA
Masten SE, Meehan JW, Snyder EA. 1991. The costs of organization. Journal of law, economics and organization 7(1): 1-25
McEvily W, Zaheer A. 1999. Bridging ties: a source of firm heterogeneity in competitive capabilities. Strategic management journal 20(12): 1133-1156
Menes JC. 2000. U.S. industry and trade outlook. McGraw Hill: New York, NY
Milgrom P, Roberts J. 1992. Economics, organization and management. Prentice Hall: Upper Saddle River, NJ
Miller JG, Vollmann TE. 1884. North American manufacturers survey: summary of survey responses: Boston, MA
Molina J. 1999. On the relational view / Response to relational view commentary. Academy of management review 24(2): 184-187
Mowery DC, Oxley JE, Silverman BS. 1996. Strategic alliances and interfirm knowledge transfer. Strategic management journal 17(Winter special isue): 77-91
Mowery DC, Oxley JE, Silverman BS. 1998. Technological overlap and interfirm cooperation: implications for the resource-based view of the firm. Research policy 27(5): 507-523
Nelson D. 2001. Purchasing focus: the changes at Deere & Co., All metals & forge, Vol. http://www.steelforge.com/infoservices/metalswatch/issues/mar_2001.htm:

44
Nelson RR, Winter SG. 1982. An evolutionary theory of economic change. Harvard University Press: Cambridge, MA
Nishiguchi T. 1994. Strategic industrial outsourcing: the Japanese advantage. Oxford university press: Oxford
Noordewier TG, John G, Nevin JR. 1990. Performance outcomes of purchasing agreements in industrial buyer-vendor relationshps. Journal of marketing 54(4): 80-94
Ohno T. 1988. Toyota production system: beyond large scale production. Productivity press: Cambridge, MA
Organ DW, Bateman TS (Eds.). 1991. Organizational behavior (4th ed.). Irwin: Boston Raftery A. 1995. Bayesian model selection in social research. In PV Marsden (Ed.), Sociological methodology: 111-163: San Francisco
Perry MK. 1989. Vertical integration. In R Schmalensee, R Willig (Eds.), Handbook of industrial organization. North Holland: Amsterdam
Peteraf MA. 1993. The cornerstones of competitive advantage: a resource-based view. Strategic management journal 14: 179-191
Pfeffer J, Salancik G. 1978. The external control of organizations. Harper & Row: New York
Poppo L, Zenger T. 2002. Do formal contracts and relational governance function as substitutes or complements. Strategic management journal 23: 707-725
Ring P, Van de Ven A. 1992. Structuring cooperative relationships between organizations. Strategic management journal 13: 483-498
Roth PL. 1994. Missing data: a conceptual review for applied psychologists. Personnel psychology 47: 537-560
Sako M. 1999. From individual skills to organizational capability in Japan. Oxford review of economic policy 15(1): 114-126
Saxenian A. 1994. Regional advantage: culture and competition in Silicon Valley and Route 128. Harvard University Press: Cambridge, MA
Schwartz G. 1978. Estimating the dimension of a model. The annals of statistics 6: 461-464 Simonin BL. 1999. Ambiguity and the process of knowledge transfer in strategic alliances. Strategic management journal 20: 595-623
Siekman P. 1999. Where 'build to order' works best, Fortune, Vol. 139:
Silverman BS, Nickerson JA, Freeman J. 1997. Profitability, transactional alignment, and organizational mortality in the US trucking industry. Strategic management journal 18(Summer): 31-52
Simon HA. 1947. Administrative behavior. Macmillan: New York, NY
Simon HA. 2002. Near decomposability and the speed of evolution. Industrial and corporate change 11(3): 587-599
Simonin BL. 1999. Ambiguity and the process of knowledge transfer in strategic alliances. Strategic management journal 20: 595-623
45
Simonin BL. 2004. An empirical investigation of the processes of knowledge transfer in international strategic alliances. Journal of international business studies 35(5): 407
Smith KG, Carroll SJ, Ashford SJ. 1995. Intra- and interorganizational cooperation: toward a research agenda. Academy of management journal 38: 7-23
Spender J-C. 1996. Competitive advantage from tacit knowledge? Unpacking the concept oand its strategic implications. In B Moingeon, A Edmondson (Eds.), Organizational learning and competitive advantage. Sage: Newbury Park, CA
Stigler GJ, Becker GS. 1977. De gustibus non est disputandum. American economic review 67: 76-90
Szulanski G. 1996. Exploring internal stickiness: impediments to the transfer of best practices within the firm. Strategic management journal 17(Winter special issue): 27-43
Takeishi A. 2001. Bridging inter- and intra-firm boundaries: management of supplier involvement in automobile product development. Strategic management journal 22: 403-433
Teece D, Pisano G, Shuen A. 1997. Dynamic capabilities and strategic management. Strategic management journal 18(7): 509-533
Teece DJ. 1987. Profiting from technological innovation: implications for integration, collaboration, licensing and public policy. In DJ Teece (Ed.), The competitive challenge: strategies for industrial innovation and renewal. Ballinger: Cambridge, MA
Thompson JD. 1967. Organizations in action: social science bases of administration. McGraw-HIll: New York, NY
Van de Ven AH, Walker G. 1984. The dynamics of inter-organizational coordination. Administrative science quarterly 29(4): 598-622
von Hippel E. 1988. The sources of innovation. Oxford University Press: New York, NY
Ward PT, Duray R, Leong GK, Sum C-C. 1995. Business enviornment, operations strategy, and performance: an empirical study of Singapore manufacturers. Journal of operations management 13: 99-115
Williamson O. 1985. The economic institutions of capitalism. Free Press: New York, NY
Wong C-S, Law KS. 1999. Testing reciprocal relatioins by nonrecursive structural equation models using cross-sectional data. Organizational research methods 2(1): 69-87
Zhao Z, Anand J, Mitchell W. 2004. Transferring collective knowledge: teaching and learning in the Chinese auto industry. Strategic organization 2(2)