Embed Size (px)
Citation preview
ATHLETIC STADIUM
5 YEAR IMPACT STUDY
PREPARED FOR:
CITY OF SEATTLE
OFFICE OF PLANNING AND DEVELOPMENT
OFFICE OF ECONOMIC DEVELOPMENT
PREPARED BY:
PROPERTY COUNSELORS
JULY 2006

DRAFT: FOR REVIEW AND COMMENT ONLY
ATHLETIC STADIUM 5 YEAR IMPACT STUDY
PROPERTY COUNSELORS PAGE 1
I. INTRODUCTION AND SUMMARY
INTRODUCTION
Safeco Field was developed as the home for the Seattle Mariners, by the Public Facilities
District in 1999. Based on the conditions of a street vacation agreement for Occidental
Avenue S. for use by Safeco Field, at years 5 and 10 after the construction, the Seattle
Mariners were required to contribute $20,000 for an evaluation of “business retention,
housing, land value and development capacity for the surrounding area.” A report of the
valuation is required to be made to the city Council and the Public Facilities District
Board.
The Seattle Mariners made the Year 5 contribution, currently held by the City’s Office of
Economic Development (OED), but the required study has not yet been undertaken until
now. In the meantime, the Mayor initiated a South Downtown planning effort as part of
his Center City Seattle planning strategy, and the Department of Planning and
Development (DPD) and OED have agreed to complete the stadium-related study within
the context of the South Downtown planning effort.
This report documents the result of the 5 year impact study. The scope of the study
includes the following tasks
1. Evaluate gross receipts data for area businesses.
2. Interview 15-20 businesses to identify positive and negative impacts.
3. Interview 5-10 property owners to identify issues and tools to encourage a
positive business climate.
4. Evaluate potential tools to address adverse impacts.
5. Document results.
6. Summarize implications for South Downtown planning and zoning actions.
This report is organized in eight sections:
I. Introductions and Summary
II. Stadium Event Activity
III. Interviews with Area Businesses
IV. Interviews with Area Property Owners

DRAFT: FOR REVIEW AND COMMENT ONLY
ATHLETIC STADIUM 5 YEAR IMPACT STUDY
PROPERTY COUNSELORS PAGE 2
V. Parking Impacts
VI. Property Value Impacts
VII. Housing Impacts
VIII. Conclusions and Recommendations
The findings are summarized in the remainder of this section.
SUMMARY
EVENT ACTIVITY
Safeco Field hosts 81 regular season Mariner games each year plus playoff games and
other major events. There were nine playoff games and three All Star game events over
the period 1998 through 2005. There were 91 other major events ranging from
community events, graduations, shows/exhibits, meetings and luncheons. Qwest Field
and Event Center was developed north of Safeco Field, with the event center opening in
1999 and the stadium opening in 2002. The stadium hosts 8 regular season Seahawks
games each year plus playoff games, as well as a variety of other events. The total
number of events over the period 2003 through 2006 to date is 1,265. Meetings,
miscellaneous events, banquets/receptions/parties, and sporting events are the largest
categories.
47 of the 81 Mariner games are scheduled for weekday evenings. 8 games were
scheduled on weekday afternoons, starting at either 1:35 PM or 3:35 PM. Seahawks
games are typically held on Sunday afternoons, but two Monday evening and one
Thursday evening game are scheduled in 2006.
BUSINESS RECEIPTS TRENDS
Business receipts data for area businesses are summarized in the following table.
2005 % Growth Major Sectors
Gross Receipts 1996 – 2005
Pioneer Square $2.1 B 280% Construction, Business Services,
Amusement and Recreation
International
District
1.5 B 250% Construction, Wholesale, Professional
and Business Services
Stadium Area /
South of Dearborn
.8 B 145% Construction, Business Services,
Amusement and Recreation
While there are several anomalies in the data that need to be researched, the general
picture is one of growth in business activities over a wide range of business sectors. The
obvious stadium-related influences are team revenues and eating/drinking.

DRAFT: FOR REVIEW AND COMMENT ONLY
ATHLETIC STADIUM 5 YEAR IMPACT STUDY
PROPERTY COUNSELORS PAGE 3
INTERVIEWS WITH AREA BUSINESSES
25 area businesses were interviewed representing a range of business types and locations.
There are several common themes:
- Event attendees do patronize businesses in the immediate area of the
stadiums.
- Parking is a perceived, if not real issue. Perceived shortages discourage
regular customers on game days. The issue is most pressing in the area
immediately around the stadium.
- Restaurants are the major attractors of event attendee spending. The
benefits are most positive in Pioneer Square, and are insignificant if not
negative in some areas of the International District.
- Certain retailers like the bookstore, carpet and apparel stores are
beneficiaries of event-related activity. Retailers offering large or
expensive items are less likely to make sales to walk-in patrons, and the
extent of return business is inconsistent among the persons interviewed.
- Businesses that market to event attendees either through their products or
promotions receive the greatest benefits.
- Business other than restaurants report that weekday games are disruptive
to their businesses, in terms of service to their regular customers and their
ongoing operations.
- Businesses that require regular truck access for receiving and delivery are
recent affected by day game traffic and parking.
- Many businesses report adverse impacts from some sporting events
attendees, including noise, litter, and public urination. Such behavior is
more frequently attributed to football game attendees.
INTERVIEWS WITH PROPERTY OWNERS
7 property owners were interviewed. Their responses represented a wide view of
attitudes and interests.
- Property owners interviewed from the Pioneer Square area viewed the
stadiums as amenities and activity generators for development on their
sites.
- Property owners interviewed from the International District considered
proximity of the stadiums to be an overall advantage to potential
businesses and demand for development on their property.

DRAFT: FOR REVIEW AND COMMENT ONLY
ATHLETIC STADIUM 5 YEAR IMPACT STUDY
PROPERTY COUNSELORS PAGE 4
- The property owner interviewed from Little Saigon did not believe that
stadium activity was a major factor in development potential for the area.
- The property owners interviewed from the stadium transition area agreed
that afternoon baseball games conflict with warehousing and
transportation activity in the area. One owner expressed the opinion that
the area is no longer a desirable location for such uses, and felt that
restriction on other uses in the area should be eased. A building owner felt
that the stadiums were a destabilizing element, and had caused a loss of
tenants in his building. One property owner commented that event activity
generates parking revenues for his site.
PARKING IMPACT
Parking is identified by business owners as a major source for stadium impacts. The
issue is both real and perceived. The pattern of parking demand varies by type of event
and time of the event. Generally, attendees will begin arriving one hour to an hour and a
half before a weekday game, but considerably earlier for a weekend football or baseball
game. For a Sunday or evening game, on-street parking fills immediately.
The spatial distribution of demand varies with attendance. One parking lot operator we
interviewed observed that:
- With the Kingdome, a crowd of 30,000 would fill up parking lots east to
3rd
Avenue. A crowd of 60,000 would fill up lots past the freeway to the
east.
- With Safeco Field, a sell-out crowd will fill Pioneer Square lots and
International District lots east to 7th
Avenue.
- With Qwest Field, a sell-out will fill up lots past the freeway.
Close-in lots often adjust their fee based on expected attendance with rates of $25 or $30
for sell-out games.
This experience indicates that parking is relatively scarce in Pioneer Square and to a
lesser extent International District. The high parking demands of a large event put
tremendous pressure on the parking resource in terms of utilization and rental rates.
PROPERTY VALUE IMPACTS
Changes in property values can reflect overall market supply/demand, local supply
demand conditions, or changes in land use.
Generally, the number of land sales in the area has been small. Sales since 2000 have
ranged from $97 to 230 per square foot. The highest price of $230 per square foot was

DRAFT: FOR REVIEW AND COMMENT ONLY
ATHLETIC STADIUM 5 YEAR IMPACT STUDY
PROPERTY COUNSELORS PAGE 5
for the Silver Cloud site north of Safeco Field. The price is equivalent to $21,000 per
hotel room, a realistic price for a hotel of that quality.
The land prices prior to 2000 were generally under $40 per square foot. The properties
were speculative or pioneering purchases.
The King County Assessor regularly evaluates land price trends as part of their valuation
efforts. The valuation background reports identify the value range for stadium area
neighborhoods. The Assessor reports for the periods 2002 through 2004 do not reflect
any changes in the value range.
The lack of identifiable increases is at least partly due to the lack of properties on the
market. In general, however, it is difficult to attribute any significant pressure on land
values to the stadium, particularly in Pioneer Square, International District, and Little
Saigon areas.
HOUSING IMPACT
Housing is an established use in Pioneer Square, the International District, and Little
Saigon; but is allowed only as artist studio/dwelling units in existing buildings in the
Stadium Transition Area. The number of dwelling units in the area is estimated to be:
Number
2005
Increase
since 2000
Pioneer Square 902 147
International District 1,910 396
While there is anecdotal evidence of stadium area residents being inconvenienced and
frustrated by stadium event traffic, recent and proposed development projects include
residential uses. Developers contacted during the ongoing Livable South Downtown
planning study have identified housing as a very viable use in the future. The area offers
the potential of an established residential and commercial district, with prices and rents
that are lower than other urban center neighborhoods. Further, other uses like restaurants
that are supported by stadium event attendees are attractive to potential residents as well.
Potential developers have generally identified the stadium as a benefit to potential
residents.
CONCLUSIONS AND RECOMMENDATIONS
The analysis supports the following conclusions.
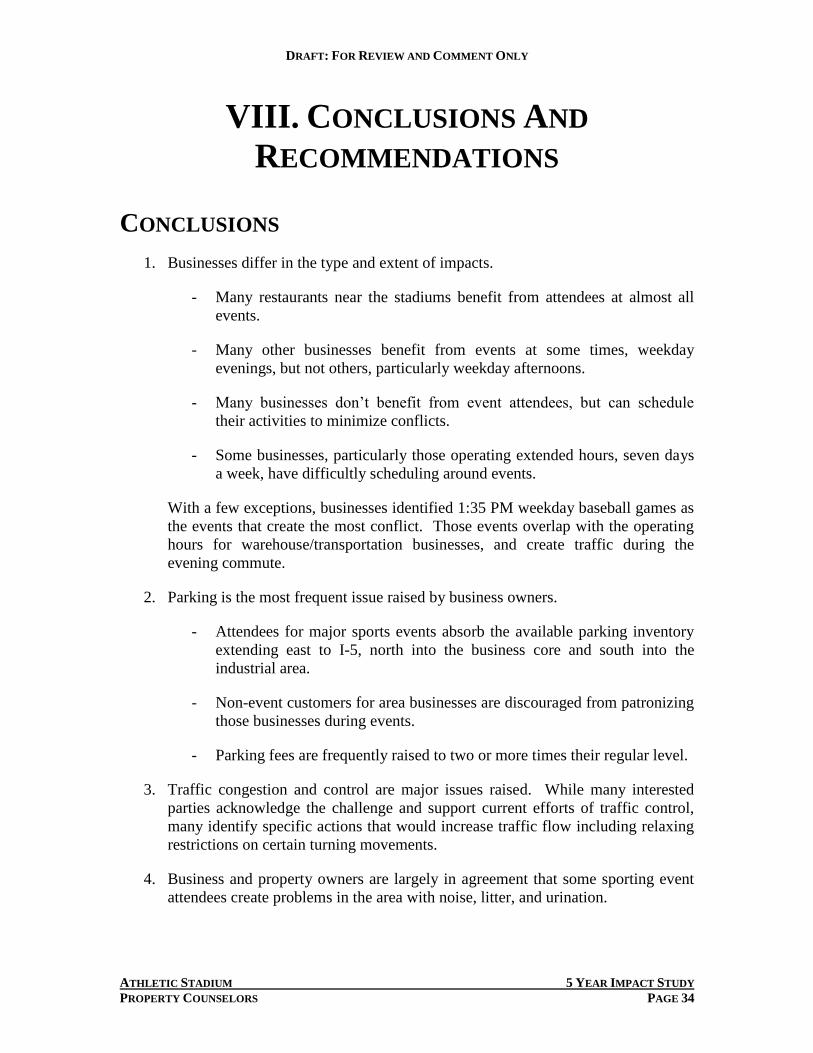
1. Businesses differ in the type and extent of impacts.
- Many restaurants near the stadiums benefit from attendees at almost all
events.

DRAFT: FOR REVIEW AND COMMENT ONLY
ATHLETIC STADIUM 5 YEAR IMPACT STUDY
PROPERTY COUNSELORS PAGE 6
- Many other businesses benefit from events at some times, weekday
evenings, but not others, particularly weekday afternoons.
- Many businesses don’t benefit from event attendees, but can schedule
their activities to minimize conflicts.
- Some businesses, particularly those operating extended hours, seven days
a week, have difficultly scheduling around events.
With a few exceptions, businesses identified 1:35 PM weekday baseball games as
the events that create the most conflict. Those events overlap with the operating
hours for warehouse/transportation businesses, and create traffic during the
evening commute.
2. Parking is the most frequent issue raised by business owners.
- Attendees for major sports events absorb the available parking inventory
extending east to I-5, north into the business core and south into the
industrial area.
- Non-event customers for area businesses are discouraged from patronizing
those businesses during events.
- Parking fees are frequently raised to two or more times their regular level.
3. Traffic congestion and control are major issues raised. While many interested
parties acknowledge the challenge and support current efforts of traffic control,
many identify specific actions that would increase traffic flow including relaxing
restrictions on certain turning movements.
4. Business and property owners are largely in agreement that some sporting event
attendees create problems in the area with noise, litter, and urination.
5. There has not been significant redevelopment or new development as a direct
result of the stadiums.
- A hotel is under construction north of Safeco Field. While the stadiums
will generate room night activity for the hotel, other sources of demand
will be necessary to sustain hotels throughout the South Downtown area
over the course of a typical year.
- There are major office proposals east of Safeco Field and over the tracks
east of Qwest Field. The stadiums themselves do not generate demand for
such uses, but do support restaurants and retail/services that are amenities
for such development.

DRAFT: FOR REVIEW AND COMMENT ONLY
ATHLETIC STADIUM 5 YEAR IMPACT STUDY
PROPERTY COUNSELORS PAGE 7
- Housing development has occurred and is proposed in Pioneer Square and
International District. Again, the stadiums themselves do not generate
demand for such uses, but do support restaurants and retail/service
businesses that are amenities for such development.
We recommend that the City and interested parties pursue the following approaches to
dealing with stadium-related impacts.
1. Work with Seattle Mariners to minimize the number of weekday afternoon games,
and when possible schedule those games at 3:35 PM rather than 1:35 PM. While
scheduling of games is dictated by agreements among Major League Baseball and
the Players Association, the Mariners are required to get City approval beyond the
6 afternoon games covered in their agreements.
2. Develop coordinated strategy for parking in the neighborhoods around the
stadiums. Extents of the strategy include:
- Possible organizing entity for parking in the area.
- Regulation of on-street parking.
- Parking enforcement.
- Parking fees.
- Information on parking availability and directional signing.
3. Provide adequate staffing and efficient routs for directing vehicular traffic before
and particularly after events. While the teams and the City regularly review and
discuss traffic issues, they should continue to evaluate adequacy of staffing and
restrictions on turning movements and traffic routes.
4. Provide convenient routes for pedestrian traffic that will minimize conflicts with
vehicular traffic and business operations. A strategy would recognize adequacy
of sidewalks, business access to streets opened for pedestrian routes, and adequate
crosswalks.
5. Provide facilities and staffing to minimize adverse impacts of event attendee
behavior. Additional public restrooms and garbage cans could reduce impacts of
littler and public urination. Additional police presence and enforcement could
reduce the incidence of such behavior.
6. Further encourage outreach between teams and local businesses. Businesses that
make an effort to serve attendees through their product/service offerings and
promotions, can realize benefits while reducing negative impacts. The team can
expand their efforts to promote and involve local businesses.

DRAFT: FOR REVIEW AND COMMENT ONLY
ATHLETIC STADIUM 5 YEAR IMPACT STUDY
PROPERTY COUNSELORS PAGE 8
7. The City and public partners need to resolve the major transportation infrastructure
projects in the area. Projects such as the Viaduct, SR 519, and freight mobility
projects can alleviate conflicts between the warehouse/transportation businesses
in the immediate area of the stadiums and the Duwamish Manufacturing
Industrial Center.

DRAFT: FOR REVIEW AND COMMENT ONLY
ATHLETIC STADIUM 5 YEAR IMPACT STUDY
PROPERTY COUNSELORS PAGE 9
II. STADIUM EVENT ACTIVITY
Neighborhood impacts are related to the numbers and type of events held at each
stadium. Event activity is described in this section in terms of:
Event Activity
Event Profile
EVENT ACTIVITY
SAFECO FIELD
Safeco Field opened in July 1999. The number of baseball games and the average
attendance is summarized in Table 1.
Table 1
Safeco Field Mariners Games
Games
Paid
Attendance
Turnstile
Attendance
Avg.
Paid
Avg.
Turnstile
1999 42 1,816,026 1,686,116 43,239 40,146
2000 851 3,341,485 3,048,772 39,312 35,868
2001 892 3,882,315 3,692,169 43,621 41,485
2002 81 3,540,482 3,273,289 43,710 40,411
2003 81 3,269,268 3,039,966 40,361 37,530
2004 81 2,942,054 2,539,408 36,322 31,351
2005 81 2,725,549 2,373,311 33,649 29,300 1 Includes 4 playoff games
2 Includes 5 playoff games and 3 all star game events Source: Seattle Mariners
The home season features 81 games. The Mariners hosted playoff games in 2000 and
2001, as well as the all-star game and associated events in 2001. Total paid attendance
was highest in 2001, the year in which the teams set a record for most regular season
wins. Regular season paid attendance was slightly higher in 2002, but turnstile
attendance was lower in that year. Regular season turnstile attendance was 95% of paid
attendance in 2001, but only 87% in 2005.
Safeco Field also hosts several other major events each year.

DRAFT: FOR REVIEW AND COMMENT ONLY
ATHLETIC STADIUM 5 YEAR IMPACT STUDY
PROPERTY COUNSELORS PAGE 10
Table 2
Safeco Field Other Major Events
By Year Total by Period
2000 9 Jan – Mar 24
2001 10 April – June 34
2002 24 July – Sept 18
2003 10 Oct – Dec 13
2004 16 Other 2
2005 13 Total 91
2006 3
Total 91 Source: Seattle Mariners
The types of events range from graduations, community events (e.g. Race for the Cure,
St. Patty’s Day Dash, Heartwalk), shows/exhibits (JobFair, Antique and Farmer’s
Market, tradeshows), meetings or luncheons (Microsoft Company meeting, US
Conference of Mayors, Fred Hutchinson Award Luncheon), concerts, and other sporting
events.
QWEST FIELD AND EVENT CENTER
Qwest Field opened in July 2002. The adjacent Event Center opened in October 1999.
The number of Seahawk Games and average attendance is summarized in Table 3.
Table 3
Qwest Field Seahawk Games
Regular Season Games Paid Attendance Avg. Attendance
2002 8 504,621 63,077
2003 8 512,150 64,018
2004 8 533,436 66,679
2005 8 532,954 66,619 Source: ESPN.com
In addition, Qwest Field hosted 2 pre-season games in each of those years, plus 2 playoff
games in 2006.
Seahawks games are a small portion of overall event activity at Qwest Field and the
Event Center. The number and type of events is summarized in Table 4.

DRAFT: FOR REVIEW AND COMMENT ONLY
ATHLETIC STADIUM 5 YEAR IMPACT STUDY
PROPERTY COUNSELORS PAGE 11
Table 4
Qwest Field and Event Center Number of Events by Type
Event Type 2003 2004 2005 2006 Grand
Total
Consumer Show 21 18 20 7 66
Meeting 63 80 151 48 342
Misc. Events 69 80 109 26 284
Sporting Event 55 48 48 8 159
Trade Show 22 26 28 15 91
Graduations/Reunions/Proms 16 28 31 1 76
Banquets/Receptions/Parties 32 50 68 19 169
Concerts 12 7 7 2 28
Seahawks Non-Game Event 6 17 22 5 50
Grand Total 296 354 484 131 1265
As shown, sporting events represent approximately 13% of total events. The number of
events has grown steadily since opening. Attendance varies from several hundred
thousand over 5 days for the Seattle International Auto Show to meetings with fewer than
75 attendees.
EVENT PROFILES
Seattle Mariner games can be categorized according to the time of day and day of the
week. The distribution of games by type and associated attendance is summarized for the
2005 season in Table 5.
Table 5
Mariner Games by Time of Day and Week – 2005
Number
of Games
Avg. Turnstile
Attendance
Weekday Afternoon 8 26,360
Weekday Evening 47 27,946
Saturday Afternoon 8 33,839
Saturday Evening 5 29,678
Sunday Afternoon 13 33,066
Total 81 29,300 Source: Seattle Mariners
Property Counselors
Over one-half of the games are played in the evening on weekdays. The highest average
attendance was for weekend afternoon games. The lowest was for weekday afternoon
games.

DRAFT: FOR REVIEW AND COMMENT ONLY
ATHLETIC STADIUM 5 YEAR IMPACT STUDY
PROPERTY COUNSELORS PAGE 12
Weekday afternoon games are scheduled on get-away days at the end of a series or home-
stead. Major League Baseball and Player Association agreements require day games in
order to facilitate team travel to their next destination. Start times for afternoon games
have varied from 1:35 PM to 3:35 PM. In 2006, five of the seven afternoon games start
at 1:35 PM, while a game with the Los Angeles Angels in April started at 3:35 PM, and a
game on July 4 started at 1:05 PM.
Attendance patterns over the course of the season vary depending on the performance of
the team. Figure 1 summarizes the attendance patterns in 2005. Attendance reached the
highest level in August, but declined sharply in September, with the Mariners not in
competition for a play-off berth.
Figure 1
Mariner Attendance by Month-2005
Seahawk games are usually scheduled at 1 PM on Sundays, except for occasional Sunday
evenings or Monday games during the regular season, and Saturday games in the
playoffs. The distribution for the upcoming 2006 season is summarized in Table 6.
-
5,000
10,000
15,000
20,000
25,000
30,000
35,000
40,000
April May June July August September October
-
200
400
600
800
1,000
1,200
1,400
1,600
Average of Paid Attendance
Average of Turnstile Attendance
Average of Cars Parked
Month
Data

DRAFT: FOR REVIEW AND COMMENT ONLY
ATHLETIC STADIUM 5 YEAR IMPACT STUDY
PROPERTY COUNSELORS PAGE 13
Table 6
Seahawk Home Games by Time of Day and Week – 2006
Sunday Afternoon 5
Sunday Evening 0
Monday Evening 2
Thursday Evening 1
Total 8 Source: Seattle Seahawks
This year pre-season games are scheduled for a Saturday evening and a Thursday
evening.

DRAFT: FOR REVIEW AND COMMENT ONLY
ATHLETIC STADIUM 5 YEAR IMPACT STUDY
PROPERTY COUNSELORS PAGE 14
II. BUSINESS RECEIPTS TRENDS
Trends in economic activity in the neighborhoods around the stadium should be reflected
in data on gross business receipts. The City of Seattle collects a business and occupation
tax on all businesses in the City. This data was analyzed to evaluate overall trends and
possible impacts associated with the stadium. Data are summarized for the south
downtown neighborhoods:
Pioneer Square
International District
Stadium Area/ South of Dearborn
The areas are shown in Figure 2.
Receipts are reported each quarter or annually. Data are available on a quarterly basis but
are analyzed on an annual basis here. The data from businesses filing annually can’t be
disaggregated by quarter and the quarterly data often reflects adjustments from prior
periods. Gross receipts are reported for a single location, even if there are multiple places
of business. A business division in Pioneer Square may have its receipts reported by an
administrative office outside the district, and an administrative office in Pioneer Square
may report receipts from divisions elsewhere in the City.
PIONEER SQUARE
Trends in gross business receipts for Pioneer Square over the period 1996 through 2005
are summarized in Table 7. Generally, total receipts grew quickly through 2000,
remained stable through 2004, and increased significantly in 2005. Some of this pattern
is explained by the construction activity of the stadiums themselves. Construction
receipts were very high from 1998 through 2003. Other sectors that show high levels of
gross receipts are:
- Manufacturing with a rise and fall in receipts over the period.
- Eating/drinking with an apparent anomaly in the data for 2005. (Two
entries in the fourth quarter appear to be data entry errors.)
- Finance Insurance Real Estate
- Business Services, with much of the growth in computer-related services.
- Amusement and Recreation – with much of the growth in professional
sports.

DRAFT: FOR REVIEW AND COMMENT ONLY
ATHLETIC STADIUM 5 YEAR IMPACT STUDY
PROPERTY COUNSELORS PAGE 15
- Legal services – have remained strong with some variability from year to
year.
- Health Services – with apparent anomalies in 2005 for chiropractic and
health practitioners.
- Other Professional Services
Table 7
Source: City of Seattle B&O Tax data Property Counselors
Ignoring the apparent anomalies and the construction activities, there has been steady
growth in business activity over a wide range of business sectors. Other than the sports
team’s receipts in the amusement and recreation section, there are no obvious
relationships to event activity at the stadiums.
INTERNATIONAL DISTRICT
Trends in gross business receipts for International District over the period 1996 through
2005 are summarized in Table 8. Overall, gross receipts are approximately 75% of the
1996 Total 1997 Total 1998 Total 1999 Total 2000 Total 2001 Total 2002 Total 2003 Total 2004 Total 2005 Total
Agriculture, Forestry, Fishing 6,909,915 4,036,750 4,331,168 5,257,683 5,434,195 6,083,788 5,211,720 5,393,592 6,053,612 7,117,617
Construction 34,831,155 75,042,312 171,277,072 291,988,570 524,763,305 442,911,113 305,358,840 387,104,685 134,666,383 138,488,547
Manufacturing 33,416,219 29,737,752 34,033,703 48,944,230 46,139,013 50,449,194 48,140,480 46,424,056 45,907,201 66,731,144
Transportation 28,808,136 34,122,035 37,908,717 31,605,655 30,082,984 25,709,186 28,264,905 27,663,475 42,022,217 62,761,442
Wholesale Trade 26,210,840 25,162,082 37,715,904 37,841,276 37,478,266 36,341,024 27,939,444 32,810,974 30,108,928 39,726,341
Retail Building Materials - - - - 172,297 149,536 138,909 - - -
Retail General Merchandise - 18,000 109,544 218,355 66,624 173,170 116,975 111,244 96,334 129,778
Retail Food 4,040,582 25,980,124 2,859,344 2,637,256 3,001,784 2,592,770 2,343,965 2,154,195 2,382,230 2,266,634
Retail Apparel 7,254,675 9,096,413 5,227,503 4,955,964 4,469,306 3,771,473 1,577,026 478,723 6,937,615 2,064,770
Retail Furniture and Appliances 21,113,130 13,755,907 17,436,747 16,753,984 16,097,106 6,470,179 4,938,692 8,230,122 18,350,815 16,856,353
Retail Eating/Drinking 33,933,437 40,369,418 43,480,473 38,135,083 36,942,026 33,508,275 26,852,550 30,019,101 32,061,249 326,628,714
Retail Miscellaneous 25,672,578 34,071,978 35,238,866 33,998,296 37,500,298 37,338,163 36,622,566 36,722,557 45,880,297 72,343,095
Total Retail Trade 92,014,402 123,291,841 104,352,477 96,698,938 98,249,439 84,003,566 72,590,682 77,715,942 105,708,540 420,289,345
Finance Insurance Real Estate 21,273,073 24,359,017 28,846,732 29,236,766 35,122,454 33,302,066 31,676,289 28,574,493 25,529,128 106,899,364
Hotels and Motels 1,758,412 2,196,495 2,459,045 2,550,532 2,532,779 2,451,686 2,436,706 2,287,181 2,515,349 2,768,739
Personal Services 11,756,174 13,026,920 14,140,154 2,680,715 2,776,199 2,580,230 2,279,249 2,920,073 2,746,485 9,818,427
Business Services 52,203,233 63,721,104 84,918,897 115,768,165 309,787,559 234,019,961 182,194,384 209,652,828 401,220,113 613,215,613
Automotive Services 8,085,555 10,245,157 14,495,724 26,971,319 6,217,264 7,782,066 8,368,748 8,921,212 10,205,027 11,250,633
Other Repair Services 1,908,962 2,253,914 2,705,829 3,259,246 3,561,536 3,530,508 5,793,470 6,712,016 6,171,223 6,054,894
Amusement and Recreation 72,322,385 94,060,468 94,847,236 56,949,134 20,518,025 220,194,632 235,692,109 247,487,204 259,497,655 245,833,986
Health Services 6,914,586 6,610,293 7,546,830 7,750,304 8,699,758 9,769,531 10,027,332 12,392,994 11,281,691 117,049,467
Legal Services 47,202,215 50,656,691 55,913,965 54,428,999 55,864,377 58,418,851 61,972,706 54,934,985 65,573,548 55,851,541
Educational Services 80,048 204,245 481,543 993,551 641,272 387,938 2,319,077 3,384,866 3,841,291 11,849,265
Social Services 5,132,572 6,358,445 6,808,615 8,079,098 11,027,125 11,790,216 10,741,331 12,161,027 13,945,070 13,565,211
Organizations 4,368,412 4,231,378 4,336,684 5,504,527 6,222,733 6,490,968 5,936,197 3,701,819 5,523,308 5,192,979
Other Professional Services 96,178,494 131,295,848 142,776,019 178,581,195 171,076,640 132,051,608 151,258,998 165,045,020 159,574,689 166,014,610
Administrative 17,990 37,667 139,071 3,000 - - - - - -
Total Services 307,929,039 384,898,625 431,569,614 463,519,786 598,925,267 689,468,196 679,020,307 729,601,226 942,095,448 1,258,465,365
Other 639,728 350,143 128,283 183,141 1,039,658 1,189,262 1,042,191 743,729 828,445 921,388
Total All Industries 552,032,507 701,000,556 850,163,669 1,005,276,045 1,377,234,581 1,369,457,395 1,199,244,858 1,336,032,170 1,332,919,901 2,101,400,552
Gross Business Receipts Trends
Pioneer Square

DRAFT: FOR REVIEW AND COMMENT ONLY
ATHLETIC STADIUM 5 YEAR IMPACT STUDY
PROPERTY COUNSELORS PAGE 16
total levels in Pioneer Square. Total receipts grew quickly from 1996 through 2001,
remained steady through 2004, and grew quickly again in 2005. Construction activity
from 1998 through 2003 accounts for much of the growth. Other sectors that show high
levels of gross receipts include:
Wholesale Trade – with an apparent anomaly for automobiles in 2004 and home
furnishings in 2005.
General Merchandise
Food
Eating/Drinking
Miscellaneous Retail
Finance Insurance Real Estate
Business Services – primarily business services not elsewhere classified
Legal Services
Other Professional Services – including architecture and engineering services, and
management consulting.
Table 8
1996 Total 1997 Total 1998 Total 1999 Total 2000 Total 2001 Total 2002 Total 2003 Total 2004 Total 2005 Total
Agriculture, Forestry, Fishing 1,078,965 1,065,625 1,080,587 1,062,816 1,234,814 1,262,509 1,344,726 1,144,572 1,297,669 1,692,642
Mining - 1,561 - 62,280 - - - - - -
Construction 48,163,350 111,983,152 173,966,467 244,099,939 272,358,646 288,286,571 214,220,432 202,501,068 136,613,401 132,878,056
Manufacturing 31,402,334 30,059,384 21,205,618 41,746,452 46,396,073 37,851,990 23,652,211 15,106,233 15,141,482 30,910,818
Transportation 9,341,601 7,280,529 8,353,723 13,328,496 14,006,565 7,200,775 8,044,584 8,152,187 8,592,856 22,383,157
Wholesale Trade 47,906,415 51,264,175 55,937,961 54,491,981 52,527,254 49,189,606 48,976,636 52,386,846 164,357,017 534,871,213
Retail Building Materials - - - - 136,911 151,140 50,758 - - -
Retail General Merchandise 43,882,111 47,543,748 54,218,098 26,107,186 20,797,875 28,992,768 29,372,730 36,710,037 36,251,750 30,583,566
Retail Food 37,917,610 38,895,411 36,653,696 31,607,297 28,383,486 30,605,776 32,152,503 31,804,404 37,151,542 39,928,235
Retail Automobiles and Gas 968,839 1,031,894 701,040 782,364 1,233,657 1,401,943 988,651 268,802 427,828 581,205
Retail Apparel - 716 87,440 36,770 - - - - - 47,323
Retail Furniture and Appliances 1,567,651 6,383,850 1,220,056 23,259,213 63,956,382 81,822,085 85,984,637 96,425,507 118,704,286 187,239,641
Retail Eating/Drinking 23,739,359 29,021,651 24,767,126 62,687,071 26,164,505 26,094,855 25,758,838 46,999,890 29,282,414 53,306,159
Retail Miscellaneous 21,845,024 28,417,440 26,947,914 62,264,587 52,844,965 78,095,366 101,682,455 64,556,003 37,676,845 75,038,214
Total Retail Trade 129,920,594 151,294,710 144,595,369 206,744,489 193,517,780 247,163,931 275,990,571 276,764,643 259,494,664 386,724,343
Finance Insurance Real Estate 20,540,077 22,830,311 24,474,928 26,143,747 25,166,993 26,692,394 38,057,304 42,878,800 55,181,566 66,392,346
Services, Hotels and Motels 119,555 42,339 46,568 38,051 42,131 29,396 14,913 6,852 24,869 0
Personal Services 1,699,398 4,972,302 2,721,214 2,732,862 2,877,345 2,939,207 4,464,495 4,494,958 4,562,850 7,163,528
Business Services 28,616,173 30,810,234 32,251,105 47,306,852 54,541,052 60,535,475 68,149,254 68,740,110 78,956,077 85,145,757
Automotive Services 11,786,541 12,323,425 12,344,873 13,998,313 15,014,646 15,744,842 16,927,613 18,924,321 20,285,750 32,770,156
Other Repair Services 810,411 910,286 960,700 902,084 1,098,094 987,612 1,019,158 968,872 921,825 12,738,050
Amusement and Recreation 1,965,240 1,414,293 1,181,793 2,658,723 2,482,096 2,395,848 2,163,544 1,937,628 1,765,320 2,667,613
Health Services 7,843,126 8,296,227 8,247,653 8,235,162 8,554,234 9,283,818 10,688,687 11,870,292 11,781,711 16,304,344
Legal Services 11,059,354 14,874,043 19,507,698 21,102,030 40,845,489 21,335,142 29,405,510 25,438,945 30,883,737 25,142,553
Educational Services 1,061,171 1,378,990 1,835,159 7,714,933 1,223,387 1,394,982 1,571,527 1,756,231 6,172,500 6,311,008
Social Services 6,319,896 14,832,609 15,321,572 16,410,859 18,341,671 15,440,930 20,116,084 21,205,252 22,668,591 25,834,050
Organizations 118,342 300,003 133,376 194,075 209,015 168,189 949,331 361,647 207,612 16,537
Other Professional Services 65,725,852 46,572,629 37,631,058 40,781,873 107,473,337 102,084,084 106,191,785 175,419,681 106,599,909 111,850,295
Administrative 8,268 34,315 157,800 319,840 440,265 244,818 397,023 739,707 569,874 405,052
Total Services 137,133,327 136,761,695 132,340,568 162,395,656 253,142,761 232,584,343 262,058,922 331,864,496 285,400,625 326,348,943
Other 1,887,062 1,513,873 1,614,379 1,608,820 1,541,008 1,384,090 1,011,054 705,379 664,849 748,368
Total All Industries 427,373,725 514,055,015 563,569,601 751,684,675 859,891,893 891,616,209 873,356,440 931,504,223 926,744,128 1,502,949,885
Gross Business Receipts Trends
International District
Source: City of Seattle B&O Tax data
Property Counselors

DRAFT: FOR REVIEW AND COMMENT ONLY
ATHLETIC STADIUM 5 YEAR IMPACT STUDY
PROPERTY COUNSELORS PAGE 17
The retail trade sectors show strength in the categories mentioned above. International
District has Eating/Drinking sales comparable to those in Pioneer Square, but food and
general merchandise sales that are much larger.
Again, the overall picture is one of growth areas in a wide range of business sectors. This
is an obvious relationship to activity at the stadiums.
STADIUM TRANSITION AREA AND SOUTH OF
DEARBORN
Trends in gross business receipts in the Stadium Transition Area and South of Dearborn
areas over the period 1996 through 2005 are summarized in Table 9. Overall receipts are
similar in magnitude to International District. Total receipts grew quickly from 1996 to
1998, remained steady through 2000, and grew thereafter.
The two largest sectors are construction and amusement and recreation. Construction
values reached their highest levels after Safeco Field was complete, and apparently
reflect the transportation projects in the area. Amusement and recreation are primarily
professional sports. This category shows a step increase in 2001, two years after the team
moved from the Kingdome. Other sectors with notable sales volumes are:
Manufacturing – showing a cyclical pattern over the period.
Wholesale Trade – providing auto parts, beer and wine, and fresh produce.
Retail Apparel – an apparent anomaly.
Eating/Drinking – with a significant increase in 2001.
Business Services – including advertising and security services.
Social Services
Generally, the picture is one of limited growth in recent years. The obvious stadium-
related influence is in team revenues and eating/drinking.

DRAFT: FOR REVIEW AND COMMENT ONLY
ATHLETIC STADIUM 5 YEAR IMPACT STUDY
PROPERTY COUNSELORS PAGE 18
Table 9
1996 Total 1997 Total 1998 Total 1999 Total 2000 Total 2001 Total 2002 Total 2003 Total 2004 Total 2005 Total
Agriculture, Forestry, Fishing 1,068,669 859,851 668,397 1,143,061 1,063,606 904,629 817,412 1,258,429 1,635,300 1,299,693
Mining - - - - - - - - - -
Construction 55,120,890 122,992,707 185,255,559 248,767,911 310,441,013 327,195,061 233,704,076 407,314,300 182,147,611 157,691,236
Manufacturing 17,129,828 18,101,238 32,367,183 42,859,588 43,157,204 43,045,542 28,450,104 24,514,535 28,242,003 48,938,737
Transportation 27,176,440 37,226,914 24,994,405 17,305,742 17,167,390 11,754,584 6,984,217 3,628,497 3,721,072 1,096,114
Wholesale Trade 53,679,284 57,823,155 113,034,350 62,756,597 47,659,119 41,752,146 34,936,178 35,142,398 144,296,197 88,147,582
Retail Building Materials - - - - - - - - - -
Retail General Merchandise 2,166,514 2,443,964 2,564,074 2,352,396 2,692,285 3,290,163 3,235,136 3,378,716 3,913,006 5,068,709
Retail Food 8,898,981 9,999,907 10,267,386 7,374,555 9,093,495 10,443,300 11,307,118 12,222,834 11,986,368 12,580,788
Retail, Automobiles and Gas 16,445,824 18,010,736 24,997,664 29,374,726 24,669,834 14,509,420 17,423,432 15,672,625 12,585,645 14,202,805
Retail Apparel 3,053,816 2,640,581 1,609,322 1,058,193 1,815,625 1,445,605 1,780,550 1,906,026 2,490,263 50,809,414
Retail Furniture and Appliances 8,163,446 8,838,005 9,353,931 9,476,558 6,460,672 1,013,113 1,447,740 1,690,721 1,254,592 2,280,868
Retail Eating/Drinking 5,608,237 5,770,556 6,135,194 5,511,928 4,236,159 26,293,520 27,349,159 26,692,955 23,369,338 40,533,679
Retail Miscellaneous 4,292,088 7,224,519 7,989,868 7,587,515 10,284,541 9,396,202 9,856,313 11,271,232 17,032,258 30,390,515
Total Retail Trade 48,628,905 54,928,269 62,917,438 62,735,871 59,252,611 66,391,322 72,399,449 72,835,110 72,631,470 155,866,778
Finance Insurance Real Estate 7,638,382 9,354,171 10,247,372 10,266,136 10,767,170 11,592,498 14,875,060 13,861,765 14,061,724 15,326,732
Services, Hotels and Motels - - - - - - - - - -
Personal Services 9,342,637 10,898,025 12,251,185 915,078 779,388 870,491 2,711,921 2,582,743 2,697,616 2,756,476
Business Services 17,261,304 21,723,982 25,003,076 31,765,992 32,779,140 36,309,120 46,585,653 67,191,748 84,546,295 103,138,856
Automotive Services 1,243,930 1,054,950 968,977 1,264,651 1,164,508 1,150,778 1,010,116 1,001,043 1,185,875 1,374,538
Other Repair Services - - - - - - - - - -
Amusement and Recreation 93,969,475 130,828,968 126,788,114 75,137,372 6,644,732 201,991,009 214,261,945 222,758,485 245,428,172 231,578,512
Health Services 667,436 610,914 639,722 887,511 1,000,315 698,754 273,594 44,593 90 -
Legal Services 1,850,518 2,590,450 2,514,328 2,965,656 - - 3,473,661 3,382,425 3,378,812 3,355,882
Social Services 5,260,831 14,136,804 13,231,422 15,269,651 16,025,185 16,917,297 17,443,800 18,272,660 19,322,555 23,853,880
Organization - - - - - - - - - -
Other Professional Services 989,245 2,731,622 2,649,902 2,036,333 2,641,737 2,533,176 3,273,070 3,475,611 3,697,270 3,343,152
Administrative - - - - - - - - - -
Total Services 130,585,376 184,575,715 184,046,726 130,242,244 61,035,005 260,470,626 289,033,758 318,709,308 360,256,686 369,401,295
Other 112,660 195,472 337,199 337,417 141,672 - - - - -
Total All Industries 341,140,434 486,057,492 613,868,629 576,414,566 550,684,791 763,106,409 681,200,253 877,264,342 806,992,061 837,768,167
Gross Business Receipts Trends
SODO District

DRAFT: FOR REVIEW AND COMMENT ONLY
ATHLETIC STADIUM 5 YEAR IMPACT STUDY
PROPERTY COUNSELORS PAGE 19
III. INTERVIEWS WITH AREA
BUSINESSES
We conducted interviews with 25 area businesses to discuss the nature of their business,
impacts of events at the stadium, and strategies for mitigating impacts. The persons
interviewed are listed in Appendix 1. The businesses that the interviewees reprsent are
intended to reflect a range of business types and location: but not necessarily a
statistically valid sample. The information derived from the interviews is presented in
this section by neighborhood and type of business.
PIONEER SQUARE
The businesses that we contacted fall into four broad categories: restaurants/nightclubs,
galleries, other retail businesses, and industrial uses.
RESTAURANTS/NIGHTCLUBS
There are many restaurants and clubs in the Pioneer Square area that cater to game
attendees either before or after vents. Stadium events represents as much as 50% of total
business volume in the case of one restaurant located adjacent to Qwest Field, and 10 to
15% for a restaurant located at the north edge of Pioneer Square near the core of the
central business district. The interviewees all identified the impact of the stadium to be
positive for the businesses.
Restaurants and clubs are typically open from before noon to midnight or later, seven
days a week. They are available to serve event attendees before and after events. Most
of the stadium-related business is from sports events. The extended hours make it
possible to serve attendees regardless of the time of day or day of week. One restaurant
operator indicated that he preferred early afternoon start times for weekday games,
because it generated additional lunch business, while another preferred late afternoon
start times so as not to interfere with regular lunch business. Patrons are more likely to
spend before or after an event on weekends.
The perception of a parking shortage, if not an actual shortage was identified as a
problem by all those interviewed. It’s particularly a problem for a nightclub seeking to
attract patrons for shows on game nights.
GALLERIES
Galleries differ somewhat in their perceptions of business impacts for event attendees.
Gallery representatives that we spoke to agreed that there was lots of foot traffic on event
days. In some cases this results in walk-in traffic. The walk-in traffic isn’t likely to

DRAFT: FOR REVIEW AND COMMENT ONLY
ATHLETIC STADIUM 5 YEAR IMPACT STUDY
PROPERTY COUNSELORS PAGE 20
purchase expensive items however . In some cases, the increased walk-in traffic dictates
higher staffing, but the limited sales revenue doesn’t cover the cost. The representatives
we interviewed agreed that event activity discourages their regular patrons, as a result of
perceived or real parking shortages. While some game day walk-ins may return at
another time, this is believed to be an infrequent phenomenon.
Galleries are generally not open in the evening, or on Sundays, so weeknight and Sunday
games aren’t a great issue.
Representatives did identify problems with litter and public urination on game days.
OTHER RETAIL
Other retail businesses interviewed included a bookstore, carpet store, clothing store,
furniture store, and building material showroom. The bookstore is open seven days per
week until 9 or 10 PM. Baseball attendees frequently shop at the store before games.
Books are the type of merchandise that a shopper can purchase and carry to a game.
Football patrons are less likely to visit the store and make purchases. The perceived
shortage of parking on game days discourages regular customers. This is a particular
problem on Sundays in November and December.
The clothing store and the carpet store both identified event attendees as a strong source
of business. Both stores are open seven days a week. Increased foot traffic generates
sales on event days as well as return business. Perceived parking shortages were
identified as a major issue.
The furniture store identified mixed impacts. As with the galleries, they report limited
revenue from walk-in businesses, and not much return business. The shortage of parking
on game days discourages regular customers. Football sundays have the greatest
negative impact.
The building material showroom is generally affected only by baseball day games. They
aren’t open on Sunday and close at 5 PM during the week. Many regular customers stay
away during game days. The walk-in traffic may make purchases at the time or during a
return visit, but in many cases are not serious shoppers.
INDUSTRIAL
We interviewed a cold storage facility operation and a commercial printer, both located
on 1st Avenue with loading facilities on Occidental. Both businesses are open Monday
through Friday, and are closed by 6 PM. Evening games and weekend games do not
present significant conflicts. The afternoon baseball games do create conflicts, however.
In addition to the area-wide increases in traffic, Occidental may be closed to vehicle
traffic. In the case of a night game, this may occur at 5 PM; for an afternoon game, it
would occur earlier. In either case, the limited access and pedestrian traffic inhibits pick
DRAFT: FOR REVIEW AND COMMENT ONLY
ATHLETIC STADIUM 5 YEAR IMPACT STUDY
PROPERTY COUNSELORS PAGE 21
up and delivery. Both businesses monitor scheduled start times and coordinate their
activities accordingly. With a 1:35 PM start time its difficult to avoid conflicts.
Much of the conflict is due to pedestrian traffic on Occidental. It’s difficult for trucks
and pedestrians to share the roadway.
INTERNATIONAL DISTRICT
The businesses that we contacted fall into three broad categories: market, restaurants, and
other retail and service.
MARKET
Uwajimaya is a major anchor in the International District. Uwajimaya serves a diverse
customer base throughout the region. The store manager identifies game day activity at
the stadium as positive. The store is open seven days a week until 10 PM (9 PM on
Sunday). The store is open to serve event attendees before evening games and
before/after other games. For afternoon games and weekend games, event attendees
come by for lunch at the store. They serve fewer attendees for evening games. The store
makes an effort to serve event attendees through its food court offerings and game day
specials.
The manager acknowledges that traffic congestion on game days is a potential deterrent.
However, they do have their own parking lot, so regular customers can find a place to
park. The garage closes at 10 PM, and hourly parking rates are $7.50 (with credit for
store purchases), so event attendees are not likely to use their parking.
RESTAURANTS
The restaurants in the International District don’t believe that they capture significant
spending by event attendees. Generally, event attendees take up parking that would
otherwise go to regular customers. (They differ from Uwajimaya in that they don’t
control their own parking.) One restaurant reports some sit-down business before games,
and take-out sales, but that is more then offset by loss of other business. Another
restaurant is open until midnight, and serves some event attendees after games, but this is
a small share. Weekends offer frequently strong lunch business, but this is lost on
football Sundays.
OTHER BUSINESSES
We interviewed the operator of a teahouse and specialty hotel. None of her customers are
event attendees. The major impact is noise and litter from football game attendees.

DRAFT: FOR REVIEW AND COMMENT ONLY
ATHLETIC STADIUM 5 YEAR IMPACT STUDY
PROPERTY COUNSELORS PAGE 22
LITTLE SAIGON
The major business categories in Little Saigon are markets, restaurants and other retail
and service businesses. The business representatives that we interviewed indicated that
they are not greatly affected by game activity. One restaurant owner reported that drive
through traffic on game days was a problem. None of the interviewees considered
parking impacts to be serious, although parking is an issue on football game and non-
game days. Little Saigon’s location east of I-5 is somewhat beyond the limit for event
related parking.
STADIUM TRANSITION DISTRICT
We interviewed representatives of businesses in two broad categories: warehousing and
retail/showroom.
WAREHOUSING
The two warehousing businesses included a third party warehouse and trucking business,
and a fresh produce distributor. The third party warehouse firm handles a limited number
of low turnover items. Much of their business has been moved to warehouse space in the
Kent Valley. The Kent location is much better suited to the requirements of handling
large trucks. As a result, the south Downtown facility has limited truck activity and
operates between 8 AM and 4 PM most weekdays. There is little if any conflict with
evening and weekend baseball events. There are conflicts, however, for day baseball
games. Given the level of activity at the site, it is often possible to schedule around the
conflicts.
The produce warehouse operates 24 hours a day, seven days a week. There is limited
receiving or no deliveries on Sunday, so there are few conflicts with events on those
days. For evening games, they have adapted their systems and schedules to reduce
conflicts. For weekday afternoon games, however, there are major conflicts with traffic
congestion, building access, and truck parking. Parking is the biggest issue by far, as
they estimate that 400 parking spaces have been lost in the area due to road construction
and development.
RETAIL/SHOWROOM
We interviewed two retail showroom stores, one selling appliances and one selling doors
and millwork. Both businesses reported that they had conflicts with afternoon events at
the stadiums. The conflicts are related to traffic congestion and parking. In spite of these
conflicts, the area is apparently a desirable site for such uses. The appliance store
believes that they benefit from the walk-by traffic, both on game-day or for return visits.
The millwork business reports that two other door/window distributors have located in
the area in recent years.
DRAFT: FOR REVIEW AND COMMENT ONLY
ATHLETIC STADIUM 5 YEAR IMPACT STUDY
PROPERTY COUNSELORS PAGE 23
SUMMARY
There are several common themes:
- Event attendees do patronize businesses in the immediate area of the
stadiums.
- Parking is a perceived, if not real issue. Perceived shortages discourage
regular customers on game days. The issue is most pressing in the area
immediately around the stadium.
- Restaurants are the major attractions of event attendee spending. The
benefits are most positive in Pioneer Square, and are insignificant if not
negative in some areas of the International District.
- Certain retailers like the bookstore, carpet and apparel stores are
beneficiaries of event-related activity. Retailers offering large or
expensive items are less likely to make sales to walk-in patrons, and the
extent of return business is inconsistent among the persons interviewed.
- Businesses that market to event attendees either through their products or
promotions receive the greatest benefits.
- Business other than restaurants report that day games during the week are
disruptive to their businesses, in terms of service to their regular customers
and their ongoing operations.
- Businesses that require regular truck access for receiving and delivery are
most affected by day game traffic and parking.
- Many businesses report adverse impacts from some sporting events
attendees, including noise, litter, and urination. Such behavior is more
frequently attributed to football game attendees.

DRAFT: FOR REVIEW AND COMMENT ONLY
ATHLETIC STADIUM 5 YEAR IMPACT STUDY
PROPERTY COUNSELORS PAGE 24
IV. INTERVIEWS WITH PROPERTY
OWNERS
We conducted interviews with representatives of seven property owners to discuss the
impact of stadium events on their use and plans for their properties. The property owners
are intended to reflect a range of property types and locations, but not a statistically valid
sample. The persons interviewed are listed in Appendix 1. The information derived from
the interviews is presented in this section by neighborhood.
PIONEER SQUARE
The property owners we interviewed have existing developed sites in the area and
adjacent South Downtown neighborhoods. They have announced plans for large
properties in the area (Kingdome North Parking Lot and Over Tracks Development for
Nitze-Stagen; and WOSCA site and south of Dearborn properties for Urban Visions).
The proposed developments embrace the stadiums with physical linkages and references.
(The WOSCA development is referred to as Stadium West). The stadiums are considered
to be amenities and activity generators for any new development on the subject sites.
INTERNATIONAL DISTRICT
The property owners we interviewed have multiple sites in the International District.
Both persons interviewed considered proximity of the stadium as an overall advantage to
potential businesses and demand for development on their properties. One owner
commented specifically on demand for restaurants in the area by Mariner game attendees.
The owner also indicated that their studies did not indicate that sports events and trade
shows provide significant support for new lodging facilities.
LITTLE SAIGON
The property owner we interviewed owns a mixed use retail/residential building and three
retail/office buildings. He does not identify stadium-related activity as being a major
factor in the development potential of the area.
STADIUM TRANSITION AREA
We interviewed two owners of buildings within the area, and one with a site currently
used primarily for parking. The owner of an industrial building that houses his
warehouse operation acknowledges that the existing building and immediate area no
longer can accommodate the large trucks and capacity associated with a modern 3rd
party
parking warehouse facility. He has moved much of his operation to the Kent Valley.

DRAFT: FOR REVIEW AND COMMENT ONLY
ATHLETIC STADIUM 5 YEAR IMPACT STUDY
PROPERTY COUNSELORS PAGE 25
Afternoon baseball games create some conflicts for truck access and convenience, but
those conflicts can be accommodated given the scale of operations. The owner reports a
strong benefit from revenues available from game day parking on the site. The parking
lot is managed on game day by a local parking operator.
The owner of a large lot used for parking by stadium events, has proposed to build a large
office complex on the site. The project will be dependent upon attracting a major tenant
for the buildings. At this time, the owner believes that it will be possible to attract such a
tenant. The proximity to Safeco Field is considered a marketing plus for the project.
The owner of a mixed use building with residential and quasi-industrial tenants considers
stadium activity to be destabilizing for the immediate area and the Greater Duwamish
Manufacturing Industrial Center. He reports that he has lost two tenants because they
couldn’t get access to their premises for pick up and/or activity during sport events.
Representatives of the Port of Seattle expressed strong concern about the impact of
stadium events on the movement of containers. The truck gate for Terminal 37-46 is
located off Alaskan Way at Atlantic. Traffic congestion and pedestrian activity slows the
movement of containers by truck, and creates a dangerous condition for truck traffic.
Afternoon games create the greatest conflicts, because the period from 12:30 to 3:30 is a
peak time for truck movements.

DRAFT: FOR REVIEW AND COMMENT ONLY
ATHLETIC STADIUM 5 YEAR IMPACT STUDY
PROPERTY COUNSELORS PAGE 26
V. PARKING IMPACTS
Parking is identified by business and property owners as a major issue for stadium
impact. Whether parking shortages are real or perceived, they affect businesses in the
stadium area. The parking issue is explored in more detail in this section in terms of
Parking Statistics
Game Day Impacts
PARKING STATISTICS
The Puget Sound Regional Council (PSRC) has conducted a periodic inventory of the
parking inventory in the Central Puget Sound Region. The earliest study was in 1996 and
the most recent in 2004. This time period provides a baseline prior to the opening of
Safeco Field, and a somewhat current point in time as well.
Table 10 summarizes charges in the parking inventory over the period. As shown, there
are approximately 9,200 parking spaces in the three zones around the stadiums. The
number of spaces has increased by 35% over the period 1996 through 2004. However,
the number of spaces is well below the parking demand created by a sold out sporting
event in one of the stadiums. The number of parking spaces in each of the three zones is
well below the average for the Central Business District on a per acre basis.
Table 10
Off Street Parking Inventory
1996 to 2004
1996 2004 % Change Stalls/Acre
2004
Zone 1 Stadium Area 3,700 5,805 56.9% 31.1
Zone 2 International District 1,452 1,667 13.7 22.2
Zone 3 Pioneer Square 1,663 1,723 7.4 27.8
Total CBD 53,146 54,035 1.7 53.9 Source: Puget Sound Regional Council, Parking Inventory for Central Puget Sound Region, 2004
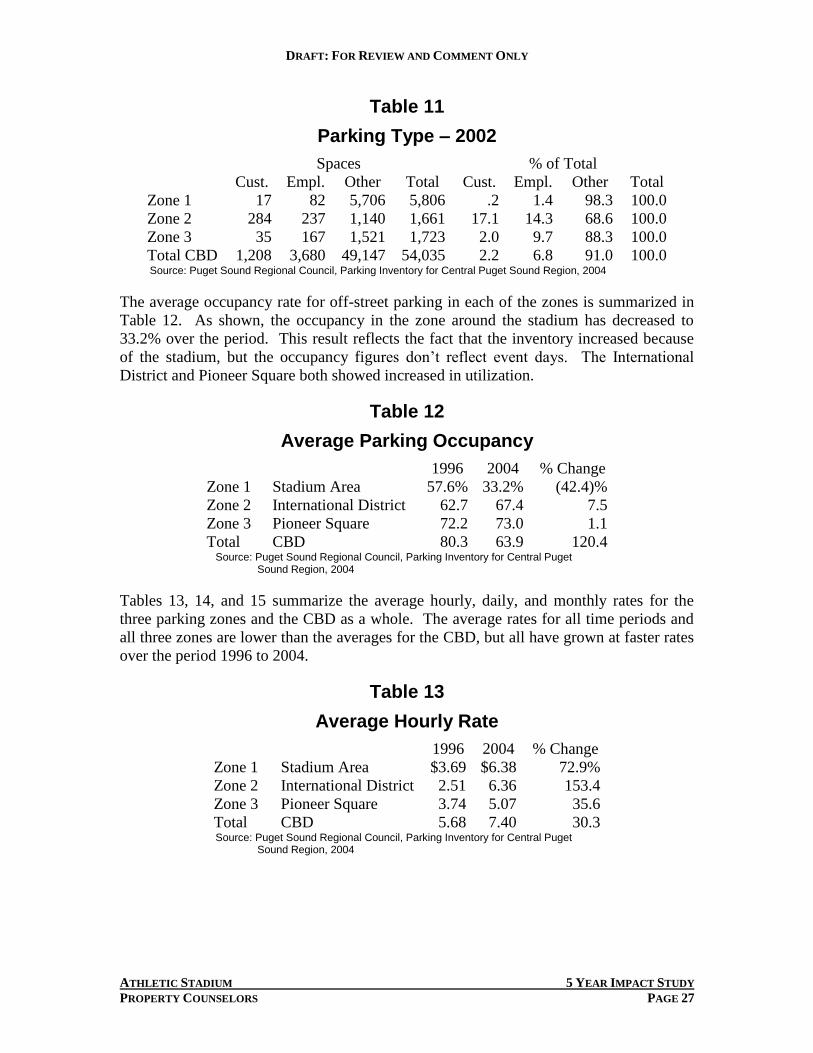
Table 11 summarizes the breakdown of off-street parking according to whether it is
reserved for employees or customers. As shown, International District and Pioneer
Square have higher percentages of spaces reserved for employees and customers than the
CBD as a whole.
DRAFT: FOR REVIEW AND COMMENT ONLY
ATHLETIC STADIUM 5 YEAR IMPACT STUDY
PROPERTY COUNSELORS PAGE 27
Table 11
Parking Type – 2002
Spaces % of Total
Cust. Empl. Other Total Cust. Empl. Other Total
Zone 1 17 82 5,706 5,806 .2 1.4 98.3 100.0
Zone 2 284 237 1,140 1,661 17.1 14.3 68.6 100.0
Zone 3 35 167 1,521 1,723 2.0 9.7 88.3 100.0
Total CBD 1,208 3,680 49,147 54,035 2.2 6.8 91.0 100.0 Source: Puget Sound Regional Council, Parking Inventory for Central Puget Sound Region, 2004
The average occupancy rate for off-street parking in each of the zones is summarized in
Table 12. As shown, the occupancy in the zone around the stadium has decreased to
33.2% over the period. This result reflects the fact that the inventory increased because
of the stadium, but the occupancy figures don’t reflect event days. The International
District and Pioneer Square both showed increased in utilization.
Table 12
Average Parking Occupancy
1996 2004 % Change
Zone 1 Stadium Area 57.6% 33.2% (42.4)%
Zone 2 International District 62.7 67.4 7.5
Zone 3 Pioneer Square 72.2 73.0 1.1
Total CBD 80.3 63.9 120.4 Source: Puget Sound Regional Council, Parking Inventory for Central Puget
Sound Region, 2004
Tables 13, 14, and 15 summarize the average hourly, daily, and monthly rates for the
three parking zones and the CBD as a whole. The average rates for all time periods and
all three zones are lower than the averages for the CBD, but all have grown at faster rates
over the period 1996 to 2004.
Table 13
Average Hourly Rate
1996 2004 % Change
Zone 1 Stadium Area $3.69 $6.38 72.9%
Zone 2 International District 2.51 6.36 153.4
Zone 3 Pioneer Square 3.74 5.07 35.6
Total CBD 5.68 7.40 30.3 Source: Puget Sound Regional Council, Parking Inventory for Central Puget
Sound Region, 2004

DRAFT: FOR REVIEW AND COMMENT ONLY
ATHLETIC STADIUM 5 YEAR IMPACT STUDY
PROPERTY COUNSELORS PAGE 28
Table 14
Average Daily Parking Cost
1996 2004 % Change
Zone 1 Stadium Area $5.17 $10.38 100.8%
Zone 2 International District 3.91 14.21 263.4
Zone 3 Pioneer Square 7.24 11.73 62.0
Total CBD 11.2 15.72 42.6 Source: Puget Sound Regional Council, Parking Inventory for Central Puget
Sound Region, 2004
Table 15
Average Monthly Parking Cost
1996 2004 % Change
Zone 1 Stadium Area $74.61 N/A N/A
Zone 2 International District 57.94 130.71 125.6%
Zone 3 Pioneer Square 109.76 163.11 48.6
Total CBD 147.10 213.52 45.2 Source: Puget Sound Regional Council, Parking Inventory for Central Puget
Sound Region, 2004
GAME DAY IMPACTS
The pattern of parking demand varies by type of event and time of the event. Generally,
attendees will begin arriving one hour to an hour and a half before a weekday game, but
considerably earlier for a weekend football or baseball game. For a Sunday or evening
game, on-street parking fills immediately.
The spatial distribution of demand varies with attendance. One parking lot operator we
interviewed observed that:
- With the Kingdome, a crowd of 30,000 would fill up parking lots east to
3rd
Avenue. A crowd of 60,000 would fill up lots past the freeway to the
east.
- With Safeco Field, a sell-out crowd will fill Pioneer Square lots and
International District lots east to 7th
Avenue.
- With Qwest Field, a sell-out will fill up lots past the freeway.
Close in lots often adjust their fee based on expected attendance with rates of $25 or $30
for sell-out games.
This experience indicates that parking is relatively scarce in Pioneer Square and to a
lesser extent International District. The high parking demands of a large event put
tremendous pressure on the parking resource in terms of utilization and rental rates.

DRAFT: FOR REVIEW AND COMMENT ONLY
ATHLETIC STADIUM 5 YEAR IMPACT STUDY
PROPERTY COUNSELORS PAGE 29
VI. PROPERTY VALUES
Changes in property values can reflect overall market supply/demand, local supply
demand conditions, or changes in land use. Trends in land prices are described in this
section in terms of specific land sales, and general trends.
LAND SALES
Land sales in the neighborhoods around the stadium for the period 1997 to 2005 are
shown in Table 16. Generally, the number of sales is small. Sales since 2000 have
ranged from $97 to $230 per square foot. The $97 price was for the Mosaic Apartment
site (Now Asia Condominiums) with the building completed in 2002. The highest price
of $230 per square foot was for the Silver Cloud site north of Safeco Field. The price is
equivalent to $21,000 per hotel room, a realistic price for a hotel of that quality.
The land prices prior to 2000 were under $40 per square foot, except for the King County
Building site in Pioneer Square. Other than the King County site, the properties were
speculative or pioneering purchases. The WOSCA site is still undeveloped though there
are plans and requirements for changes in zoning. The Uwajimaya and Union Station
sites have since been developed with successful projects but were pioneering efforts at
the time. The King County building site sale in Pioneer Square reflects a price for land in
an established area and the price is similar to more recent transactions in the area.
GENERAL TRENDS
The King County Assessor regularly evaluates land price trends as part of their valuation
efforts. The valuation background reports identify the value range for stadium area
neighborhoods to be
International District
1DM 75/85 $50-90/sq ft
1DM 100/120 85-90
1DR 150 90-100
Little Saigon/Central District
C1 65 $15-60
1C 65 18-55
NC3 65 25-65
Pioneer Square
PSM 85/120 $70-90
PSM 100 70-90
PSM 100/120 70-110
The Assessor reports for the periods 2002 through 2004 do not reflect any changes in the
value range except in NC3 65, where the low end of the range was $20 in 2002.

DRAFT: FOR REVIEW AND COMMENT ONLY
ATHLETIC STADIUM 5 YEAR IMPACT STUDY
PROPERTY COUNSELORS PAGE 30
The lack of identifiable increases is at least partly due to the lack of properties on the
market. In general, however, it is difficult to attribute any significant pressure on land
values, to the stadium, particularly in Pioneer Square, International District, and Little
Saigon areas.
Table 16
Pioneer Square/International District Land Sales
Comp. Sale Analysis Area Price/
No. Location Date Price (Sq Ft) Zoning Sq Ft
Starbucks Office Building Site Apr-06 $6,500,000 36,155 PSM-85-120 $180 Starbucks office site
N. Corner 1st Ave. S/Alaskan Way. Price incl. entitlements/plans
Allright Site Pending $3,870,750 35,956 IC-65 $108 Purchase by Monorail
800 Block of 4th Ave. S. Land: $3,185,750 $89 Subject to easements
Billboard: $685,000
Sweazey-Miller Site Oct-04 $10,080,000 57,600 IDM-100-120 $175 City of Seattle bought for
Full block bounded by 4th & 5th, new command center
and Yesler & Washington St.
NEC 1st Ave. & Royal Brougham Dec-04 $4,441,000 19,275 PSM-85-120 $230 Silver Cloud Hotel - 210 rooms
Half block on east side of 5th Ave., Feb-04 $3,100,000 27,000 IDM 75-85 $115 160 room hotel + 80 condos
between Main and Jackson St. IDR-150
NEC Yesler Way & 6th Ave. S. Sep-04 $2,500,000 21,600 IDR-150 $116 Retail/Residential planned
210 Alaskan Way Aug-03 $1,170,000 8,077 PSM-100 $145 Hotel site between WA & Main
SWC Main St./Maynard Ave. Jan-02 $1,500,000 14,400 IDR-150 $104 Parking lot
NWC Lane St./7th Ave. S. Jun-01 $1,400,000 14,460 IDM-75-85 $97 Apt/Retail bldg built '02
801 1st Ave. Jan-99 $10,097,344 302,305 IG2U-85 $33 WOSCA site
1st Ave., north of Royal Brougham
1003 4th Ave. S. Jun-98 $1,039,500 41,818 IG2U-85 $25 Allright Parking lot
SEC 5th Ave. S./S. Lane St. Jan-98 $2,070,000 56,137 IDM-75 $37 Uwajimaya assemblage
NEC S. King St./2nd Ave. S. Jun-97 $7,550,000 66,179 PSM-100 $114 King Co. bldg. Site
East of 4th Ave. S., south of Sep-97 $11,900,000 322,545 IDM-65 $37 Union Station site
Jackson St.
1531 Utah St. Oct-98 $2,100,000 65,710 IG2U-85 $32 Coast Cranes site
1528-2020 Alaskan Way S. Jul-96 $2,687,847 74,384 Res $36 Condo sites?

DRAFT: FOR REVIEW AND COMMENT ONLY
ATHLETIC STADIUM 5 YEAR IMPACT STUDY
PROPERTY COUNSELORS PAGE 31
VII. HOUSING IMPACTS
Housing is an established use in Pioneer Square, the International District, and Little
Saigon; but is allowed only as artist studio/dwelling units in existing buildings in the
Stadium Transition Area. Housing issues are presented in this section in terms of
housing market trends and stadium impacts.
HOUSING MARKET TRENDS
The City has compiled housing data for the Downtown Urban Center neighborhoods.
The number of housing units and additions since 2000 are summarized in Table 16.
Table 17
Dwelling Units in Downtown Urban Center
Dwelling
Units – 2005
Increase
Since 2000
Pioneer Square 902 147
International
District/Chinatown
1,910 396
Belltown 8,256 2,885
Denny Triangle 1,340 496
Commercial Core 3,069 692
Downtown Urban Center 15,977 4,616 Source: City of Seattle, Department of Planning and Development
The dwelling unit numbers demonstrate the prominence of Belltown as the major
residential concentration in Downtown. It accommodates 53% of all units and 63% of
new units of the period 2000 to 2005. Pioneer Square has the lowest number of dwelling
units in Downtown and the lowest increase. International District/Chinatown has the
next lowest increases.
Market conditions in the stadium area are summarized in the following table.

DRAFT: FOR REVIEW AND COMMENT ONLY
ATHLETIC STADIUM 5 YEAR IMPACT STUDY
PROPERTY COUNSELORS PAGE 32
Table 18
South Downtown Neighborhoods
Comparison of Economic Conditions
Pioneer Intl. Dist. Intl. Dist. Stadium
Square Chinatown Little Saigon So. Dearborn
Residential
Type Renovation Renov./New New N/A
Market & Subsidy Market & Subsidy Market
Price Range-Apt. (mkt.) $1.50-2.00/sf/mo. $1.40-1.75/sf/mo. $1.50/sf/mo.
Price Range-Condo $325-400/sf $400-450/sf $300-350/sf
Residential development is occurring in Pioneer Square, Chinatown and little Saigon. In
Pioneer Square, much of the development has been renovations. Recent projects
included:
Lowman Building: Income restrictions
Terry Denny Building: Rental lofts
Corona: Rental lofts
New development is proposed for Trolley Barn site on Occidental, on the Kingdome
North Parking Lot.
In the International District, new development includes
75 S Weller, (under construction)
Empress on Fifth:
Washington Terrace: Seniors
Seniors Nehomachi Terrace: Income restricted
The rent leader for the area is Uwajimaya Village with monthly rents of up to $1,800 for
6 bedroom unit. To date, the only condominium project was Fujisada on 5th Avenue.
Units in the buildings are up for resale at $450,000 for a 1,000 square foot home. The
Mosaic apartments recently sold, and units are now for sale as the Asia Condominiums at
prices starting at $199,800 for studios and $339,000 for 2 bedroom.
There has been only a limited amount of residential development in Little Saigon. The
Pacific Rim Center has condominiums available for $300,000 or more. 10 of the 40 units
have sold with the remainder coming up for sale as leases expire.

DRAFT: FOR REVIEW AND COMMENT ONLY
ATHLETIC STADIUM 5 YEAR IMPACT STUDY
PROPERTY COUNSELORS PAGE 33
STADIUM IMPACTS
While there is anecdotal evidence of stadium area residents being inconvenienced and
frustrated by stadium event traffic, recent and proposed development projects include
residential uses. Developers contacted during the ongoing Livable South Downtown
planning study have identified housing as a very viable use in the future. The area offers
the potential of an established residential and commercial district, with prices and rents
that are lower than other urban center neighborhoods. Further, other uses like restaurants
that are supported by stadium event attendees, are attractive to potential resident as well.
Potential developers have generally identified the stadium as a benefit to potential
residents.
DRAFT: FOR REVIEW AND COMMENT ONLY
ATHLETIC STADIUM 5 YEAR IMPACT STUDY
PROPERTY COUNSELORS PAGE 34
VIII. CONCLUSIONS AND
RECOMMENDATIONS
CONCLUSIONS
1. Businesses differ in the type and extent of impacts.
- Many restaurants near the stadiums benefit from attendees at almost all
events.
- Many other businesses benefit from events at some times, weekday
evenings, but not others, particularly weekday afternoons.
- Many businesses don’t benefit from event attendees, but can schedule
their activities to minimize conflicts.
- Some businesses, particularly those operating extended hours, seven days
a week, have difficultly scheduling around events.
With a few exceptions, businesses identified 1:35 PM weekday baseball games as
the events that create the most conflict. Those events overlap with the operating
hours for warehouse/transportation businesses, and create traffic during the
evening commute.
2. Parking is the most frequent issue raised by business owners.
- Attendees for major sports events absorb the available parking inventory
extending east to I-5, north into the business core and south into the
industrial area.
- Non-event customers for area businesses are discouraged from patronizing
those businesses during events.
- Parking fees are frequently raised to two or more times their regular level.
3. Traffic congestion and control are major issues raised. While many interested
parties acknowledge the challenge and support current efforts of traffic control,
many identify specific actions that would increase traffic flow including relaxing
restrictions on certain turning movements.
4. Business and property owners are largely in agreement that some sporting event
attendees create problems in the area with noise, litter, and urination.

DRAFT: FOR REVIEW AND COMMENT ONLY
ATHLETIC STADIUM 5 YEAR IMPACT STUDY
PROPERTY COUNSELORS PAGE 35
5. There has not been significant redevelopment or new development as a direct
result of the stadiums.
- A hotel is under construction north of Safeco Field. While the stadiums
will generate room night activity for the hotel, other sources of demand
will be necessary to sustain hotels throughout the South Downtown area
over the course of a typical year.
- There are major office proposals east of Safeco Field and over the tracks
east of Qwest Field. The stadiums themselves do not generate demand for
such uses, but do support restaurants and retail/services that are amenities
for such development.
- Housing development has occurred and is proposed in Pioneer Square and
International District. Again, the stadiums themselves do not generate
demand for such uses, but do support restaurants and retail/service
businesses that are amenities for such development.
RECOMMENDATIONS
1. Work with Seattle Mariners to minimize the number of weekday afternoon games,
and when possible schedule those games at 3:35 PM rather than 1:35 PM. While
scheduling of games is dictated by agreements among Major League Baseball and
the Players Association, the Mariners are required to get City approval beyond the
6 afternoon games covered in their agreements.
2. Develop coordinated strategy for parking in the neighborhoods around the
stadiums. Extents of the strategy include:
- Possible organizing entity for parking in the area.
- Regulation of on-street parking.
- Parking enforcement.
- Parking fees.
- Information on parking availability and directional signing.
3. Provide adequate staffing and efficient routs for directing vehicular traffic before
and particularly after events. While the teams and the City regularly review and
discuss traffic issues, they should continue to evaluate adequacy of staffing and
restrictions on turning movements and traffic routes.
4. Provide convenient routes for pedestrian traffic that will minimize conflicts with
vehicular traffic and business operations. A strategy would recognize adequacy

DRAFT: FOR REVIEW AND COMMENT ONLY
ATHLETIC STADIUM 5 YEAR IMPACT STUDY
PROPERTY COUNSELORS PAGE 36
of sidewalks, business access to streets opened for pedestrian routes, and adequate
crosswalks.
5. Provide facilities and staffing to minimize adverse impacts of event attendee
behavior. Additional public restrooms and garbage cans could reduce impacts of
littler and public urination. Additional police presence and enforcement could
reduce the incidence of such behavior.
6. Further encourage outreach between teams and local businesses. Businesses that
make an effort to serve attendees through their product/service offerings and
promotions, can realize benefits while reducing negative impacts. The team can
expand their efforts to promote and involve local businesses.
7. The City and public partners need to resolve the major transportation infrastructure
projects in the area. Projects such as the Viaduct, SR 519, and freight mobility
projects can alleviate conflicts between the warehouse/transportation businesses
in the immediate area of the stadiums and the Duwamish Manufacturing
Industrial Center.

DRAFT: FOR REVIEW AND COMMENT ONLY
ATHLETIC STADIUM 5 YEAR IMPACT STUDY
PROPERTY COUNSELORS PAGE 37
APPENDIX 1
STADIUM IMPACT STUDY
LIST OF CONTACTS Business Owners
Tam Nguyen, Saigon Bistro
Hiroshi Hibi, Uwajimaya
Phil Chan, Seven Seas
Kevin Cochrane, Millwork Supply
Mike Olson, Merchants Parking
Andy Cheim, Evergreen Chiropractic
Theresa Reyna, Kim Ngoc Jewelry
Jim Friedman, Direct Buying Service
Tina Bueche, Synapse 206
Tom McQuaid, Nordic Cold Storage
Jason Handalay, Sound Produce
Pejmun Mostafaui, Classic Rug Gallery
Jeff Bieber, American Slate
Jan Johnson, Teahouse
Peter Aaaron, Elliot Bay Books
Gay Enderson, New Orleans Restaurant
Terry Derosier, Agate Design
Craig Dyer, Olympic Reprographics
Richard Chang, Kau Kau
Gigi Gelfin, Northwest Fine Woodworking
Mick McHugh, FX McRory’s
Ben Masin, Masin’s Furniture
Seth Howard, Collin’s Pub
Pheng Huang, Foster White
Tom Hirsche, United Warehouse
Property Owners
David Hutchhaesen, Bemis Building
Bill Vivian, Home Plate Parking
Chris Koh, Coho Real Estate
Paul Liao, Pacific Rim Center
John King, American Warehouse
Tom Hirsche, United
Allen Kurmura, Uwajimaya

DRAFT: FOR REVIEW AND COMMENT ONLY
ATHLETIC STADIUM 5 YEAR IMPACT STUDY
PROPERTY COUNSELORS PAGE 38
Frank Stagen, Nitze-Stagen
Greg Smith, Urban Visions
Other
Susan Ranf, Seattle Mariners
David Young, Qwest Field
Joyce Pisnanout, International District Housing Alliance
Christine Wolfe and Linda Styrk, Port of Seattle


![[Home]field Advantage: Re-evaluating the Urban Impact of the Typical Stadium Typology](https://img.dokumen.tips/doc/110x75/579053cb1a28ab900c8dbfe2/homefield-advantage-re-evaluating-the-urban-impact-of-the-typical-stadium.jpg)