Embed Size (px)
Citation preview

This is an Open Access document downloaded from ORCA, Cardiff University's institutional
repository: http://orca.cf.ac.uk/98078/
This is the author’s version of a work that was submitted to / accepted for publication.
Citation for final published version:
Iori, Valentina, Iyer, Anand M., Ravizza, Teresa, Beltrame, Luca, Paracchini, Lara, Marchini,
Sergio, Cerovic, Milica, Hill, Cameron, Ferrari, Mariella, Zucchetti, Massimo, Molteni, Monica,
Rossetti, Carlo, Brambilla, Riccardo, Steve White, H., D'Incalci, Maurizio, Aronica, Eleonora and
Vezzani, Annamaria 2017. Blockade of the IL-1R1/TLR4 pathway mediates disease-modification
therapeutic effects in a model of acquired epilepsy. Neurobiology of Disease 99 , pp. 12-23.
10.1016/j.nbd.2016.12.007 file
Publishers page: http://dx.doi.org/10.1016/j.nbd.2016.12.007
<http://dx.doi.org/10.1016/j.nbd.2016.12.007>
Please note:
Changes made as a result of publishing processes such as copy-editing, formatting and page
numbers may not be reflected in this version. For the definitive version of this publication, please
refer to the published source. You are advised to consult the publisher’s version if you wish to cite
this paper.
This version is being made available in accordance with publisher policies. See
http://orca.cf.ac.uk/policies.html for usage policies. Copyright and moral rights for publications
made available in ORCA are retained by the copyright holders.

1
Blockade of the IL-1R1/TLR4 pathway mediates disease-modification therapeutic
effects in a model of acquired epilepsy
Valentina Iori1, Anand M. Iyer2, Teresa Ravizza1, Luca Beltrame3, Lara Paracchini3, Sergio
Marchini3, Milica Cerovic1, Cameron Hill4, Mariella Ferrari3, Massimo Zucchetti3, Monica
Molteni5, Carlo Rossetti5, Riccardo Brambilla1,6, H. Steve White4, Maurizio D’Incalci3,
*Eleonora Aronica2,7,8 and *Annamaria Vezzani1
1Department of Neuroscience and 3Department of Oncology, IRCCS-Istituto di Ricerche
Farmacologiche “Mario Negri”, Milano, Italy; 2Department of (Neuro)Pathology, Academic
Medical Center, Amsterdam, The Netherlands; 4Department of Pharmacy, University of
Washington, Seattle, WA, USA; 5Department of Biotechnologies and Life Sciences,
Insubria University, Varese, Italy; 6Neuroscience and Mental Health Research Institute,
Division of Neuroscience, School of Biosciences, Cardiff University, United Kingdom;
7Swammerdam Institute for Life Sciences, Center for Neuroscience, University of
Amsterdam; 8Stichting Epilepsie Instellingen (SEIN) Nederland and Epilepsy Institute in
The Netherlands Foundation, The Netherlands
*Shared last authorship and correspondence:
Annamaria Vezzani, PhD
Department of Neuroscience
IRCCS-Istituto di Ricerche Farmacologiche “Mario Negri”
Via G. La Masa 19, 20156 Milano, Italy
Tel +39-02-39.014.410, Fax +39-02-35.46.277
E-mail: [email protected]
Eleonora Aronica, MD
Department of (Neuro)Pathology
Academisch Medisch Centrum,
Meibergdreef 9, 1105 AZ Amsterdam, The Netherlands
Tel + 31-20-5662943, Fax 31-20-5669522
E-mail: [email protected]
2
Abstract
We recently discovered that forebrain activation of the IL-1 receptor/Toll-like receptor (IL-
1R1/TLR4) innate immunity signal plays a pivotal role in neuronal hyperexcitability
underlying seizures in rodents. Since this pathway is activated in neurons and glia in
human epileptogenic foci, it represents a potential target for developing drugs interfering
with the mechanisms of epileptogenesis that lead to spontaneous seizures. The lack of
such drugs represents a major unmet clinical need. We tested therefore novel therapies
inhibiting the IL-1R1/TLR4 signaling in an established murine model of acquired epilepsy.
We used an epigenetic approach by injecting a synthetic mimic of micro(mi)RNA-146a that
impairs IL1R1/TLR4 signal transduction, or we blocked receptor activation with
antiinflammatory drugs. Both interventions when transiently applied to mice after epilepsy
onset, prevented disease progression and dramatically reduced chronic seizure
recurrence, while the anticonvulsant drug carbamazepine was ineffective. We conclude
that IL-1R1/TLR4 is a novel potential therapeutic target for attaining disease-modifications
in patients with diagnosed epilepsy.

3
Highlights
• miR-146a hippocampal levels are transiently increased after injection of a synthetic
oligonucleotide mimic.
• miR-146a mimic reduces the levels of key proteins mediating the IL-1R1/TLR4
signaling.
• miR-146a mimic reduces neuronal excitability and acute seizures in mice.
• miR-146a mimic and a combination of anti-inflammatory drugs, by targeting IL-
1R1/TLR4 arrest epilepsy progression and decrease chronic seizures in a mouse
model of epilepsy.
• CBZ did not display disease-modification effects
Keywords
• neuroinflammation
• epilepsy
• seizures
• disease-modification
• hyperexcitability
Abbreviations: AEDs, antiepileptic drugs; ANOVA, analysis of variance; AP-1, activator
protein 1; BBB, blood brain barrier; CA,Cornu Ammonis; COX-2, cyclooxygenase-2; CBZ,
carbamazepine; EEG, electroencephalography; GABA, gamma-aminobutyric acid;
HMGB1, High Mobility Group Box 1; IL-1β, interleukin-1β; IL-1R1, Interleukin-1 receptor
type 1; intracerebroventricular, icv; IRAK-2, Interleukin-1 receptor-associated kinase-like 2;
LNA, lock-nucleic-acid; miRNA, microRNA; NF-kB, nuclear factor kappa-light-chain-
enhancer of activated B cells; NMDA, N-methyl-D-aspartate; TLR4, Toll-like receptor 4;
TRAF-6, TNF receptor associated factor 6;SE, status epilepticus.

4
INTRODUCTION
Epilepsy is a brain disorder affecting over 50 million people worldwide and is associated
with increased mortality, significant comorbidities, unique stigmatization of affected
individuals, and high societal cost (Duncan et al., 2006). Current antiepileptic drugs
(AEDs) provide only symptomatic control of seizures, have multiple adverse effects, and
are ineffective in up to 40% of patients (Weaver and Pohlmann-Eden, 2013). This
represents a major unmet clinical need. To bridge the treatment gap, next generation
therapies need to possess disease-modifying properties by targeting the mechanisms
intimately involved in making the brain susceptible to generate spontaneous seizures.
Such drugs are still lacking and they could potentially be used to halt or reverse the
progression of epilepsy in patients with an established diagnosis, or delay or prevent the
onset of epilepsy in susceptible individuals (Barker-Haliski et al., 2015).
Experimental evidence shows that the activation of the IL-1 receptor/Toll-like
receptor (IL-1R1/TLR4) pathway is a major pathogenic factor in epilepsy since its
pharmacological or genetic inactivation dramatically reduces seizure recurrence in
experimental models of either acute seizures or established epilepsy (Ravizza et al, 2006;
Vezzani et al., 2000; Vezzani et al., 2002; Balosso et al., 2008; Maroso et al., 2010;
Maroso et al., 2011a; Vezzani et al., 2011b; Iori et al., 2013; Balosso et al., 2014). Notably,
this pathway is activated in neurons and glia in epileptogenic foci surgically resected in
patients affected by various forms of acquired pharmacoresistant epilepsy (Vezzani et al.,
2011a).
Different epileptogenic insults imposed to mice or rats (e.g., neurotrauma, stroke, infection,
febrile and non-febrile status epilepticus) trigger a rapid and long-lasting IL-1R1/TLR4
activation in seizure-prone brain areas (Vezzani et al., 2011b; Vezzani et al., 2013)

5
mediated by the release of interleukin(IL)-1β and danger signals, such as High Mobility
Group Box 1 (HMGB1), from glia, neurons and cellular components of the blood brain
barrier (BBB). The activation of IL-1R1/TLR4 pathway in receptor-expressing neurons
promotes excitotoxicity and seizures by enhancing calcium influx via N-methyl-D-aspartate
(NMDA) receptors (Viviani et al., 2003; Balosso et al., 2008; Pedrazzi et al., 2012; Iori et
al., 2013; Balosso et al., 2014). Activation of IL-1R1/TLR4 in glial cells induces a
neuroinflammatory cascade by transcriptional activation of NF-κB and AP-1 sensitive
genes, including cytokines, chemokines, COX-2 and complement factors (Vezzani et al.,
2011b; Vezzani et al., 2015b). The extent and persistence of these molecules in brain are
key determinants of the switch from the homeostatic role of neuroinflammation to its
contribution to cell damage and dysfunction (Heinemann et al., 2012; Devinsky et al.,
2013). The link between IL-1R1/TLR4 signaling activation, neuronal hyperexcitability and
reduction of seizure threshold may potentially contribute to the development of a chronic
epileptogenic network ignited by different brain insults. This pathway therefore represents
a potential target for attaining disease-modifications in epilepsy, thereby improving disease
prognosis.
In this study, we tested the potential therapeutic effects, based on disease
modifications, of epigenetic or pharmacological interventions designed for inhibiting the
IL1R1/TLR4 pathway activation in a widely used mouse model of acquired epilepsy
(Shinoda et al., 2004; Li et al., 2008; Mouri et al., 2008; Jimenez-Mateos et al., 2012; Liu
et al., 2013; Gu et al., 2015). Epigenetic intervention was based on micro(mi)RNA brain
delivery. miRNAs are small non-coding RNA that represent key epigenetic
posttranscriptional regulators of cellular protein levels (Jimenez-Mateos et al, 2013).
Specifically, we selected to enhance the negative feed-back regulation of the IL-1R1/TLR4
signaling mediated by miR-146a (Taganov et al., 2006; O'Neill, 2008; Boldin et al., 2011;
Quinn and O'Neill, 2011; Iyer et al., 2012; Zeng et al., 2013; van Scheppingen et al., 2016)

6
using a synthetic oligonucleotide mimic. Notably, miR146a is induced in neurons and glia
in both experimental and human epilepsy (Aronica et al., 2010; Quinn and O'Neill, 2011;
Omran et al., 2012; Prabowo et al., 2015; van Scheppingen et al., 2016). In
complementary studies, we used a combination of antiinflammatory drugs for effectively
blocking IL-1R1/TLR4 activation. We applied these agents for a limited period of time after
the onset of epilepsy in mice to simulate a clinical intervention in patients with diagnosed
epilepsy.
7
MATERIALS AND METHODS
Animals
We used 8 week-old C57BL6N male mice (~23-30 g) in all experiments, except for
electrophysiological recordings that were done in 21 day-old C57BL6N male mice (Charles
River, Calco, Italy). Mice were maintained in SPF facilities at the Mario Negri Institute and
housed at a constant room temperature (23°C) and relative humidity (60 ± 5%) with free
access to standard food pellet (2018S, Envigo, Udine, Italy) or to CBZ-in-food and its
control pellet (BioServe, F05572; Frenchtown, NJ, USA; Grabenstatter et al, 2007) and
water, and with a fixed 12 h light/dark cycle. Mice were housed 5 animals per cage. After
experimental manipulations (as reported below) each mouse was individually housed in
the presence of environmental enrichment (i.e. toilet paper, straw).
Study design
In this study we investigated the potential therapeutic effects of epigenetic or
pharmacological targeting of the IL-1R1/TLR4 pathway in an established mouse model of
acquired epilepsy. Drugs were therefore transiently applied after the onset of epilepsy in
each mouse, as determined by the occurrence of the first two video-EEG recorded
spontaneous seizures at least 48 h after status epilepticus (SE) was elapsed. Treatment
schedule was determined according to pharmacokinetic and pharmacodynamic data, as
specified in each treatment protocol.
Data are presented as mean ± SEM and are inclusive of all mice that were randomized in
the biochemical or therapeutic studies. No animal was excluded from the study except for
mice which did not develop SE (8 out of 88) due to kainate injection misplacement. The
number of mice in each experiment is indicated by n values in the figure legends, methods
and supplementary materials. In each experiment, simple randomization was used as
treatment allocation rule; blinding was applied to treatment administration and data

8
analysis. In the proof-of-concept studies in Figs 1, 2 and 3, animal sample size was
estimated empirically on the basis of our previous experience with the epilepsy models
and the therapeutic effects of anti-inflammatory drugs (Vezzani et al., 2000; Balosso et al.,
2008; Maroso et al., 2010; Maroso et al., 2011a; Iori et al., 2013; Balosso et al., 2014). Our
primary endpoint was ≥50% reduction in the frequency of seizures at the end stage of the
disease (i.e. 2.5 months after epilepsy onset) in the treated group compared to the
respective control group. We also took into careful consideration the principles of the 3 Rs
(Replacement, Reduction and Refinement; https://www.nc3rs.org.uk/the-3rs). All
experimental procedures were conducted in conformity with institutional guidelines that are
in compliance with national (D.L. n.26, G.U. March 4, 2014) and international guidelines
and laws (EEC Council Directive 86/609, OJ L 358, 1, December 12, 1987, Guide for the
Care and Use of Laboratory Animals, U.S. National Research Council, 1996), and were
reviewed and approved by the intramural ethical committee.
Intracerebroventricular injections of oligonucleotides
Mice were surgically implanted under general gas anesthesia (1-3% isoflurane in O2) and
stereotaxic guidance (Maroso et al., 2010; Iori et al., 2013) with a guide cannula positioned
on top of the dura mater (from bregma, mm: nose bar 0; anteroposterior 0, lateral 0.9)
(Franklin and Paxinos, 2008) one week before the injections. miR-146a mimic (Applied
Biosystems, Carlsbad, CA, USA), antagomiR LNA (Superior probes, RiboTaskApS,
Odense, Denmark) or their respective controls (specific random sequence for mimic or
negative control with no effects on known miRNA function; Applied Biosystems; see table
below) were dissolved in sterile PBS and injected intracerebroventricularly (icv, 0.25
µl/min) in freely moving mice over 4 min using a 30-gauge injection needle connected to a
10.0 µl Hamilton microsyringe via PE20 tubing, according to convection-enhanced delivery

9
method (Gasior et al., 2007). At the end of infusion, the needle was left in place for one
additional minute to avoid backflow through the guide cannula, then gently removed.
The mimic or its negative control were administered icv as single injection (5 or 10 µg in 1
µl; Fig. 1A,B; Fig. S1; Fig. S2, panels a-f) or repetitively (10 µg in 1 µl; one injection every
three days for a total of five injections; Fig. 2; Fig. S2, panels g-o; Fig. S3D) while the
antagomiR or its negative control was injected icv twice a day for six consecutive days
(Krutzfeldt et al., 2005) (1 µg in 1 µl; Fig. 1C,D).
Modulation of miR-146a levels. For RT-qPCR analysis of hippocampal levels of miR-146a
(Fig. 1A,C), the mimic (n=8) or its antagomiR (n=10) or their respective negative controls
(n=8-10 each group) were injected in naïve mice that were killed 24 h or 72 h later. For in
situ hybridization analysis of forebrain miR-146a levels, mice (electrode implanted but not
exposed to SE; Sham) were injected with a single injection of mimic or its negative control
(n=5 each group) and killed 24 h later (Fig. S2). A different cohort of SE-exposed mice
were injected with mimic or its negative control (n=4-5 each group) using the repetitive
injection protocol used for assessing the disease-modification effect of the treatment (Fig.
S2; protocol in Fig. S3B), and mice were killed 24 h after the last injection.
Effect of miR-146a on neuronal excitability and acute seizure in naive mice. In the model
of acute seizures, different groups of mice were injected icv, ipsilaterally to kainate or
bicuculline injection, with a single mimic, or negative control, injection at different time
10
points (i.e., 1 h, 24 h, 72 h or 7 days) before intrahippocampal kainic acid, or 24 h before
intrahippocampal bicuculline (n=6-10 each group) (protocol in Fig. S4B). A cohort of mice
similarly injected with mimic- or negative control (n=5-7 each group) was used for testing
neuronal excitability in acute hippocampal slices, 24 h after injection (Fig. S1E). A different
group of naive mice (n=6 each group) received repetitive mimic or negative control
injections (one injection every three days for a total of five injections; protocol in Fig. S4C),
then 24 h or 7 days after the last injection, mice received intrahippocampal kainate (Fig.
S3D). The time-dependent effect of mimic on acute seizures was used as a
pharmacodynamic measure of its tissue clearance.
miR-146a effect on disease progression. In the model of SE-induced epilepsy, 10 µg of
mimic or its negative control was injected icv (ipsilateral to intra-amygdala kainate
injection) in mice at day 1 (onset of epilepsy) and at day 4, 7, 10, 13 thereafter (repetitive
injection protocol, Fig. S3B), then treatment was stopped (n=15 each group).
Mouse model of acute symptomatic seizures
Mice (n=128) were surgically implanted under general gas anesthesia (1-3% isoflurane in
O2) and stereotaxic guidance (Maroso et al., 2010; Iori et al., 2013). Two nichrome-
insulated bipolar depth electrodes (60 µm OD) were implanted bilaterally into the dorsal
hippocampus (from bregma, mm: nose bar 0; anteroposterior –1.8, lateral 1.5 and 2.0
below dura mater) (Franklin and Paxinos, 2008). A 23-gauge guide cannula was
unilaterally positioned on top of the dura mater and glued to one of the depth electrodes
for the intrahippocampal injection of kainic acid or bicuculline methiodide. One additional
guide cannula was positioned on top of the dura mater (from bregma, mm: nose bar 0;
anteroposterior 0, lateral 0.9) (Franklin and Paxinos, 2008) ipsilateral to the
intrahippocampal injection for icv injections of either miR-146a mimic, its antagomiR, or the
respective negative controls (protocols in Fig. S4B). Two screw electrodes were positioned
11
over the nasal sinus and the cerebellum, and used as ground and reference electrodes,
respectively. The electrodes were connected to a multipin socket and, together with the
injection cannula were secured to the skull by acrylic dental cement. The top of each cage
had a commutator, which allows the recording cable attached to the multipin socket
anchored to the mouse head to swivel freely. The commutator is connected to a data
acquisition set up that collects the EEG data from each mouse, and send them to a
computer where the EEG tracing can be displayed on the screen and stored for later
analysis. Intrahippocampal injection of kainic acid or bicuculline was done in freely moving
mice, 7 days after surgery (Maroso et al., 2010; Iori et al., 2013). The drugs (kainic acid 7
ng in 0.5 µl; bicuculline methiodide 51 ng in 0.5 µl; Sigma-Aldrich, Saint Louis, MO, USA)
were dissolved in 0.1 M phosphate-buffered saline (PBS, pH 7.4) and injected (in 30 sec)
unilaterally in the dorsal hippocampus in lightly restrained mice by using a needle
protruding 2.0 mm from the bottom of the guide cannula (Fig. S4A). The needle was left in
place for one additional minute to avoid backflow through the guide cannula, then removed
and mice were freely moving for the rest of the experiment. Doses of kainic acid and
bicuculline were chosen to induce EEG ictal episodes in the hippocampus in 100% of mice
without mortality. These seizures are sensitive to both anti-inflammatory treatments and
genetic manipulation of inflammatory pathways (Vezzani et al., 2000; Balosso et al., 2008;
Maroso et al., 2010; Maroso et al., 2011b; Iori et al., 2013).
Acute seizure assessment and quantification have been extensively described before
(Balosso et al., 2008; Maroso et al., 2010; Maroso et al., 2011a; Iori et al., 2013; Balosso
et al., 2014). Briefly, a 30 min EEG recording was done before kainic acid or bicuculline
injection to assess baseline activity, and for 180 min after the drug injection. At least 30
min EEG recording similar to baseline was required before ending the experiment. Ictal
episodes (Fig. S4A) are characterized by high-frequency (7-10 Hz) and/or multispike
12
complexes and/or high-voltage (700 µV-1.0 mV vs 100-300 µV during pre-injection
baseline) synchronized spikes simultaneously occurring in the injected and contralateral
hippocampi, lasting 50 sec on average. Seizure activity was quantified by measuring the
onset time elapsed from kainic acid or bicuculline injection to the occurrence of the first
EEG seizure and the number and total duration of seizures (reckoned by summing up the
duration of each ictal episode during the EEG recording period). Seizures occurred with an
average latency of about 10 min from kainic acid or bicuculline injection, then recurred for
about 120 min from their onset, and were associated with motor arrest of the mice. At the
end of the experiment, mice were killed by decapitation under deep penthotal sodium (100
mg/kg, i.p.) anaesthesia, and the correct positioning of the injection needle and electrodes
was verified in 40 µm cryostat sections from post-mortem frozen brains.
Mouse model of SE-induced epilepsy
Mice (n=88) were surgically implanted under general gas anesthesia (1-3% isoflurane in
O2) and stereotaxic guidance. A 23-gauge guide cannula was unilaterally positioned on top
of the dura mater for the intra-amygdala injection of kainic acid (from bregma, mm: nose
bar 0; anteroposterior-1.06, lateral -2.75) (Franklin and Paxinos, 2008) (Fig. S3A). In mice
reported in Fig. 2 (n=15), Fig. 3A,B (n=22) and Fig. S2, panels g-o (n=8), a nichrome-
insulated bipolar depth electrode (60 µm OD) was implanted in the dorsal hippocampus
(from bregma, mm: nose bar 0; anteroposterior –1.8, lateral 1.5 and 2.0 below dura mater)
(Franklin and Paxinos, 2008) ipsilateral to the injected amygdala and a cortical electrode
was placed onto the somatosensory cortex in the contralateral hemisphere. In different
cohorts of mice (n=23) included in Fig. 2 (n=16) and in Fig. 3C (n=7), the cortical electrode
was substituted by a recording bipolar electrode in the injected amygdala. We used these
different recordings sites in order to determine if EEG seizures simultaneously occur in
hippocampus, cortex and injected amygdala, and to assess the effect of treatments. Ictal
13
activity was always associated with generalized motor convulsions. Seven additional mice
were similarly implanted and received CBZ-placebo pellet (see legend Fig. 3). In all mice,
two screw electrodes were positioned over the nasal sinus and the cerebellum, and used
as ground and reference electrodes, respectively. Additionally, in mice depicted in Fig. 2
and in Fig. S2, one guide cannula was positioned on top of the dura mater (from bregma,
mm: nose bar 0; anteroposterior 0, lateral 0.9) (Franklin and Paxinos, 2008) ipsilateral to
the injected amygdala for icv injection of 10 µg miR-146a mimic or its negative control.
Electrodes were connected to a multipin socket (PlasticOne Inc., USA). One week after
surgery, mice were connected to the video-EEG set up and a 60 min baseline recording
was done before inducing SE.
SE induction. Kainic acid (0.3 µg in 0.2 µl) was unilaterally injected in the basolateral
amygdala in freely moving mice (n=88) using a needle protruding of 3.9 mm below the
implanted cannula (Fig. S3A). SE developed after approximately 10 min from kainic acid
injection, and was defined by the appearance of continuous spikes with a frequency >1.0
Hz. Spikes were defined as sharp waves with an amplitude at least 2.5-fold higher than
baseline and lasting <20 msec, or as a spike-and-wave with a duration of <200 msec
(Frigerio et al., 2012). The end of SE was determined by inter-spike interval >2 sec. After
40 min from SE onset, mice received diazepam (10 mg/kg, intraperitoneally, i.p.) to
improve their survival rate. SE was successfully evoked in 80 out of 88 mice, and it lasted
for 8.1 ± 0.5 h. Six mice died within few hours up to 3 days after SE induction, therefore 74
mice were used for the subsequent experiments. The total number of spikes was
measured in mice during the first 12 h after kainic acid administration (Suppl. Fig. 3C;
Clampfit 9.0, Axon Instruments, Union City, CA, U.S.A).
Animal use. Thirty SE-exposed mice were used for testing the effect of miR-146a mimic vs
its negative control (n=15 each group) on spontaneous seizure progression and frequency
14
(Fig. 2). Twenty-nine mice were used for testing the effect of pharmacological treatments
on spontaneous seizure progression and frequency: 22 mice were injected with VX-
765+CyP or their vehicles (n=11 each group; Fig. 3A,B) and 7 mice were treated with
CBZ-in-food (Fig. 3C). Seven SE-exposed mice were fed with CBZ placebo pellet. Eight
SE-exposed mice were used for in situ hybridization analysis of miR-146a (Fig. S2).
Chronic seizures assessment and quantification, and treatment schedule. Spontaneous
seizure development after SE has been described before (Mouri et al., 2008; Jimenez-
Mateos et al., 2012; Liu et al., 2013; Gu et al., 2015). Spontaneous generalized motor
seizures develop 5.3 ± 0.2 days after SE (n=59 including treated mice and their controls;
Figs. 2 and 3). In negative control- or vehicle- injected mice, the daily number of seizures
remains relatively stable for the first 45 days after epilepsy onset, then seizure frequency
increases by about 3-fold reaching a stable baseline thereafter (Fig. S3B, n=26). All mice
were video-EEG recorded continuously (24/7) from the onset of SE until the onset of
epilepsy (i.e., two unprovoked spontaneous seizures occurring at least 48 h from the end
of SE). After the onset of epilepsy in each mouse, animals were randomized in control and
treatment groups (treatment protocols are described in Fig. S3B) and injected with 10 µg
mimic or its negative control (n=15 each group) (Fig. 2), or with a combination of the
clinically used drug VX-765, a selective inhibitor of Interleukin Converting
Enzyme/Caspase-1 which blocks both IL-1β biosynthesis (Wannamaker et al., 2007) and
HMGB1 release (Keyel, 2014) (100 mg/kg, ip, dissolved in deionized H202 containing 0-5%
HEC and 0.1% Tween-80) and the investigational drug Cyanobacterial LPS, a TLR4
antagonist (Macagno et al., 2006; Maroso et al., 2010) (CyP, 1 mg/mouse, ip, dissolved in
saline) or their respective vehicles (n=11 each group; Fig. 3A,B); or mice were fed with
CBZ-in-food (5 mg/g pellet; 20 mg/daily/mouse; n=7; Fig. 3C). Video-EEG was
continuously recorded (24/7) during treatment time (which differs depending on the

15
protocol, see Fig. S3B), then mice were temporarily disconnected from the EEG set up,
and left in their home cage until they were again monitored (24/7) starting from day 45
after epilepsy onset until day 74 (Fig. S3B; Figs. 2 and 3). One group of mimic- or negative
control-treated mice (n=7 out of 15 each group) was EEG recorded from day 60 until day
74 (Fig. 2). Spontaneous seizures are EEG paroxysmal events lasting 30-60 sec on
average and simultaneously occurring in amygdala, hippocampus and fronto-parietal
cortex, bilaterally (Fig. S3A). EEG seizures were always accompanied by generalized
motor convulsions as assessed using WFL-II/LED15W infrared video-cameras (Videor
Technical, GmbH, Germany) syncronized with the EEG recording system. We reckoned
the total number of spontaneous seizures during the recording period, and divided them by
the total number of recording days, in order to estimate the number of daily seizures (Figs.
2 and 3). EEG activity was recorded using the Twin EEG Recording System (version
4.5.3.23) connected with a Comet AS-40 32/8 Amplifier (sampling rate 400 Hz, high-pass
filter 0.3 Hz, low-pass filter 70 Hz, sensitivity 2000 mV/cm; Grass-Telefactor, West
Warwick, R.I., USA). Digitized video-EEG data were processed using the Twin record and
review software. EEG analysis in acute and chronic models was done by two independent
investigators blinded to the treatment, who visually reviewed all the EEG tracings.
Deviation of ≤5% from concordance was considered acceptable; otherwise EEG tracing
was additionally analyzed by a third person.
One additional experimental group consisted of mice with electrode and cannula implanted
under the same surgical conditions as described above. These mice were not exposed to
SE and were used as sham controls where appropriate.

16
Histological evaluation of cell loss
At the end of EEG recordings, mice were deeply anaesthetized using penthotal sodium
(100 mg/kg, ip) and perfused via ascending aorta with 50 mM cold PBS (pH 7.4), followed
by chilled 4% paraformaldehyde (PAF) in 50 mM PBS. The brains were post-fixed for 90
min at 4°C, and then transferred to 20% sucrose in PBS for 24 h at 4°C, then rapidly
frozen in –50°C isopentane for 3 min and stored at –80°C until assayed. Serial coronal
sections (40 µm) were cut on a cryostat throughout the septal-temporal extension of the
hippocampus (-0.94 to -3.64 mm from bregma) (Franklin and Paxinos, 2008) and collected
in 0.1 M PBS. We prepared 12 series of 5 sections each (8 series including the septal and
4 series including the temporal aspect of the hippocampus). In each series, the 1st and 2nd
sections were stained for Nissl. The same anatomical structures were retained within each
series of sections from control and respective experimental mice. Quantification analysis of
cell damage was done by Nissl-staining in 4 slices in each mouse brain by two
independent investigators blinded to the identification code of the samples as previously
described (Balosso et al., 2008; Iori et al., 2013). High-power fields (20X magnification;
Olympus) along the CA1 and CA3 pyramidal cell layers and the hilus were acquired. In
each section, neuronal cell loss was quantified by measuring the area (µm2) occupied by
Nissl-stained neurons in CA1 and CA3 pyramidal, and by reckoning the number of Nissl-
stained neurons in the hilus (Balosso et al., 2008; Iori et al., 2013). Data obtained in each
slice/area/brain were averaged providing a single value for brain area/mouse, and this
value was used for statistical analysis. Since the volume of the septal hippocampus
(McDaniel et al, 2001) was similar in the experimental groups (sham, 8.7 ± 0.5 mm3, n=5;
epileptic mice treated with negative control, 8.3 ± 0.3 mm3, n=7; epileptic mice treated
with mimic, 7.9 ± 0.4 mm3, n=7), it is unlikely that cell loss quantification was affected by
tissue shrinkage or major changes in extracellular space. The occurrence of any bias in

17
counting should similarly affect control and experimental samples since these samples
underwent the same procedures in parallel.
Western blot
Mice were deeply anesthetized using penthotal sodium, then perfused via ascending aorta
with 50 mM ice-cold PBS (pH 7.4) for 1 min to remove blood, and decapitated. The
hippocampus ipsilateral to the injection of either mimic or antagomiR was rapidly dissected
out at 4°C (n=8 each group). Tissue was homogenized (30 mg tissue/150 µl
homogenization buffer) as previously described (Balosso et al., 2009). Total proteins (50
µg per lane; Bio-Rad Protein Assay, Bio-Rad Laboratories, Munchen, Germany) were
separated using SDS-PAGE 10% acrylamide, and each sample was run in duplicate.
Proteins were transferred to Immobilon-P polyvinyldene difluoride (PVDF) membranes
(Millipore BV, Amsterdam, Netherlands) by electroblotting. For immunoblotting, we used
an anti-IRAK-2 (1:1000, Santa Cruz Biotechnology, Cat#sc-130788, Heidelberg, Germany)
and anti-TRAF-6 (1:500, Abcam, Cat#ab33915, Cambridge, MA, USA) rabbit polyclonal
antibodies. Immunoreactivity was visualized with enhanced chemiluminescence (ECL)
using peroxidase-conjugated goat anti-rabbit (1:1000; Sigma, Cat#A0545) IgG as
secondary antibody. Densitometric analysis of immunoblots was done by Quantity One
software (Bio-Rad Laboratories) to quantify the changes in protein levels using film
exposures with maximal signals below the photographic saturation point. Optical density
values in each sample were normalized using the corresponding amount of β-actin
(1:20000, Santa Cruz Biotechnology, Cat#sc-47778).
In situ hybridization
Mice were deeply anaesthetized using penthotal sodium (100 mg/kg, ip) and perfused via
ascending aorta with 50 mM cold PBS (pH 7.4) followed by chilled 4% paraformaldehyde
(PAF) in 50 mM PBS. The brains were post-fixed at 4°C. The hybridizations were done on
5 µm sections of paraffin embedded materials, as previously described (Budde et al.,

18
2008; Gorter et al., 2014; van Scheppingen et al., 2016). A 5’ fluorescein (FAM) labelled
antisense oligonucleotide containing Locked Nucleic Acid (LNA; indicated with “I”) and 2'-
o-methyl modification (indicated with “m”) (5’FAM-
lAmAmClCmCmAlTmGmGlAmAmUlTmCmAlGmUmUlCmUmClA; Ribotask ApS, Odense,
Denmark) was used. The probe was hybridized at 56o C for 1 h and the hybridization was
detected with alkaline phosphatase (AP) labeled anti-fluorescein (Roche Applied Science,
Basel, Switzerland). NBT (nitro-blue tetrazolium chloride)/BCIP (5-bromo-4-chloro-3'-
indolyphosphate p-toluidine salt) was used as chromogenic substrate for AP. Negative
control assay was performed without probe (sections were blank). The images were
captured with an Olympus microscope (BX41, Tokyo, Japan) equipped with a digital
camera (DFC500, Leica Microsystems-Switzerland Ltd., Heerbrugg, Switzerland) and
processed by Fiji (ImageJ2). In a first step, colour deconvolution (RGB colour space) was
performed in order to separate positive cells from background according to the following
channel parameters: red: 0.21408768, green: 0.8171735, blue: 0.4782719. Then a
threshold (= 233) was applied and subsequently the images were converted to 8 bit gray-
scale. The positive pixels/total assessed pixels, indicated as staining percentage area was
used for subsequent statistical analysis. For double-staining, combining in situ
hybridization with immunocytochemistry, the sections were first processed for in situ
hybridization, then for immunocytochemistry with monoclonal mouse GFAP (1:4000,
Sigma, San Louis, Mo, USA) (Gorter et al., 2014). Signal was detected using the
chromogen 3-amino-9-ethylcarbazole (Sigma-Aldrich). This methodology does not
distinguish between endogenous miR-146a and the injected mimic.
Real-time quantitative polymerase chain reaction analysis (RT-qPCR)
Mice were deeply anesthetized using penthotal sodium, then perfused via ascending aorta
with 50 mM ice-cold PBS (pH 7.4) for 1 min to remove blood, and decapitated. Hippocampi
ipsilateral to the icv injection side were rapidly dissected out at 4°C in RNAse free

19
environment, immediately frozen on dry ice and stored at –80°C until assay. cDNA was
generated using Taqman MicroRNA reverse transcription kit (Applied Biosystems)
according to manufacturer’s instructions.
Expression of miR-146a, miR-21, miR-155 and the U6B small nuclear RNA gene (rnu6b)
were analysed using Taqman microRNA assays (Applied Biosystems), which were run on
a Roche Lightcycler 480 thermocycler (Roche Applied Science, Basel, Switzerland)
according to manufacturer’s instructions (Iyer et al., 2012). The PCR reactions were
prepared using an automated pipetting system (epMotion 5075 Eppendorf) and each
sample was run in triplicate. Quantification of data was performed using the computer
program LinRegPCR in which linear regression on the Log(fluorescence) per cycle number
data is applied to determine the amplification efficiency per sample (Ramakers et al.,
2003; Ruijter et al., 2009). Data were normalized on the expression levels of the
housekeeping gene rnu6b.
Extracellular recordings
Postnatal day 21-28 mice were icv injected with PBS (n=8) or with 10 µg mimic or its
negative control (n=5-7 mice/each group) under gas anaesthesia. One or 24 h after
injection, mice were deeply anesthetized using penthotal sodium and decapitated. Coronal
brain slices (350 µm; n=12 slices/each treatment group) were cut in ice-cold modified
artificial cerebrospinal fluid (aCSF) containing the following (in mM): 87 NaCl, 2.5 KCl, 1
NaH2PO4, 75 sucrose, 7 MgCl2, 24 NaHCO3, 11 D-glucose, and 0.5 CaCl2. Slices were
then transferred into an incubating chamber and submerged in aCSF containing (in mM):
130 NaCl, 3.5 KCl, 1.2 NaH2PO4, 1.3 MgCl2, 25 NaHCO3, 11 D-glucose, 2 CaCl2 and
constantly bubbled with 95% O2 and 5% CO2 at room temperature. Slices were incubated
in this condition for at least 1 h, then transferred in a submerged recording chamber,
perfused with oxygenated aCSF at a rate of 2 ml/min and a constant temperature of 28-
30ºC. In a different set of PBS-injected mice (n=4 each group), slices (n=10-11/each

20
treatment group) were incubated with IL-1Ra (2 µg/ml) or Lps-Rs (100 ng/ml) for 60 min
after the initial 60 min recovery time as well as during recordings. Extracellular recordings
of population spikes (PS) were obtained in CA1 pyramidal layer using glass micropipettes
filled with 3 M NaCl. Stimulation of Schaffer collaterals was delivered by a Constant
Voltage Isolated Stimulator (Digitimer Ltd., Welwyn Garden City, UK) through bipolar
twisted Ni/Cr stimulating electrode.PS amplitude was measured as the amplitude of the
first negative deflection overriding the field EPSP waveform. The input-output curves were
plotted as the relationship of PS amplitude versus stimulus intensity (2V steps). Four
consecutive PS were averaged for each stimulus intensity. Data were amplified and
filtered (low filter 10 Hz, high filter 3 kHz) by a DAM 80 ACDifferential Amplifier (World
Precision Instruments, Sarasota, FL, USA), and digitized at 10 kHz by a Digidata 1322
(Molecular Devices, Foster City, CA, USA).
Statistical analysis
Data are the mean ± s.e.m. (n=number of individual samples). Statistical analysis was
done by Graph-Pad Software using absolute values. Two-group comparison was made by
Mann-Whitney test (Fig. 1B,C,D; Fig. S2; Fig. S1A,B; Fig. S3D). The random-effects
model (Borenstein et al., 2009) was used to estimate the frequency of spontaneous
seizures (average number of seizures/day) followed by the DerSimonian and Laird method
to estimate the variance among the average daily seizures. Two-group comparison was
done by Chi-square test (Fig. 2 and Fig. 3). Multi-group comparison was done by Kruskal-
Wallis test (Fig. 1A) or by two-way ANOVA for repeated measures followed by Bonferroni
post-hoc test (Fig. S2E). Two-sided statistical tests were used. Differences between
groups were reported as statistically significant for values of p≤0.05.
21
RESULTS
miR-146a forebrain levels are modulated by its oligonucleotide mimic or antagomiR
Naive mice. We developed a treatment protocol for modifying the forebrain levels of miR-
146a (Fig. 1A,C) in naive mice for exploring if this intervention affects neuronal excitability
(Fig. 1B,D; Fig. S1E). We used either a specific synthetic oligonucleotide analog of miR-
146a (mimic), or its antisense oligonucleotide (antagomiR), and their specific non-targeting
scrambled oligonucleotides (negative controls) as control solutions. An icv injection of 10
µg (0.7 nmol) in 1 µl of mimic (Lehmann et al., 2012) done in naive mice induced a 4-fold
increase on average in hippocampal miR-146a levels measured 24 h later, then declining
within 72 h (Fig. 1A). This increase approximates the 3- to 5-fold raise measured in the
hippocampus during epileptogenesis in animal models, and in human epilepsy specimens
(Aronica et al., 2010; Prabowo et al., 2015). miR-146a mimic injection did not affect other
associated miRNAs (e.g., miR-21 and miR-155; Fig. S1D). Conversely, 24 h after the icv
injection of 1.7 nmol antagomiR in naive mice, hippocampal miR-146a level were
decreased by 50% on average (Fig. 1C).
In situ hybridization histochemistry showed that 10 µg mimic significantly increased miR-
146a level in forebrain neurons of naive mice (Fig. S2, panels a-c vs d-f). No degenerative
or glial cell reactive changes were observed. This mimic dose induced a decrease in
hippocampal levels of two key proteins mediating the IL-1R1/TLR4 signaling, namely
IRAK-2 and TRAF-6 (Fig. S1A,C), in accordance with previous evidence reporting that
these proteins are the primary targets of this miRNA (Taganov et al., 2006; O'Neill, 2008;
Boldin et al., 2011; Iyer et al., 2012; Zeng et al., 2013; van Scheppingen et al., 2016); a
negative correlation was found between miR-146a and IRAK-2 or TRAF-6 levels (Fig.
S1B). These results, therefore, show that mimic injection in naive mice reduces IRAK-2
and TRAF-6 by increasing miR-146a levels in neurons (Fig. S2, panels a-f; quantification
in p-r).
22
Status epilepticus (SE) exposed mice. Next, we injected the mimic or its negative control in
SE-exposed mice when they developed the first two spontaneous seizures (i.e., after
epilepsy onset) to determine the cell types showing the increase in miR-146a by in situ
hybridization analysis. We used the same injection protocol designed to test mimic's
therapeutic potential in the disease-modification study (Fig. S3B). We analyzed miR-146a
cellular expression 24 h after the last mimic or negative control injection. In epileptic mice
injected with the negative control, miR-146a levels were significantly increased in both
neurons and astrocytes (arrowheads) compared to similarly injected sham mice (Fig. S2,
panels g-i vs a-c). This finding is in accordance with previous evidence reporting the
endogenous increase in miR-146a in these cell populations in a rat model of
epileptogenesis (Aronica et al., 2010). In epileptic mice, mimic injection further augmented
miR-146a levels (Fig. S2, panels j-l vs g-i) in both neurons and GFAP-positive astrocytes
(Fig. S2, panels m-o). This injection protocol therefore enhanced the miR-146a levels in
neurons and astrocytes of epileptic mice above those induced by the disease itself (Fig.
S2, quantification in panels p-r).
The dose of 10 µg mimic was used in the subsequent in vivo experiments (protocols in
Fig. S3B and Fig. S4B,C).
The modulation of miR-146a hippocampal level in naive mice affects neuronal
excitability and acute seizures
We examined whether changes in miR-146a forebrain levels in naive mice affect neuronal
excitability and, as a consequence, their susceptibility to acute seizures. We injected naïve
mice with either the 10 µg miR-146a mimic or 12 µg cumulative dose of its antagomiR, 24
h before an intrahippocampal convulsive dose of kainic acid (Maroso et al., 2010), an
agonist of glutamate receptors (protocol in Fig. S4B,C). The mimic significantly delayed
the onset of acute seizures, and reduced their frequency and duration by approximately
23
50% (Fig. 1B). This effect was similar to that previously attained using specific IL-
1R1/TLR4 receptor antagonists in the same model (Vezzani et al., 2000; Vezzani et al.,
2002; Maroso et al., 2010; Maroso et al., 2011a). The effect of mimic on acute seizures
persisted for 72 h (Fig. 1B), in the absence of a sustained increased in miR-146a level
(Fig. 1A). The mimic did not affect seizures when injected 1 h or 7 days before kainic acid
(Fig. 1B), likely reflecting the time required for signal proteins (IRAK-2, TRAF-6)
downregulation (Iyer et al., 2012) and their re-synthesis after miR-146a returned to
baseline level (Fig. 1A). The injection of 5 µg mimic was ineffective on seizures (number of
seizures, mimic: 6.5 ± 0.2; negative control, 6.7 ± 0.3; time spent in seizures, mimic: 5.5 ±
0.2; negative control, 5.6 ± 0.3; n=6 mice each group).
The mimic (10 µg) also significantly decreased seizures in mice intrahippocampally
injected with bicuculline (Vezzani et al., 2000; Maroso et al., 2010), a GABAA receptor
blocker: number of seizures (mimic, 3.7 ± 0.3; negative control, 7.8 ± 0.3); time spent in
seizures (mimic, 1.7 ± 0.3; negative control, 5.2 ± 0.3 min) and delayed seizure onset
(mimic, 11.4 ± 1.0; negative control, 7.2 ± 0.6 min) (n=10 mice each group, p<0.01 by
Mann-Whitney test). Thus, the effect of mimic was independent of the convulsive drug
triggerring seizures. Overall, these findings predict that knock-down of endogenous miR-
146a by its antagomiR should increase seizures. In accordance, the antagomiR mediated
a significant increase in seizure number and duration, and accelerated the time to seizure
onset (Fig. 1D).
The inhibitory effect of mimic on acute seizures is an indicator of reduced neuronal
excitability, therefore, we tested this idea in acute hippocampal slices prepared from mice
injected 24 h before with either 10 µg mimic- or its negative control. Schaffer collaterals
were stimulated and population spike amplitude was measured in stratum pyramidale CA1
(Fig. S1E). Slices from mimic-injected mice showed a right shift of the input-output curve
(population spike amplitude vs stimulus intensity) compared to control slices, showing that
24
neuronal excitability was reduced. A similar shift was observed in hippocampal slices
obtained from naive mice after 1 h pre-incubation with either Lps-Rs (100 ng/ml) or IL-1Ra
(2 µg/ml), antagonists of TLR4 and IL-1R1 (Vezzani et al., 2000; Vezzani et al., 2002;
Maroso et al., 2010), respectively. Overall, these data demonstrate that miR-146a mimic
induces a decrease in both hippocampal excitability and acute seizures by inhibiting the
IL-1R1/TLR4 signaling in neurons via a reduction of key signal transduction proteins.
miR-146a mimic arrests epilepsy progression and decreases chronic seizures in a
mouse model of acquired epilepsy
To determine whether miR-146a mimic interferes with epilepsy course, we studied mice
developing spontaneous seizures after SE provoked by intra-amygdala kainate injection
(Shinoda et al., 2004; Li et al., 2008; Mouri et al., 2008; Jimenez-Mateos et al., 2012; Liu
et al., 2013; Gu et al., 2015) (Fig. S3A-C). This is a widely used model of acquired
epilepsy induced by SE (Shinoda et al., 2004; Li et al., 2008; Mouri et al., 2008; Liu et al.,
2013; Gu et al., 2015), an acute and severe inciting event that causes epilepsy in humans
(Tsai et al., 2009; Rossetti et al., 2013; Harward and McNamara, 2014; Vezzani et al.,
2015a). Either the mimic or its negative control was injected in two randomized cohorts of
electrode-implanted SE-exposed mice under continuous video-EEG monitoring (Fig. 2).
Mice were exposed to SE of similar severity and duration (Fig. S3C). At the onset of
epilepsy in each mouse (i.e., after the occurrence of the first two spontaneous seizures), a
total of five injections of either 10 µg mimic or its negative control were done, each
injection was given every 72 h, then treatment was stopped (protocol in Fig. S3B). This
repetitive injection protocol was designed for mantaining therapeutic levels of mimic for 2
weeks, as suggested by the evidence that its inhibitory effect on acute seizures lasts for
72 h then elapsing by 7 days after the last administration (Fig. 1B and Fig. S3D). This set
of evidence supports that the mimic is cleared from the brain tissue within one week after

25
the last injection, thus supporting that our injection protocol allows to test potential
disease-modification effects of the treatment (i.e. a therapeutic effect overlasting the
presence of the mimic in the tissue).
As expected by the natural history of the disease in this model (Fig. 2A, n=15; Fig. S3B,
n=26), negative control-injected mice showed an average 3-fold progression in the
frequency of spontaneous seizures over 2.5 months of video-EEG monitoring from the
onset of epilepsy. Seizure progression was prevented in mice treated with miR146a mimic
compared to negative control-injected mice (Fig. 2B vs A). Overall, at 2.5 months from
disease onset, the mimic-treated mice showed a 80% reduction on average in the number
of seizures compared to control mice (p<0.01 by Chi-square test, n=15 mice each group),
and 50% regression in seizure frequency compared to seizures at the beginning of the
disease (i.e., the first 16 days from disease onset; p<0.01 by Chi-square test) (Fig. 2B).
Accordingly, the maximal inter-seizure interval measured between 2.0 and 2.5 months was
about 4-fold longer in mimic-treated mice (7.2 ± 1.1 day, n=15, p<0.01 by Mann-Whitney
test) vs control mice (1.7 ± 0.3 day). The average seizure duration was increased in
negative control-injected mice at 2.5 months (51.4 ± 1.8 sec, p<0.01 by Mann-Whitney
test) compared to disease onset (40.2 ± 2.3 sec), and this parameter was not affected by
the mimic.
The extent and pattern of cell loss in the hippocampus of mimic-treated mice was not
different from control mice, as assessed in Nissl-stained sections in mice killed at 2.5
months after the end of EEG recordings (negative control, 24±5% (n=7); mimic, 16±2%
(n=7) reduction in hippocampal CA1 pyramidal neurons vs sham mice (n=5); negative
control, 18±4%; mimic, 17±5% reduction in hippocampal CA3 pyramidal neurons vs sham
mice; negative control, 32±7%; mimic, 26±4% reduction in hilar neurons sham mice). This
is conceivable considering that cell loss mostly develops within one week from the

26
induction of SE therefore before the treatment was applied to mice (Mouri et al., 2008; Noé
et al., 2013).
Antiinflammatory drugs blocking IL-1R1/TLR4 signaling reproduce the mimic
therapeutic effects
We studied whether drugs blocking the IL-1R1/TLR4 signaling prevent seizure progression
and induce seizure remission, as shown by the mimic intervention. We used the clinically
tested drug VX-765 (a selective inhibitor of Interleukin Converting Enzyme which blocks IL-
1β biosynthesis and HMGB1 release) (Wannamaker et al., 2007; Maroso et al., 2011a;
Keyel, 2014) and the investigational drug Cyanobacterial LPS (CyP, an antagonist of
TLR4) (Macagno et al., 2006; Maroso et al., 2010) (Fig. 3A,B). We combined these drugs
(doses and treatment schedule are reported in Fig. S3B and legend) for attaining efficient
and simultaneous blockade of the IL-1R1 and TLR4 signaling. In fact, we showed
previously that inhibition of IL-1R1 signaling in a rat model of epileptogenesis is not
sufficient to prevent TLR4 receptor activation (Noé et al., 2013) which contributes itself to
spontaneous seizures generation (Iori et al., 2013). This drug combination was given daily
for one week starting at the time of epilepsy onset in each mouse, then the treatment was
stopped and mice were followed up for the next 2.5 months. Drugs prevented seizure
progression and reduced by 90% on average spontaneous seizure frequency as
compared to vehicle-injected mice (Fig. 3A,B). Moreover, drug-treated mice showed an
average 70% regression in chronic seizure frequency compared to their seizure baseline
at beginning of the disease (Fig. 3B).
Overall, the data show that transient blockade of the IL-1R1/TLR4 pathway after epilepsy
onset using two complementary treatment approaches (namely, mimic or antiinflammatory
drugs) significantly improves the clinical course of the disease by drastically reducing
spontaneous seizure recurrence by 80-90%. Animals did not show any behavioral sign of
27
toxicity during either epigenetic or drug treatment, as assessed by visual observation of
their motor activity and behavioral reactivity to touch or tail pinching in the recording cage.
Body weight growth also did not differ among the various experimental groups at the end
of treatment (mimic, 27.4 ± 0.6 g, n=15; VX-765+CyP, 27.7 ± 0.7 g, n=11; vehicle, 27.8 ±
0.6 g, n=26; sham, 28.1 ± 0.7 g) and in the chronic epilepsy phase (mimic, 29.9 ± 0.9; VX-
765+CyP, 31.7 ± 0.6; vehicle, 29.5 ± 0.5; sham, 32.5 ± 0.7) as compared with their
respective body weight before treatment was started (mimic, 27.1 ± 0.5; VX-765+CyP,
26.7 ± 0.6; vehicle, 27.5 ± 1.1; sham, 27.7 ± 0.2).
Next, we studied whether targeting of the IL-1R1/TLR4 signaling represents an
improvement over current AED treatment options (Fig. 3C). We tested different doses of
carbamazepine (CBZ), an AED of choice in the clinical setting (Iyer and Marson, 2014).
CBZ was given in food pellet at different concentrations of 2.5, 5.0, 10.0 mg/g pellet for 2
weeks to naive mice to attain steady-state plasma levels within the therapeutic range
during the treatment period. Considering that CBZ-in-food daily intake in naive mice was
4.3 g on average (Fig.S5A), the corresponding dose of CBZ in each treatment group was
about 10, 20, 40 mg CBZ daily/mouse, respectively. As shown in Fig. S5C, plasma levels
of CBZ+CBZ-E were within therapeutic range using 5.0 and 10.0 mg/g CBZ pellet (4-10
µg/ml; in accordance with Ali et al., 2012; Burianova and Borecka, 2015). Since 10 mg/g
CBZ provoked loss of body weight during treatment (Fig. S5B), we choose the dose of 5
mg/g CBZ-in-food (maximal tolerated dose) for the experiments in Fig. 3C. Epileptic mice
consumed CBZ-in-food for 2 weeks starting after disease onset in each mouse (Fig. S3B)
and their daily intake (~4.2 g) was was similar to naive mice. Treatment did not prevent
seizure progression nor reduced seizure frequency in chronic epileptic mice as compared
to their seizure frequency at disease onset (Fig. 3C) or vs vehicle controls (Fig. 3A).

28
DISCUSSION
This study identifies treatments with clinically relevant therapeutic effects based on
disease modification in a mouse model of acquired epilepsy. These effects are attained by
a transient inhibition of the IL-1R1/TLR4 signaling in forebrain using either epigenetic or
pharmacological approaches. In particular, we found that treatment with a synthetic miR-
146a mimic, which inhibits IL-1R1/TLR4 intracellular signaling (Aronica et al., 2010; Quinn
and O'Neill, 2011; Iyer et al., 2012; van Scheppingen et al., 2016), or with a combination of
drugs which prevent IL-1β biosynthesis and block TLR4 (Macagno et al., 2006;
Wannamaker et al., 2007; Maroso et al., 2010; Maroso et al., 2011a; Keyel, 2014), arrests
the progression of epilepsy in mice and reduces spontaneous chronic seizures up to 90%
as compared to the natural history of disease in control mice. This is a highly relevant
clinical endpoint considering that 50% seizure reduction determines meaningful drug
efficacy in patients (Mohanraj and Brodie, 2003). These two approaches result in strikingly
similar outcomes, thus providing the first preclinical evidence of a genuine disease
modification effect in an animal model of acquired epilepsy. Notably, treatments were
initiated after the onset of spontaneous seizures in each mouse, in order to mimic a
clinically feasible intervention in patients with diagnosed epilepsy. Although the therapeutic
agents were transiently applied for 1 to 2 weeks, a dramatic regression in spontaneous
seizures occurred at the end stage of the disease, i.e., 2.5 months after epilepsy onset,
and this effect was measurable already 1.5 months after the end of treatment, when the
injected agents were cleared from the tissue. Moreover, none of the agents modified the
early spontaneous seizures during treatment possibly due to the concomitant occurrence
of various pathogenic mechanisms triggered by SE, in addition to neuroinflammation, that
significantly contribute to ictogenesis at the beginning of the disease (first 2 weeks from
disease onset). This is at variance with the prominent anticonvulsive effects of

29
antiinflammatory treatments on acutely evoked seizures in naive mice (this study; Maroso
et al, 2010; Maroso et al, 2011a; Ravizza et al, 2006), or in chronic epileptic animals
(Maroso et al, 2010; Maroso et al, 2011a), suggesting that neuroinflammation is a
predominat mechanism of ictogenesis in these conditions. This set of evidence excludes
therefore that the long-term reduction in spontaneous seizures merely reflects a
symptomatic treatment effect and indicates that the interventions have modified the
epileptogenic network, thereby preventing disease progression.
The clinical relevance of our findings is underlined by the lack of disease-modification
effects of CBZ, a classical AED widely used for the symptomatic control of seizures in
human epilepsy (Mohanraj and Brodie, 2003), thus supporting the clinical evidence that
AEDs do not affect epileptogenesis (Temkin, 2001).
Our data indicate that the therapeutic effects attained by inhibition of the IL-1R1/TLR4
signaling relate to reversal of neuronal hyperexcitability provoked by receptor activation by
IL-1β and HMGB1 that are released during epileptogenesis. Accordingly, the activation of
IL-1R1/TLR4 signaling by these two endogenous ligands enhances seizure susceptibility
in animal models (Vezzani et al., 2000; Vezzani et al., 2002; Maroso et al., 2010; Maroso
et al., 2011a; Iori et al., 2013). Moreover, we found that naive mice treated with miR-146a
mimic, or hippocampal slices exposed to IL-1R1/TLR4 antagonists, displayed decreased
intrinsic neuronal excitability that was associated with a reduced propensity to generate
seizures. This effect is due to IRAK/TRAF6 mediated signaling inhibition in neurons where
miR-146a is increased following mimic treatment. We previously described that the pivotal
mechanism involved in IL-1R1/TLR4 modulation of neuronal excitability and seizures relies
upon increased neuronal calcium influx via ceramide/src kinase-mediated phosphorylation
of the NR2B-expressing NMDA receptors (Viviani et al., 2003; Balosso et al., 2008; Iori et
al., 2013; Balosso et al., 2014). Increased pre-synaptic calcium leading to glutamate
release (Pedrazzi et al., 2012) is also likely involved in the hyperexcitability mediated by
30
signaling activation. Although activation of IL-1R1/TLR4 has been implicated in cell loss
(Viviani et al., 2003; Balosso et al., 2014), we did not detect neuroprotection in the
hippocampus of mimic-treated mice although spontaneous seizures were drastically
reduced. This result is compatible with evidence that cell loss is mostly completed within
the first week after SE induction (Mouri et al., 2008); we cannot exclude therefore that
intervention before spontaneous seizures arise may be neuroprotective.
The IL-1R1/TLR4 signaling is classically described as a pivotal trigger of the inflammatory
cascade (Quinn and O'Neill, 2011; Keyel, 2014), and glial cells expressing IL-1R1 or TLR4
are chiefly involved in promoting and sustaining neuroinflammation in epilepsy (Aronica et
al., 2012; Devinsky et al., 2013). Moreover, increased miR-146a in human astrocytes was
shown to blunt IL-1R1/TLR4 mediated release of inflammatory cytokines (Iyer et al., 2012;
van Scheppingen et al., 2016). It is therefore conceivable that inhibition of this signaling in
glia, either due to the increased miR146a levels in astrocytes or to glial receptor blockade
by our drugs, led to a reduction of downstream inflammatory effector molecules thereby
contribute to the observed therapeutic outcomes (Vezzani, 2015).
IL-1R1/TLR4 signaling is activated in various structural/lesional forms of human epilepsy
that are often associated with a worse prognosis and with the development of
pharmacoresistant seizures (Pitkanen and Sutula, 2002; Schmidt and Sillanpaa, 2005;
Sarkis et al., 2012). This patient population may represent the elective target for
treatments that inhibit the IL-1R1/TLR4 pathway. Although epigenetic intervention in
human CNS diseases have not been attempted as yet, there is an intensive research for
delivering biologics directly into the seizure focus or intrathecally, or via nasal spray
preparation, to improve both therapeutic index and brain penetration (Yi et al., 2014).
Some of these approaches are already applied to deliver drugs into the human CNS,
particularly for brain tumors or pain. In principle, these interventions, together with
chemical modifications to prolong the mimic half-life, might be considered for clinical

31
translation of miRNA-based therapeutic strategies in epilepsy (see also Lee et al, 2016;
Yuan et al, 2016). A more prompt translation, however, can be envisaged using drugs
blocking the IL-1R1/TLR4 signaling, such as VX-765 and anakinra (Kenney et al., 2016;
Bialer et al., 2013; Jyonouchi and Geng, 2016), which have been already tested in
humans with clinical signs of efficacy and safety profile (see also Leon et al., 2008; Lepper
et al., 2010).
In summary, our findings provide the first proof-of-concept evidence for disease-
modification in epilepsy using specific interventions transiently applied after disease onset.
The data show that the burden of seizures can be drastically reduced by targeting
disease-relevant mechanisms. This is a novel therapeutic approach for epilepsy as
compared to chronic administration of AEDs which mainly provide a symptomatic control
of seizures.
Acknowledgements
This work was supported by the European Union’s Seventh Framework Programme
(FP7/2007-2013) under grant agreement n°602102 (EPITARGET; AV and EA) and n°
602391 (EPISTOP; AE); Fondazione Monzino (AV); the National Epilepsy Fund “Power of
the Small” and the Hersenstichting Nederland (NF-13-1VI). Valentina Iori was supported
by a PhD fellowship from NF-13-1VI and Milica Cerovic by a fellowship from Fondazione
Umberto Veronesi. We thank Michele Mutti, Alberto Pauletti and Gaetano Terrone, Jasper
Anink and Angelika Mühlebner for their contribution to part of the experiments and Luca
Porcu for his assistance with the statistical analysis of data. We are grateful to Felice de
Ceglie and Alessandro Soave for the preparation of figures.
We confirm that we have read the Journal’s position on issues involved in ethical
publication and affirm that this report is consistent with those guidelines.
32
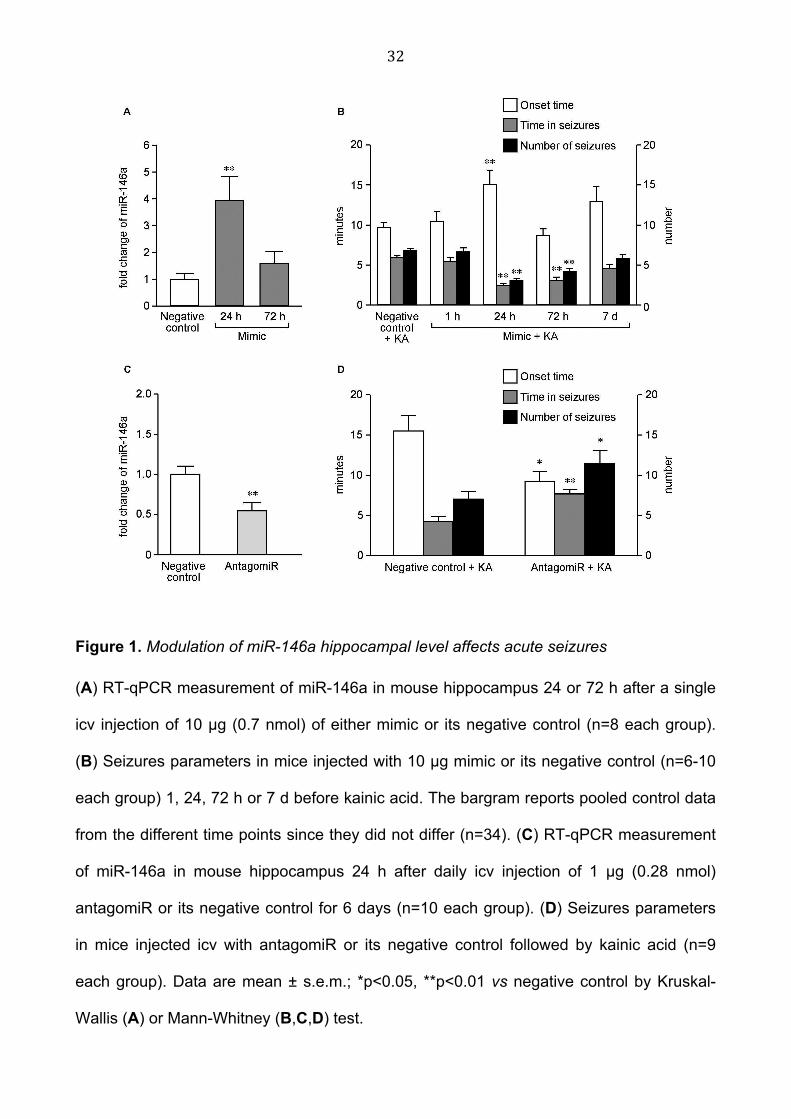
Figure 1. Modulation of miR-146a hippocampal level affects acute seizures
(A) RT-qPCR measurement of miR-146a in mouse hippocampus 24 or 72 h after a single
icv injection of 10 µg (0.7 nmol) of either mimic or its negative control (n=8 each group).
(B) Seizures parameters in mice injected with 10 µg mimic or its negative control (n=6-10
each group) 1, 24, 72 h or 7 d before kainic acid. The bargram reports pooled control data
from the different time points since they did not differ (n=34). (C) RT-qPCR measurement
of miR-146a in mouse hippocampus 24 h after daily icv injection of 1 µg (0.28 nmol)
antagomiR or its negative control for 6 days (n=10 each group). (D) Seizures parameters
in mice injected icv with antagomiR or its negative control followed by kainic acid (n=9
each group). Data are mean ± s.e.m.; *p<0.05, **p<0.01 vs negative control by Kruskal-
Wallis (A) or Mann-Whitney (B,C,D) test.

33
Figure 2. miR-146a mimic injection after epilepsy onset prevents disease progression and
reduces chronic seizures in mice
Average daily seizures in negative control- (A) and mimic-injected mice (B) during day 1-
16 and day 45-74 from epilepsy onset (onset day, negative control, 5.5 ± 0.4, n=15; mimic,

34
5.3 ± 0.4, n=15). Icv injections were done at days 1,4,7,10 and 13 from disease onset,
according to protocol in Fig. S3B. Seven mice out of 15 mice in each group were recorded
in the hippocampus ipsilateral to the kainate-injected amygdala and in the contralateral
overlying cortex, between days 1-16 and days 60-74. The remaining eight mice in each
group were recorded in the injected amygdala and the ipsilateral hippocampus, from days
1-16 and days 45-74. Since these two cohorts of mice shared the hippocampal site of
recording and displayed a similar number of daily seizures during the common recording
periods (days 1-16 and days 60-74; Chi-square test), they were pooled together. Notably,
EEG seizures simultaneously occurred at all sites of recordings and they were always
associated with generalized motor convulsions, and similarly affected by the treatment.
Data (mean ± s.e.m.) were analyzed by Chi-square test; *p<0.01 vs respective seizure
frequency during days 1-16; °p<0.01 vs seizure frequency during days 45-74 in negative
control-treated mice (B vs A).
Mean and 95% confidence interval (CI): (A) days 1-16: 1.05 (CI 0.85-1.25), days 45-74:
5.38 (CI 4.79-5.96); (B) days 1-16: 1.01 (CI 0.76-1.26), days 45-74: 0.37 (CI 0.27-0.47);
difference of mean values during days 45-74 (B vs A): 4.79 (CI 4.20-5.38).

35
Figure 3. Pharmacological treatment with VX-765 and Cyanobacterial LPS (Cyp), but not
with carbamazepine (CBZ), after epilepsy onset prevents disease progression and
reduces chronic seizures in mice

36
Average daily seizures in vehicle- (A) and drug-injected mice (B) during day 1-9 and day
45-74 from disease onset (onset day: vehicle, 4.9 ± 0.5, n=11; VX-765+CyP, 5.1 ± 0.5,
n=11). VX-765 (100 mg/kg, i.p.) and Cyp (1 mg/mouse, i.p.) were given daily for 7 days
from disease onset to block the activation of the IL-1R1/TLR4 signaling, then treatment
was stopped (protocol in Fig. S3B). (C) Average daily seizures during day 1-16 and day
45-74 from disease onset (5.5 ± 0.9 days, n=7) in CBZ-treated mice. Mice were treated
with CBZ-in-food during day 1-14 from epilepsy onset (protocol in Fig. S3B). Placebo pellet
given to epileptic mice for 2 weeks did not modify their spontaneous seizure frequency, as
assessed by continuous EEG monitoring (2.7 ± 0.6 seizures/day in mice fed with placebo
pellet vs 3.3 ± 0.8 seizures/day in mice fed with a normal diet, n=7 each group). We
therefore used the cohort of vehicle-injected mice fed with a normal diet (panel A) for
cross-sectional comparison with mice fed with CBZ-in-food (panel C) since these two
cohorts were run in parallel with experimental mice in panel B.
Data (mean ± s.e.m.) were analyzed by Chi-square test; *p<0.01 vs seizure frequency
during drug- or vehicle-injection; °p<0.01 vs seizure frequency during days 45-74 in
vehicle-injected mice (B vs A).
Mean and 95% confidence interval (CI): (A) days 1-9: 0.64 (CI 0.45-0.82), days 45-74:
2.86 (CI 2.30-3.43); (B) days 1-9: 0.74 (CI 0.40-1.08), days 45-74: 0.23 (CI 0.16-0.29); (C)
days 1-16: 0.18 (CI 0.08-0.28), days 45-74: 2.01 (CI 1.73-2.28); difference of mean values
during days 45-74 (B vs A): 2.54 (CI 1.98-3.11). CBZ-treated mice showed a 3-fold higher
seizure frequency compared to VX-765+CyP-treated mice during days 45-74 after disease
onset (p<0.01 by Chi-square test) while they did not differ from vehicle controls (A).
37
SUPPLEMENTARY MATERIALS
Fig. S1. Hippocampal level of IRAK-2 and TRAF-6 proteins and hippocampal level of miR-
21 and miR-155 after miR-146a mimic or negative control injection and the associated
reduction in hippocampal excitability in naive mice
Fig. S2. In situ hybridization analysis of miR-146a in forebrain
Fig. S3. Experimental model of SE-induced epilepsy and related injection protocols
Fig. S4. Experimental model of acute seizures and related injection protocol in naive mice
Fig. S5. Carbamazepine (CBZ)-in-food intake and corresponding plasma levels in naive
mice

38
References
Ali, A, Dua, Y, Constance, JE, Franklin, MR, Dudek, FE., 2012. A once-per-day, drug-in-
food protocol for prolonged administration of antiepileptic drugs in animal models.
Epilepsia;53:199-206.
Aronica, E, Fluiter, K, Iyer, A, Zurolo, E, Vreijling, J, van Vliet, EA, et al., 2010. Expression
pattern of miR-146a, an inflammation-associated microRNA, in experimental and
human temporal lobe epilepsy. Eur J Neurosci;31:1100-7.
Aronica, E, Ravizza, T, Zurolo, E, Vezzani, A., 2012. Astrocyte immune response in
epilepsy. Glia;60:1258-68.
Balosso, S, Maroso, M, Sanchez-Alavez, M, Ravizza, T, Frasca, A, Bartfai, T, et al., 2008.
A novel non-transcriptional pathway mediates the proconvulsive effects of
interleukin-1beta. Brain;131:3256-65.
Balosso, S, Ravizza, T, Pierucci, M, Calcagno, E, Invernizzi, RW, Di Giovanni, G, et al.,
2009. Molecular and functional interactions between TNF-alpha receptors and the
glutamatergic system in the mouse hippocampus: implications for seizure
susceptibility. Neuroscience;161:293-300.
Balosso, S, Liu, J, Bianchi, ME, Vezzani, A., 2014. Disulfide-containing High Mobility
Group Box-1 promotes N-methyl-d-aspartate receptor function and excitotoxicity by
activating Toll-like receptor 4-dependent signaling in hippocampal neurons. Antioxid
Redox Signal;21:1726-1740.
Barker-Haliski, ML, Friedman, D, French, JA, White, HS., 2015. Disease modification in
epilepsy: from animal models to clinical applications. Drugs;75:749-67.
Bialer, M, Johannessen, SI, Levy, RH, Perucca, E, Tomson, T, White, HS., 2013. Progress
report on new antiepileptic drugs: a summary of the Eleventh Eilat Conference
(EILAT XI). Epilepsy Res;103:2-30.
39
Boldin, MP, Taganov, KD, Rao, DS, Yang, L, Zhao, JL, Kalwani, M, et al., 2011. miR-146a
is a significant brake on autoimmunity, myeloproliferation, and cancer in mice. J Exp
Med;208:1189-201.
Borenstein, M, Hedges, LV, Higgins, JP, Rothstein, HR., 2009. A basic introduction to
fixed-effect and random-effects models for meta-analysis. Res Synth Methods;1:97-
111.
Budde, BS, Namavar, Y, Barth, PG, Poll-The, BT, Nurnberg, G, Becker, C, et al., 2008.
tRNA splicing endonuclease mutations cause pontocerebellar hypoplasia. Nat
Genet;40:1113-8.
Burianova, I, Borecka, K., 2015. Routine therapeutic monitoring of the active metabolite of
carbamazepine: Is it really necessary? Clin Biochem;48:866-9.
Devinsky, O, Vezzani, A, Najjar, S, De Lanerolle, NC, Rogawski, MA., 2013. Glia and
epilepsy: excitability and inflammation. Trends Neurosci;36:174-84.
Duncan, JS, Sander, JW, Sisodiya, SM, Walker, MC., 2006. Adult epilepsy.
Lancet;367:1087-100.
Franklin, KBJ, Paxinos, G., 2008. The mouse brain in stereotaxic coordinates Academic
Press, San Diego.
Frigerio, F, Frasca, A, Weissberg, I, Parrella, S, Friedman, A, Vezzani, A, et al., 2012.
Long-lasting pro-ictogenic effects induced in vivo by rat brain exposure to serum
albumin in the absence of concomitant pathology. Epilepsia;53:1887-1897.
Gasior, M, White, NA, Rogawski, MA., 2007. Prolonged attenuation of amygdala-kindled
seizure measures in rats by convection-enhanced delivery of the N-type calcium
channel antagonists omega-conotoxin GVIA and omega-conotoxin MVIIA. J
Pharmacol Exp Ther;323:458-68.

40
Gorter, JA, Iyer, A, White, I, Colzi, A, van Vliet, EA, Sisodiya, S, et al., 2014. Hippocampal
subregion-specific microRNA expression during epileptogenesis in experimental
temporal lobe epilepsy. Neurobiol Dis;62:508-20.
Grabenstatter, HL, Clark, S, Dudek, FE., 2007. Anticonvulsant effects of carbamazepine
on spontaneous seizures in rats with kainate-induced epilepsy: comparison of
intraperitoneal injections with drug-in-food protocols. Epilepsia; 48:2287-95.
Gu, B, Huang, YZ, He, XP, Joshi, RB, Jang, W, McNamara, JO., 2015. A Peptide
Uncoupling BDNF Receptor TrkB from Phospholipase Cgamma1 Prevents Epilepsy
Induced by Status Epilepticus. Neuron;88:484-91.
Harward, SC, McNamara, JO., 2014. Aligning animal models with clinical epilepsy: where
to begin? Adv Exp Med Biol;813:243-51.
Heinemann, U, Kaufer, D, Friedman, A., 2012. Blood-brain barrier dysfunction, TGFbeta
signaling, and astrocyte dysfunction in epilepsy. Glia;60:1251-7.
Iori, V, Maroso, M, Rizzi, M, Iyer, AM, Vertemara, R, Carli, M, et al., 2013. Receptor for
Advanced Glycation Endproducts is upregulated in temporal lobe epilepsy and
contributes to experimental seizures. Neurobiol Dis;58:102-14.
Iyer, A, Zurolo, E, Prabowo, A, Fluiter, K, Spliet, WG, van Rijen, PC, et al., 2012.
MicroRNA-146a: a key regulator of astrocyte-mediated inflammatory response.
PLoS One;7:e44789.
Iyer, A, Marson, A., 2014. Pharmacotherapy of focal epilepsy. Expert Opin
Pharmacother;15:1543-51.
Jimenez-Mateos, EM, Engel, T, Merino-Serrais, P, McKiernan, RC, Tanaka, K, Mouri, G,
et al., 2012. Silencing microRNA-134 produces neuroprotective and prolonged
seizure-suppressive effects. Nat Med;18:1087-94.
Jimenez-Mateos, EM, Henshall, DC., 2013. Epilepsy and microRNA. Neuroscience;
238:218-29.

41
Jyonouchi, H, Geng, L., 2016. Intractable Epilepsy (IE) and Responses to Anakinra, a
Human Recombinant IL-1 Receptor Antagonist (IL-1Ra): Case Reports. Journal of
Clinical and Cellular Immunology;7:456-460.
Kenney, L, Kahoud, JR, Vezzani, A, LaFrance-Corey, GR, Ho, M, Muskardin, TW, Gleich,
JS, Wirrell, CE, Howe, LC, Payne TE.Super refractory status epilepticus secondary
to febrile illness related epilepsy syndrome treated with anakinra. Annals of
Neurology, in press.
Keyel, PA., 2014. How is inflammation initiated? Individual influences of IL-1, IL-18 and
HMGB1. Cytokine;69:136-45.
Krutzfeldt, J, Rajewsky, N, Braich, R, Rajeev, KG, Tuschl, T, Manoharan, M, et al., 2005.
Silencing of microRNAs in vivo with 'antagomirs'. Nature;438:685-9.
Lee, S, Jeon, D, Chu, K, Jung, K, Moon, J, Sunwoo, J, et al., 2016. Inhibition of miR-203
reduces spontaneous recurrent seizures in mice. Mol Neurobiol; [Epub ahead of
print]
Lehmann, SM, Kruger, C, Park, B, Derkow, K, Rosenberger, K, Baumgart, J, et al., 2012.
An unconventional role for miRNA: let-7 activates Toll-like receptor 7 and causes
neurodegeneration. Nat Neurosci;15:827-35.
Leon, CG, Tory, R, Jia, J, Sivak, O, Wasan, KM., 2008. Discovery and development of toll-
like receptor 4 (TLR4) antagonists: a new paradigm for treating sepsis and other
diseases. Pharm Res;25:1751-61.
Lepper, PM, Triantafilou, M, O'Neill, LA, Novak, N, Wagner, H, Parker, AE, et al., 2010.
Modulation of toll-like receptor signalling as a new therapeutic principle. Mediators
Inflamm;2010:705612.

42
Li, T, Ren, G, Lusardi, T, Wilz, A, Lan, JQ, Iwasato, T, et al., 2008. Adenosine kinase is a
target for the prediction and prevention of epileptogenesis in mice. J Clin
Invest;118:571-82.
Liu, G, Gu, B, He, XP, Joshi, RB, Wackerle, HD, Rodriguiz, RM, et al., 2013. Transient
inhibition of TrkB kinase after status epilepticus prevents development of temporal
lobe epilepsy. Neuron;79:31-8.
Macagno, A, Molteni, M, Rinaldi, A, Bertoni, F, Lanzavecchia, A, Rossetti, C, et al., 2006.
A cyanobacterial LPS antagonist prevents endotoxin shock and blocks sustained
TLR4 stimulation required for cytokine expression. J Exp Med;203:1481-92.
Maroso, M, Balosso, S, Ravizza, T, Liu, J, Aronica, E, Iyer, AM, et al., 2010. Toll-like
receptor 4 and high-mobility group box-1 are involved in ictogenesis and can be
targeted to reduce seizures. Nat Med;16:413-9.
Maroso, M, Balosso, S, Ravizza, T, Iori, V, Wright, CI, French, J, et al., 2011a. Interleukin-
1beta biosynthesis inhibition reduces acute seizures and drug resistant chronic
epileptic activity in mice. Neurotherapeutics;8:304-15.
Maroso, M, Balosso, S, Ravizza, T, Liu, J, Bianchi, ME, Vezzani, A., 2011b. Interleukin-1
type 1 receptor/Toll-like receptor signalling in epilepsy: the importance of IL-1beta
and high-mobility group box 1. J Intern Med;270:319-26.
McDaniel B, Sheng H, Warner DS, Hedlund LW, Benveniste H., 2001. Tracking brain
volume changes in C57BL/6J and ApoE-deficient mice in a model of
neurodegeneration: a 5-week longitudinal micro-MRI study. Neuroimage;14:1244-
55.
Mohanraj, R, Brodie, MJ., 2003. Measuring the efficacy of antiepileptic drugs.
Seizure;12:413-43.
Mouri, G, Jimenez-Mateos, E, Engel, T, Dunleavy, M, Hatazaki, S, Paucard, A, et al.,
2008. Unilateral hippocampal CA3-predominant damage and short latency

43
epileptogenesis after intra-amygdala microinjection of kainic acid in mice. Brain
Res;1213:140-51.
Noé, FM, Polascheck, N, Frigerio, F, Bankstahl, M, Ravizza, T, Marchini, S, et al., 2013.
Pharmacological blockade of IL-1beta/IL-1 receptor type 1 axis during
epileptogenesis provides neuroprotection in two rat models of temporal lobe
epilepsy. Neurobiol Dis;59:183-93.
O'Neill, LA., 2008. 'Fine tuning' TLR signaling. Nat Immunol;9:459-61.
Omran, A, Peng, J, Zhang, C, Xiang, QL, Xue, J, Gan, N, et al., 2012. Interleukin-1beta
and microRNA-146a in an immature rat model and children with mesial temporal
lobe epilepsy. Epilepsia;53:1215-24.
Pedrazzi, M, Averna, M, Sparatore, B, Patrone, M, Salamino, F, Marcoli, M, et al., 2012.
Potentiation of NMDA receptor-dependent cell responses by extracellular high
mobility group box 1 protein. PLoS One;7:e44518.
Pitkanen, A, Sutula, TP., 2002. Is epilepsy a progressive disorder? Prospects for new
therapeutic approaches in temporal-lobe epilepsy. Lancet Neurol;1:173-81.
Prabowo, AS, van Scheppingen, J, Iyer, AM, Anink, JJ, Spliet, WG, van Rijen, PC, et al.,
2015. Differential expression and clinical significance of three inflammation-related
microRNAs in gangliogliomas. J Neuroinflammation;12:97.
Quinn, SR, O'Neill, LA., 2011. A trio of microRNAs that control Toll-like receptor signalling.
Int Immunol;23:421-5.
Ramakers, C, Ruijter, JM, Deprez, RH, Moorman, AF., 2003. Assumption-free analysis of
quantitative real-time polymerase chain reaction (PCR) data. Neurosci Lett;339:62-
6.
Ravizza, T, Lucas, SM, Balosso, S, Bernardino, L, Ku, G, Noé, F, Malva, J, Randle, JC,
Allan, S, Vezzani A., 2006. Inactivation of caspase-1 in rodent brain: a novel
anticonvulsive strategy. Epilepsia;47:1160-8.
44
Rossetti, AO, Alvarez, V, Januel, JM, Burnand, B., 2013. Treatment deviating from
guidelines does not influence status epilepticus prognosis. J Neurol;260:421-8.
Ruijter, JM, Ramakers, C, Hoogaars, WM, Karlen, Y, Bakker, O, van den Hoff, MJ, et al.,
2009. Amplification efficiency: linking baseline and bias in the analysis of
quantitative PCR data. Nucleic Acids Res;37:e45.
Sarkis, RA, Jehi, L, Bingaman, W, Najm, IM., 2012. Seizure worsening and its predictors
after epilepsy surgery. Epilepsia;53:1731-8.
Schmidt, D, Sillanpaa, M., 2005. Does surgery prevent worsening of epilepsy?
Epilepsia;54:391.
Shinoda, S, Schindler, CK, Meller, R, So, NK, Araki, T, Yamamoto, A, et al., 2004. Bim
regulation may determine hippocampal vulnerability after injurious seizures and in
temporal lobe epilepsy. J Clin Invest;113:1059-68.
Taganov, KD, Boldin, MP, Chang, KJ, Baltimore, D., 2006. NF-kappaB-dependent
induction of microRNA miR-146, an inhibitor targeted to signaling proteins of innate
immune responses. Proc Natl Acad Sci U S A;103:12481-6.
Temkin, NR., 2001. Antiepileptogenesis and seizure prevention trials with antiepileptic
drugs: meta-analysis of controlled trials. Epilepsia;42:515-24.
Tsai, MH, Chuang, YC, Chang, HW, Chang, WN, Lai, SL, Huang, CR, et al., 2009. Factors
predictive of outcome in patients with de novo status epilepticus. QJM;102:57-62.
van Scheppingen, J, Iyer, AM, Prabowo, AS, Muhlebner, A, Anink, JJ, Scholl, T, et al.,
2016. Expression of microRNAs miR21, miR146a, and miR155 in tuberous
sclerosis complex cortical tubers and their regulation in human astrocytes and
SEGA-derived cell cultures. Glia;64:1066-82.

45
Vezzani, A, Moneta, D, Conti, M, Richichi, C, Ravizza, T, De Luigi, A, et al., 2000.
Powerful anticonvulsant action of IL-1 receptor antagonist on intracerebral injection
and astrocytic overexpression in mice. Proc Natl Acad Sci U S A;97:11534-9.
Vezzani, A, Moneta, D, Richichi, C, Aliprandi, M, Burrows, SJ, Ravizza, T, et al., 2002.
Functional role of inflammatory cytokines and antiinflammatory molecules in
seizures and epileptogenesis. Epilepsia;43 Suppl 5:30-5.
Vezzani, A, French, J, Bartfai, T, Baram, TZ., 2011a. The role of inflammation in epilepsy.
Nat Rev Neurol;7:31-40.
Vezzani, A, Maroso, M, Balosso, S, Sanchez, MA, Bartfai, T., 2011b. IL-1 receptor/Toll-like
receptor signaling in infection, inflammation, stress and neurodegeneration couples
hyperexcitability and seizures. Brain Behav Immun;25:1281-9.
Vezzani, A, Friedman, A, Dingledine, RJ., 2013. The role of inflammation in
epileptogenesis. Neuropharmacology;69:16-24.
Vezzani, A., 2015. Anti-inflammatory drugs in epilepsy: does it impact epileptogenesis?
Expert Opin Drug Saf;14:583-92.
Vezzani, A, Dingledine, R, Rossetti, AO., 2015a. Immunity and inflammation in status
epilepticus and its sequelae: possibilities for therapeutic application. Expert Rev
Neurother;15:1081-92.
Vezzani, A, Lang, B, Aronica, E., 2015b. Immunity and Inflammation in Epilepsy. Cold
Spring Harb Perspect Med;6.
Viviani, B, Bartesaghi, S, Gardoni, F, Vezzani, A, Behrens, MM, Bartfai, T, et al., 2003.
Interleukin-1beta enhances NMDA receptor-mediated intracellular calcium increase
through activation of the Src family of kinases. J Neurosci;23:8692-700.
Wannamaker, W, Davies, R, Namchuk, M, Pollard, J, Ford, P, Ku, G, et al., 2007. (S)-1-
((S)-2-{[1-(4-amino-3-chloro-phenyl)-methanoyl]-amino}-3,3-dimethyl-butanoyl)-
pyrrolidine-2-carboxylic acid ((2R,3S)-2-ethoxy-5-oxo-tetrahydro-furan-3-yl)-amide

46
(VX-765), an orally available selective interleukin (IL)-converting enzyme/caspase-1
inhibitor, exhibits potent anti-inflammatory activities by inhibiting the release of IL-
1beta and IL-18. J Pharmacol Exp Ther;321:509-16.
Weaver, DF, Pohlmann-Eden, B., 2013. Pharmacoresistant epilepsy: unmet needs in
solving the puzzle(s). Epilepsia;54 Suppl 2:80-5.
Yi, X, Manickam, DS, Brynskikh, A, Kabanov, AV., 2014. Agile delivery of protein
therapeutics to CNS. J Control Release;190:637-63.
Yuan, J, Huang, H, Zhou, X, Liu, X, Ou, S, Xu, T, Li, R, Ma, L, Chen Y., 2016. MicroRNA-
132 Interact with p250GAP/Cdc42 Pathway in the Hippocampal Neuronal Culture
Model of Acquired Epilepsy and Associated with Epileptogenesis Process. Neural
Plast:5108489.
Zeng, Z, Gong, H, Li, Y, Jie, K, Ding, C, Shao, Q, et al., 2013. Upregulation of miR-146a
contributes to the suppression of inflammatory responses in LPS-induced acute
lung injury. Exp Lung Res;39:275-82.

1
Supplementary Information
Blockade of the IL-1R1/TLR4 pathway mediates disease-modification therapeutic effects in
a model of acquired epilepsy
Valentina Iori1, Anand M. Iyer2, Teresa Ravizza1, Luca Beltrame3, Lara Paracchini3, Sergio
Marchini3, Milica Cerovic1, Cameron Hill4, Mariella Ferrari3, Massimo Zucchetti3, Monica
Molteni5, Carlo Rossetti5, Riccardo Brambilla1,6, H. Steve White4, Maurizio D’Incalci3,
*Eleonora Aronica2,7,8 and *Annamaria Vezzani1
1Department of Neuroscience and 3Department of Oncology, IRCCS-Istituto di Ricerche
Farmacologiche “Mario Negri”, Milano, Italy; 2Department of (Neuro)Pathology, Academic
Medical Center, Amsterdam, The Netherlands; 4Department of Pharmacy, University of
Washington, Seattle, WA, USA; 5Department of Biotechnologies and Life Sciences,
Insubria University, Varese, Italy; 6Neuroscience and Mental Health Research Institute,
Division of Neuroscience, School of Biosciences, Cardiff University, United Kingdom;
7Swammerdam Institute for Life Sciences, Center for Neuroscience, University of
Amsterdam; 8Stichting Epilepsie Instellingen (SEIN) Nederland and Epilepsy Institute in
The Netherlands Foundation, The Netherlands
This file includes:
Fig. S1. Hippocampal level of IRAK-2 and TRAF-6 proteins and hippocampal level of miR-
21 and miR-155 after miR-146a mimic injection and the associated reduction in
hippocampal excitability in naive mice
Fig. S2. In situ hybridization analysis of miR-146a in forebrain after mimic injection
Fig. S3. Experimental model of SE-induced epilepsy and related injection protocols
Fig. S4. Experimental model of acute seizures and related injection protocol in naive mice
Fig. S5. Carbamazepine (CBZ)-in-food intake and corresponding plasma levels in naive
mice
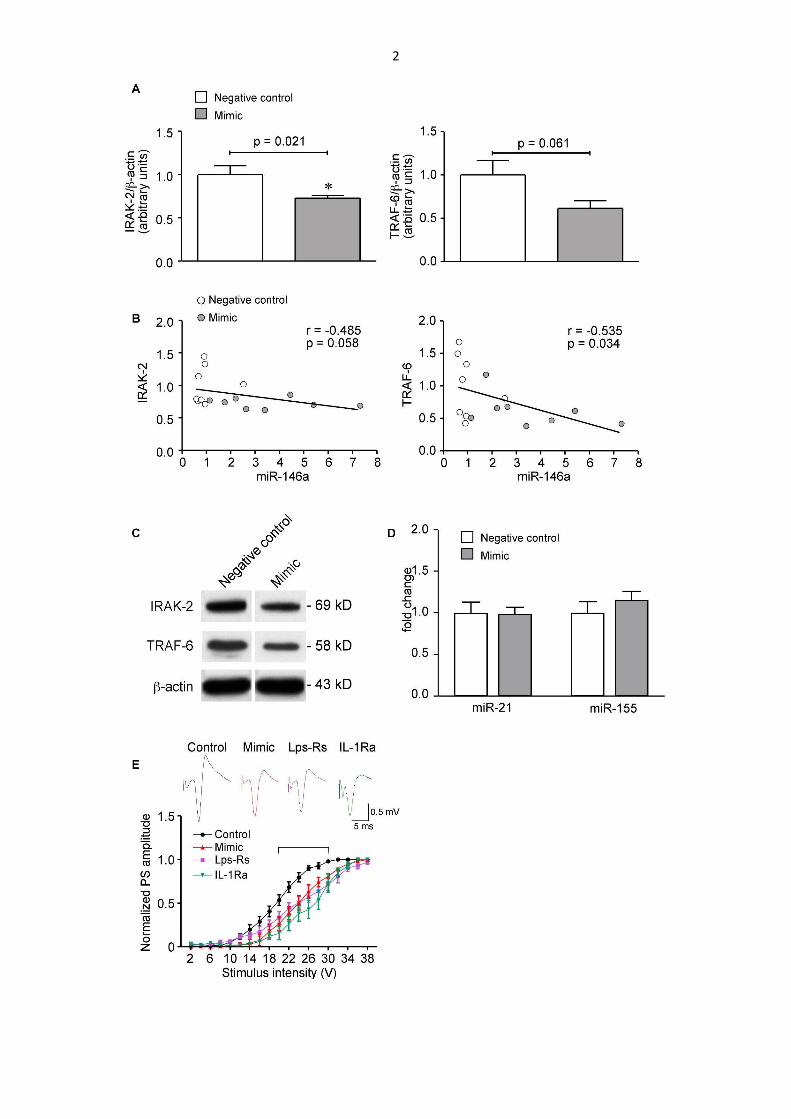
2
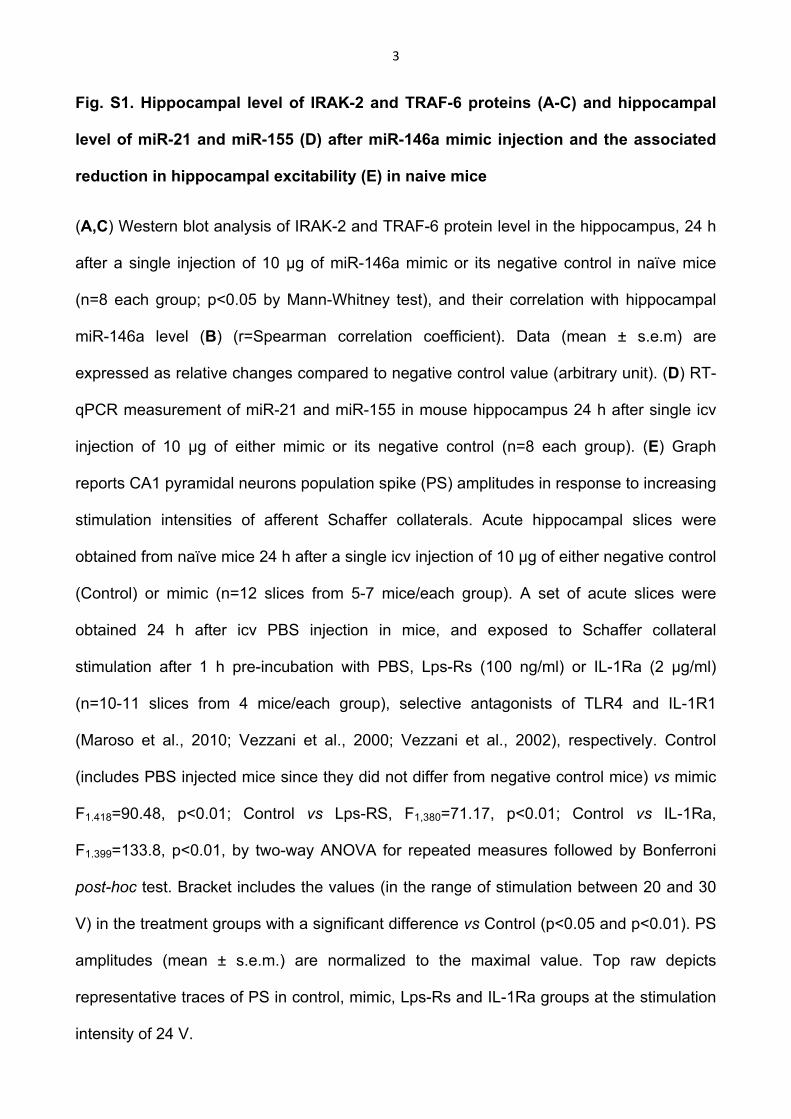
3
Fig. S1. Hippocampal level of IRAK-2 and TRAF-6 proteins (A-C) and hippocampal
level of miR-21 and miR-155 (D) after miR-146a mimic injection and the associated
reduction in hippocampal excitability (E) in naive mice
(A,C) Western blot analysis of IRAK-2 and TRAF-6 protein level in the hippocampus, 24 h
after a single injection of 10 µg of miR-146a mimic or its negative control in naïve mice
(n=8 each group; p<0.05 by Mann-Whitney test), and their correlation with hippocampal
miR-146a level (B) (r=Spearman correlation coefficient). Data (mean ± s.e.m) are
expressed as relative changes compared to negative control value (arbitrary unit). (D) RT-
qPCR measurement of miR-21 and miR-155 in mouse hippocampus 24 h after single icv
injection of 10 µg of either mimic or its negative control (n=8 each group). (E) Graph
reports CA1 pyramidal neurons population spike (PS) amplitudes in response to increasing
stimulation intensities of afferent Schaffer collaterals. Acute hippocampal slices were
obtained from naïve mice 24 h after a single icv injection of 10 µg of either negative control
(Control) or mimic (n=12 slices from 5-7 mice/each group). A set of acute slices were
obtained 24 h after icv PBS injection in mice, and exposed to Schaffer collateral
stimulation after 1 h pre-incubation with PBS, Lps-Rs (100 ng/ml) or IL-1Ra (2 µg/ml)
(n=10-11 slices from 4 mice/each group), selective antagonists of TLR4 and IL-1R1
(Maroso et al., 2010; Vezzani et al., 2000; Vezzani et al., 2002), respectively. Control
(includes PBS injected mice since they did not differ from negative control mice) vs mimic
F1.418=90.48, p<0.01; Control vs Lps-RS, F1,380=71.17, p<0.01; Control vs IL-1Ra,
F1.399=133.8, p<0.01, by two-way ANOVA for repeated measures followed by Bonferroni
post-hoc test. Bracket includes the values (in the range of stimulation between 20 and 30
V) in the treatment groups with a significant difference vs Control (p<0.05 and p<0.01). PS
amplitudes (mean ± s.e.m.) are normalized to the maximal value. Top raw depicts
representative traces of PS in control, mimic, Lps-Rs and IL-1Ra groups at the stimulation
intensity of 24 V.

4
Fig. S2. In situ hybridization analysis of miR-146a in forebrain after mimic injection
Representative photomicrographs showing miR-146a in situ hybridization signal in
basolateral amygdala (BLA), frontoparietal cortex (FrPaCtx) and CA1 subfield of the
hippocampus, 24 h after a single icv injection of 10 µg negative control or miR-146a mimic
in sham mice (implanted with cannula and electrodes but not exposed to SE; n=5 each
group; panels a-f), or after 5 repetitive injections of 10 µg each in SE-exposed mice (one
injection every 3 days, starting the day of epilepsy onset in each mouse, panels g-o;
protocol in Fig. S3B) (n=4-5 each group). Scale bar: 20 µm (a-l); 30 µm (m-o). Bargrams
represent the percent area occupied by miR-146a signal in the respective brain areas
(mean ± s.e.m.; n=4-5 mice each group; 2 slices/mouse). *p<0.05, **p<0.01 vs Sham +
Negative control; #p<0.01 vs SE + Negative control by Mann-Whitney test.
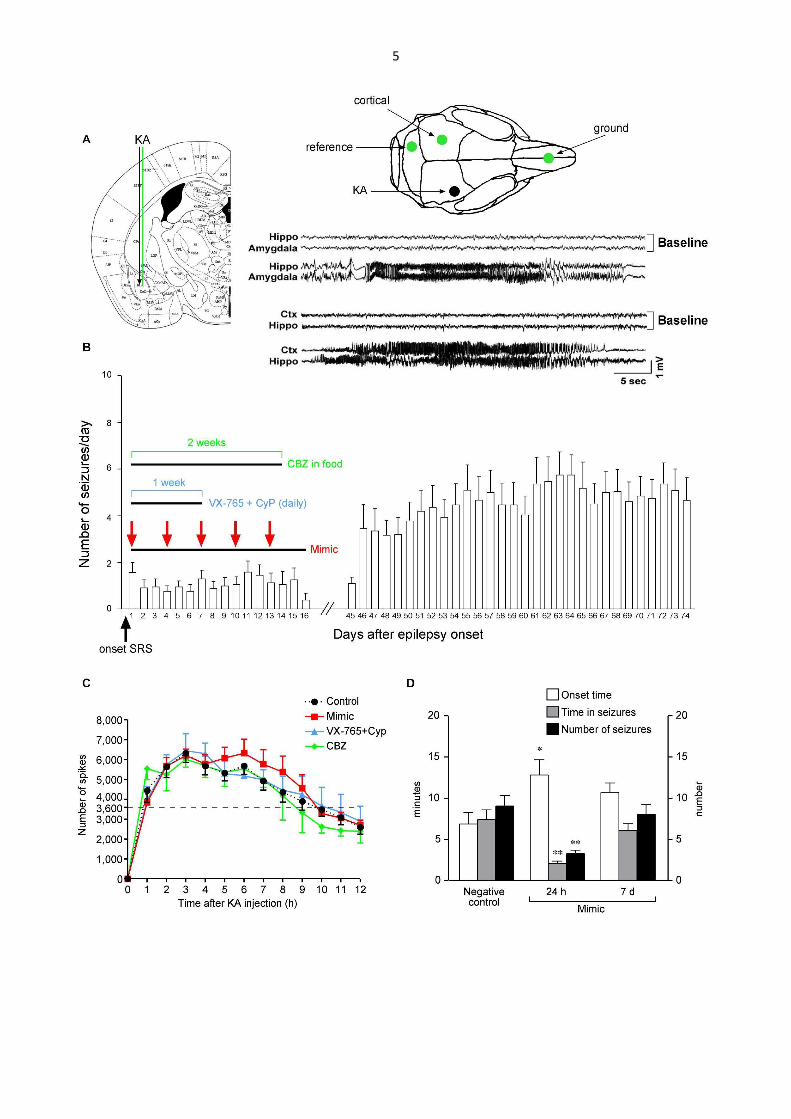
5

6
Fig. S3. Experimental model of SE-induced epilepsy and related injection protocols
(A) Brain atlas plate depicting kainic acid (KA, 0.3 µg in 0.2 µl) injection site (black arrow)
and adjacent EEG depth electrode placement (green line) in the right basolateral
amygdala (BLA). The electrode positioning in the ipsilateral dorsal hippocampus is the
same as depicted in Fig. S4A (green line). The schematic skull reproduction shows
surface electrode placement (green circles) and the position of the guide cannula for
intraamygdala KA injection (black circle). Representative EEG tracings depicting typical
spontaneous seizures (and their respective baseline tracings) in two different mice. One
mouse was recorded in injected amygdala and ipsilateral hippocampus while the other
mouse was recorded in the hippocampus (ipsilateral to injected amygdala) and the
contralateral overlying cortex. CTX, cortex, contralateral to the injection; RHP, right
hippocampus, ipsilateral to the injection. These recordings show that EEG seizures
simultaneously occur in hippocampus, cortex and injected amygdala. This ictal activity was
always associated with generalized motor convulsions. EEG seizures were never recorded
in electrode-implanted mice (not injected with kainate) undergoing long-term EEG
recordings. (B) Mice were prepared as described in the Materials and Methods for SE
induction and EEG recording. In each mouse, continuous EEG recording (24/7) was done
from SE induction until epilepsy onset which is denoted as day 1 (i.e., the occurrence of
two spontaneous seizures at least 48 h apart from SE induction). At day 1, mice were
randomized in control and treatment groups. Bargram depicts the number of daily seizures
(mean ± s.e.m.) in control mice (cumulative data from negative control-injected mice,
n=15, Fig. 2A and vehicle-injected mice, n=11; Fig. 3A). We pooled the data to show the
natural history of the disease in this model since the control groups did not differ (Mann-
Whitney test). Mimic- or drug-treated mice were EEG recorded (24 h/day) during treatment
(each treatment schedule is reported in panel B), and from day 45 or day 60 to day 74
from epilepsy onset (24/7). They were injected as follows: one cohort received 10 µg of

7
either negative control (n=15) or mimic (n=15) at day 1, then again at day 4, day 7, day 10
and day 13 (red arrows; these mice are reported in Fig. 2). This treatment schedule was
chosen based on pharmacodynamic measures reported in Fig. 1B and Fig. S3D, showing
that the effect of mimic on hippocampal excitability lasts for at least 72 h after injection,
then elapsing at one week. A different cohort of mice was treated for one week with daily
injections of VX-765 (100 mg/kg, i.p.) and CyP (1 mg/mouse, i.p., injected 6 h after VX-
765) (Fig. 3A,B) following a treatment schedule based on pharmacokinetic data (Cyp, half-
life in blood 15 h; single daily repeated administration of VX-765 allows adequate systemic
exposure to the active metabolite (Wannamaker et al., 2007) attaining therapeutic effective
concentration in brain). We did not prolong treatment over one week to avoid exposing
mice to many repetitive i.p. injections. The last cohort of mice was administered with CBZ-
in-food (20 mg/daily/mouse) for 2 weeks to reach steady-state therapeutic plasma levels at
maximal tolerated doses (Fig. S5; Fig. 3C). (C) Temporal spike distribution during SE
induced by intra-amygdala KA injection in mice subsequently randomized after the onset
of epilepsy to control or treatment groups (panel B). Data from negative control- or vehicle-
injected mice were pooled together since SE did not differ (Mann-Whitney). Each point
represents the cumulative number of spikes during progressive 1 h intervals. Curves did
not differ among each other (by one-way ANOVA). (D) Effect of negative control or mimic
repetitive icv injections (protocol in Fig. S4C) on acute seizures induced in naive mice by
intrahippocampal KA injected 24 h or seven days after the last icv oligonucleotide injection.
This result was used as a pharmacodynamic measure of the mimic clearance from brain
tissue. *p<0.05; **p<0.01 vs negative control by Mann-Whitney test.

8
Fig. S4. Experimental model of acute seizures and related injection protocol in naive
mice
(A) Brain atlas plate depicting kainic acid (KA, 7 ng/0.5 µl) or bicuculline (51 ng/0.5 µl)
unilateral injection site (black arrow) and the depth bipolar recording electrode that was
placed in the hippocampus (green line) bilaterally. Schematic skull reproduction shows
surface electrode placement (green circles) and the position of the guide cannula for
intrahippocampal injection of convulsive drugs (black circle). Representative EEG tracings

9
depicting baseline recordings (top) and ictal activity after KA injection (bottom)
simultaneously occurring in the left (LHP) and right (RHP) hippocampus in freely moving
mice. (B) Mice received one icv injection (ipsilateraly to KA or bicuculline injection) of 10
µg mimic or its negative control (red arrow) at different times (i.e., 1 h, 24 h, 72 h or 7
days) before KA, or 24 h before bicuculline or their vehicle (black arrow). (C) Mice received
five icv injection (one injection every 3 days, red arrows) of 10 µg mimic or its negative
control, then 24 h (day 13) or one week (day 19) after the last icv injection they were
intrahippocampally injected with KA.

10
Fig. S5. Carbamazepine (CBZ)-in-food intake and corresponding plasma levels in
naive mice
We used CBZ-in-food in order to attain steady-state therapeutic drug levels over 2 weeks
because AEDs have a very short half-life in mice after their systemic delivery. Table in (A)
reports the daily food intake in mice under a normal diet or fed with various doses of CBZ-
in-food for 2 weeks (n=4-6 each group), and their corresponding body weight (B). Note
that a deflection in body weight was observed in mice fed with 10 mg/g CBZ denoting
signs of toxicity. (C) Concentration of CBZ, and its active metabolite CBZ-epoxide (CBZ-
E), in plasma of mice after 2 weeks of feeding with the various CBZ-in-food
concentrations. Plasma levels of CBZ+CBZ-E within therapeutic range (4-10 µg/ml; Ali et

11
al., 2012) were attained with CBZ doses of 5 mg/g and 10 mg/g of pellet. Since 10 mg/g
provoked loss of body weight, we choose 5 mg/g CBZ-in-food (maximal tolerated dose) for
the experiments in Fig. 2C: CBZ-in-food daily intake in epileptic mice was of 4.2 g.
Estimation of CBZ and CBZ-E was done in plasma from blood collected from heart atrium
in deeply anaesthetized mice, using high performance liquid chromatography (HPLC) with
a UV diode array detector as previously described (Ali et al., 2012).
References
Ali, A, Dua, Y, Constance, JE, Franklin, MR, Dudek, FE., 2012. A once-per-day, drug-in-
food protocol for prolonged administration of antiepileptic drugs in animal models.
Epilepsia;53:199-206.
Maroso, M, Balosso, S, Ravizza, T, Liu, J, Aronica, E, Iyer, AM, et al., 2010. Toll-like
receptor 4 and high-mobility group box-1 are involved in ictogenesis and can be
targeted to reduce seizures. Nat Med;16:413-9.
Vezzani, A, Moneta, D, Conti, M, Richichi, C, Ravizza, T, De Luigi, A, et al., 2000.
Powerful anticonvulsant action of IL-1 receptor antagonist on intracerebral injection
and astrocytic overexpression in mice. Proc Natl Acad Sci U S A;97:11534-9.
Vezzani, A, Moneta, D, Richichi, C, Aliprandi, M, Burrows, SJ, Ravizza, T, et al., 2002.
Functional role of inflammatory cytokines and antiinflammatory molecules in
seizures and epileptogenesis. Epilepsia;43 Suppl 5:30-5.
Wannamaker, W, Davies, R, Namchuk, M, Pollard, J, Ford, P, Ku, G, et al., 2007. (S)-1-
((S)-2-{[1-(4-amino-3-chloro-phenyl)-methanoyl]-amino}-3,3-dimethyl-butanoyl)-
pyrrolidine-2-carboxylic acid ((2R,3S)-2-ethoxy-5-oxo-tetrahydro-furan-3-yl)-amide
(VX-765), an orally available selective interleukin (IL)-converting enzyme/caspase-1
inhibitor, exhibits potent anti-inflammatory activities by inhibiting the release of IL-
1beta and IL-18. J Pharmacol Exp Ther;321:509-16.