Embed Size (px)
Citation preview


A RESPONSE ANALYSIS FRAMEWORK FOR
FOOD AND NUTRITION SECURITY INTERVENTIONS
AT DISTRICT LEVEL
Drawing on work done in NTT Province, Indonesia
A Facilitation Guide
Food and Agriculture Organization of the United Nations
Rome, 2011

2
The designations employed and the presentation of material in this information product do not imply
the expression of any opinion whatsoever on the part of the Food and Agriculture Organization of the
United Nations (FAO) concerning the legal or development status of any country, territory, city or area
or of its authorities, or concerning the delimitation of its frontiers or boundaries. The mention of
specific companies or products of manufacturers, whether or not these have been patented, does not
imply that these have been endorsed or recommended by FAO in preference to others of a similar
nature that are not mentioned. The views expressed in this information product are those of the
author(s) and do not necessarily reflect the views of FAO.
All rights reserved. FAO encourages the reproduction and dissemination of material in this information
product. Non-commercial uses will be authorized free of charge, upon request. Reproduction for
resale or other commercial purposes, including educational purposes, may incur fees. Applications for
permission to reproduce or disseminate FAO copyright materials, and all queries concerning rights and
licences, should be addressed by e-mail to [email protected] or to the Chief, Publishing Policy and
Support Branch, Office of Knowledge Exchange, Research and Extension, FAO, Viale delle Terme di
Caracalla, 00153 Rome, Italy.
© FAO 2011

I
PREFACE
This guide was developed as part of an ECHO Funded project entitled:
Developing a Response Analysis Framework for Food Security Emergencies.
The funding is part of the ECHO global capacity building fund.
The proposal to develop a Response Analysis Framework for food security
was grounded in the understanding that whilst situation analysis of food
security has improved in recent years, this has not been systematically
translated into more appropriate and justified responses to food security
problems. Globally, a number of reviews have recognised the gap that
exists in the link between food security situation and forecast analysis and
programming.
Response analysis processes were a focus of The Re-thinking Food Security
Forum (hosted by FAO in Rome in April 2008) which brought together
INGOs, academia WFP and FAO. The Forum highlighted the need for
response analysis processes to be inclusive, and for interventions to be
informed by a full review of options. In 2009, consultations held at DG
ECHO on Capacity Building Policy and the Future of Thematic Funding
confirmed that food security information systems and approaches do “not
yet include improved response analysis for programming support”1 ECHO
observed that “There is an inadequate link between food security analysis
and response...”.
It was as in reaction to this that FAO developed a project designed to try
and address this link. The result was an 18-month ECHO funded project
entitled “Developing a Response Analysis Framework for Food Security
Emergencies”. This facilitation guide is one of the products of that project,
and is one of a pair of guides aimed at different audiences. For a full list of
products produced by the project, readers are encouraged to visit the FAO
and Emergencies website http://www.fao.org/emergencies and scroll
down the right-hand column to Response Analysis, where copies of all
documents and products can be downloaded.
1 “Follow-up of Consultation on DG ECHO Capacity Building Policy and the Future of
Thematic Funding – 25 April 2008”.

II
CAVEAT
This document is the product of a relatively short development and testing
period in one country plus a certain degree of global level discussion and
read-across from a similar piloting process conducted in Somalia during
2010. As a consequence of this, this facilitation guide should be viewed as
one stage in a process which will continue to evolve (funding permitting).
It is clear that the RAF will require significant further testing, development
and validation in NTT Province, Indonesia and other countries in the
region.
With these issues in mind, all comments on the document and the
approach are welcomed and should be sent to:

III
ACKNOWLEDGEMENTS
The development of the Response Analysis Framework (RAF) for Food
Security and Nutrition was a participatory process involving a number of
individuals and agencies operating at global level and in Somalia and
Indonesia. Funding for the whole project was provided by the European
Commission's Humanitarian Aid and Civil Protection Department (ECHO).
In the case of Indonesia, we would like to express our thanks to the
following: Former FAO Representative for Indonesia Pak Man Ho So,
Assistant FAO Representatives Pak Benni Sormin and Ibu Oemi Praptantyo
for their support in facilitating the project as well as to the staff of the FAO
Country Office. Many thanks also go to Peter Guest and Keigo Obara of
WFP, Jakarta, and to Sonia Blaney UNICEF Indonesia for their constant
support and participation in the development and testing of the RAF
approach in NTT province. We are also grateful for the constant
willingness to collaborate shown by Valerie Ceylon and Fabio Bedini of
WFP Rome. We are indebted to Dr. Tjuk Eko Hari Basuki of the National
Food Security Agency, Jakarta for his supporting role. Special thanks are
due to H.E. Drs. Frans Lebu Raya, the Governor of NTT for his strong
commitment to address food insecurity and malnutrition and for his
continued support of RAF process. We also offer our thanks to Ir. Wayan
Darmawa, MT, Head of BAPPEDA of NTT Province and to Ir. Nico Nuhan,
Head of the NTT Provincial Food Security Office in Kupang for their
engagement and interest in the process and for releasing key staff to
participate and be trained in the RAF approach. Appreciation also goes to
our colleagues in the Kupang offices of UNICEF and WFP for their
participation in and contributions to the district level testing and
development process. We are indeed most appreciative for the support
given by the Bupatis and district level staff as well as staff of local NGOs of
all the RAF pilot districts, namely TTS, Rote Ndao, Alor, Sumba Timur,
Sumba Barat and Kupang, without which the RAF process would not have
been possible. Finally, we give our thanks to the men and women who

IV
participated in focus group discussions giving us valuable insights into the
food security and nutrition situations of their communities, this too was
an invaluable contribution to the RAF process.
Andry Damaledo (Food Security Specialist, Food Security and Nutrition Support
Unit (FSNSU), Kupang)
Mei Juwita (Community Nutritionist, FSNSU, Kupang)
Maarten Immink (Sr. Food Security Adviser, FAO, Rome)
Neil Marsland (RAF Project Manager, FAO, Rome)
Kupang and Rome, March 2011.

V
TABLE OF CONTENTS
PREFACE ................................................................................................ I
ACKNOWLEDGEMENTS ........................................................................ III
TABLE OF CONTENTS ............................................................................. V
SECTION 1: INTRODUCTION TO THE GUIDE ............................................ 1
1.1 Background ...................................................................................................... 1
1.2 Aims And Target Audiences For This Guide ..................................................... 3
SECTION 2: OVERVIEW OF THE RAF PROCESS AND METHODS ................. 7
2.1 Conceptual Framework and Principles ............................................................ 7 2.2 Steps of the RAF Process.................................................................................. 9
SECTION 3: PRE-RAF PREPARATION STAGE .......................................... 17
3.1 Introduction ................................................................................................... 17 3.2 Process Overview ........................................................................................... 18 3.3 Instructional Guidance For Trainers .............................................................. 20 3.4 Further Reading ............................................................................................. 20
SECTION 4: RAF STAGE 1 - SITUATION ANALYSIS AND FORECASTING .... 23
4.1 Introduction ................................................................................................... 23 4.2 Methodological Overview .............................................................................. 24 4.3 Analysis of existing reports and surveys:
Secondary Data Analysis (SDA) ...................................................................... 26 4.4 Problem Analysis ............................................................................................ 31 4.5 Vulnerability Analysis ..................................................................................... 41 4.6 Forecasting and Scenario Analysis ................................................................. 43
SECTION 5: RAF STAGE 2 - FORMULATION OF RESPONSE OBJECTIVES AND
LISTING OF POTENTIAL RESPONSE OPTIONS ........................................ 49
5.1 Response Objectives Formulation ................................................................. 49 5.2. Identifying Relavant and Potentially Feasible
and Appropriate Response Options ............................................................... 51

VI
SECTION 6: RAF STAGE 3 - RESPONSE OPTION ANALYSIS
AND SCREENING ................................................................................. 57
6.1 Overview ........................................................................................................ 57 6.2 Principles, Process and Stages of the Response Analysis Matrix (RAM) ........ 58 6.3 Core Criteria of the RAM................................................................................ 61 6.4 RAF Stage 3(b): RAM Decision Tree ............................................................... 82 6.5 Tips for the District Assessment/Planning Team ........................................... 84 6.6 Instructional Guidance for Trainers ............................................................... 85
SECTION 7: POST-RAF STRATEGY DEVELOPMENT STAGE ...................... 89
7.1 Post-RAF Step (a): Summary Matrix of Feasible
and Appropriate Response Actions ............................................................... 89 7.2 Post-RAF Step (b): Formulation of a District Food
and Nutrition Security Action Plan ................................................................ 92 7.3 Post-RAF Step (c): Integrating Food and Nutrition Security
Actions in Routine District Planning and Budgeting ...................................... 98
SECTION 8: DESCRIPTION OF ANNEXES .............................................. 103

VII
SECTION 1
INTRODUCTION TO THE GUIDE

1
SECTION 1: INTRODUCTION TO THE GUIDE
1.1 Background
Despite considerable investment over the years by government and non-
government actors, and despite a generally adequate availability of food
on local markets, NTT remains one of the most food-insecure Provinces in
Indonesia. Why does chronic and acute food insecurity and malnutrition
persist at such high levels in the Province? In order to shed light on this
question, an assessment of the food and nutrition security situation was
jointly conducted by FAO, UNICEF, WFP, SEAMEO-TROPMED and the
Government of Indonesia in 2009 in seven focus districts of NTT Province.
The seven focus districts were: TTS, Kupang, Alor, Rote Ndao, Sumba
Timur, Sumba Barat and Manggarai. Making use of the collected
information, district food and nutrition security profiles were prepared, as
well as an integrated provincial situation report with information from the
seven focus districts. The findings confirmed the fact that generally
speaking, physical availability of food on markets is not the main food
security problem in NTT, rather it is access to sufficient and balanced food
intake at the household level due to income and food production deficits.
Food insecurity at the household level is exacerbated considerably by
frequent natural shocks, the most important of which are drought and
animal and plant pests and diseases. Adding to the food intake problem,
undernutrition of children was found to be highly correlated with limited
capacity for sound child care, coupled with high disease rates because of
inadequate water and sanitation.
The survey also highlighted the fact that incomplete knowledge of the
causes of food insecurity and nutrition in NTT is only part of the problem.
In addition there were several budgetary and instititutional issues that
placed limits on the degree to which local actors were responding
appropriately to the type and magnitude of problems faced.

2
The key issues included:
• A bias in investment towards emergency and short term investments in
relation to longer term investments that addressed underlying causes.
• A bias towards one part of the Province (West Timor).
• A lack of cross-sectoral planning or vision: Government ministries and
agencies tend to work independently of each other
• “Cut and paste planning” A tendancy for programmes of district
authorities to be continmued from year to year without much
alteration.
The need for a new approach
In the light of the continued persistence of high food insecurity and
nutrition levels in NTT, and mindful of the various institutional and
budgetary issues, the need for a new approach to district food and
nutrition security planning became clear. Such an approach had to meet
the following requirements:
• Establishment of clear links between the causes, nature and severity of
food and nutrition insecurity with appropriate and feasible actions.
• Ensuring that selection of responses was reached through a consensual
process involving key actors and decision makers.
• Ensuring that the process was well-integrated into existing decision-
making, planning and budgeting processes at district, provincial and
central levels.
In order to meet these requirments, a two person Food and Nutrition
Security Support Unit (FNSSU) was established in Kupang to facilitate the
implementaiton of the Response Analysis Framework (RAF) approach. This
Guide is the outcome of a nine month period (June 2010 – February 2011)
of development and field testing of the approach in several districts in NTT
province.

3
1.2 Aims and Target Audiences for this Guide
This Guide attempts to serve the following purposes: First to assist
trainers of District Response Analysis and Planning Teams (DRAPTs) so that
these teams will have the necessary capacity to implement the RAF
process and methods. This is the most important and primary focus of the
Guide. Second to provide guidance to district team leaders that will lead
the RAF process and methods. Third to explain the RAF purpose and
process to interested stakeholders including Bupatis, heads of technical
agencies, parliamentarians, coordinators of civil society and community-
based organisations and other readers at Provincial and National levels.
The Guide is organised by stages of the RAF process and includes a Post-
RAF strategy development stage. Each stage is explained in greater detail
below. Under each stage, main methodological issues are discussed,
followed by practical tips for the district assessment/planning team for the
implementation of the methods. Guidance is provided for trainers on how
to build capacity in the members of the district assessment/planning
team. A number of annexes in the accompanying cd contain material that
expands on points raised in the main text.

5
SECTION 2
OVERVIEW OF THE RAF PROCESS AND METHODS

7
SECTION 2: OVERVIEW OF THE RAF PROCESS AND
METHODS
2.1 Conceptual Framework and Principles
The principal objective of the Response Analysis Framework (RAF) process
as outlined here is to introduce more analytical rigour, transparency and
realism into the final identification of response actions to address chronic
and acute causes of food and nutrition insecurity. Instead of going directly
from the identification of causes of food insecurity and malnutrition to
response actions, an intermediate analytical process is introduced to
identify the most feasible and appropriate response actions that are likely
to have the largest impacts in reducing food insecurity and malnutrition,
by taking full account of constraints. “Response actions” can refer to a
programme, a project, a community-based activity, etc. The analysis also
focuses on ways to overcome constraints, and to take advantage of
opportunities for the implementation of response actions. The process
itself fosters consensus among multiple actors, thus laying the
groundwork for partnerships, and good collaboration and coordination
during the implementation of the response actions. Directly involving high
level decision makers in the planning process also serves as an advocacy
tool to place food and nutrition security issues high on policy and
programme agendas.

8
Figure 1: Response Analysis within the Programme Cycle
– Conceptual Framework
Adapted from IPC Technical Manual Version 1.1
The core activities of the RAF process take place within he shaded boxes in
Figure 1 above. These core activities are directly linked to the district food
and nutrition security situation analysis and generate, through a response
action planning process, feasible and appropriate response actions to be
integrated in district plans and budgets.
A set of core principles guide the implementation of the RAF process.
These can be listed as follows:
• Consensus building: The methods are participatory and inclusive.
Stakeholder participation from different levels (district, sub-district and
village levels) will contribute to the comprehensiveness of both the
situation analysis as well as concensus on key food and nutrition
security response actions.
• Transparency: The food and nutrition security actions that are finally
selected and implemented are identified by building consensus about
their relative priority, and this makes the process transparent to all
involved.
Response Analysis
Response Implementation
Monitoring and Evaluation
Response Planning
Response Options
Identification
Situation Analysis
Current + Forecasted
Response Options Screening

9
• Coordination and Accountability: Consensus building and transparency
contribute to the ownership of those actions and thus lay the
groundwork for sustainable implementation of the food and nutrition
security actions, and to the identification of who are responsible for
the implementation of the actions. As food and nutrition security
actions normally involve a number of different sectors, the joint
planning should lead to better coordinated actions.
• Sustainability and replicability: The RAF should always be firmly
integrated in on-going planning processes and should use simple
methods which are easily replicable. In this way the prosopects of
sustainability are enhanced.
Core Principles of the RAF Process • Consensus building among multiple stakeholders; • Transparency in decision making; • Accountability in implementation of response actions; • Joint planning, collaboration and coordination; • Sustainability through integration into routine planning / decision making processes; • Replicability through simple methods and building on what exists.
2.2 Steps of the RAF Process
The RAF consists of a conceptual underpinning, analytical tools and key
process elements. It has its ‘’roots’’ in situation analysis and its “fruits” in
the identification of feasible and appropriate response options.
Analytically, it consists of the following core steps:
Stage 1: Summarising and/or strengthening situation analysis (1a) and
forecasting (1b).
Stage 2: Formulating objectives for responses and Listing of relevant
response options.
Stage 3: Response options analysis and screening.

10
In the case of district planning processes in Indonesia, these core stages
are complemented by a pre-RAF preparation stage and a post-RAF
planning / strategy development stage.
Pre-RAF preparation stage: Preparation for the planning process. This step
includes all major activities necessary before initiating the food and
nutrition security planning process applying the RAF methods. The step
involves such activities as: formation of the District Response Analysis and
Planning Team (DRAPT), capacity building in assessment, planning and RAF
methods, development of a work plan for the planning process, including
methods to be applied, making contacts with local authorities, informing
them and promoting their participation in the planning process,
mobilisation of the necessary human, material and financial resources for
the field work, and raising an inventory of all available and relevant
information and data with respect to the food and nutrition security
situation in the district.
Stage 1(a) - Situation Analysis: In this stage, the RAF shows what different
aspects of situation analysis mean for response and provides guidance on
how to “plug gaps ” in situation analysis if required.
A good situation analysis should spell out the severity and magnitude of
food and nutrition insecurity of defined population groups over a specified
period of time as well as spelling out why these groups are food and
nutrition insecure (problem analysis). In addition, an understanding of
vulnerability should be a part of situation analysis. Vulnerability helps to
describe the likelihood of future food insecurity.
Stage 1(b) - Forecasting and Scenario Building: In this stage, the RAF is
designed to help guide thinking on the implications of future situations for
food and nutrition security response. It is not the job of response analysis
to undertake scenario analysis and forecasting, but rather to tease out the
implications of this for response planning. If forecasting has not been

11
done, then the RAF provides some guidance on how this could / should be
done.
Forecasting is an essential part of preparing for response analysis. This is
because response implementation (interventions) almost invariably takes
place sometime after situation assessment and analysis are done. So food
and nutrition security conditions for the period of intervention have to be
estimated in order to plan responses.
Stage 2(a) - Formulation of response objectives: Once developed, these
objectives provide the platform for formulation and listing of response
options in line with the objectives. The development of objectives is
informed by the outputs of step 1 of the RAF and also the nature of the
planning framework within which the RAF is situated. This might be a one
year framework; a two to three year framework; or a longer time horizon
(e.g. a five year district development plan). For the RAF, it is important
that the objectives are as Specific, Measurable, Attainable, Relevant and
Time bound (SMART) as possible. Making objectives SMART helps to frame
the second part of this step, which is the listing of relevant response
options.
Stage 2(b) - Listing of Response Options: Only response options that pass
the test of relevance should be listed at this point. Relevance is defined in
relation to the problems (problem tree and problem matrix);
vulnerabilities and forecasts; and the objective itself.
Stage 3(a) - Response Options Analysis: In this step, the listed Response
Options are subject to various tests of feasibility and appropriateness. The
key tool used here is the Response Options Analysis Matrix (RAM). The
RAM is designed to be used to generate debate and ultimately consensus
around the appropriateness and feasibility of different response options in
meeting objectives. It is not a substitute for proper response planning, but
rather is intended to highlight the strengths and weaknesses of responses,
weeding out those which are weak or ill-conceived including those which

12
whilst appearing technically sound in principle, might be entirely
unrealistic in the local context. The RAM proceeds by requiring its users to
score response options against a range of criteria designed to judge
appropriateness and feasibility. This stage of the RAM is meant to be used
iteratively to arrive at an agreed score against each criterion and as a way
to develop tips or guidelines for subsequent planning or project design
processes. This is a critical point which will be explained more fully in the
relevant section. A key criterion in the RAM is the “Do No Harm” principle.
The scoring of each response option against each criterion should be
arrived at through a consensus process involving program specialists with
knowledge of the institutional and geographical landscape of the
intervention area.
Stage 3(b) - Response Options Screening: Here, a simple decision tree is
used to screen the various response options to produce a set of options
which have passed minimum tests of appropriateness, feasibility and do
no harm. One, several or all of these could then be fed into a proper
response planning process which will include detailed design and
budgeting questions outside of the scope of response analysis and the
RAF.
Post-RAF strategy development stage: This consists of three parts.
(a) A preliminary stage of producing a Summary Matrix of Feasible and
Appropriate Response Actions.
(b) Formulation of a free-standing district food and nutrition security
action plan.
and
(c) The final insertion of the feasible and appropriate response actions
into the routine district level planning and budgeting processes.

13
Figure 2: The RAF Process
SMART objective formulation +
Narrative for objective wording
Identification of Response Options
Response Options Analysis and Screening
Problem and Cause analysis Severity and Magnitude information
Risk and Scenario Analysis (Forecasting) for a specific period (the planning horizon)
Stage 1b: Forecasting
Stage 2: Response Identification
Stage 3: Response Options Analysis
Vulnerability analysis
Stage 1a: Situation Analysis
Pre–RAF Preparations
Post–RAF Strategy Development

15
SECTION 3
PRE-RAF PREPARATION STAGE

17
SECTION 3: PRE-RAF PREPARATION STAGE
Objective To make all necessary preparations with district level stakeholders to implement the RAF process.
Key Tasks • Briefing of district authorities.
• Formation of District Response Analysis Team (DRAPT).
• Development of a workplan.
• Capacity building in response analysis methods.
• Mobilisation of resources.
• Compile relevant documentation.
Who? The Team Leader (Facilitator) of the DRAPT carries the responsibility for the adequate completion of these tasks.
How long? The timeframe for this set of activities is 5 - 7 days (not including initial contacts with the district authorities which need to take place 2 – 6 weeks before the start of the process).
3.1 Introduction
For the RAF process to proceed smoothly, it will be necessary to undertake
a number of preparatory activities which include:
• Briefing of district authorities;
• Formation of District Response Analysis and Planning Team (DRAPT);
• Development of a workplan;
• Capacity building in response analysis methods;
• Mobilisation of resources;
• Compile relevant documentation.
The following section describes these activities, referencing examples
which are included as annexes to this document.

18
3.2 Process Overview
• Establish contacts with district authorities to inform about the process
and timing of activities, inviting participation and requesting release of
staff as members of the district assessment/planning team.
This is an advocacy activity to explain the purpose and expected outcomes
of the RAF process and how it relates to routine district level planning and
budgeting. District authorities should include the Bupati, heads of
technical agencies and members of the district parliament. For this
purpose, individual meetings and/or group sessions may be organised
after initial contacts, and an overview presentation coupled with a briefing
note should be prepared. Representatives of local NGOs may also be
included by invitation from the district authorities. Particular emphasis
should be placed on the fact that the RAF process will produce a Food And
Nutrition Security Action Plan (and if so decided, also a Food and Nutrition
Security Strategy for the district).
• Development of a work plan for the RAF process with time-bound
outputs, schedule of activities and responsibilities of team members.
After the initial briefing period, a workplan and budget should be drawn
up for the RAF process. This will be further refined after the District
Response Analysis and Planning Team (DRAPT) has been formed. An
example of a work plan is provided in Annex 3 whilst Annex 42 gives an
example of a budget.
• Formation of the District Response Analysis and Planning Team
(DRAPT).
Food and nutrition security involves several sectors, consequently it is
important that the district team is made up of staff from these sectors. As
a first step in forming a team, it is useful to undertake a stakeholder
2 All annexes are contained in the CD Rom which accompanies this guide.

19
mapping. This consists of identifying all governmental and non-
governmental institutions, organisations and groups that are involved in
planning and implementing activities in the district related to food and
nutrition security. Normally these will include non-governmental
organisations (national and international), community-based
organisations, women’s and farmer groups, and academic/research
projects. In all cases, participation by the district planning department
(Bappeda) is essential.
In general, district agency representatives should be technical staff with
solid knowledge of relevant conditions in the district and with managerial
responsibilities for actions in their respective sectors. In addition, one or
more representatives from the district parliament should be invited to
participate. Lastly, representatives from key local NGOs that support or
implement food and nutrition security actions in the district should
participate in the district team, also to forge stronger partnerships
between the district administration and the NGO community.
One word of caution - A balance needs to be found in each case between
widespread sector representation on the team and the number of team
members. Too large a team will be unwieldy and may slow down progress
with implementing the RAF process. The DRAPT should be thought of as a
core team that undertakes the actual RAF planning, and that consults in
the process representatives and experts when needed who are not
members of the team. Experience shows that the DRAPT size should
preferably consist of no more than 10 members, including participation by
some representatives of local NGOs.
Once the team has been formed, the initial workplan and budget can be
revisited to ensure realism and buy in of the DRAPT team members.
• Capacity building in response analysis methods.
This is an important activity that should contribute to the sustainability of
the RAF process. Especially the first time around, some investment needs

20
to be made in providing training to the DRAPT. The expectation is that in
subsequent years sufficient capacity will be available to repeat the RAF
process without external assistance. However, frequent staff turn-overs
may mean that capacity strengthening is needed each year. The training
can be a combination of short training workshops and learning-by-doing.
The training workshops can deal with conceptual and methodological
aspects, while the actual application of the RAF process offers
opportunities to learn when guided by trainers. A 3-day pre-RAF training
workshop agenda for the DRAPT is attached at Annex 2.
3.3 Instructional Guidance for Trainers
One word with respect to the training facilitation during the preparatory
step - The general approach should always be to build on what the
trainees already know. This means that the training facilitator (trainer)
needs to have from the outset a good idea of who the trainees are, what
they normally do, what experience they have, and what analytical skills
they are generally able to apply. A informal and relaxed chat at the outset
with the trainees may reveal a lot of information in this respect.
3.4 Further Reading
Comprehensive Food Security and Vulnerability Analysis Guidelines - WFP
2009).
http://documents.wfp.org/stellent/groups/public/documents/manual_gui
de_proced/wfp203208.pdf
Emergency Food Security and Vulnerability Assessment Handbook - WFP
2009).
http://www.wfp.org/content/emergency-food-security-assessment-
handbook

21
SECTION 4
RAF STAGE 1
- SITUATION ANALYSIS AND FORECASTING

23
SECTION 4: RAF STAGE 1 - SITUATION ANALYSIS AND
FORECASTING
Objectives (a) To distil general response directions from existing information. (b) To deepen current understanding through additional problem
analysis and forecasting.
Key Tasks • Secondary data synthesis and analysis.
• Desk reviews of existing documentation.
• Focus group discussions.
• Problem or causal analysis.
• Vulnerability analysis.
• Forecasting.
Who? DRAPT, consulting with district level key informants as appropriate.
How long? 2.5 days (0.5 days analysing secondary data, 1 day with village community and 1 day with District officers).
4.1 Introduction
This initial stage involves validating the information contained in existing
studies and surveys undertaken and complementing this with information
from informants on key causes of food and nutrition insecurity problems
and on locational, seasonal, socio-economic and livelihood differences
within the district. The key tools used are a review of existing information
supplemented with development of problem trees and scenario building
Response
Analysis Response
Implementation
Monitoring and Evaluation
Response Planning
Response Options
Identification
Situation Analysis
Current + Forecasted
Response Options
Screening

24
with key informants at district and community levels. Overall, the idea in
this first stage is to apply a response analysis “lens” to existing food and
nutrition security information to see the extent to which key questions are
adequately answered. Where the existing information is not sufficient to
answer these questions (and it usually is not), the RAF offers certain tools
to enrich the picture.
4.2 Methodological Overview
The key questions to be answered in this step of the RAF can be
summarised below:
Table 1: Situation Analysis with a ‘Response Analysis Lens’
Element of current and future situation
Relevance for response formulation
Who is affected by the food and nutrition insecurity?
TARGETING: Knowing who is obviously a key ingredient in targeting. Which person(s) or group(s) need to be targeted for the response? Is the affected group in a specific geographic area, or spread out over a wide area?
How severe is the problem (severity and magnitude of a problem)
SCALE AND URGENCY OF RESPONSE: Understanding severity helps guide the nature and scale of responses Is the situation very severe and widespread therefore calls for large scale emergency interventions?, or it is not as severe and therefore non-emergency measures are more appropriate?
When is there food and nutrition insecurity ?
TIMING OF RESPONSE: At what times of the year do (a) hunger and (b) malnutrition normally peak? (seasonality). This will help in understanding the appropriate timing of different kinds of responses.
Why is there food and nutrition insecurity?
OVERALL STRATEGY: Understanding causes of current food and nutrition security outcomes is normally the most important ingredient in deciding on what problems should be focused on when formulating responses. The problems may be proximate, underlying or structural causes.
What is the likelihood of future food and nutrition insecurity ?
OVERALL STRATEGY: Understanding how the situation in the future may differ from the current situation is important as responses taek place in the future. Thus any possible or expacted changes to current conditions need to be considered and factored in to the analysis.

25
The key tools used to answer these questions are:
• Analysis of existing reports and surveys: Secondary Data Analysis
(SDA);
• Problem analysis;
• Vulnerability analysis;
• Forecasting and Scenario building.
SDA is undertaken to shed as much light as possible on the key issues
indicated in the table relating to causes, current outcomes and likely
future outcomes. Problem analysis, vulnerability analysis and scenario
building are undertaken to enrich and deepen the picture if necessary.
The causal or problem analysis gives an understanding of the causes of
current food and nutrition security status of specific population groups.
Vulnerability analysis and scenario building are designed to increase
understanding of the risk of future food insecurity and malnutrition.
To summarise therefore, a full understanding of current and likely future
food insecurity and malnutrition of specific population groups requires a
review and validation of existing reports and surveys to see the extent to
which they contain sufficient informaiton to address the questions noted
in Table 1. Where there are gaps (and there usually are gaps), it is
important for the response analysis process that these are addressed. The
RAF provides certain tools to help in this, namely:
a) A problem or causal analysis to identify the reasons why people suffer
from food insecurity and/or malnutrition.
b) A vulnerability and a scenario analysis to see the likelihood of future
food and nutrition insecurity and to check the validity of the problem
analysis for the future.

26
4.3 Analysis of existing reports and surveys: Secondary Data
Analysis (SDA)
4.3.1 Overview
The reason for analysing existing information is to look for clues and
directions for appropriate responses. Thus it is not merely a review of the
existing information but a review undertaken using a Response Analysis
Lens.
As a general rule, and whether a situation analysis already exists or not,
maximum use should be made of existing information and documentation.
It is not recommended that primary data collection takes place during this
step, as this is much too time-consuming. A district food and nutrition
security situation analysis report or profile does not need to be an
extensive document for planning purposes, as long as it provides
information with respect to the questions listed in Table 1 above. It is
good to develop beforehand a template for the report to guide the
organisation of available information. Table 2 shows the template for this
information whilst Table 3 gives an example of what this template looks
like when it is filled in, using data gathered from different sources relating
to TTS district.

27
Table 2: District level Secondary Data Analysis Template
District: __________________________________________________________________ Livelihood Zone: ___________________________________________________________
Key questions Findings Implications for response
Prevalence of malnutrition?
How many people are currently food insecure?
Where are they?
Seasonality?
How many people are vulnerable to future food insecurity?
Risk of future food insecurity?
Is food insecurity mainly a food availability problem or a food access problem or both?
What are the key causes of undernutrition?
What are the key factors associated with household food insecurity?

1
Ta
ble
3:
Ex
am
ple
of
com
ple
ted
Te
mp
late
: T
TS
dis
tric
t(i)
Key questions
Findings
Implications for response
Prevalence of malnutrition?
S
tunt
ing
(61%
), u
nder
wei
ght (
56%
) an
d w
astin
g (2
3%)
amon
gst c
hild
ren
unde
r 5
(JA
R a
nd A
CF
).
Mal
nutr
ition
of c
hild
ren
shou
ld b
e a
key
area
of f
ocus
. C
hron
ic c
ause
s of
mal
nutr
ition
as
wel
l as
acut
e ca
uses
sh
ould
be
prio
ritis
ed.
How many people are currently
food insecure?
45%
of H
H a
re in
food
inse
cure
cat
egor
y(ii) (
46,5
00H
H).
8th
mos
t vul
nera
ble
dist
rict o
ut o
f 346
dis
tric
ts n
atio
nally
bas
ed
on a
Com
posi
te F
ood
Sec
urity
Indi
cato
r.
Incr
ease
s ar
gum
ent f
or in
terv
entio
ns w
ith b
road
cov
erag
e.
Str
engt
hens
arg
umen
t for
prio
ritis
atio
n w
ithin
NT
T
How many people are
vulnerable to food insecurity?
33%
vul
nera
ble
to fo
od in
secu
rity
(34,
000H
H(ii
i) )(J
AR
). H
igh
rate
s of
‘mig
ratio
n’ b
etw
een
curr
ently
food
inse
cure
and
vu
lner
able
gro
ups.
Foo
d in
secu
re a
nd v
ulne
rabl
e gr
oups
sho
uld
be tr
eate
d si
mila
rly.
Risk of future food insecurity?
TT
S r
anks
Med
ium
Hig
h to
Ver
y H
igh
in U
NE
P R
isk
Inde
x(iv) .
Maj
or c
ovar
iant
sho
cks
as p
erce
ived
by
HH
are
clim
atic
(d
roug
ht /
irreg
ular
rai
ns, w
ith o
ccas
iona
l flo
ods
in li
mite
d ar
eas)
, and
live
stoc
k an
d pl
ant d
isea
ses.
(JA
R)
Str
engt
hens
arg
umen
t for
a fo
cus
on r
educ
ing
vuln
erab
ility
th
roug
h D
isas
ter
Ris
k R
educ
tion
mea
sure
s as
wel
l as
focu
sing
on
crop
and
ani
mal
dis
ease
s.
Where are they?
Foo
d in
secu
rity
and
unde
rnut
ritio
n m
ore
prev
alen
t in
rura
l ar
eas
(JA
R).
R
ural
are
as to
be
give
n hi
gher
prio
rity
in r
espo
nse.
Seasonality?
Rai
ns a
re n
orm
ally
con
cent
rate
d be
twee
n N
ovem
ber
and
Apr
il.
The
per
iod
betw
een
Oct
ober
and
Feb
ruar
y is
con
side
red
as
the
‘hun
gry
seas
on’ (
low
or
nil h
ouse
hold
sto
cks)
.
Inve
st o
n as
set b
uild
ing
whe
n th
is in
terf
eres
less
with
HH
w
ork
on th
e fa
rm (
June
-Aug
ust)
. Tra
nsfe
rs d
urin
g th
e pe
ak
of th
e ‘h
unge
r pe
riod’
(D
ecem
ber-
Feb
ruar
y) a
re li
kely
to
have
hig
hest
effe
ct o
n H
food
con
sum
ptio
n. C
ash
may
be
pref
erre
d to
food
(se
e be
low
). C
ash
tran
sfer
s at
tim
es o
f pe
ak e
xpen
ditu
res
(Jun
e-Ju
ly, D
ecem
ber)
may
red
uce
the
need
to s
ell f
ood
to in
cur
in ‘s
ocia
l’ ex
pens
es.

2
Is food insecurity mainly a food
availability problem or a food
access problem or both?
Acc
essi
bilit
y in
the
dist
rict a
ppea
rs to
be
quite
goo
d.
Foo
d ac
cess
ape
ars
to b
e th
e m
ain
prob
lem
.
Nee
d fo
r di
rect
tran
sfer
s of
food
is q
uest
iona
ble.
In
crea
sing
pur
chas
ing
pow
er /
hous
ehol
d fo
od p
rodu
ctio
n.
What are the key causes of
undernutrition?
A c
ombi
natio
n of
hig
h ra
tes
of d
isea
se a
nd p
oor
feed
ing
prac
tices
is th
e im
med
iate
cau
se o
f chi
ld m
alnu
triti
on.
Impr
oved
acc
ess
to s
ourc
e of
drin
king
wat
er is
sig
nific
antly
as
soci
ated
with
low
er p
reva
lenc
e of
was
ting
(JA
R)
and
only
22
% o
f HH
hav
e im
prov
ed a
cces
s to
wat
er.
‘Neg
ativ
e’ tr
aditi
onal
chi
ldre
n ca
re p
ract
ices
see
m to
con
trib
ute
heav
ily to
mal
nutr
ition
of c
hild
ren.
Women’s workload
als
o ne
gativ
ely
affe
cts
care
and
nut
ritio
n pr
actic
es.
Nut
ritio
n ed
cuat
ion
shou
ld c
ontin
ue to
be
prio
ritis
ed.
Incr
easi
ng a
cces
s to
saf
e w
ater
sho
uld
have
a p
ostiv
e im
pact
on
nutr
ition
al s
tatu
s.
Act
ions
that
red
uce
/ or
at le
ast d
o no
t inc
reas
e w
omen
’s
wor
kloa
ds m
ay d
irect
ly c
ontr
ibut
e to
impr
oved
nut
ritio
n of
ch
ildre
n.
Dat
a so
urce
s:
•
Join
t Ass
ess
men
t Rep
ort (
2009
), 4
,201
HH
, 7 D
istr
icts
, NT
T P
rovi
nce
; •
FN
SM
S (
4 ro
unds
– J
une-
July
20
09 to
Apr
.-Ju
ne 2
010)
, 250
HH
, 5 D
istr
icts
, NT
T P
rovi
nce;
•
RA
F w
orks
hop,
Jul
y 20
10;
•
AC
F F
ood
Sec
urity
Sur
veill
ance
New
slet
ter,
4th e
ditio
n, M
arch
-Ma
y 20
10 lo
okin
g at
the
prev
ious
3 is
sues
cou
ld o
ffer
som
e pe
rspe
ctiv
es in
to
seas
onal
ity.
Not
es:
(i)
W
e ar
e in
debt
ed to
Fab
io B
edin
i of W
FP
who
dev
elo
ped
the
first
ver
sion
of t
his
in N
TT
pro
vinc
e in
Nov
embe
r 20
10.
(ii)
Com
posi
te H
H f
ood
acc
ess
indi
cato
r, b
ased
on
leve
l of
in
com
e an
d pr
opor
tion
of t
otal
exp
endi
ture
on
food
– 3
gro
ups
(foo
d in
secu
re,
vuln
erab
le, f
ood
secu
re).
(ii
i) B
PS
NT
T, 2
005.
(iv
) T
he ‘
Rec
lass
ified
Glo
bal
estim
ated
Ris
k In
dex
incl
udes
tro
pica
l cy
clon
e, e
arth
quak
e, f
lood
and
lan
dslid
e ca
used
by
prec
ipita
tion
s an
d en
viro
nmen
tally
deg
rade
s ar
eas’
(se
e O
DE
P-c
reat
ed m
ap).

30
4.3.2 Tips for the District Assessment/Planning Team
Do not lose sight of the primary purpose of the SDA, to provide a platform
for identifying and defining response actions. Use Table 2 as a template to
gather and organise relevant information.
4.3.3 Instructional Guidance for Trainers
1. Structure an exercise for the participants to undertake information
and data synthesis using different sources. Provide a brief orientation
about different types of sources, what they may contain in terms of
relevant information and data, and where they may be found.
2. Organise the participants into small groups, each with the task to bring
several documents that contain relevant information and data to the
next session.
3. Each group is invited to prepare a synthesis of the information and
data using Tables 2 and 3 as a guide.
4. Each group is then invited to present their synthesis of the food and
nutrition security situation, and the results presented by the various
groups are compared and discussed. This exercise also helps
participants understand the idea of triangulation of information and
data, addressing the question: “do the different sources report the
same estimations of levels of food insecurity and malnutrition?, and if
not, why not and how to resolve the differences?”

31
4.4 Problem Analysis
4.4.1 Overview
The problem analysis consists of three basic tools:
(a) Problem trees.
(b) Problem matrices.
(c) Critical path analysis using the Pareto principle.
The analysis is undertaken so as to enrich the picture generated from the
SDA.
Problem trees
Problem trees are a simple analytical tool used to summarise the results of
causal analysis. The trunk of the tree represents a main problem, the roots
of the tree the reasons or causes why this problem exists, while the
branches of the tree represent the consequences or effects of the main
problem. It presents an easily understood picture of causes, and how
different causes are linked.
Causes of food insecurity and malnutrition can be divided into immediate
causes, underlying causes, and basic or structural causes. Causes are
linked, so addressing lower level causes will have a knock-on effect to the
higher level causes, however, the knock-on effect may take time to come
through. Therefore, if there is a time constraint and a need to get results
on outcomes quickly, then addressing the immediate causes will be the
priority.
Different geographical areas (e.g. Livelihood Zones) or population groups
may have different FSN outcomes and different causes of those outcomes,
and therefore causal analysis should be undertaken separately for
different population groups and / or geographical areas. The following
figure shows a problem tree from Rote Ndao district.
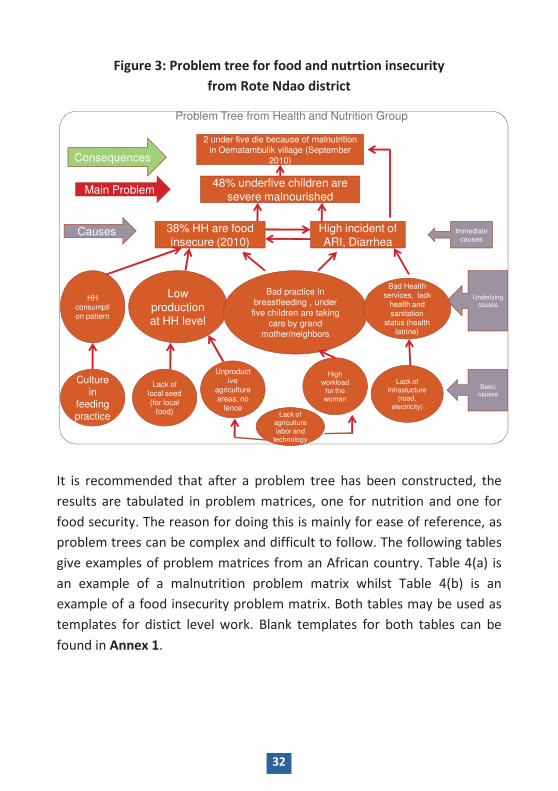
32
Figure 3: Problem tree for food and nutrtion insecurity
from Rote Ndao district
Problem Tree from Health and Nutrition Group
Consequences
Main Problem
Causes Immediate causes
Underlying causes
Basic causes
2 under five die because of malnutrition
in Oematambulik village (September 2010)
48% underfive children are
severe malnourished
38% HH are food
insecure (2010)
High incident of
ARI, Diarrhea
Low
production at HH level
Bad practice in breastfeeding , under
five children are taking
care by grand mother/neighbors
Bad Health
services, lack
health and
sanitation
status (health
latrine)
HH
consumpti
on pattern
Culture in
feeding practice
Lack of
local seed
(for local
food)
High workload
for the woman
Unproduct
ive
agriculture
areas; no
fence
Lack of infrastucture
(road,
electricity)Lack of
agriculture
labor and technology
It is recommended that after a problem tree has been constructed, the
results are tabulated in problem matrices, one for nutrition and one for
food security. The reason for doing this is mainly for ease of reference, as
problem trees can be complex and difficult to follow. The following tables
give examples of problem matrices from an African country. Table 4(a) is
an example of a malnutrition problem matrix whilst Table 4(b) is an
example of a food insecurity problem matrix. Both tables may be used as
templates for distict level work. Blank templates for both tables can be
found in Annex 1.

33
Table 4(a): Malnutrition Problem Matrix
Outcome Immediate Cause
Proximate Causes
Underlying Causes Structural Causes
Example: Wasting in above 15% of U -5 children
Food based (poor/low individual food utilization)
• Low food access (see table 4B).
• See table 4b.
• Poverty
• Failure of State Institutions
• Degraded traditional knowledge systems and community organization structures
• Poor access to formal education systems
• Failure of state institutions
• Poor care practices.
• Heavy time burden for caregivers.
• Inadequate gender relations.
• Low rates of male and female education.
Health based (high disease prevalence)
• Poor environmental sanitation.
• Poor Knowledge Attitudes Practices (KAPs).
• Poor provision of health and medical services.
• Low immunization & inadequate treatment.
• Poor Knowledge Attitudes Practices (KAPs).
• Poor provision of health and medical services.

34
Table 4(b): Food Security Problem Matrix
Food Security Outcomes
Proximate Causes
Underlying Causes Structural Causes
Low food access at household level
• Market supplies limited
• Restricted food supplies due to conflict
• Poverty
• Failure of State Institutions
• Degraded traditional knowledge systems and community organization structures
• Poor access to formal education systems
• Failure of state institutions
• Reduced incomes
• Restricted labour movements
• Reduced unskilled labour opportunities due to competition from IDPs
• Increased IDP numbers
• Reduced social support
• Low household level food crop production;
• Flooded farmlands
• Heavy rains
• Degraded irrigation infra-structure and silted water catchments
• Pest and diseases
• Inadequate access to productive inputs
• Gender relations
• Poor knowledge and skills for production and lack of extension services.

35
From Problem Matrix to Critical Pathways: Applying the Pareto Principle3
The third step in the problem analysis stage is to apply what is called the
Pareto Principle. This states that only a few causal streams that lead to a
problem are responsible for the bulk of the problem (Juran and Gryna,
1988). Examples of this would include the statement that “90% of
repeated violent crimes are caused by 5% of the population,” or “80% of
the yield reduction is caused by two major plant pests.” This principle is
well established in fields such as manufacturing and assembly,
administrative and support services, and marketing. It is also relevant to
food and nutrition security problem analysis and should be used to make
sure that the most critical pathways are identified during design.
4.4.2 RAF Problem Analysis Summary
Developing a problem analysis is the second building block necessary for
response analysis. In the RAF process, it consists of three parts:
development of problem trees, conversion of the trees to problem
matrices and then applying the Pareto Principle to try and identify key
critical pathways. It should be noted that it may not be necessary to
construct a problem tree each time a response analysis process is
conducted. It all depends on circumstances. In a relatviely stable situation
- where not much has changed from one response analysis process to the
next - it may suffice to review existing problem trees and to re-apply the
Pareto Principle. In cases where there have been significant shocks or
other changes since the previous response analysis exercise, it may be
necessary to reconstruct the problem analysis to take account of the
changed circumstances.
3 The text for this paragraph has been extracted from the CARE Project Design
Handbook, Richard Caldwell, TANGO International.

36
4.4.3 Tips for the District Assessment/Planning Team
In conducting the problem analysis, be specific in describing the problem
and the causes, and try to do so selecting key words for the descriptions.
Rather than stating: “under-five children are malnourished”, state:
“stunting is highly prevalent in under-five children”.
1. Problem Trees:
• In order to initiate the construction of problem trees, it may be useful
to take the UNICEF conceptual framework of malnutrition as the
starting point. The three immediate causes in that framework are:
(a) inadequate household food access, (b) inadequate child care, and
(c) poor health status. It can be seen that this is essentially the
structure of the problem tree example from TTS shown earlier.
• When constructing problem trees, draw the causal links last, and
position the cards describing causes so as to minimise the distance of
the lines while trying to avoid intersecting lines.
• The description of the causes should be objective, and be devoid of
value judgements or offensive language. For example, stating as a
cause that “people are lazy” reflects a value judgement, and it does not
indicate anything about why people spend little time in productive
activities. Consequently, it provides no basis on which to identify
possible response actions to address this cause. In this example, also be
careful not to limit what are considered as productive activities to
activities that generate income.

37
2. Problem Matrices:
• The structure of Tables 4(a) and 4(b) above can be used as templates to
summarise the results of the food and nutrtion security problem
analysis.
• Underlying causes are grouped and placed against the relevant
proximate cause that they affect, likewise for the stuructural causes.
3. The Pareto Principle:
• The task here is to take a problem tree or problem matrix and try and
ascertain for a given population group and outcome if there is one
particular causal chain that is more important than another. This
should be done with key informants drawing on existing data.
How to do it:
a) Using the food security problem matrix (Table 4(b)) a relevant
question would be: “Which of the three immediate causes of food
insecurity at household level are most important for the population
group in question? (a) low food availability on local markets;
(b) reduced incomes or; (c) low production of food at household
level?”
b) One useful tool in this regard is pair-wise ranking. Here the three
options are compared against each other in pairs and through a
process of elimination the most important option is identified. For
backgound information on pairwise ranking see:
http://web2.concordia.ca/Quality/tools/18pairwise.pdf
c) Once this has been done, move on to the next level down in the
matrix and ask the same question and use pairwise ranking to help in
the decision.

38
Let us assume that applying the pairwise ranking to the food security
problem matrix (Table 4(b)) has revealed the following:
Problem: Household food insecurity
Immediate causes:
Rank 1: low production of food at household level
Rank 2: reduced incomes
Rank 3: low food availability on local markets
Underlying causes of low food production at household level
Rank 1: Crop pests and diseases
Rank 2: Inadequate access to productive inputs
Rank 3: Poor knowledge and skills
Underlying causes of reduced incomes
Rank 1: Reduced unskilled labour opportunities
Rank 2: Restricted labour movements
Rank 3: Reduced social support (social capital)
Underlying causes of low food availability on local markets
Rank 1: Low production in the area
Rank 2: Low supplies from outside the area
Rank 3: -
Structural causes of Pests and Diseases
Rank 1: Degraded traditional knowledge systems and community
organisation services
Thus the pairwise ranking has identified a critical path which consists of:
Core problem: Household food insecurity; most important cause of
household food insecurity = low production of food at household level;
most important cause of this low production = crop pests and diseases;

39
most important cause of crop pests and diseases = degraded traditional
knowledge systems and community organisation services.
This path then becomes a priority for response options identification. This
does not mean that the other causal pathways should not be addressed,
but rather that addressing these will not have such a large impact on the
core problem as the critical path.
4.4.4 Instructional Guidance for Trainers
Problem Tree:
(i) Structure a group exercise with the objective to understand the
concept of the causal analysis and problem trees, and then to apply
these concepts to construct food and nutrition security problem
trees.
(ii) The first part of the training session should concentrate on a non-
technical problem tree such as presented in Annex 5: Invite
participants to mention a major problem. Then invite them to write
the causes of this problem on cards and pin their contributions to a
board or flipchart. This session can be conducted in plenary session.
(iii) Bring the participants to the front and start forming the problem tree
by clustering the cards and asking where each card should be located
in the tree, and discuss how the causes are linked. If necessary, ask
how cards need to be re-positioned.
(iv) Repeat the exercise with respect to the consequences or effects of
the problem. Once the tree is correct, invite a participant with
guidance from the group to draw the causal lines.
(v) Once the group has grasped the concept, form small groups and
invite each group to construct a problem tree by selecting a major
food security or nutrition problem identified from the situation
analysis.

40
(vi) Next, the small groups each present their problem tree in plenary
session, followed by a general discussion to modify the presented
problem trees as required.
(vii) Materials needed: Coloured cards, markers, tape, flipchart or board.
Problem Matrix:
(i) Following the problem tree exercise, ask the trainees to split into
pairs. First they should focus on the malnutrition outcome and group
the different levels of causes of the outcome into immediate,
underlying and structural causes for relevant population groups
(e.g. children under 5). These causes should then be transcribed into
empty problem matrices and the different pairs should compare their
results.
(ii) The same process should be followed for a food security problem
matrix. Here the unit of analysis is normally the household type
(e.g. female-headed or poor smallholder farmer etc etc).
(iii) Materials needed: Empty problem matrices (see Annex 1).
Pareto Principle:
(i) Demonstrate pairwise ranking using an example.
(ii) Using the pre-constructed problem matrices shown in Tables 4(a) and
4(b), ask the pairs to brainstorm on the most important cause of the
outcomes, using pair-wise ranking as a tool.
(iii) Compare the results and discuss.
(iV) Repeat steps (ii) and (iii) at each stage of the problem matrix to derive
a critical pathway for the outcome. Record areas of debate,
disagreement or uncertainty. Be sure not to rule out non-priortised
pathways, these still may be important, just less important than the
critical path.

41
4.5 Vulnerability Analysis
4.5.1 Vulnerability Analysis Overview
In any given situation, some population groups are more vulnerable than
others to the impact of particular hazards (be they man made or natural).
This is important as two different population groups which are shown to
be suffering from the same degree of food and nutrition insecurity at a
given moment of time may have different degrees of vulnerability to
future shocks. As indicated in Table 5 below, this fact has implications for
the design of appropriate responses – which would be different for the
two groups in question.
Table 5: Vulnerability, food insecurity and response planning
Current Food Security/ malnutrition Status
Vulnerability of Area of Analysis (e.g. livelihood zone)
High vulnerability Low vulnerability
Extremely food insecure
Description: Population is both extremely food insecure and highly vulnerable to future shocks (which would probably cause death or severe suffering) Implication for response: Immediate and high priority to humanitarian/emergency interventions but must address underlying causes also to avoid the current emergency from getting more protracted.
Description: A large shock has driven a previously food secure population into temporary crisis, however asset base remains relatively intact. Implication for response: Prioritize emergency support to address current crisis and probably early recovery.
Food Secure
Description: Population is currently food secure (e.g. due to an exceptionally good harvest) but successive poor seasons have left it vulnerable to future shocks). Implication for response: Prioritize strengthening resilience /disaster risk reduction. This is the window of opportunity to strengthen coping ability to deal better with future shocks.
Description: Sufficient levels of assets combined with current food security means that these households are not likely to be food insecure. Implication for response: Increase incomes through growth promoting interventions which build on existing assets.

42
4.5.2 Vulnerability Analysis Summary
Vulnerability Analysis (VA) is the third building block necessary for
response analysis. In the RAF process undertaken at district level in NTT
province, the VA consists of assigning vulnerability scores (derived through
consultations with experts, and references to secondary information) to
different population groups / areas. The way in which this is done is
explained in the next section.
4.5.3 Tips for the District Assessment/Planning Team
The basic idea here is to reach consensus on a “vulnerability score” for
each population group of interest. The way in which this is done is
normally qualitative, relying on a mixture of key informant opinion and
secondary data. The key variables of interest are:
• Hazard information: frequency and severity of different kinds of shocks
and hazards over a given historical time-period. It is recommended that
the time period is at least 5 years and preferably 10 years plus.
• Ability to cope information: Historical levels of poverty / assets.
Frequency and type of coping strategies (including Coping Strategy
Index scores if available), historical data on food security outcomes,
nutrition, morbidity and mortality outcomes.
On the basis of the available hazard information an “exposure to hazard”
score is given ranging from 1 = very little historical exposure to 5 =
extremely high historical exposure. Similarly, on the basis of poverty,
coping strategy and historical outcome data, an “ability to cope” score is
derived ranging from 1 = very able to cope to 5 = highly unable to cope.
These two scores are then multiplied together to derive an overall
vulnerability score ranging from 1 to 25.
Table 6 illustrates the results of a qualitative vulnerability scoring exercise
for a fictitious population group in one district in NTT province in 2010.

43
Table 6: Vulnerability Matrix
Population GROUP
VULNERABILITY RANKING (SCORE)
A: Exposure to hazard (5=high, 1=low)
B: Ability to cope 5=low; 1=high)
C: Vulnerability Score - AxB. 1=best; 25=worst
Agriculture and livestock farmers in eastern part of district
Score = 3 Drought, crop pests and diseases, livestock diseases
Score = 4 Poverty is high, irrigation low, lack of access to vet drugs
3 x 4 = 12
In this example, the overall vulnerability score is 12. In a qualitative sense,
this would classify the population groups as being “moderately
vulnerable”. These kinds of scores are clearly subjective, but may be useful
to help understand relative vulnerability of different groups within a
district. This is how they should be used.
4.6 Forecasting and Scenario Analysis
4.6.1 Forecasting and scenario analysis overview
Forecasting can be defined as: a calculation or estimate of future events.
In relation to food and nutrition security outcomes, the calculation or
estimate is done in relation to things which will influence the outcomes.
These things may be to do with the weather, or the likelihood of a policy
change or any number of factors which could have an effect on food and
nutrition security outcomes in the future. In order to estimate the impact
of these events, it is necessary to know (a) how much influence an event
would have were it to occur and (b) the likelihood / risk / probability of it
occurring.

44
The fact that some sort of forecast is done is important for response
analysis, this is because response implementation (interventions) almost
invariably takes place sometime after the assessment and analysis are
done. Therefore, food security conditions for the period of intervention
have to be forecasted in order to design responses that are appropriate to
address the conditions that are estimated to exist in that future period.
4.6.2 Tips for the District Assessment / Planning Team
The District Response Analysis and Planning Team should only get involved
in forecasting if it has not been done as part of the situation analysis
process. The following section presents a number of steps and questions
which should be asked by the DRAPT to check if forecasting has been done
correctly.
Starting Question: Has there been an attempt to define food security and
nutrition outcomes which relate to the response planning period?
If no, then the following steps should be taken to arrive at this.
If yes, the process of defining the outcomes should be screened against
the following steps – to make sure that they (the outcomes) were arrived
at using a logical process.
Step (a) Brainstorm on factors or events which could affect current food
and nutrition security outcomes within the planning period;
Step (b) What is the probability of occurrence of these events (draw on
specialized forecasts and projections, e.g. climate forecasts as
required). These include events that can have both positive or
negative impacts. Positive events will help improve the
outcomes while negative events/hazards may worsen the
outcomes. The probablity of the event occuring should be
labelled “high”, “medium” or “low”.

45
Step (c) Estimate the impacts of the high and medium probability
events and processes on the food and nutrition security
outcomes during the projected period/period of analysis. This
should be recorded as “food and nutrition security outcomes
better than current” or “food and nutrition security outcomes
worse than present”.
Estimates of impact will derive from knowledge, experience
and evidence. In the case of adverse events (such as La Nina)
the results of the vulnerability analysis will give a clue as to
whether the population can take action that will be sufficient
to mitigate the effects of the event. The less vulnerable the
population group is to hazards, the less likely the hazards will
cause a serious deterioration in the food security/malnutrition
outcomes.
The results of the above steps can be tabulated in a forecasting
table, an example of which is given in Table 7 overleaf.

46
Table 7: Summarizing the forecasting process - example
Population Group: ________________________________________________________ Planning Period (Start and Finish):___________________________________________
Step (a) Step (b) Step (c) Notes
What events are expected that could modify current food and nutrition security outcomes?
Probability of occurrence of these events - High, Medium or Low
Forecasted Outcomes, - Better, worse or the same as current
Drought High Worse High probability of La Nina drought means that food production will be reduced and prices increased
Crop and pest disease outbreak
Medium Worse Conditions for an increase in locust activiy are good
Change in RASKIN policy: increase coverage and subsidy
Low Better The probability is low, but if it occurred it could be enough to counterbalance effects of drought

47
SECTION 5
RAF STAGE 2
- FORMULATION OF RESPONSE OBJECTIVES AND
LISTING OF POTENTIAL RESPONSE OPTIONS

49
SECTION 5: RAF STAGE 2 - FORMULATION OF RESPONSE
OBJECTIVES AND LISTING OF POTENTIAL RESPONSE
OPTIONS
5.1 Response Objectives Formulation
5.1.1 Response Objectives Formulation Overview
The way in which response objectives are formulated is informed by
information on:
• Severity and magnitude of food and nutrition insecurity for which
groups, when and where?;
• Causes of current observed food security and nutrition outcomes;
Objectives (a) To formulate the key objective of response. (b) To list potential response options.
Key Tasks • Define core objectives for food security and nutrition and make them SMART.
• Define entry points for response options.
• List relevant response options.
Who? DRAPT, consulting with district level key informants as appropriate.
How long? 2 – 4 hours.
Response
Analysis Response
Implementation
Monitoring and Evaluation
Response Planning
Response Options
Identification
Situation Analysis
Current + Forecasted
Response Options
Screening

50
• Vulnerability to future food and nutrition insecurity;
• Forecast changes in current food security and nutrition status.
Combined with:
• Policy framework
• Knowledge of the planning horizon (start and finish).
To help guide the selection of response options, it is necessary to define a
set of objectives which address food insecurity and malnutrition problems
and their causes in the district. Making objectives for response is a logical
continuation of the problem and foecast analysis: problem statements are
turned into positive objective statements. For example, problem
statement: inadequate access to basic foods among small holder farming
households in upland areas; objective statement: improve household
access to basic foods of small holder farming households. Or a
malnutrition problem such as: “75 percent of adult women suffer from
chronic iron-deficiency anaemia”, can be turned into an objective such as:
“to reduce the percentage of iron-deficiency anaemia amongst adult
women”.
Once the objective of response has been formulated, it then needs to be
made Specific, Measurable, Achievable, Relevant and Timebound
(SMART). As an example of a SMART Objective: , the objective “to reduce
the percentage of iron-deficiency anaemia amongst adult women” would
become “ to reduce the percentage of iron deficiency anaemia amongst
50% of women aged 18 – 49 years by 10% by December 2012.
5.1.2 Tips for the District Assessment / Planning Team
Step 1: The first task in this part of the RAF is to convert the core
problem(s) or limiting factor(s) identified in the problem analysis
into one or more objectives. This is a standard technique
employed when developing a logical framework. It consists of

51
simply inverting the language of a problem so that it becomes
an objective. Thus if the problem analysis has identified that the
key limiting factor to household food insecurity is food access,
then the objective would become: “To increase access to food”.
Step 2: The next step is to make the objective SMART. This is achieved
by looking at the severity and magnitude information, the
problem analysis, the vulnerability analysis and the forecasting
and combining these with the planning horizon. Thus to
continue the current example: suppose that the vulnerability
analysis indicates that there is a high risk that the food security
of the target population group would be compromised in the
event of rainfall failure. In addition, suppose that the forecast
indicates that there is a possibility of a la Nina event in the last
quarter of 2010 which would, if it occurred, probably result in
below average rainfall. Finally, suppose that we are dealing with
a one year planning horizon: January–December 2011.
Step 3: Write the objective - All of this information will influence how
the narrative version of the objective “To increase access to
food” can be made SMART. In this case, one possibility for the
SMART objective would be “To provide adequate access to food
for 70% of those classified as facing food security emergency up
to 6 months after the impact of the la Nina event.
5.2. Identifying Relavant and Potentially Feasible and
Appropriate Response Options
Once the SMART objective has been formulated, it then becomes possible
to list response options that are relevant to the objective.
The accumulated evidence from current and past response actions in the
district will help in the identification of response actions (NOTE: This is
where Monitoring and Evaluation and general experience of what works

52
and what doesn’t work is important). The key focus should be on
responses that can make a significant contribution. There may be a
combination of responses required, each addressing different parts of the
causal chain which leads to the core objective.
Three kinds of response options are possible: (a) new actions that have
not previously been implemented, (b) actions that have previously been
implemented but should be modified in their design and/or in the ways
they are implemented, or (c) actions that have been implemented before
and should be continued in the same way.
5.2.2 Tips for the District Assessment / Planning Team
In Section 4.4.1, Table 4(b) tabulated the problem-cause analysis for one
livelihood zone in an African country. In this example, the proximate
causes of low food access are:
• Reduced incomes;
• low household level food crop production; and
• low food availability.
Underlying these three proximate causes are three branches of underlying
causes, which are in turn underpinned by a number of structural factors.
The response options selected should be those which are relevant to
address the problems of reduced incomes and/or low household level
food production and /or low food availability on the market. The
prioritisation of options can be further informed by applying the Pareto
Principle to the problem analysis using pairwise ranking (as explained
earlier in section 4.4).
The first task is to go back to the high priority causal chain (critical path)
identified in the problem analysis after pairwise ranking (see section 4.4),
and select potential response options for the different parts of the chain.

53
Remember that particular response options may have impacts at more
than one level of the chain.
Table 8: Response options for critical path causal chain
Problem(s) to be addressed – entry points Potential / relevant options
Household food insecurity –core problem. Food aid; free cash distribution; food vouchers; food subsidy.
Crop pests and diseases – underlying cause. Pesticide distribution; Integrated Pest Management; Introduction of disease resistant varieties.
Degraded traditional knowledge systems and community organisational services – structural cause.
Community based extension systems (e.g. farmer field schools); state run agricultural extension.
After this has been done, potentional response options for less important
problem chains can also be examined. It will probably be the case that
some options address more than one problem chain. In the case of the
example in section 4.4, it appears that development of community based
extension groups for learning and support would be an option which could
contrbute to both poor knowledge and skills and reduced social support
(social capital). Adding in a micro-finance element could enhance the
impact of this further.
More generally, a number of options may be identified which have the
potential to address the key problems identified and contribute to the
SMART objective.

54
Table 9: General Identification of entry points
and possible responses – some examples
Problems to be addressed - Entry point Potential/relevant Option
Proximate cause (reduced incomes). Cash distributions
Proximate cause (reduced incomes) and underlying causes (flooding due to degraded river banks and / or poor state of road infrastructure - through public works schemes).
Cash for work
Outcome and proximate cause (low food crop production and low food availability).
Food aid
Outcome; proximate cause (low food crop production) and underlying causes (flooding due to degraded river banks and / or poor state of road infrastructure - through public works schemes).
Food for work
Underlying causes (land cultivation and productivity reduced).
Distribution of productive inputs
Underlying cause (degraded irrigation structures and silted water catchments).
Public works contracting
Underlying cause (pest and diseases). Integrated Pest Management
Underlying cause (pests and diseases). Distribution of pesticides and herbicides
Underlying cause (Poor knowledge and skills). Participatory agricultural extension

55
SECTION 6
RAF STAGE 3
- RESPONSE OPTION ANALYSIS AND SCREENING

57
SECTION 6: RAF STAGE 3 - RESPONSE OPTION ANALYSIS
AND SCREENING
Objectives To reach consensus on the appropriateness and feasibility of different response options.
Key Tasks • screen potential response options against tests of appropriateness.
• screen potential response options against tests of feasibility.
Who? District level key informants and the DRAPT.
How long? 0.5 - 1 day.
6.1 Overview
This stage of the RAF consists of applying the Response Options Analysis
Matrix (RAM) tool to response options (like those listed in Table 9). The
RAM proceeds by requiring its users to score response options against a
range of criteria designed to judge the appropriateness and feasibility of
given response options. Options are then screened against the “Do No
Harm” principle and appropriateness and feasibility decision rules.
The final output of the RAM is a set of response options which have
passed initial tests of appropriateness, feasibility and do no harm. One or
more of these options is then fed into the post-RAF strategy development
Response
Analysis Response
Implementation
Monitoring and Evaluation
Response Planning
Response Options
Identification
Situation Analysis
Current + Forecasted
Response Options Screening

58
process described in the next section. The following section describes the
RAM and how to use it.
6.2 Principles, Process and Stages of the Response Analysis
Matrix (RAM)
6.2.1 Principles
The RAM has been designed with four main principles in mind:
Consensus: First and foremost, the RAM is a tool designed to generate
debate, questioning and ultimately consensus around key characteristics
of different response options. It can be used in an interagency context or
by one individual agency, and, as for all the tools in the RAF, it can be used
in development or emergency settings.
Rigour: As much as possible, the RAM draws on current best practice in
terms of criteria for judging the appropriateness and feasibility of
response options in relation to objectives. A scoring system is used to
allow judgments to be made in a transparent and comparable manner.
Flexibility: Whist certain elements of the RAM are constant across
situations, a degree of flexibility is built in to allow the tool to be adapted
as necessary.
Iteration: When applying the criteria it is very important to bear in mind
that the process is not linear. The criteria are meant to be used in a way
that encourages debate and brainstoriming on ways in which particular
response options can be improved. How can an option be made more
timely?, or how can scale up take place more quickly? Through such
questioning and debate amongst response analysts, different response
options can be critiqued and more efficient ways of implementation may
be found. Only after such a process of debate is it possible to move onto
the next criterion. The key points of the debate such as risks and

59
assumptions about the response option in relation to particualar criteria
should be recorded and refered to during the planning process.
With this in mind, the Response Analysis Matrix (RAM) is designed to
capture this iterative process and has a special section for noting down
comments on how a given response option may be designed in such a way
so as to improve performance in relation to different criteria. An example
of the RAM is shown in section 6.3.9 on page 79. Readers are encouraged
to refer to this now so as to understand better the following section
6.2.2 Process and stages of the RAM
In order for the RAM to work properly, it is important that steps be taken
to reduce biases in its use. This is easiest to do in multi stakeholder
settings. Here, the involvement of different agencies with different
agendas and competencies creates good opportunities for checks and
balances. Thus, care should be taken to involve all the relevant
stakeholders at district level.
There are two main variants of the RAM, one for situations in which there
are conflict / civil insecurity issues, and one for peaceful situations. In the
former variant, the RAM is administered in four stages (see below),
whereas in the latter there are three stages (see stages II – IV below).
STAGE I:
Conflict/civil insecurity/access category scores: This score relates to the
intervention area such as the Livelihood Zone.
STAGE II (a) and (b):
Appropriateness and Feasibility criteria: This is the main part of the RAM.
Here, different aspects of each response option are evaluated and scored.
Responses are scored 1 – 5 against vaious criteria. Whilst the criteria used
to screen response options may vary from one response situation (process
or level) to another, it is possible to find a number of “core” criteria that
are common across different situations. In the RAM two types of criteria

60
are used: (a) common criteria: these are criteria which can be applied in a
range of settings (for example they have been applied in a protracted crisis
context in Africa) and (b) tailored criteria: which are more specific to
particular settings. Defining different sets of criteria for response options
analysis in different processes and levels is an area which will continue to
evolve and be refined. Currently, the common criteria - applied to
response options irrespective of the situation (emergency, transition,
development) - are as follows:
• Technical Appropriateness;
• Timeliness;
• Technical / logistical capacity to carry out function;
• Probability of adverse impacts;
• Budgetary issues.
In addtion to the above, the tailored criteria used in the case of NTT
district level work are as follows:
• Sustainability;
• Compliance with rights and obligations;
• Relevance to national and/or provincial policies.
These eight criteria were used in NTT to evaluate the appropriateness and
feasibility of various response options.
STAGE III:
Here, a simple decision tree is used to screen the various response
options. The final output of the RAM is a set of options which have passed
minimum tests of appropriateness, feasibility and do no harm.

61
6.3 Core Criteria of the RAM
6.3.1 Technical appropriateness
Technical appropriateness refers to whether the response option is
justified and appropriate (“fit for purpose”) given the nature of the
problems at hand. This consideration has received a lot of attention in the
literature and there are several sources of information for particular types
of interventions. Key sources include the following:
• “Missing the Point: An analysis of Food Insecurity Interventions in the
Great Lakes”.
http://www.odi.org.uk/resources/download/363.pdf
• The Livestock Emergency Guidelines and Standards (LEGS).
www.livestock-emergency.net
• The Market Information and Food Insecurity Response Analysis
(MIFIRA) Tool.
http://www.springerlink.com/content/20t80w3656428335/fulltext.pdf
• The Emergency Market Mapping and Assessment (EMMA) tool.
http://fex.ennonline.net/35/emergency.aspx
• “When disaster strikes; A Guide to Assessing Seed System Security”.
http://www.ciat.cgiar.org/work/Africa/Documents/sssa_manual_ciat.p
df
• The Emergency Food Security Assessment Handbook (2nd
ed) WFP
(2009).
http://www.wfp.org/food-security/guidelines
These publications are drawn on and referenced in the following section
and should be used in conjunction with “rough and ready “criteria listed
under the tips for facilitators section below.
For the purposes of response analysis, judgments regarding technical
appropriateness can only be made in a general sense and are no substitute

62
for detailed technical appraisals of particular interventions. The idea here
is to use some simple questions and criteria as an initial screening, so that
obviously inappropriate response options can be weeded out. In addition,
the questions serve as prompts for gathering of more information: If the
question cannot be answered then this means that there is insufficient
information upon which to make a judgment regarding appropriateness.
As such, it is incumbent upon the response analyst to request that the
required information is collected.
As for all the criteria in the RAM, technical appropriateness is given a score
ranging from 1 – 5. The meanings of the scores in this case are as follows:
1 = Definitely appropriate.
2 = Balance of the evidence suggests that option is probably appropriate.
3 = Evidence is mixed.
4 = Balance of the evidence suggests that option is probably
inappropriate.
5 = Definitely inappropriate.

63
� Tips for facilitators
Past implementation experience and evaluation findings are important
inputs in deciding technical appropriateness. In addition, the following
guidelines can be used to help the scoring process in relation to the
following types of interventions:
i. Free food distributions;
ii. Food or cash?;
iii. Seed protection rations;
iv. Food for work;
v. Cash for work;
vi. Seeds and tools
distributions;
vii. Supplementary feeding
centres;
viii. Cooking lessons;
ix. Demonstration gardens;
x. Road reconstruction;
Livestock interventions.
(Sources: Levine and Chastre (2004); WFP EFSA (2009); CARE/ Cornell MIFIRA (2010) LEGS 2009,
Sperling 2008).
i. Free food is technically appropriate when:
1. Targeted households lack access to food, and
2. There is a lack of availability of food on local markets and inelastic
supply (thus income support is ineffective in helping to increase
access to food through the market), and
3. Alternative ways of helping people get access to food would either
take too long or might not be practical or reliable.

64
ii. Food and / or cash – how to decide which is technically
appropriate?: As a starting point, use the simple guideline below. For
more detailed guidance refer to WFP EFSA guidelines, or MIFIRA
framework:
Is appropriate food available in sufficient quantities in the local markets?
If No: Can other markets provide it quickly without a spike in prices?
If Yes: Consider cash*
Yes: Consider cash intervention*
No: Consider food assistance
* This assumes that people have physical access to the market. This may not be the
case e.g. for elderly and handicapped / labour constrained hhs. In these cases a
mixture of food and cash may be more appropriate. It also assumes that cash is
not diverted away from food (perhaps due to gender issues – i.e. men controlling
cash expenditures).
iii. Seed protection ration is technically appropriate when:
1. There is a lack of access to food at household level, and
2. There are grounds for believing that without the ration people would
be forced to eat their seeds and would still not have anything to
plant, or more broadly
3. There are grounds for thinking that they would be unable to plant
their seeds properly because they needed to work for cash to meet
food needs.
iv. Food for work is technically appropriate when:
1. Targeted households lack access to food, and
2. There is lack of availability of food and inelastic supply, and

65
3. Targeted households have labour potential that is not currently used
or only poorly paid, and
4. Security and access permit implementation.
v. Cash for work is technically appropriate when:
1. Targeted households have surplus labour, and
2. Access to food for some households is lacking, and
3. Food is generally available for those with purchasing power, and
4. The risk of inflationary pressure is low / a depressed economy needs
a cash injection, and
5. Security and access permit implementation.
vi. Seeds and tools distributions4 are technically appropriate when:
1. Targeted households lack seeds and tools, and
2. There is a general lack of availability of seeds or tools of the right
quality in local markets, and
3. This lack is limiting production and food security, and
4. The type of seeds and tools which are being proposed for distribution
are locally appropriate.
vii. Seed vouchers5 are technically appropriate when:
1. Targeted households lack seeds, and
2. The lack of seeds is limiting production and food security, and
3. Seeds of the right quality are available in local markets; and
4. Targeted household do not have sufficient purchasing power to
afford seeds.
4 The same arguments apply for seed only distributions.
5 For further information on response analysis for emergency seed interventions see
“When Disaster Strikes: A Guide to Assessing Seed System Security”, Sperling 2008
(pp 49 – 56).
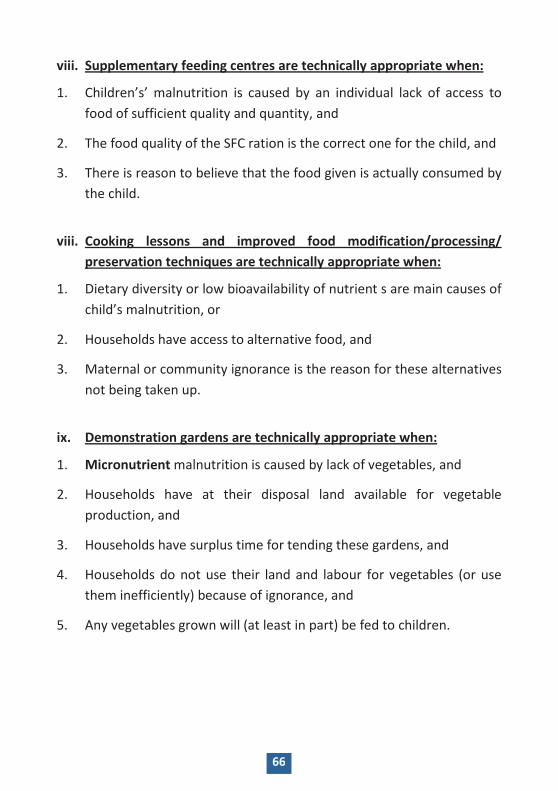
66
viii. Supplementary feeding centres are technically appropriate when:
1. Children’s’ malnutrition is caused by an individual lack of access to
food of sufficient quality and quantity, and
2. The food quality of the SFC ration is the correct one for the child, and
3. There is reason to believe that the food given is actually consumed by
the child.
viii. Cooking lessons and improved food modification/processing/
preservation techniques are technically appropriate when:
1. Dietary diversity or low bioavailability of nutrient s are main causes of
child’s malnutrition, or
2. Households have access to alternative food, and
3. Maternal or community ignorance is the reason for these alternatives
not being taken up.
ix. Demonstration gardens are technically appropriate when:
1. Micronutrient malnutrition is caused by lack of vegetables, and
2. Households have at their disposal land available for vegetable
production, and
3. Households have surplus time for tending these gardens, and
4. Households do not use their land and labour for vegetables (or use
them inefficiently) because of ignorance, and
5. Any vegetables grown will (at least in part) be fed to children.

67
x. Road reconstruction is technically appropriate when:
The existing poor state of roads:
1. Affects access to markets (and humanitarian aid), and
2. Market access is a factor in food security, or
3. Affects security both on and off the road, and
4. Affects the cost of access (in money and time) to essential basic
services.
xi. Livestock Interventions
In the case of livestock, the LEGS Participatory Response Identification
Matrix (PRIM) is an excellent tool for a rapid screening of the
appropriateness of different kinds of livestock interventions in different
kinds of emergencies (full details of the tool can be found in the LEGS
manual pp 23 – 31). By way of illustration, three types of emergencies are
covered in the LEGS manual:
• Rapid onset (earthquake) – illustrated in Table a.
• Slow onset (drought) – illustrated in Table b.
• Complex emergency (drought with conflict) – illustrated in Table c.
These three examples and the further detail contained in Annex 86 are
sufficient for the purposes of the RAM7.
6 Annex 8 reproduces Table 2.1 from the LEGS which relates technical response options
to different kinds of livelihood objectives.
7 The following text and tables are taken verbatim from the LEGS manual pp 26 – 31.

68
Table a: Rapid onset (earthquake)
Technical Interventions
Livelihoods objectives Emergency phases
Rapid assistance
Protect assets
Rebuild assets
Immediate aftermath
Early recovery
Recovery
Destocking n/a n/a n/a
Vet. services ** ***** *****
Feed ** ***** *****
Water * * *
Shelter *** *** ***
Provision of livestock
n/a n/a *****
Key:
Scoring against livelihoods objectives:
***** = significant benefits / highly appropriate
**** = benefits / appropriate
**** = some benefits
** = a few benefits
* = very little benefit
n/a = not appropriate
Emergency phases: = appropriate timing for the intervention.

69
Notes:
• Accelerated off-take cannot provide rapid assistance to households
affected by crisis since in this particular case the normal market system
is not operating.
• Veterinary interventions could provide both rapid assistance (by
helping to keep alive those animals that have survived the disaster) in
the immediate aftermath, and make a significant contribution to
protecting and rebuilding livestock assets in the early recovery and
recovery phases.
• The provision of feed may also contribute to protecting and rebuilding
these livestock assets, although it may not contribute much to rapid
assistance. If there is advance warning of the earthquake, some
measures may be taken to stockpile feed (and water).
• The provision of water may provide some small benefit depending on
the effect of the earthquake on existing water supplies.
• Shelter-related interventions may contribute to both rapid assistance
and protecting and re-building assets, depending on the type of
livestock kept and their shelter needs. If sufficient warning is given,
shelter provisions for livestock may help save their lives in an alarm
phase (e.g. by moving them out of buildings that may collapse into
open spaces). In the immediate aftermath and early recovery phases,
the provision of warm and / or dry shelter for affected animals can
make a significant contribution to the protecting and rebuilding of
assets.
• In terms of rebuilding assets, restocking may make a significant
contribution, helping those who have lost stock to begin to recover
some livestock assets. This can only take place in the recovery phase
however.

70
Table b: Slow onset (drought)
Technical Interventions
Livelihoods objectives Emergency phases
Rapid assistance
Protect assets
Rebuild assets
Alert Alarm Emergency Recovery
Destocking ***** *** **
Vet. services (*) ***** ****
Feed (*) *** ****
Water (*) *** ****
Shelter n/a n/a n/a
Provision of livestock
n/a n/a *****
Key:
Scoring against livelihoods objectives:
***** = significant benefits / highly appropriate
**** = benefits / appropriate
**** = some benefits
** = a few benefits
* = very little benefit
n/a = not appropriate
Notes:
• A slow onset drought in Africa shows a very different pattern of
interventions and timings compared to an earthquake. In the alert and
alarm phases, accelerated off-take makes a significant contribution to
providing rapid assistance to affected families through the provision of
cash. This can be used to support the family and to protect assets (to
the extent that the remaining livestock have less competition for scarce
resources, and also that some of the cash generated may be used for
Emergency phases: = appropriate timing
for the intervention.

71
animal health and feed for the remaining livestock). If the timing of the
intervention is left until the emergency phase, then accelerated off-
take may no longer be possible because the condition of the animals is
too poor. In this case, slaughter destocking (shown by the dotted
arrow) can provide rapid assistance to affected households.
• In this example, the drought is in the early stages (alert / alarm) and
hence the preference would be for accelerated off-take rather than
slaughter de-stocking, as the former places cash in the hands of the
livestock owners and encourages market processes.
• Animal health interventions, which may be carried out during all
phases of a drought, can have a significant impact on protecting and
rebuilding livestock assets through preventing death and disease in the
heard and strengthening livestock resistance to drought.
• The provision of feed and water during the alarm and emergency
phases of a drought can help to protect the remaining livestock assets
and rebuild the herd for the future.
• In this particular example, the provision of shelter is not appropriate.
• In the recovery phase, the provision of livestock (“restocking”) can
make a significant contribution to rebuilding livestock assets.

72
Table c: Complex emergency (slow onset drought with conflict)
Technical Interventions
Livelihoods objectives Emergency phases
Rapid assistance
Protect assets
Rebuild assets
Alert Alarm Emergency Recovery
Destocking *** * *
Vet. services (*) ***** ****
Feed (*) ***** *****
Water (*) ** **
Shelter *** *** ***
Provision of livestock
n/a n/a *****
Key:
Scoring against livelihoods objectives:
***** = significant benefits / highly appropriate
**** = benefits / appropriate
**** = some benefits
** = a few benefits
* = very little benefit
n/a = not appropriate
Notes:
• Comparing this matrix with the drought example, most of the
interventions remain appropriate and have the potential for significant
benefits to the affected communities, such as vet services, feed, water
and provision of livestock
• However, accelerated livestock off-take is not appropriate in this
conflict situation, since market systems and infrastructure are severely
Emergency phases: = appropriate timing
for the intervention.

73
disrupted. Slaughter destocking could be possible, depending on the
operational constraints under which agencies are working.
• Feed provision has the potential to help protect and rebuild livestock
assets, particularly for communities who may be confined to camps
and not able to take their stock to pasture. Similarly water provision for
livestock which cannot be taken to the usual water sources because of
insecurity may help to protect and rebuild livestock assets.
• Shelter or enclosures for livestock, not relevant in the context of the
drought example, may become an important issue because of
displacement and insecurity (for example the danger of looting).
• All these interventions depend upon the ability of agencies to operate
within the conflict situation.
6.3.2 Timeliness
The key criterion here is what is the likelihood of the intervention
achieving significant impact within the time period (as defined by the
objective and the planning horizon). For this criterion, the Response
Analyst should use local knowledge of the area, timing and institution(s)
involved in the implementation of the intervention. Thus this criterion is
not merely related to the type of intervention, but also the operational
and contextual environment in which it will be implemented. When
reviewing this criterion a number of supporting materials may come in
handy. These include a seasonal calendar for the area and results of past
evaluations and experiences.
The scoring is as follows:
1 = Impact within the timeframe very likely.
2 = Impact within the timeframe likely.
3 = Impact within the timeframe questionable.
4 = Impact within the timeframe somewhat unlikely.
5 = Impact within the timeframe highly unlikely.

74
� Tips for Facilitators
• Reference to monitoring and evaluation results and past experience in
implementing similar projects in the past are useful in estimating
project timeliness.
• When scoring it is helpful to split the response option into phases in
order to estimate, based on experience, the length of time each stage
will take. Estimate timings for, for example, resource mobilization, set-
up, delivery of materials; initial outputs and intermediate results; as
well as eventual impacts.
6.3.3 Technical/logistical capacity to carry out function
The feasibility of implementing an intervention and the likelihood of it
having an impact may be related to the technical / logistical capacity to
carry out the response. The absence of capacity at sufficient scale to
achieve required impact in a given geographical area / in relation to a
particular population group / in a particular timeframe may not be
important IF such capacity can be scaled up quickly. If scaling up is difficult
then it does become important. Capacity issues may be highly location,
time and agency specific, requiring local knowledge to make informed
judgments. A 3W matrix (who? what? where?) which indicates which
agencies are operational in a given area is very useful when scoring
response options against this criterion. Evaluation results would also be
useful to determine if agencies in the 3W matrix successfully implemented
similar responses in the past.
It is worth noting that a number of broad institutional issues related to
response capacity have previously been identified in NTT Province8. The
most relevant ones can be grouped together as: (a) lack of intersectoral
8 See for example: FAO, WFP and UNICEF: “Nutrtion Security and Food Secuirity in Seven
Districts in Ntt Province, Indonesia: Status, Causes and Recommendations for
Response” (February 2010).

75
coordination, (b) limited local institutional implementation capacity, and
(c) poor availability, analysis and use of food and nutrition security
information in decision making and action planning.
The scoring for this criterion is as follows:
1 = Capacity currently exists at sufficient scale for required impact.
2 = Capacity exists at lower than sufficient scale and can be scaled up
quickly.
3 = Capacity does not exist at all but could be scaled up.
4 = Capacity exists but scaling up is difficult.
5 = Capacity does not exist and establishment would be difficult.
6.3.4 Probability of adverse impacts (“Do No Harm”)
This answers the question: will the intervention have a negative impact on
the intended target group or other groups. “Doing no harm” is a core
principle for any intervention. Harm in this case can refer to a range of
negative consequences including potential for creating/exacerbating
conflict, environmental harm, potential for exacerbating inequalities and
injustices, and potential for creating dependency, etc. A careful
examination of the situation analysis, including socio-political and
environmental situation is very important in making informed judgements
regarding if the response option will do more harm than good. Again, past
experience in the same or similar area will be very useful in making such a
judgement.
The scoring is as follows:
1 = Very low probability of any adverse impacts.
2 = Low probability of adverse impacts.
3 = Probability of negative impacts for some population groups is 50:50.
4 = On balance likely to have unacceptable negative impact(s).
5 = Highly likely to have unacceptable negative impact(s).

76
6.3.5 Budgetary issues
Are budgetary issues likely to compromise the implementation of the
response option? This may or may not be related to the actual financial
cost of the option. For example, it might be the case that the availability of
funds for a particular type of programme is restricted due to a policy
decision on the part of donors or government. Actual financial cost could
be an issue in cases where, for example, difficult terrain makes mounting a
response option very expensive. This issue may pose a bigger problem for
certain options (e.g. those requiring a lot of road transport of materials)
than others which are more service oriented – e.g. training. Local
knowledge of particular areas, characteristics of different interventions as
well as budgetary issues will be useful here.
The scoring is as follows:
1 = No evidence to suggest that budgetary restrictions will compromise
the likelihood of funding or the performance of this response option.
2 = Budgetary issues have a slight possibility of adversely affecting
funding and / or performance.
3 = Some likelihood.
4 = Quite likely.
5 = Budget restrictions will make this response option unlikely.
6.3.6 Sustainability
Sustainability has several dimensions: financial, political, social and
institutional. For example, sustainability may mean that it is likely that
there will always be sufficient government resources to finance the
response action and sustain its impacts. Linked to that may be political
sustainability; i.e. political decision makers support the response action
and may even fight for it. If a response action is implemented by one or
more institutions that have a high level of commitment to this action, its
institutional sustainability may be high. If a response action is strongly

77
endorsed and supported by community or grass roots groups it may be
socially sustainable.
Scoring:
1 = Almost certain that the action and its impacts will be sustainable;
2 = Likely that the action and its impacts will be sustainable
3 = There is a 50:50 chance that the action will be sustainable;
4 = The action has a middle to low probability of being sustainable.
5 = The action is unlikely to be sustainable.
NOTE: This is an instance where questions can be raised about
complementary actions necessary to increase the sustainability of the
action and its impact.
6.3.7 Compliance with Rights and Obligations
Citizens have a right to be heard and have their views taken into account
in decisions that affect them. What is the likelihood that the citizens
targeted by the response option will have rights in relation to it?
Use the following criteria and scores:
5 = No consultation at all.
4 = Populations contacted to provide information.
3 = Populations consulted on implementation modalities of response
option.
2 = Populations fully involved in design of and implementation
modalities of response option.
1 = Populations involved in design, management and implementation
modalities.

78
State, UN and NGO providers have an obligation to be accountable,
transparent and responsive to the grievances and needs of the
populations. To judge the degree to which providers of response actions
are meeting their obligations to their citizens and clients use the following
criteria:
5 = Completely unaccountable, unresponsive and not transparent.
4 = Accountability in relation to actions which impinge or affect the
physical safety of target populations.
3 = Consultation mechanisms set up for articulation of grievances are
operational for some issues.
2 = Consultation mechanisms are set up and compensation
arrangements are operational.
1 = Guaranteed, local level fora for airing of views of the population and
enforceable mechanisms for ensuring responsiveness to views.
Note that the scores for rights and obligations should be closely matching.
6.3.8 Relevance to national and/or provincial policies
Achievement of the objectives and targets contained in national or
provincial policies, strategies or action plans usually depends partially on
local level actions. There should be some degree of harmony between
national and provincial policy objectives, and the objectives of local level
strategies and action plans. For example, district level food and nutrition
security actions in Indonesia should generally be in line with the objectives
of the National Food and Nutrition Action Plan 2011-2015, and the food
security and health policy priorities established by the current
administration in NTT Province.

79
Scoring:
1 = action is directly in line with national and/or provincial policy
objectives.
2 = action is in a broad sense linked to national and/or provincial
objectives.
3 = some parts of the action are and some parts are not.
4 = action is weakly linked to national and/or provincial objectives.
5 = action is not linked to any national or provincial policy objective and
may be going against one or other objective.
6.3.9 Tabulating the RAM scores
After all the appropriateness and feasibility criteria have been applied to
the various response options, each option will have individual scores in
relation to given criteria and also an “overall” score, as indicated in
Table 10(a) overleaf.
When filling in the matrix it is important to remember that:
(a) the various scores for each option should have been arrived at through
a thorough process of discussion and use of the scoring system. An
important part of this is the iterative exploration of ways that individual
scores for particular response options under particular criteria can be
changed (vis. one of the principles (#3) of the RAM listed on above).
Through this process, response analysts explore different modalities for
particular response options so that the lowest scores for each individual
criterion can be achieved.
and
(b) the most important issue with the scoring is the score per criterion.
The “overall” score per response option will only come into play in quite
specific circumstances, as explained in RAF Stage 3(b).

80
Ta
ble
10
(a):
Ex
am
ple
of
a R
esp
on
se A
na
lysi
s M
atr
ix
Dis
tric
t:___
____
____
____
____
___
____
____
____
____
__
Obj
ectiv
e O
bjec
tivel
y V
erifi
able
In
dica
tor
(OV
I)
Res
pons
e O
ptio
ns
Tac
h A
ppro
p T
ime
In
stit.
C
apac
ity
Pro
b.
of
Neg
. Im
pact
Bud
get
Issu
es
Sus
tain
-ab
ility
Rig
hts
and
oblig
atio
ns
Nat
. &
Pro
v.
Pol
icie
s
Ove
rall
Add
ress
out
com
es a
nd im
med
iate
cau
ses
To
Red
uce
nutr
tiona
l w
astin
g
amon
gst
vuln
erab
ile
grou
ps in
th
e di
stric
t
% o
f chi
ldre
n un
der
5 ye
ars
was
ted
(ann
ual
aver
age)
re
duce
d fr
om
20%
in 2
010
to 1
5% in
20
15
Sup
plem
enta
ry fe
edin
g fo
r ch
ildre
n un
der
5.
Vita
min
A a
nd Ir
on
supp
lem
enta
tion;
fort
ifica
tion
and
dew
orm
ing.
P
rovi
de o
utpa
tient
ther
apeu
tic
feed
ing
for
the
seve
rely
acu
tely
m
alno
uris
hed
child
ren.
D
istr
ibut
e w
ater
pur
ifica
tion
tabl
ets
and
dem
onst
rate
thei
r us
e.
Bre
astfe
edin
g, c
ompl
emen
tary
fe
edin
g, h
ygie
ne a
nd s
anita
tion
coun
selli
ng.
Lau
nch
oper
atio
nal r
esea
rch
on th
e re
duct
ion
of w
ork
burd
en
for
carin
g m
othe
rs.
1 1 1 1 1 2
1 1 1 1 4 5
1 3 2 2-3
4 3
1 1 1 1 1 1
3 3 2 3 2-3
4
4 3 4 3 3 n/a
n/a
n/a
n/a
n/a
n/a
n/a
3 2 1 1 2 3
14
14
12
12.5
17
.5
18

81
Ta
ble
10
(b):
Ke
y a
ssu
mp
tio
ns
an
d d
esi
gn
iss
ue
s th
at
wil
l im
pro
ve
sco
res*
Opt
ion:
Sup
plem
enta
ry fe
edin
g fo
r ch
ildre
n un
der
5.
Criterion
Key assumptions and design issues
Tim
elin
ess
Inst
it. C
apac
ity
Pro
b. o
f Neg
. Im
pact
s
Sus
tain
abili
ty
Fin
anci
al c
ost (
in r
elat
ion
to a
vaila
ble
budg
et)
Gov
erna
nce
Nat
iona
l and
pro
vinc
ial p
olic
ies
Impa
ct o
n re
duci
ng v
ulne
rabi
lity
* T
his
te
mp
late
sh
ou
ld b
e u
sed
fo
r a
ll o
pti
on
s li
ste
d.

82
6.4 RAF Stage 3(b): RAM Decision Tree
This decision rules are presented in Figure 4:
1. If, after iteration and following Table 10(b), a given response option
still scores a “5” on any of the criteria, then it should be excluded as it
is inappropriate and/or not feasible.
2. For all remaining options: If any score a “4” in relation to the
possibility of adverse effects (“do no harm”) criterion, then they
should also be excluded as they are deemed to be likely to have
unacceptable negative consequences.
3. Any other options scoring a “4” on any of the other criteria should not
be preferred unless there are compelling arguments to the contrary
(e.g. they have very low scores in relation to all other criteria).
4. Finally, and only if necessary (due e.g. to budget restrictions), further
discrimination between options would be possible making use of the
total score column.

83
Figure 4: RAM Decision Tree
Does the response option score “5” in any of the
columns?
If yes, EXCLUDE
If no, does the response option score “4” in relation to the “”do no
harm” criterion?
If no, then the response option passes the “do no
harm” test.
If yes then the option
should be excluded.
Does the response option score “4” in any of the
columns?
If yes, then the option
should not be preferred.
If no, then the option meets the minimum standards of
appropriateness and feasibility.
If necessary due to resource or capacity constraints, discrimination on the basis of total scores may be considered.

84
6.5 Tips for the District Assessment/Planning Team
1. RAF Stage 3 represents another opportunity for consensus building to
arrive at the score on each of the feasibility/appropriateness criteria in
step 3(a) and for the subsequent screening of options in step 3(b). To
start off, the DRAPT should ensure that all members have the same
understanding of each of the criteria. This is essential before
beginning to assign a score to each response action If necessary, the
team may want to consult specific experts to obtain clarification.
2. The team should consider whether there is a need to define new
criteria or eliminate any of the existing criteria in the specific setting. If
a new criterion is added, a specific definition needs to be provided to
arrive at the scoring system for that criterion.
3. The current scoring system is set up in such a way that the lower the
score, the more feasible or appropriate the action is deemed to be.
4. By adding up the score of each criterion, we obtain the aggregate
score to be recorded in the last column of the matrix.
5. Looking at the distribution of total scores, cut-off points can be
established to categorise actions as, for example, “highly
feasible/appropriate”, “feasible/appropriate”, or “not likely to be
feasible or appropriate”.
6. The RAM decision tree is useful for getting consensus on the need to
screen out certain options and /or if it becoems necessary to compare
one option against another on the basis of a total score.

85
6.6 Instructional Guidance for Trainers
Two aspects are fundamental in this process, and both need to be
mastered well by the DRAPT members. First, a solid understanding of the
feasibility/appropriateness criteria, and second, how to apply the relevant
criteria in selecting and prioritising food and nutrition security actions.
Understanding the feasibility/appropriateness criteria
• Divide the participants into small groups. Each group selects several
criteria from the list described above and members write on cards in a
few key words what their interpretation is of each criterion. If they
consider any of the criteria as being irrelevant, they provide in a few
words the reasons.
• Once the small group work is completed, each group presents their
cards upfront, and the results are discussed by all to reach a consensus
about what key words best describe the criterion.
• Next, the small groups are invited to think of any additional criterion
they consider relevant, and again describe the criterion with a few key
words.
• The cards with key words are presented and discussed in plenary
session, and a consensus is reached whether to include or not any
additional criterion.
• Lastly, the list of criteria is finalised by consensus.
Applying the relevant feasibility/appropriateness criteria
• The final list of criteria is to be applied to a set of relevant response
options.
• In their groups, the trainees should apply the criteria to the same
response options.

86
• The results of each group should then be presented and compared.
Where there are large divergences between groups this should be
explored and a consensus reached.
Applying the RAM decision tree
• Once the feasibility and appropriateness criteria have been applied, the
application of the RAM decision tree is straightforward. Each trainee
should simply run-through the decision tree on the response options.

87
SECTION 7
POST-RAF STRATEGY DEVELOPMENT STAGE

89
SECTION 7: POST-RAF STRATEGY DEVELOPMENT STAGE
This consists of three parts:
(a) A preliminary stage of producing a Summary Matrix of Feasible and
Appropriate Response Actions.
(b) Formulation of a free-standing district Food and Nutrition Security
Action Plan.
and
(c) The final insertion of the feasible and appropriate response actions
into the routine district level planning and budgeting processes.
7.1 Post-RAF Step (a): Summary Matrix of Feasible and
Appropriate Response Actions
It is recommended that as a preliminary step an intermediate Summary
Matrix of Feasible and Appropriate Response Actions is produced (see
Table 11 overleaf).
The matrix consists of 4 columns:
• Causes of food insecurity and malnutrition, divided into immediate,
underlying and basic causes – from Stage 1;
• List of relevant response options corresponding to various causes –
from Stage 2;
• Appropriateness / Feasibility rating (score) of each response option –
from stage 3; and
• Final priority rating, to establish a list of feasible and appropriate
response actions.
This last step requires discussion, negotiation and consensus building
among the DRAPT members. Response actions that have both a poor

90
rating on some criteria and a good rating on others may be assigned an
average overall rating and thus a second level priority.
Table 11: Post-RAF Summary Matrix of Appropriate
and Feasible Response Actions
District:___________________________________________________________
Causes (From RAF Stage 1)
Food And Nutrition Security Response Options (From RAF Stage 2)
Feasibility/ Appropriateness Rating (From RAF Stage 3)
Final Priority Rating of Food And Nutrition Security Actions (1=high priority; 2= average priority; 3= low priority)
Food Security
Immediate Causes
Underlying Causes
Basic Causes
Nutritional Status
Immediate Causes
Underlying Causes
Basic Causes

91
7.1.1 Tips for the District Assessment/Planning Team
Once an inventory of feasible and appropriate response actions has been
formulated, it will be useful to organise an event with local experts
(decision makers, district officials, programme managers, technical staff,
community leaders) to present the draft inventory and obtain feedback
and validation. This expert group may also come up with alternative
response actions (not included in the inventory or variations of the actions
that are included). These inputs lay the ground work for the formulation of
the district Food and Nutrition Security Action Plan (Post-RAF Step (b)).
This session should also be designed to create further ownership among
multiple stakeholders of the district food and nutrition security
implementation plan.
7.1.2 Instructional Guidance for Trainers
(i) This step is less mechanical than it may appear. There is one aspect in
which a bit of training may be useful: how to establish and reach a
consensus about priorities to complete the Post-RAF Step (a)
Summary Matrix of Feasible Response Actions.
(ii) Present a brief discussion on how to build consensus and how to
negotiate.
(iii) Organise the participants in two groups, and invite each group
independently to decide on a set of appropriate and feasible
response actions that are assigned high, average and low priority
rating.
(iv) Bring the two groups together, and start a process of negotiation
between the two groups to establish a consensus about a common
list of high, average and low priority actions.
(v) Observe and facilitate the negotiations, commenting during or
afterwards on how negotiation skills (arguments, approaches, use of
leverage points, leadership) are being used in the consensus building.

92
(vi) Facilitate a brief wrap-up session to summarise the main points of
the consensus building process.
7.2 Post-RAF Step (b): Formulation of a District Food and
Nutrition Security Action Plan
7.2.1 Overview
The ultimate aim of the post-RAF process is to have the feasible and
appropriate food and nutrition security actions incorporated in the
routine annual district plan and budget. This can occur immediately
following RAF Stage 3. However, the annual district planning periods are
normally short (in NTT Province: 2 days), and it may not always be possible
to have the RAF process take place just prior to the routine planning
period. Thus, having a formal and well-analysed Food and Nutrition
Security Action Plan in place that is owned by multiple stakeholders serves
a dual purpose: (a) a clear reference for planners for decisions with
respect to the food and nutrition security actions to be included in the
routine plan when it is being formulated; and (b) a document that serves
as an advocacy and awareness raising tool with respect to food and
nutrition security problems in the district and the need to act to reduce
food insecurity and malnutrition. For this last purpose it would be good to
have an accompanying district Food and Nutrition Security Strategy in
place as well (Annex 6). Such a strategy can also provide important inputs
for the formulation of the district 5-year plan, because it presents a more
long-term vision of what is to be achieved, and because it links up with
actions by several sectors due to the multi-sectoral causality of food
insecurity and malnutrition.
7.2.2 Tips for the District Assessment/Planning Team
The Post-RAF Step (b) Food and Nutrition Security Action Plan of the
District matrix has been developed to summarise the main elements of
the action plan (see Table 12 on pg. 94). The matrix has the following
columns: (a) appropriate and feasible response actions organised by

93
immediate, underlying and basic causes – from RAF Stage 3;
(b) description of the livelihood zone(s) and locations where the action is
to be implemented and the groups at which the action is to be targeted (if
any); (c) time-bound and verifiable (operational) target(s) of the response
action expressed as indicator(s); (d) yearly operational targets;
(e) required human, material and financial inputs; (f) an indicative budget
for each of the years of the planning period; (g) sources of funding (district
budget, donor funding, national programme funding, etc.); and
(h) responsible institutions and/or agencies (governmental and non-
governmental). An additional column can be added to comment on certain
design features of the action which may have been identified during the
analysis in order to build on identified strengths and mitigate weaknesses.

94
Ta
ble
12
: P
ost
-RA
F S
tep
(b
): F
SN
Act
ion
Pla
n o
f th
e D
istr
ict
District:___________________________________________ Time Period: ______________________________________
Immediate Cause:
Fea
sibl
e an
d A
ppro
pria
te
FS
N A
ctio
ns
Loca
tions
an
d T
arge
t G
roup
(s)
Indi
cato
r(s)
an
d T
ime-
Bou
nd
Tar
gets
Tar
gets
by
Yea
r R
equi
red
Inpu
ts
Indi
cativ
e B
udge
t by
Yea
r
Sou
rces
of F
undi
ng
Res
pons
ible
A
genc
ies
2011
20
12
2013
20
14
2015
I
II III

95
Underlying Cause:
FS
N A
ctio
ns
Loca
tions
an
d T
arge
t G
roup
(s)
Indi
cato
r(s)
an
d T
ime-
Bou
nd
Tar
gets
Tar
gets
by
Yea
r R
equi
red
Inpu
ts
Indi
cativ
e B
udge
t by
Yea
r
Sou
rces
of F
undi
ng
Res
pons
ible
A
genc
ies
2011
20
12
2013
20
14
2015
I
II III

96
Basic Cause:
FS
N A
ctio
ns
Loca
tions
an
d T
arge
t G
roup
(s)
Indi
cato
r(s)
an
d T
ime-
Bou
nd
Tar
gets
Tar
gets
by
Yea
r R
equi
red
Inpu
ts
Indi
cativ
e B
udge
t by
Yea
r
Sou
rces
of F
undi
ng
Res
pons
ible
A
genc
ies
2011
20
12
2013
20
14
2015
I
II III

97
Post-RAF Step (b) should serve to raise awareness about the major food
and nutrition security issues in the district and create widespread
ownership of the action plan, thus laying the groundwork for its
implementation. This means that the process of formulating the district
Food and Nutrtion Security action plan should be inclusive and build on
the relationships that were developed with district decision makers and
technical staff, NGOs, aid agencies and community organisations (“the
partners”) during the previous steps. Those individuals who were
interviewed or otherwise provided information, should also be involved in
Post-RAF Step (b) and provide inputs for the formulation of the action
plan, as its impacts largely depends on multiple stakeholders.
One way to give the implementation plan good visibility is an official
launching event organised by the district authorities, with invitations for
many stakeholders to attend. The message here is that the district is the
owner of the Food and Nutrtion Security Action Plan, and takes
responsibility for its implementation relying on partnerships with multiple
stakeholders.
7.2.3 Instructional Guidance for Trainers
The training should focus on formulating a Food and Nutrition Security
Action Plan, and possibly the formulation of a district Food and Nutrition
Security Strategy. This is a good opportunity for learning-by-doing, i.e. use
the formulation process as a learning opportunity. Start off with providing
a introduction to the action plan, its purpose, how it is to be used, and
how it may be structured. Invite participants to provide feedback, make
suggestions, and then reach a final consensus on what the plan will look
like. Perhaps the above template for Post-RAF Step(b) Food and Nutrition
Security Action Plan of the District can be a starting point for that
discussion. Annex 6 provides an outline of what a Food and Nutrition
Security Strategy document may look like.

98
7.3 Post-RAF Step (c): Integrating Food and Nutrition
Security Actions in Routine District Planning and
Budgeting
7.3.1 Introduction
After the district Food and Nutrition Security Action Plan (and possibly the
district Food and Nutrition Security Strategy) has been formulated, the
work of the DRAPT is not yet over. The DRAPT should facilitate and guide
the introduction of food and nutrition security actions in respective sector
plans. This may also include the re-design of current actions, as well as the
inclusion of remedial actions to improve the implementation
environment. In other words, it is the team that should ensure that “cut-
and-paste” planning does not take place, which is a possibility when the
planning period is short. At all times, members of the assessment and
planning team should act as advocates to promote a widespread
understanding of the food and nutrition security situation in the district as
well as the need to act in a coordinated and collaborative way. Members
of the team should also assume the task of advocating for food and
nutrition security actions during the Musrenbang process at province level
to ensure that these are properly incorporated into plans and budgets.
7.3.2 Instructional Guidance for Trainers
The DRAPT during Post-RAF Step (c) should play an advocacy role to
ensure that appropriate and feasible food and nutrition security actions
become incorporated in the routine district planning, be it the annual or
the 5-year planning process. Thus, some training in advocacy skills may be
useful. To this end, the following exercise can be structured: (i) a brief
introduction to advocacy and the advocacy process (establish advocacy
goals, define realistic ways to achieve those goals; how to reach out to
different stakeholders; formation of alliances to support the incorporation
of food and nutrition security actions) is provided by the trainer; (ii) devise
role-playing sessions in which some participants play the role of advocates
and others represent stakeholder groups with diverse interests; after each

99
session comment on the outcomes and engage the whole group in a
discussion; repeat the session until all participants have had an
opportunity to play an advocate role.
Additional Reading
Integrating Food Security, Nutrition and Good Governance in District
Develoopment Planning Through Advocacy, Social Mobilisation and
Capacity Strengthening. A Methodological Guide and an Instructional
Guide for Trainers - FAO, Rome, April 2010.
Making People’s Voices Matter. An Analytical Study on District Planning
and Budgeting - BAPPENAS and DSF, Jakarta, November 2008.

101
SECTION 8
DESCRIPTION OF ANNEXES

103
SECTION 8: DESCRIPTION OF ANNEXES
This short section gives details of the annexes contained in the
accompanying CD Rom.
Annex 1: Blank templates for problem matrices
Two blank matrices are provided. One for food insecurity, and one for
malnutrition.
Annex 2: 3 day pre-RAF training workshop agenda
This gives a skeleton for a RAF training. The actual traiining materials
would need to be created using this Faciliation guide as the source.
Annex 3: Example workplan
This workplan relates to a condensed RAF and post-RAF process
undertaken in one district in NTT Province.
Annex 4: Example budget
This is a detailed budget for a RAF and post-RAF process in one district in
NTT province.
Annex 5: Non-technical problem tree
A simple example of a problem tree.
Annex 6: District Food and Nutrition Security Strategy outline
This gives a template for the sturucture of the strategy and some
annotated guidance on how to fill in different sections.
Annex 7: Annotated glossary of terms
This gives definitions of key terms such as food security, nutrition, hunger,
and vulnerability.
Annex 8: LEGS Livelihood Objectives and Technical Options
This consists of a table which clearly relates different livelihood objectives
(e.g. “protect the key livelihood assets of crisis-affected communities”) to
different technical response options, noting implications and issues.