Embed Size (px)
Citation preview

(n,m) Abundance Evaluation of Single-Walled CarbonNanotubes by Fluorescence and Absorption Spectroscopy
Zhengtang Luo,† Lisa D. Pfefferle,§ Gary L. Haller,§ andFotios Papadimitrakopoulos*,†
Contribution from the Nanomaterials Optoelectronics Laboratory, Department of Chemistry,Polymer Program, Institute of Materials Science, UniVersity of Connecticut, Storrs, Connecticut
06269, and Department of Chemical Engineering, Yale UniVersity,New HaVen, Connecticut 06520
Received August 7, 2006; E-mail: [email protected]
Abstract: A methodology that takes into account the (n,m) structure of single-walled carbon nanotubes(SWNTs), through an exciton-exciton resonance model and an electron-phonon interaction model, wasemployed in order to evaluate the semiconducting (n,m) abundance of two SWNT samples (i.e., Co-MCM-41 and HiPco). This was based on photoluminescence and near-infrared absorption data obtainedon aqueous suspensions of individually dispersed SWNTs. In the absence of known (n,m) abundanceSWNT samples, we resorted to determining the diameter distribution curves for both samples, which werefound to obey an unsymmetrical log-normal distribution, typical for vapor-phase particle growth. Using thislog-normal function, we reconstructed the near-infrared E S
11 absorption spectrum of the narrow diameterdistribution Co-MCM-41 SWNT sample, which in turn enabled us to assess the predictions of these twotheoretical models. High spectral reconstruction accuracy was obtained from the electron-phonon interactionmodel when considering (11,0) and (10,0) zigzag nanotubes, along with (n,m) line widths inverselyproportional to their extinction coefficients.
Introduction
Single-walled carbon nanotubes (SWNTs), identified by theirchiral indices (n,m) or equivalently their diameter (dt) and chiralangle (θ), are widely recognized as potential building blocksfor future nanoscale electronics.1 At present, the ability tocharacterize (n,m) SWNT abundance in a given sample ishindered due to the unavailability of some of the “basic”properties of these materials, such as extinction coefficients andquantum yields for each (n,m) SWNT. Recent studies indicatethat these parameters are strongly dependent on not onlynanotube diameter and chirality but also modality (i.e., mod-(n-m,3)).2,3 While photoluminescence (PL)4,5 and tunable-laserexcitation resonance Raman spectroscopy (RRS) on debundledand individually isolated SWNTs have enabled the combinedassignment of the majority of (n,m) SWNTs,6-9 precise deter-mination of their relative abundance remains elusive. Such
debundling and individual solubilization of SWNTs was realizedusing a variety of surfactants, such as sodium dodecyl sulfate(SDS),4 sodium dodecylbenzene sulfonate (SDBS),10 and DNA.11
No profound diameter or chiral angle selectivity was reportedfor surfactants SDBS and DNA, while enhanced sample stabilityand higher SWNT concentrations can be obtained with the lattersurfactant.12
Among these two characterization techniques, PL spectros-copy provides a quick and easy identification for the majorityof semiconducting (sem-) (n,m) SWNTs.5,13-15 Correspondingmeasurements on similar samples using the more laborioustunable-laser RRS technique indicated that, along with thedifferent metallic (met-) (n,m) SWNTs, a number of additionalsemiconducting SWNTs were present, mostly low-chiral-anglezigzag (n,0) nanotubes.6,8,16Recent theoretical studies indicate
† University of Connecticut.§ Yale University.
(1) Dresselhaus, M. S., Dresselhaus, G., Avouris, P., Eds.Carbon Nanotubes:Synthesis, Structure, Properties, and Applications; Topics in AppliedPhysics 80; Springer: Berlin, 2001; p 447.
(2) Reich, S.; Thomsen, C.; Robertson, J.Phys. ReV. Lett. 2005, 95, 077402/1-077402/4.
(3) Oyama, Y.; Saito, R.; Sato, K.; Jiang, J.; Samsonidze, G. G.; Grueneis,A.; Miyauchi, Y.; Maruyama, S.; Jorio, A.; Dresselhaus, G.; Dresselhaus,M. S. Carbon2006, 44, 873-879.
(4) O’Connell, M. J.; Bachilo, S. M.; Huffman, C. B.; Moore, V. C.; Strano,M. S.; Haroz, E. H.; Rialon, K. L.; Boul, P. J.; Noon, W. H.; Kittrell, C.;Ma, J.; Hauge, R. H.; Weisman, R. B.; Smalley, R. E.Science2002, 297,593-596.
(5) Bachilo, S. M.; Strano, M. S.; Kittrell, C.; Hauge, R. H.; Smalley, R. E.;Weisman, R. B.Science2002, 298, 2361-2366.
(6) Fantini, C.; Jorio, A.; Souza, M.; Strano, M. S.; Dresselhaus, M. S.; Pimenta,M. A. Phys. ReV. Lett. 2004, 93, 147406/1-147406/4.
(7) O’Connell, M. J.; Sivaram, S.; Doorn, S. K.Phys. ReV. B: Condens. MatterMater. Phys.2004, 69, 235415/1-235415/15.
(8) Telg, H.; Maultzsch, J.; Reich, S.; Hennrich, F.; Thomsen, C.Phys. ReV.Lett. 2004, 93, 177401/1-177401/4.
(9) Luo, Z.; Doorn, S. K.; Papadimitrakopoulos, F.Appl. Phys. Lett.2006, 88,073110.
(10) Moore, V. C.; Strano, M. S.; Haroz, E. H.; Hauge, R. H.; Smalley, R. E.;Schmidt, J.; Talmon, Y.Nano Lett.2003, 3, 1379-1382.
(11) Zheng, M.; Jagota, A.; Semke, E. D.; Diner, B. A.; McLean, R. S.; Lustig,S. R.; Richardson, R. E.; Tassi, N. G.Nat. Mater.2003, 2, 338-342.
(12) Zheng, M.; Jagota, A.; Strano, M. S.; Santos, A. P.; Barone, P.; Chou, S.G.; Diner, B. A.; Dresselhaus, M. S.; McLean, R. S.; Onoa, G. B.;Samsonidze, G. G.; Semke, E. D.; Usrey, M.; Walls, D. J.Science2003,302, 1545-1548.
(13) Lefebvre, J.; Homma, Y.; Finnie, P.Phys. ReV. Lett. 2003, 90, 217401/1-217401/4.
(14) Lebedkin, S.; Hennrich, F.; Skipa, T.; Kappes, M. M.J. Phys. Chem. B2003, 107, 1949-1956.
(15) Miyauchi, Y.; Chiashi, S.; Murakami, Y.; Hayashida, Y.; Maruyama, S.Chem. Phys. Lett.2004, 387, 198.
Published on Web 11/04/2006
10.1021/ja0657096 CCC: $33.50 © 2006 American Chemical Society J. AM. CHEM. SOC. 2006 , 128, 15511-15516 9 15511

that nanotubes with smallerθ possess weaker PL intensitiesthan do nanotubes with higherθ, among other differencesaccording to modality, family (i.e., 2n+m) const), and diameterthat further complicate (n,m) abundance evaluation.2,3 At present,there is a considerable controversy over whether the extremelyweak PL intensities of zigzag nanotubes originate from theirlower quantum yield or low abundance values due to theirunstable cap structures (especially for smalldt nanotubes), bothof which adversely affect their growth.3
Most recently, two theoretical models (based on exciton-exciton resonance model2 and single-particle tight-binding (TB)theory,3 hereafter referred to as the “electron-phonon interactionmodel”) have surfaced that provide analytical predictions aboutthe relative PL quantum efficiency and absorption extinctioncoefficients of various (n,m) SWNTs. Similarly, the electron-phonon interaction model has been utilized to develop acorrelation between resonance Raman radial breathing mode(RBM) cross sections andES
22 PL excitation intensities, towardabundance evaluation for given (n,m) SWNTs.17,18 In addition,transmission electron microscopy (TEM) has been utilized tocorrelate nanotube diameter distribution with PL intensities.19
The lack, however, of well-defined samples containing knownamounts of given (n,m) SWNTs hinders our ability to verifythe validity of these and future models and furthermore utilizethem in evaluating (n,m) abundances of unknown samples.
In this work, we employ PL spectroscopy to investigate twochemical vapor deposition (CVD) samples synthesized usingcarbon monoxide disproportionation. The first sample is thewidely used HiPco nanotubes with broad diameter (dt) distribu-tion that displays 36 differentsem-(n,m) SWNTs in its PLspectra. The second sample was synthesized from cobalt-infiltrated MCM-41 mesoporous catalyst (Co-MCM-41) SWNTand displays a narrow diameter distribution with 13sem-(n,m)SWNTs in its PL spectra. Using the aforementioned twotheoretical models along with the experimentally obtainedrelative PL intensities, an “apparent” (n,m) abundance wasextracted for the two samples that enabled us to determine thattheir diameter distributions obey a log-normal function. Usingsuch a log-normal distribution function, we then reconstructedtheES
11 absorption manifold of the narrowlydt-distributed Co-MCM-41 SWNT sample and compared the predictions of thesetwo models against the highly resolved, experimentally obtainednear-infrared absorption spectrum. This enables us to (1)spectroscopically pinpoint the presence of zigzag nanotubes thatare not observed in PL measurements and (2) develop a rationalmethodology to assist the convergence of both theoreticalmodels and experimental sample preparation toward the accuratedetermination of semiconducting (n,m) SWNT abundance.
Experimental Section
Chemicals. Single-stranded DNA (GT)20, purified by standarddesalting, was purchased from Alpha DNA Inc. Deuterium oxide (D2O,99.9 atom % D) was purchased from Acros Organics. Sodium
dodecylbenzene sulfonate (SDBS, purity>99.0%) was purchased fromAldrich Chemical Co. All chemicals were used as received, unlessotherwise stated.
Preparation of SWNT Samples. Co-MCM-41 SWNTs weresynthesized from cobalt-incorporated MCM-41 catalyst templated withC12 alkyl chains as published elsewhere.20 After their synthesis, theCo-MCM-41 SWNT sample was purified in NaOH, followed by HCl,and then followed by filtration and washing with deionized water. High-pressure monoxide (HiPco) SWNTs were grown and purified using anestablished method.21
Preparation of Aqueous, Individually Isolated SWNT Suspen-sions. Suspensions of individually isolated SWNTs were prepared usingsingle-stranded DNA (GT)20 for Co-MCM-41, while HiPco SWNTswere suspended using SDBS in D2O, according to Zheng et al.12 andO’Connell et al.,4 respectively. The D2O/surfactant/SWNT mixture wasthen sonicated using a cup-horn ultrasonicator (Cole-Palmer) for 10min. After ultrasonication, the suspension was centrifuged for 2-4 hat ca. 80000g to remove the catalyst particles and big bundles.
Characterization Methods. Fluorescence spectroscopy measure-ments were conducted on a Jobin-Yvon Spex Fluorolog 3-211 spec-trofluorometer equipped with a PMT near-infrared (NIR) detector. Theintensities were corrected for instrumental variations in excitationintensity and detection sensitivity. The room-temperature UV-vis-NIR absorption spectra were obtained on a Perkin-Elmer Lambda-900UV-NIR spectrometer.
Result and Disscussion
Figure 1a illustrates a two-dimensional PL excitation mapfor the aqueous dispersion of Co-MCM-41 SWNT/DNA withexcitation scanned from 300 to 930 nm and emission collectedfrom 800 to 1550 nm. The excitation photons create excitonsin the appropriateES
ii (index i refers toith sub-band and “S”denotes semiconducting SWNTs), which then relax to the lowestsub-band (ES
11) to recombine and emit light.5 The resonancebehavior of both excitation and emission events results in thespikes in Figure 1a, which correspond to the transition pair fromindividual (n,m) SWNTs.5 The spectral peak positions fromFigure 1a are plotted in Figure 1b, where the size of dots isproportional to their PL intensities. The unassigned dots abovethose assigned to (7,5) and (6,5) in Figure 1b are the sidebandsof exciton-phonon bound states,22 respectively, which will bestudied in more detail in future publications. The region between1.65 and 2.48 eV (or 750 and 500 nm) excitation energiescorresponds to the pair ofES
22 absorption andES11 emission.
This absorption/emission pair is flanked by two dashed-linerectangles containing, at the top, theES
33/ES11and ES
44/ES11
pairs and, at the bottom, theES11/ES
11 pair.5 The (n,m)assignment of each peak was obtained following the methodol-ogy of Bachilo et al.5 The geometrical patterns for the (2n+m)) constant families of 17, 19, 20, 22, and 23 are clearly shownwith the numbers in squares. These families are clustered intogroups of different modality (i.e., mod(n-m,3) ) 1 for the(2n+m) families of 17, 20, and 23, while the 19 and 22 familiesbelong to mod(n-m,3) ) 2) that are placed to the left and rightof the blue dashed line, respectively. (n,m) SWNTs that havepair transitions to the left of the blue dashed line (mod1) exhibitES
22/ES11 ratios larger than the slope of the line (ca. 1.73), while
those to the right (mod2) have a ratio smaller than 1.73. In the
(16) Doorn, S. K.; Heller, D. A.; Barone, P. W.; Usrey, M. L.; Strano, M. S.Appl. Phys. A: Mater. Sci. Process.2004, A78, 1147-1155.
(17) Jorio, A.; Fantini, C.; Pimenta, M. A.; Heller, D. A.; Strano, M. S.;Dresselhaus, M. S.; Oyama, Y.; Jiang, J.; Saito, R.Appl. Phys. Lett.2006,88, 023109/1-023109/3.
(18) Jorio, A.; Fantini, C.; Pimenta, M. A.; Capaz, R. B.; Samsonidze, G. G.;Dresselhaus, G.; Dresselhaus, M. S.; Jiang, J.; Kobayashi, N.; Gruneis,A.; Saito, R.Phys. ReV. B: Condens. Matter Mater. Phys.2005, 71, 075401/1-075401/11.
(19) Okazaki, T.; Saito, T.; Matsuura, K.; Ohshima, S.; Yumura, M.; Oyama,Y.; Saito, R.; Iijima, S.Chem. Phys. Lett.2006, 420, 286-290.
(20) Chen, Y.; Ciuparu, D.; Lim, S.; Yang, Y.; Haller, G. L.; Pfefferle, L.J.Catal. 2004, 225, 453-465.
(21) Nikolaev, P.; Bronikowski, M. J.; Bradley, R. K.; Rohmund, F.; Colbert,D. T.; Smith, K. A.; Smalley, R. E.Chem. Phys. Lett.1999, 313, 91-97.
(22) Plentz, F.; Ribeiro, H. B.; Jorio, A.; Strano, M. S.; Pimenta, M. A.Phys.ReV. Lett. 2005, 95, 247401/1-247401/4.
A R T I C L E S Luo et al.
15512 J. AM. CHEM. SOC. 9 VOL. 128, NO. 48, 2006

case of the Co-MCM-41 SWNTs of Figure 1, the (7,5) SWNT,which is a mod2 nanotube, shows the highest PL intensity. Forthe HiPco SWNT samples (Table S1, Supporting Information),the dominant PL peaks appear to originate from the (7,5), (7,6),(8,3), (8,4) (8,6), (8,7), and (10,3) SWNTs.
Figure 2 illustrates the chirality map for both SWNT samples,along with their respective diameters (dt ) (a/π)(n2 + m2 +nm)1/2) in nanometers. The Co-MCM-41 sample contains 13different semiconducting (n,m) SWNT species, shown withgreen hexagons. The HiPco sample contains 36 semiconductingSWNTs, enclosed by a solid red line. This map indicates thatthe Co-MCM-41 SWNTs possess a quite sharp (n,m) distribu-tion. This control is attributed to size stabilization of the Cocatalyst within the MCM-41 framework, leading to a narrowdiameter distribution of the resulting SWNTs.20
A tempting assumption would be to linearly correlate theES22
excitation intensity with the concentration of (n,m) SWNTs. Inthe following discussion, correcting the experimentally observedPL intensities will be demonstrated using both the aforemen-tioned exciton-exciton resonance model2 and the electron-phonon interaction model.3 Figure S1 and S2, as well as TableS2, in the Supporting Information present the calculated valuesfor both PL (I cal
PL(n,m)) and absorption (I calabs(n,m)) intensities as
a function of diameter, modality, and (2n+m) family pattern.2,3
While both models predict that the PL intensities (and corre-sponding absorbencies) are strongly dependent on their (2n+m)families and modalities, considerable deviations in the calculatedresults are observed. This signifies the importance of correlatingthe experimentally observed PL intensities (I exp
PL (n,m)) withthose derived theoretically (I cal
PL(n,m)) in order to accuratelydetermine the (n,m) abundance in a given nanotube sample. Withthis in mind, it is imperative to recognize the differences betweenthese two models, which could ultimately enable us to pinpointboth strengths and weaknesses. In particular, significant intensityvariations in these two models are observed with (a) chirality,(b) modality for low-chiral-angle nanotubes, and (c) overallintensity decrease from small to large diameters, as shown inFigure S1 in the Supporting Information.
The abundance,A(n,m), of a particular (n,m) SWNT can thenbe calculated from the following equation,
whereC is a normalization factor andI expPL (n,m) andI cal
PL(n,m)arethe experimentally obtained and calculated PL intensities of thecorresponding (n,m) SWNTs, respectively, when in resonance(i.e., when the energy of the excitation light matches theES
22).Figure 3 illustrates the histograms of diameter distribution
of Co-MCM-41 and HiPco SWNTs that were calculated usingeq 1 andI cal
PL(n,m) data sets from the exciton-exciton reso-nance model2 and the electron-phonon interaction model.3
Interestingly, the diameter distributions of both samples and,in particular, the narrow-distribution samples (i.e., Co-MCM-41 SWNTs), regardless of the PL model employed, show askewed shape with a step rise at smaller sizes of the distributionand a long tail at larger sizes of the distribution. This isconsistent with the distribution obtained by TEM19,21andES
22
RRS RBM analysis,18 which is contrary to the widely assumedsymmetric Gaussian distributions, although small deviations inthe resulting (n,m) abundance might originate from varying CVDgrowth conditions. This line shape closely matches the char-acteristics of single-mode log-normal distribution, which hasthe following form,
whereA(dt) is the abundance at diameterdt, µ is the geometricmean diameter, andσ is the dimensionless geometric standarddeviation, which determines the shape of the distribution. CVD-grown particles are often found to exhibit log-normal sizedistribution.23 The unsymmetrical log-normal characteristic of
(23) Soderlund, J.; Kiss, L. B.; Niklasson, G. A.; Granqvist, C. G.Phys. ReV.Lett. 1998, 80, 2386-2388.
Figure 1. (a) Photoluminescence excitation (PLE) intensity map as afunction of excitation and emission wavelength for DNA-micellarized Co-MCM-41 SWNT sample in D2O. Data are interpolated using MATLAB.(b) (n,m) and (2n+m) family (dashed box) assignment of the PLE spectrashown in panel a. Dot size is proportional to intensity. Dashed-line rectanglesat the top and bottom enclose partial (E33 and E44) and E11 transitions,respectively. The straight dashed blue line (slope) 1.73) indicates the near-armchair direction, with nanotubes above and below corresponding to mod1and mod2 species, respectively.
A(n,m) ) CI exp
PL (n,m)
I calPL(n,m)
(1)
A(dt) ) 1
dtx2π ln σexp[- 1
2(ln σ)2[ln(dt) - ln(µ)]2] (2)
(n,m) Abundance Evaluation of SWNTs A R T I C L E S
J. AM. CHEM. SOC. 9 VOL. 128, NO. 48, 2006 15513

diameter distribution for both nanotube samples, apart from theemployed PL model, indicates that the catalyst nanoparticlesmight obey the log-normal distribution of classically CVD-grown inorganic nanoparticles. However, we must point out thatanother scenario might be at play, where theI cal
PL(n,m) valuesfor small-diameter nanotubes are underestimated in both models,as a result of excitonic enhancement in tighter confinement.17
Significant differences in the abundance profiles as a functionof diameter can be observed from Figure 3, and these differencesare accentuated for the samples with wider diameter distribution.For example, the geometric mean diameters (µ) for HiPcoSWNTs were predicted to be 0.906 and 0.937 nm according tothe exciton-exciton resonance model and the electron-phononinteraction model, respectively, where the latter is closer to thereported 0.93 nm value.5 This discrepancy originates from theaforementioned variation in the overall decrease of the relativePL intensities from small- to large-diameter nanotubes predictedby the two models. For example, the PL intensities for 1.2-1.3 nm dt nanotubes are between 30-10% and 20-10% forthe exciton-exciton resonance model and the electron-phonon
interaction model, respectively, as shown in Figure S1 and TableS2 in the Supporting Information. This undervalues the abun-dance of large-dt nanotubes for the exciton-exciton resonancemodel and places the exciton-exciton resonance model at adisadvantage with respect to the electron-phonon interactionmodel. Moreover, as can be seen in Figure 3c, the nanotubeabundances for (14,3) and (11,9) (marked with asterisks),belonging to (2n+m) ) 31 and mod2 species, are predicted tobe oddly higher under the exciton-exciton resonance model.This provides an additional indication that the exciton-excitonresonance model leads to certain inaccuracies in predicting ofPL intensities for larger diameter nanotubes.
To further investigate the abundance-prediction strengths ofthese two theoretical models, spectral reconstruction of theES
11
NIR absorption spectrum of the narrowlydt-distributed Co-MCM-41 SWNTs was performed to interrogate the strengthsand weaknesses of these two models. These models provide uswith a comprehensive set ofES
22 absorption extinction coef-ficients for all the (n,m) SWNTs, including the zigzag (n,0)nanotubes, which are not observed in PL. UnlikeES
22, however,the reconstruction of theES
11 spectrum manifold is significantlymore straightforward, as the various (n,m) transitions are spreadout over a wider range, and additionally as theES
11 absorptionsare situated at the end of the plasmonic and scattering tail,thereby making background subtraction easier. For this, weassumed that theES
11 absorption extinction coefficients areproportional to theES
22 values provided by the two theoreticalmodels, based on the results calculated by Popov et al., whoobserved similar absorption matrix element patterns for theES
11
andES22 transitions.24 Mie theory suggests that the scattering
and absorption cross section of particles is a power series ofthe size parameterâ, related to absorption wavelength (λ) andparticle dimension (Rs) (â ) 2πRs/λ).25 In the wavelength regionfar from the plasmonic resonance maximum (ca. 270 nm), thescattering efficiency depends more onâ than onRs.25 For thiswe can simply scale the plasmonic tail in the NIR absorption
(24) Popov, V. N.; Henrard, L.; Lambin, P.Phys. ReV. B 2005, 72, 035436.(25) Hiemenz, P. C.; Rajagopalan, R.Principles of Colloid and Surface
Chemistry, 3rd ed.; Marcel Dekker: New York, 1997; pp 232-235.
Figure 2. Chirality maps of aqueous suspensions of Co-MCM-41 (green hexagons) and HiPco SWNTs (enclosed by solid red line).
Figure 3. Calculated diameter distribution histograms (bars) and their log-normal fits arranged horizontally for two samples and vertically for thetwo models of calculated PL intensity values. Asterisks indicate aninaccuracy of the exciton-exciton resonance model to correctly predict theabundance for large-diameter SWNTs. These nanotubes were not includedin the curve fitting. Dashed lines in panel a indicate the positions of the(10,0) and (11,0) zigzag SWNTs.
A R T I C L E S Luo et al.
15514 J. AM. CHEM. SOC. 9 VOL. 128, NO. 48, 2006
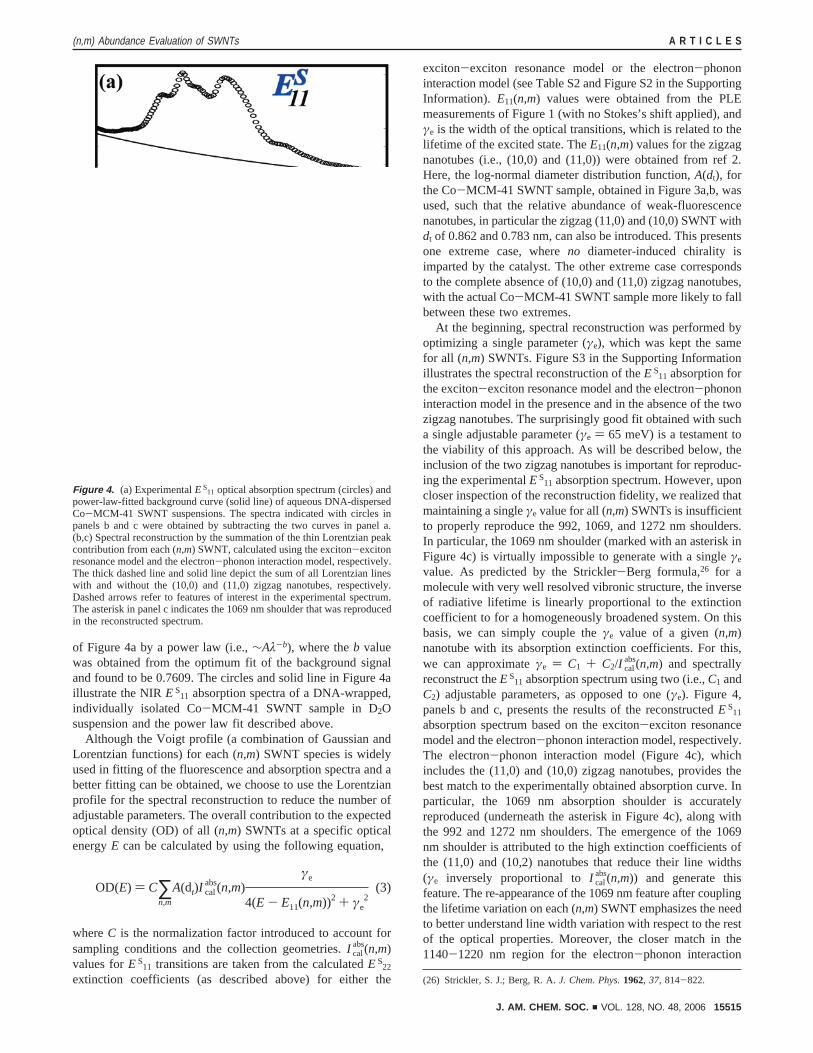
of Figure 4a by a power law (i.e.,∼Aλ-b), where theb valuewas obtained from the optimum fit of the background signaland found to be 0.7609. The circles and solid line in Figure 4aillustrate the NIRES
11 absorption spectra of a DNA-wrapped,individually isolated Co-MCM-41 SWNT sample in D2Osuspension and the power law fit described above.
Although the Voigt profile (a combination of Gaussian andLorentzian functions) for each (n,m) SWNT species is widelyused in fitting of the fluorescence and absorption spectra and abetter fitting can be obtained, we choose to use the Lorentzianprofile for the spectral reconstruction to reduce the number ofadjustable parameters. The overall contribution to the expectedoptical density (OD) of all (n,m) SWNTs at a specific opticalenergyE can be calculated by using the following equation,
whereC is the normalization factor introduced to account forsampling conditions and the collection geometries.I cal
abs(n,m)values forES
11 transitions are taken from the calculatedES22
extinction coefficients (as described above) for either the
exciton-exciton resonance model or the electron-phononinteraction model (see Table S2 and Figure S2 in the SupportingInformation). E11(n,m) values were obtained from the PLEmeasurements of Figure 1 (with no Stokes’s shift applied), andγe is the width of the optical transitions, which is related to thelifetime of the excited state. TheE11(n,m) values for the zigzagnanotubes (i.e., (10,0) and (11,0)) were obtained from ref 2.Here, the log-normal diameter distribution function,A(dt), forthe Co-MCM-41 SWNT sample, obtained in Figure 3a,b, wasused, such that the relative abundance of weak-fluorescencenanotubes, in particular the zigzag (11,0) and (10,0) SWNT withdt of 0.862 and 0.783 nm, can also be introduced. This presentsone extreme case, whereno diameter-induced chirality isimparted by the catalyst. The other extreme case correspondsto the complete absence of (10,0) and (11,0) zigzag nanotubes,with the actual Co-MCM-41 SWNT sample more likely to fallbetween these two extremes.
At the beginning, spectral reconstruction was performed byoptimizing a single parameter (γe), which was kept the samefor all (n,m) SWNTs. Figure S3 in the Supporting Informationillustrates the spectral reconstruction of theES
11 absorption forthe exciton-exciton resonance model and the electron-phononinteraction model in the presence and in the absence of the twozigzag nanotubes. The surprisingly good fit obtained with sucha single adjustable parameter (γe ) 65 meV) is a testament tothe viability of this approach. As will be described below, theinclusion of the two zigzag nanotubes is important for reproduc-ing the experimentalES
11 absorption spectrum. However, uponcloser inspection of the reconstruction fidelity, we realized thatmaintaining a singleγe value for all (n,m) SWNTs is insufficientto properly reproduce the 992, 1069, and 1272 nm shoulders.In particular, the 1069 nm shoulder (marked with an asterisk inFigure 4c) is virtually impossible to generate with a singleγe
value. As predicted by the Strickler-Berg formula,26 for amolecule with very well resolved vibronic structure, the inverseof radiative lifetime is linearly proportional to the extinctioncoefficient to for a homogeneously broadened system. On thisbasis, we can simply couple theγe value of a given (n,m)nanotube with its absorption extinction coefficients. For this,we can approximateγe ) C1 + C2/I cal
abs(n,m) and spectrallyreconstruct theES
11 absorption spectrum using two (i.e.,C1 andC2) adjustable parameters, as opposed to one (γe). Figure 4,panels b and c, presents the results of the reconstructedES
11
absorption spectrum based on the exciton-exciton resonancemodel and the electron-phonon interaction model, respectively.The electron-phonon interaction model (Figure 4c), whichincludes the (11,0) and (10,0) zigzag nanotubes, provides thebest match to the experimentally obtained absorption curve. Inparticular, the 1069 nm absorption shoulder is accuratelyreproduced (underneath the asterisk in Figure 4c), along withthe 992 and 1272 nm shoulders. The emergence of the 1069nm shoulder is attributed to the high extinction coefficients ofthe (11,0) and (10,2) nanotubes that reduce their line widths(γe inversely proportional toI cal
abs(n,m)) and generate thisfeature. The re-appearance of the 1069 nm feature after couplingthe lifetime variation on each (n,m) SWNT emphasizes the needto better understand line width variation with respect to the restof the optical properties. Moreover, the closer match in the1140-1220 nm region for the electron-phonon interaction
(26) Strickler, S. J.; Berg, R. A.J. Chem. Phys.1962, 37, 814-822.
Figure 4. (a) ExperimentalES11 optical absorption spectrum (circles) and
power-law-fitted background curve (solid line) of aqueous DNA-dispersedCo-MCM-41 SWNT suspensions. The spectra indicated with circles inpanels b and c were obtained by subtracting the two curves in panel a.(b,c) Spectral reconstruction by the summation of the thin Lorentzian peakcontribution from each (n,m) SWNT, calculated using the exciton-excitonresonance model and the electron-phonon interaction model, respectively.The thick dashed line and solid line depict the sum of all Lorentzian lineswith and without the (10,0) and (11,0) zigzag nanotubes, respectively.Dashed arrows refer to features of interest in the experimental spectrum.The asterisk in panel c indicates the 1069 nm shoulder that was reproducedin the reconstructed spectrum.
OD(E) ) C∑n,m
A(dt)I calabs(n,m)
γe
4(E - E11(n,m))2 + γe2
(3)
(n,m) Abundance Evaluation of SWNTs A R T I C L E S
J. AM. CHEM. SOC. 9 VOL. 128, NO. 48, 2006 15515

model, as opposed to the exciton-exciton resonance model,implies that the former theory better describes the overallabsorption behavior with respect to diameter and chirality (seeFigure S2 in the Supporting Information). The resultingγe valuesrange from 58 to 96 meV for the exciton-exciton resonancemodel, versus 45-73 meV for the electron-phonon interactionmodel. These are in good agreement with the ca. 60 meV valueobtained from resonance Raman experiments6,9,27 and onlyslightly higher than the∼30 meV value reported by Jones etal.28 and O’Connel et al. for SDS-encapsulated SWNTs solu-tion.4 This discrepancy might originate from environmentaleffects related to inhomogeneous DNA coverage (estimatedγe
values∼40 meV for DNA-dispersed SWNTs11), since the linewidths for surfactant-free (air-suspended) nanotubes are on theorder of 10-15 meV.13
The inclusion of the (11,0) and (10,0) zigzag nanotubes (i.e.,one extreme) is particularly important to obtain an optimumreconstruction. If they are removed (the other extreme), themaximum 1037 nm absorbance shifts to the 1069 nm shoulder,which results in a poorer spectral match. Based on intensityvariations between the experimental and reconstructed spectrain Figures 4 and S3, the actual sample appears to lie somewherebetween these two extremes and, according to the currentspectral reconstruction, closer to the first case. This might bedue to the large population of (11,0) SWNTs (dt ) 0.862 nm),which together with the (10,0) SWNTs (dt ) 0.783 nm) areclose to the geometric mean diameter of this sample (µ ) 0.83nm) (see Figure 3a). This is further amplified by the smalldt
distribution of the Co-MCM-41 SWNT sample and the factthat these two zigzag nanotubes carry considerable weight fortheir absorption footprint to go unnoticed. This is in agreementwith the resonance Raman spectroscopy studies reported byFantini et al.6 (where (10,0) SWNTs were observed) and Telget al.8 (where strong signals from (11,0), (13,0), and (15,0) wereobserved in HiPco SWNT samples). The apparent largeconcentration of (10,0) and (11,0) SWNTs might also beinfluenced by the initial growth of the cap within the Co-MCM-41 mesoporous catalyst as opposed to HiPco SWNT synthesis.More detailed work is currently underway to clarify this, aswell as to reconstruct the NIR absorption spectrum of the HiPcoSWNT sample, which involves a significantly larger set of (n,m)species.
The apparent success of such a spectral reconstructiontechnique is believed to originate from (i) the narrow diameterdistribution of the Co-MCM-41 SWNT sample, (ii) the use ofthe theoretically derivedI cal
abs(n,m) values (which reflect thechirality and diameter contributions to the absorbance), (iii) theincorporation of the log-normal diameter distribution, and (iv)the extinction-coefficient-dependentγe values. As shown inFigure 4b,c, both reconstructed spectra shown a small Stokes’sshift (<8 meV), in agreement with previous reports,28 which isdue to the rigidity of the SWNTs. To the best of our knowledge,this is the first time that such a spectral reconstructionmethodology has been employed, and based on our results, itshows a strong promise for quantitative nanotube abundancecharacterization. Obtaining a better handle on theγe variation
for different (n,m) nanotubes7 would ultimately permit a closermatch to the experimental absorption spectrum. Unfortunately,the large number (36) of differentsem-SWNTs, along with morethan four zigzagsem-SWNTs of unknown abundance andvarious errors associated with background subtraction, makessuch reconstruction challenging and will be studied in subse-quent publications.
Conclusion
Utilizing photoluminescence and near-infrared absorptionresults, a quantitative methodology was developed to provideabundance profiles for all semiconducting (n,m) SWNTs withina given sample. This was based on predictions of the exciton-exciton resonance model and the electron-phonon interactionmodel as applied to broad (HiPco) and narrowly (Co-MCM-41) distributed SWNT samples, respectively. Our results indicatethat the diameter distributions of both of these CVD-grownnanotube samples obey a log-normal distribution that is typicalfor a vapor-phase particle growth process. Using such a log-normal distribution function, the NIRES
11 absorption spectrumwas accurately reconstructed with two adjustable parametersin conjunction with the theoretically derived (n,m)-dependentextinction coefficients. These two adjustable parameters werenecessary in order to account for the lifetime variation in ahomogeneously broadened system, which is inversely propor-tional to the extinction coefficient of each (n,m) SWNT. Usingthis methodology on the narrowly distributed Co-MCM-41SWNT sample, our current analysis indicates that the single-particle electron-phonon interaction model provides a betteroverall description of nanotube optical properties according todiameter, chirality, modality, and family patterns, as opposedto the exciton-exciton resonance model. Moreover, strongevidence is presented for the existence of zigzag nanotubes inthe Co-MCM-41 SWNT sample, which are not seen in thephotoluminescence measurements. This provides a rationalmethodology toward assessing semiconducting (n,m) SWNTabundance with high accuracy, while at the same time verifyingthe validity and confidence level of various theoretical models.
Acknowledgment. The authors acknowledge helpful discus-sions with Profs. R. Bruce Weisman, Daniel Resasco, and LewisRothberg. Data in Table S1 were kindly provided by Mr. John-David Rocha and Prof. R. Bruce Weisman. We also acknowl-edge financial support from AFOSR FA9550-06-1-0030 andARO-DAAD-19-02-1-10381 for Z.L. and F.P., as well as DOE-BES grant DE-FG02-05ER15732 and DARPA Contract HR0011-06-C-0011 for L.D.P. and G.L.H.
Supporting Information Available: Tabulated values of therelative photoluminescence intensities for a sample of HiPcoSWNT in aqueous SDBS suspension; calculated absorption andPL intensities from the exciton-exciton resonance model andthe electron-phonon interaction model, as well as their tabulatedvalues; and comparative experimental and reconstructed UV-vis-NIR spectra using the same value ofγe for all (n,m)nanotube species. This material is available free of charge viathe Internet at http://pubs.acs.org.
JA0657096
(27) Luo, Z.; Li, R.; Kim, S. N.; Papadimitrakopoulos, F.Phys. ReV. B: Condens.Matter Mater. Phys.2004, 70, 245429/1-245429/8.
(28) Jones, M.; Engtrakul, C.; Metzger, W. K.; Ellingson, R. J.; Nozik, A. J.;Heben, M. J.; Rumbles, G.Phys. ReV. B: Condens. Matter Mater. Phys.2005, 71, 115426/1-115426/9.
A R T I C L E S Luo et al.
15516 J. AM. CHEM. SOC. 9 VOL. 128, NO. 48, 2006