Embed Size (px)
Citation preview

Efficient dehydration of the organic solvents through graphene oxide (GO) / ceramic
composite membranes
Guihua Lia, b, Lei Shic, Gaofeng Zenga, *, Yanfeng Zhanga, * and Yuhan Suna, CAS Key Laboratory of Low-carbon Conversion Science and Engineering, Shanghai Advanced Research Institute, Chinese Academy of Sciences, Shanghai 201210, Chinab, College of Sciences, Shanghai University, Shanghai 200444, Chinac, State Key Laboratory of Functional Materials for Informatics, Shanghai Institute of Microsystem and Information Technology, Chinese Academy of Sciences, Shanghai 200050, China
Experimental details
1. Graphene oxide synthesis
Graphite powders of 8000 mesh were purchased from Aladdin Chemistry Co. Ltd (Shanghai,
China). GO was prepared by the Hummers’ method with further post treatments of ultrasonic
processing and centrifugation1. Typically, graphite powder (8000 mesh, 5g) and NaNO3 (2.5g)
were mixed with sulfuric acid (115mL, 98wt %) under magnetic stirring for 0.5h. Then the
mixture was put into an ice bath before KMnSO4 (15g) was slowly added, and make sure the
temperature remains below 20 °C. Subsequently, the reaction system was transferred to a water
bath of 35 °C and maintained for 0.5 h. After that, 230 mL of water was slowly added into the
system. The diluted suspension was then stirred at 98 °C for 15 min, followed by another 700 mL
of water added. And the reaction was terminated by the addition of H2O2 (50 mL, 30wt %). The
mixture was filtered and washed with HCl (1 L, 1 mol/L) and a large amount of distilled water in
sequence. The resulting solid was dried and dissolved. The dispersion of graphite oxide was
ultrasonicated under 40 kHz for 30 min and centrifugated at 3000 rpm for 30 min, obtaining stable
GO colloid of specific concentration.
GO aqueous with narrow dispersed size were obtained by centrifugation at different speed and
sonication treatments. In detail, as prepared GO aqueous was centrifugated at 2,000 rpm for 100
min. The sediment was discarded and the supernatant was collected for another 100 min
centrifugation at 10000 rpm. The supernatant was collected as the minimum size GO (marked as
GO-S, ca. 0.2 mg GO/ml) and the sediment was resolved in de-ioned water followed by 30 min
sonication and 100 min centrifugation at 6000 rpm. Then the sediment was dissolved in DI water
followed by 30 min sonication and 100 min centrifugation at 3000 rpm. The largest GO dispersion
Electronic Supplementary Material (ESI) for RSC Advances.This journal is © The Royal Society of Chemistry 2014
was obtained by dissolving the sediment in water (labelled as GO-L, ca. 0.4 mg GO/ml). The size
of GO-S and GO-L were measured by atomic force microscopy (AFM) and particle size analyzer,
which were showed in Fig. S1 and S2.
Fig. S1 AFM measurement of GO suspension with different size: supernatant of high speed
(10000 rpm) centrifugation (left); sediment of low speed (3000 rpm) centrifugation (right).
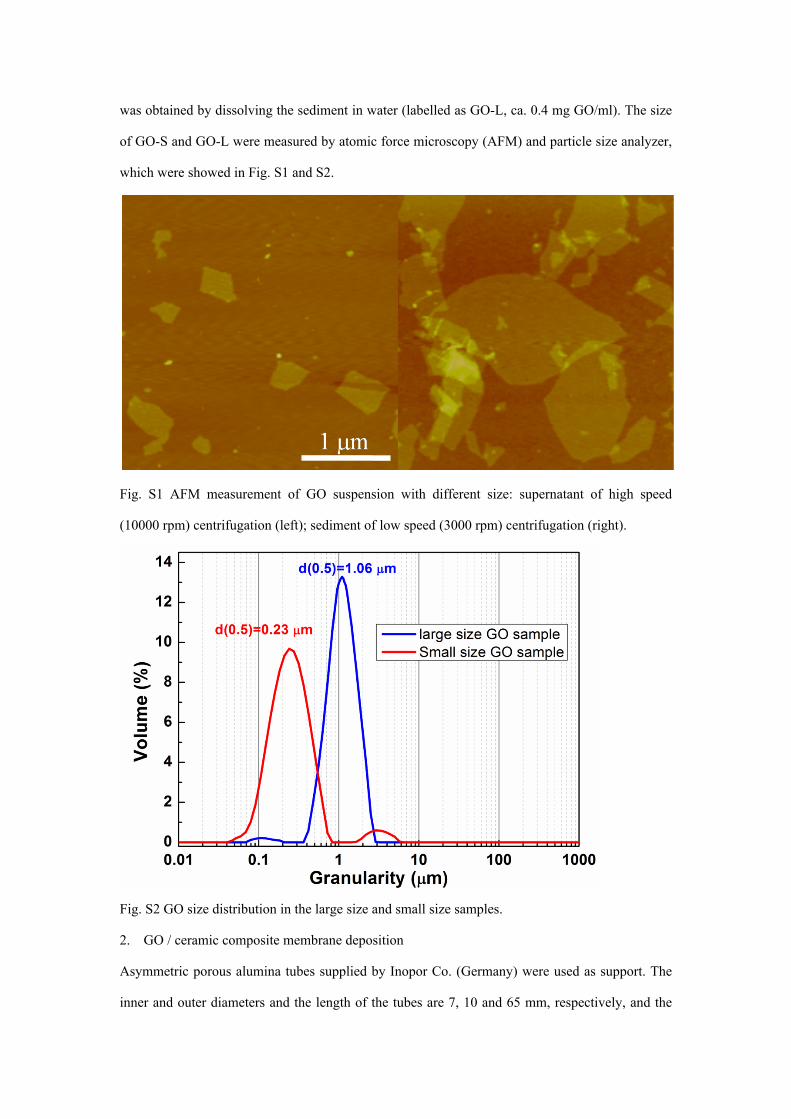
Fig. S2 GO size distribution in the large size and small size samples.
2. GO / ceramic composite membrane deposition
Asymmetric porous alumina tubes supplied by Inopor Co. (Germany) were used as support. The
inner and outer diameters and the length of the tubes are 7, 10 and 65 mm, respectively, and the

nominal pore size of the inner surface layer is ~100 nm. Both ends of support were glazed at 900
oC (Duncan, Fresno, CA) but left with a ~3.0 cm middle section corresponding to 6.5 cm2 surface
area for membrane deposition. The supports were cleaned sequentially by ethanol, 4% aqueous
KOH solution and deionized water before membrane synthesis.
Ceramic support was mounted into the tube housing and sealed with two O-rings on the both ends
of support. The upper end of tube housing was closed by stop-valve and the bottom end was
connected to the GO solution container. The GO diluted solution was drove to the lumen side of
tube through the bottom end by pressurized nitrogen. Liquid was collected and measured from the
permeation side of ceramic tube. In a typical synthesis, 0.5 mL GO-L and 1 mL GO-S solution
were diluted to 200 mL by DI water, respectively. In addition, 5 mg 1-[3- (Dimethylamino) propyl]
-3- ethylcarbodiimide (DEC) methiodide and 0.5 mL ethanediamine were added into the diluted
GO-L solution. Both solutions were sonicated 30 min at room temperature for homogenous
mixing as well as degassing. Then the diluted GO solutions were separately transferred to the
synthesis container. For the GO-L diluted solution, 2-4 bar N2 was introduced. The inner pressure
of GO-L diluted solution was kept at 2-4 bar until 195 ml liquid was collected from the
permeation side. Then the diluted GO-S solution was introduced to the container and drove by an
increasing N2 pressure from 8-15 bar. The pressure associated deposition was considered as
reaching the end when the flow rate of permeation side was lower than 1 mL/h. The GO/ceramic
membrane was taken out after slowly release the inner pressure. The as-prepared composite
membrane was vertically dried overnight at 45 oC in vacuum. TG-MS, XPS and FT-IR
characterization results of charge modification GO were showed in Fig. S3, Fig. S4 and Fig. S5,
respectively. The stress-strain measurement was showed in Fig. S6. The membranes fabricated for
this work were listed in Table S1 and showed in Fig. S7.

Fig. S3 TG-MS results of GO layer from 30-700 oC in Ar. (a) TG, DSC and DTG; (b) TG and MS information.

Fig. S4 XPS results of GO membrane: a) treated with amidation (red) and without treatment (black); b) Simulation of C1s of GO without treatment; c) Simulation of C1s of GO treated by EDA.

Fig. S5 FT-IR results of GO treated with amidation (blue) and without treatment (black)
Fig. S6 Stress-Strain result of GO layer. The breaking strength and the elongation at break of GO
layer were 15.9 MPa and 0.81%, respectively

Table S1 The key parameters of GO /composite membranes employed in this work
MembrThickness
(nm)Mixture
(10wt%H2O)
PV temperature
(oC)
Flux (kg/m2/h)
Separation factor
70 1.30 25060 0.95 23050 0.70 32040 0.43 335
M1 250 H2O-EtOH
28 0.30 41070 1.70 129060 1.30 124050 0.91 167040 0.61 1730
M2 220 H2O-NPA
30 0.43 174070 2.10 294060 1.50 302050 1.10 283040 0.75 4340
M3 190 H2O-IPA
30 0.51 402070 2.39 360060 1.66 333050 1.31 395040 0.83 3650
M4 190 H2O-EA-EtOH
30 0.63 5030H2O-SBA 70 1.82 6910H2O-TBA 70 1.63 5120M5 175H2O-IBA 70 1.68 6110
70 5.88 -60 4.44 -50 3.44 -40 2.48 -
M6 190 H2O
30 1.64 -

Fig. S7 SEM cross-section views of M1-M6 prepared for the pervaporation test in this work.
3. Pervaporation of H2O-organic azeotropes
The separation performance of GO / ceramic composite membrane for water contained azeotropes
were carried out with the pervaporation (PV) method in the temperature range from 30-70 oC (Fig.
S8). The GO composite membrane was fixed with O-rings in the separator, which has the same
configuration as the tube housing for membrane deposition. Then the separator was vertically
fixed in an oven. Alcohols and ethyl acetate were purchased from Aladdin Chemistry Co. Ltd
(Shanghai, China). The water-organic mixture (4 L each) was fed into the lumen side of
membrane with a flow rate of 2 mL/ min by a constant flow pump. Liquid of lumen side was
returned back to the feedstock. The retentate side of separator was connected in sequence with
sample collector, which is immersed in liquid nitrogen cold trap, and vacuum pump, by which the
pressure of retentate side was kept around 100 Pa. Permeation liquid was begun to collect after 60
min running of PV system under the certain pressure and temperature. The weight of permeated
liquid was calculated from the weight different of sample collector. The collection interval, which

depends on the permeability of membrane, is in the range of 1 to 2 h. The composition of
permeation liquid as well as feedstock was analysed by a GC with TCD detector (Shimadzu GC-
2014C, HP Plot/U 0.2 m*30 m). Based on the result of GC analysis, the concentration of H2O-
organic mixture feedstock was corrected everyday by adding water in the long term test.
Fig. S8 Schematic of pervaporation system
4. Characterizations
The size of GO single layer were analyzed in tapping mode using atomic force microscopy (AFM,
NanoScope IIIa). The size distribution of GO was also measured by particle size analyzer
(Mastersizer 2000, Malvern Instruments). The concentration of the resulting GO dispersion was
measured by UV-vis (UV2700, SHIMADZU) absorption at 600 nm wavelength2. Membrane
fragments were characterized by scanning electron microscopy (SEM, S 4800 Hitachi) at an
accelerating voltage of 5 kV. The structure of GO layers were determined by X-ray diffraction
(XRD, Rigaku Ultima IV) using Cu K radiation ( = 0.15406 nm, 40 kV, 40 mA). The near-
surface compositions of membrane fragments were analyzed by X-ray photoelectron spectroscopy
(XPS, K-Alpha, Al K radiation, 1486.6 eV, 12 kV, 3 mA). XPS peak positions were calibrated
with the help of the C 1s peak at 285.0 eV. The surface chemistry of GO films was analyzed by
Fourier Transform Infrared Spectroscopy (FTIR, Nicolet 6700, Thermo Fisher). The thermal
properties of GO membranes were analyzed by Thermal Gravimetry - Quadrupole Mass
Spectrometer (TG-MS, STA 449F3/ QMS 403, NETZSCH) in the temperature scale of 40-700 oC
with a 2 oC/min heating rate. Mechanical property measurements of GO layer were performed on
a tensile tester (XQ-1C, Shanghai New Fiber Instrument Co., Ltd.).

References
(1) Hummers, W. S.; Offeman, R. E. Journal of the American Chemical Society 1958, 80, 1339.
(2) Li, H.; Song, Z.; Zhang, X.; Huang, Y.; Li, S.; Mao, Y.; Ploehn, H. J.; Bao, Y.; Yu, M. Science 2013, 342, 95.