Embed Size (px)
Citation preview

NASA/TM—2005–213902
Method for Determination of <5 ppm Oxygen in Sodium SamplesR.S. Reid and J.J. MartinMarshall Space Flight Center, Marshall Space Flight Center, Alabama
G.L. SchmidtNew Mexico Institute of Mining and Technology, Albuquerque, New Mexico
July 2005
https://ntrs.nasa.gov/search.jsp?R=20050245191 2020-03-09T15:16:52+00:00Z

The NASA STI Program Office…in Profile
Since its founding, NASA has been dedicated tothe advancement of aeronautics and spacescience. The NASA Scientific and Technical Information (STI) Program Office plays a keypart in helping NASA maintain this importantrole.
The NASA STI Program Office is operated by Langley Research Center, the lead center for NASA’s scientific and technical information. The NASA STI Program Office provides access to the NASA STI Database, the largest collection of aeronautical and space science STI in the world. The Program Office is also NASA’s institutional mechanism for disseminating the results of its research and development activities. These results are published by NASA in the NASA STI Report Series, which includes the following report types:
• TECHNICAL PUBLICATION. Reports of completed research or a major significant phase of research that present the results of NASA programs and include extensive data or theoretical analysis. Includes compilations of significant scientific and technical data and information deemed to be of continuing reference value. NASA’s counterpart of peer-reviewed formal professional papers but has less stringent limitations on manuscript length and extent of graphic presentations.
• TECHNICAL MEMORANDUM. Scientific and technical findings that are preliminary or of specialized interest, e.g., quick release reports, working papers, and bibliographies that contain minimal annotation. Does not contain extensive analysis.
• CONTRACTOR REPORT. Scientific and technical findings by NASA-sponsored contractors and grantees.
• CONFERENCE PUBLICATION. Collected papers from scientific and technical conferences, symposia, seminars, or other meetings sponsored or cosponsored by NASA.
• SPECIAL PUBLICATION. Scientific, technical, or historical information from NASA programs, projects, and mission, often concerned with subjects having substantial public interest.
• TECHNICAL TRANSLATION. English-language translations of foreign
scientific and technical material pertinent to NASA’s mission.
Specialized services that complement the STI Program Office’s diverse offerings include creating custom thesauri, building customized databases, organizing and publishing research results…even providing videos.
For more information about the NASA STI Program Office, see the following:
• Access the NASA STI Program Home Page at http://www.sti.nasa.gov
• E-mail your question via the Internet to [email protected]
• Fax your question to the NASA Access Help Desk at 301–621–0134
• Telephone the NASA Access Help Desk at 301–621–0390
• Write to: NASA Access Help Desk NASA Center for AeroSpace Information 7121 Standard Drive Hanover, MD 21076–1320 301–621–0390

i
R.S. Reid and J.J. MartinMarshall Space Flight Center, Marshall Space Flight Center, Alabama
G.L. SchmidtNew Mexico Institute of Mining and Technology, Albuquerque, New Mexico
NASA/TM—2005–213902
Method for Determination of <5 ppm Oxygenin Sodium Samples
July 2005
National Aeronautics andSpace Administration
Marshall Space Flight Center • MSFC, Alabama 35812

ii
Available from:
NASA Center for AeroSpace Information National Technical Information Service7121 Standard Drive 5285 Port Royal RoadHanover, MD 21076–1320 Springfield, VA 22161301–621–0390 703–487–4650
TRADEMARKS
Trade names and trademarks are used in this report for identification only. This usage does not constitute an official endorsement, either expressed or implied, by the National Aeronautics and Space Administration.

iii
EXECUTIVE SUMMARY
Alkali metals used in pumped loops or heat pipes must be sufficiently free of nonmetallic impurities to ensure long heat rejection system life. Life issues are well established for alkali metal systems. Impurities can form ternary compounds between the container and working fluid, leading to corrosion. This Technical Memorandum discusses the consequences of impurities and candidate measurement techniques to determine whether impurities have been reduced to sufficiently low levels within a single-phase liquid metal loop or a closed two-phase heat transfer system, such as a heat pipe. These techniques include the vanadium wire equilibration, neutron activation analysis, plug traps, distillation, and chemical analysis.

iv

v
TABLE OF CONTENTS
1. INTRODUCTION ......................................................................................................................... 1
2. IMPORTANCE OF ALKALI METAL PURITY—FLOW LOOPS ............................................. 2
2.1 Oxygen .................................................................................................................................... 3 2.2 Carbon .................................................................................................................................... 3 2.3 Nitrogen .................................................................................................................................. 4 2.4 Hydrogen ................................................................................................................................ 4
3. CONSEQUENCES OF ALKALI METAL SYSTEM IMPURITY ............................................... 6
3.1 Nonwetting ............................................................................................................................. 6 3.2 Corrosion ................................................................................................................................ 7 3.3 Niobium 1% Zirconium/Sodium System ............................................................................... 8 3.4 Low Carbon Arc Cast Molybdenum/Sodium System ............................................................ 11 3.5 Niobium 1% Zirconium/Potassium System .......................................................................... 12 3.6 Refractory Metal Lithium System .......................................................................................... 14
4. METHODS TO PROMOTE LONG LIFE .................................................................................... 17
4.1 Start With Proper Material Selection ...................................................................................... 18 4.2 Deplete Impurities From Structure ......................................................................................... 18 4.3 Minimize Mobile Nonmetallic Impurities in Working Fluid ................................................. 19
5. METHODS TO MEASURE SODIUM-IMPURITY CONCENTRATION .................................. 23
5.1 Plug Meter and Cold Trap Temperatures ................................................................................ 23 5.2 Electrochemical Meter ............................................................................................................ 24 5.3 Vanadium Wire Technique ...................................................................................................... 25 5.4 Distillation .............................................................................................................................. 28 5.5 Neutron Activation Analysis ................................................................................................... 29 5.6 Mercury Amalgamation .......................................................................................................... 29 5.7 Incorporate Getters as Part of the Material System ................................................................ 30
6. QUALITY CONTROL PRACTICES ........................................................................................... 31
7. SUMMARY AND RECOMMENDATIONS ................................................................................ 33
8. CONCLUSIONS ........................................................................................................................... 35

vi
TABLE OF CONTENTS (Continued)
APPENDIX A—SYSTEM FOR NUCLEAR AUXILIARY POWER 10A REACTOR SYSTEM PROGRAM—A RELEVANT FLIGHT SYSTEM DEVELOPMENT EXPERIENCE ......................................................................... 37
APPENDIX B—STANDARD TECHNIQUE FOR ANALYSIS OF NUCLEAR-GRADE SODIUM HEAT PIPES BY THE EQUILIBRATION METHOD
USING VANADIUM WIRES ................................................................................ 41
B.1 Scope .................................................................................................................................. 41 B.2 Summary of Method ........................................................................................................... 41 B.3 Interferences ....................................................................................................................... 41 B.4 Apparatus ............................................................................................................................ 41 B.5 Reagents and Materials ...................................................................................................... 43 B.6 Precautions ......................................................................................................................... 44 B.7 Calibration of Vacuum-Fusion Analyzer ............................................................................ 44 B.8 Procedure ............................................................................................................................ 44 B.9 Calculation ......................................................................................................................... 47 B.10 Precision and Accuracy ...................................................................................................... 50
APPENDIX C—DESCRIPTION OF ALKALI METAL HANDLING MACHINE AND PROPOSED PURIFICATION SYSTEM ..................................................... 51
C.1 Alkali Metal Handling Glove Box/Fill Machine .................................................................. 51 C.2 Liquid Metal Purification Loop ............................................................................................ 52
APPENDIX D—SAMPLE CYLINDERS AND TUBE FURNACE FOR VANADIUM WIRE EQUILIBRATION ANALYSIS ............................................................................. 54
D.1 Basic Sample Cylinder Design ............................................................................................ 54 D.2 Small Tube Furnace Design ................................................................................................. 55
APPENDIX E—SAMPLE HEAT PIPE CONFIGURATION FOR VANADIUM WIRE EQUILIBRATION ANALYSIS .............................................................................. 58
E.1 Basic Sample Heat Pipe and Sample Cylinder Evaluation Design ...................................... 58
APPENDIX F—BASIC MATERIAL CLEANING PROCEDURE FOR SAMPLING COMPONENTS ..................................................................................................... 60
F.1 Stainless Steel Cleaning Procedure ....................................................................................... 60 F.2 Niobium 1% Zirconium Cleaning Procedure ........................................................................ 60
REFERENCES .................................................................................................................................. 62

vii
LIST OF FIGURES
1. Partial molar free energies of Nb/Na/O compounds .......................................................... 9
2. Depth and type of corrosion of Nb-1%Zr containing various amounts of initial O (ppm) tested in refluxing Na at 1,095 °C for 500 hr. The Na initially contained <10 ppm O .......................................................................................................................... 10 3. Partial molar free energies of Mo/Na/O compounds .......................................................... 12
4. Example of contact point between Nb-1%Zr/K life test heat pipe and quartz enclosure ........................................................................................................... 13
5. Partial molar free energies of Nb/K/O compounds ............................................................ 14
6. Partial molar free energies of Mo/Nb/Li/O compounds ..................................................... 15
7. Partial molar free energies of Mo/Nb/Li/N compounds ..................................................... 15
8. Na2O2 dissociation and Na saturation pressures versus temperature ................................. 21
9. Solubility of O in Na versus temperature ........................................................................... 24
10. Method to measure working fluid O concentration in Na-filled heat pipes ........................ 25
11. Estimated time required for equilibrium O concentrations in static Na-immersed V wires ................................................................................................................................ 26
12. Corresponding equilibrium O concentrations, V versus Na at 750 °C ............................... 28
13. SNAP 10A FS–4 at the Acceptance Test facility ................................................................ 37
14. NaK loading schematic for SNAP 10A units ..................................................................... 38
15. Equilibration holder for use with heat pipe assemblies ...................................................... 42
16. Method to measure O concentration in Na-filled heat pipes .............................................. 42
17. Typical electropolishing apparatus ..................................................................................... 43
18. Corresponding equilibrium O concentrations, V versus Na at 750 °C (1,382 °F) ............. 45

viii
LIST OF FIGURES (Continued)
19. Estimated time required for equilibrium O concentrations in static Na-immersed V wires ................................................................................................................................ 49
20. Alkali metal handling machine (glove box) ....................................................................... 51
21. Proposed NaK/Na purification loop schematic (Glen L. Schmidt, February 4, 2004, rev. O) ................................................................................................................................. 53
22. Basic Na V wire sample cylinder ....................................................................................... 55
23. Sample tube furnace layout ................................................................................................ 56
24. Sample cylinder inserted into heated section ..................................................................... 57
25. Furnace hardware layout with rotation axis ....................................................................... 57 26. Heat pipe module/sample cylinder V wire equilibration setup .......................................... 58

ix
LIST OF TABLES
1. Initial O content Nb-1%Zr components ................................................................................ 10
2. Nb-1%Zr/Na corrosion depth at 1,095 °C ............................................................................ 11
3. Sodium impurity reduction steps .......................................................................................... 19

x
LIST OF ACRONYMS AND SYMBOLS
ANL Argonne National Laboratory
Ar argon
ASTM American Society for Testing of Materials
B boron
Ba barium
C carbon
Ca calcium
CH3OH methanol
C2H5OH ethanol
Cl chlorine
Cu copper
EBR experimental breeder reactor
EFF-TF Early Flight Fission-Test facility
EM electromagnetic
FFTF Fast Flux Test facility
FNAA fast neutron activation analysis
H hydrogen
Hf hafnium
Hg mercury
HNPF Hallam Nuclear Power facility
H2O2 hydrogen peroxide
I iodine
INAA instrumental neutron activation analysis
K potassium

xi
LIST OF ACRONYMS AND SYMBOLS (Continued)
LCAC low carbon arc cast
Li lithium
Mo molybdenum
MSFC Marshall Space Flight Center
N nitrogen
Na sodium
NAA neutron activation analysis
NaCl sodium chloride
Na2O sodium monoxide
Na2O2 sodium peroxide
NaOH sodium hydroxide
Nb niobium
Ni nickel
O oxygen
OD outside diameter
P phosphorus
PTI plugging temperature indicator
R&D research and development
Re rhenium
RH relative humidity
S sulfur
Si silicon
SNAP system for nuclear auxiliary power
TF trifluoroethane

xii
LIST OF ACRONYMS AND SYMBOLS (Continued)
TFE tetrafluoroethylene
Ti titanium
TIG tungsten inert gas
TM Technical Memorandum
TZM titanium-zirconium-molybdenum
U uranium
UN uranium nitride
USAEC U.S. Atomic Energy Commission
V vanadium
Zr zirconium
ZrO2 zirconium oxide

xiii
NOMENCLATURE
aref activity of the Na
C concentration
d diameter
e evaporator
F Faraday’s constant; final (subscript)
f fluid
G evaporator mass flux
g gas
H activation energy
h enthalpy
I initial (subscript)
k Boltzmann’s constant
L length
M mass fraction
MW molecular weight
m weight
N atom fraction
p pressure
qo heat transfer rate
R gas constant
T temperature
To operating temperature
t time
V voltage
xiv
NOMENCLATURE (Continued)
α(T) Arrhenius diffusion rate at temperature
ΔH activation energy
ρ density
τ exposure time

1
TECHNICAL MEMORANDUM
METHOD FOR DETERMINATION OF <5 PPM OXYGEN IN SODIUM SAMPLES
1. INTRODUCTION
Alkali metals provide superior heat transport capabilities. These capabilities are useful for the primary heat transport system to move heat energy from a reactor core to a power conversion system. These metals can also be used to transfer energy from power conversion units to radiator systems. Sodium (Na) has numerous beneficial attributes. Besides its wide operating temperature range, Na generates no radiolytic gaseous byproducts. Use of Na coolant may be appropriate in sensible or latent primary core cooling systems at a temperature of at least 1,125 °C. Such systems, whether they are built from stainless steel or refractory metals, must be kept free of nonmetallic impurities to ensure proper wetting and corrosion resistance.
Working fluid and structural material purity is essential to proper alkali metal heat transfer sys-tem operation. When a working fluid cools, it is free of impurities, compared with the adjacent wall. Nonmetallic impurities, such as oxygen (O) and carbon (C), diffuse from the structure and into the working fluid. These impurities are carried toward the hot zone where they concentrate. Impurities can precipitate and clog wicks, form low melting point eutectics with the container, or form ternary compounds with the container and working fluid.
If any of the elements in the containing structure are soluble in the working fluid, they can dissolve and move to the hot zone. The containment structure must be insoluble to avoid this condition. Proper material selection prevents this problem. In the absence of nonmetallic impurities, the solubility of refractory metals in alkali metals is typically «100 ppm by weight.
Solubility increases in the presence of impurities when ternary compounds form with the work-ing fluid and containment. Impurity corrosion rate in Na heat transfer systems is proportional to the accumulation of elements, such as O, silicon (Si), and C, in the hot zone.

2
2. IMPORTANCE OF ALKALI METAL PURITY—FLOW LOOPS
During the early 1950s and 1960s, alkali liquid metals—sodium-potassium (NaK), K, and Na, were available from numerous suppliers in several grades—commercial, high purity, and reactor. During this time period, the world’s first, and the United States’ only, compact space reactor power system (the system for nuclear auxiliary power (SNAP) 10A), which used NaK for the primary coolant loop was successfully flown (app. A).1 However, no universally accepted standard existed at that time for specifying purity. Thus, impurities analyses were specified for each particular application.2
The impurities came from two sources: (1) The manufacturing process or source materials and (2) contact with other materials during transport, storage, and use. Calcium (Ca), C, and K are typi-cal impurities, either left in or a result of the Na manufacturing process. Calcium chloride was added to the electrolytic cell to reduce the melting point of the sodium chloride (NaCl). Carbon came from the graphite electrodes used in the fused salt process. Potassium chloride was a contaminant in NaCl. Potassium was the largest single impurity typically found in Na, but K and Na were similar in their properties and this impurity was of little consequence in usual applications. Oxygen and hydrogen (H) were impurities picked up in the transportation and use of Na. Oxygen came from contamination by air through leaks and connections, and as a contaminant in the cover gas system. Hydrogen came from con-tact with moisture or hydrocarbons. Impurities can cause metallurgical changes in structural materials and fuel cladding.3
Several major liquid metal reactors were built in the United States (Sodium Reactor Experiment, Seawolf, experimental breeder reactor–I (EBR–I) and EBR–II, Hallam Nuclear Power facility (HNPF), and Fast Flux Test facility (FFTF)) and provided an initial experience base for selecting impurity levels. However, in the late 1960s, detailed comparisons of materials loop data showed a distressing lack of consistency. After carefully evaluating the data, the conclusion was drawn that methods of chemical analysis were not sufficiently uniform to provide a valid results comparison. During that time, the U.S. Atomic Energy Commission (USAEC), now the U.S. Department of Energy, redirected its Na technol-ogy program to standardize methods for sampling and analyzing potential impurities in Na and reactor cover gases. This basic approach required a detailed reexamination of sampling and analysis methods and resulted in the standards program described by the Argonne National Laboratory (ANL), Argonne, IL.
With the advent of standard analyses, and an extension of the program to include in-line instru-ments, a new capability was put to work to characterize working Na systems. Particular attention was given to the EBR–II at Idaho Falls, ID. Application of these tools provided an insight into impurity levels of follow-on liquid metal systems. EBR–II impurity levels were decreased during the last several years of operation to <1 ppm O. During the last several years, the method of determining O in Na shifted from the mercury (Hg) amalgamation method (total concentration of Hg insolubles) to a vanadium (V) wire equilibration method (measures O activity). The wire method was then adopted for use throughout the USAEC program and became a Reactor Development and Technology standard.
3
This led to the question of impurity levels for the FFTF. Purity requirements were based on knowledge of impurity-material interactions, and operating limits were set to mitigate these effects. If data on the effects of impurities were not adequate for this purpose, then purity limits were to be based on well-characterized operating systems’ experience with a history of freedom from serious materials or operational problems (with available records of the variation of metallic and nonmetallic impurity levels with time), operating parameters, and conditions related to the system (s) of interest.
At that time, it was important that purity requirements discriminate between impurities that must be controlled (control impurities) and those that only required measurement (measured only—impurities). The basic purpose of impurities knowledge was to provide a warning basis for operator action.
Alkali metal systems vary in materials of construction, accessories, and mode of operation. Thus, impurities that must be measured continuously depend on each system’s characteristics. Startup and normal operation requirements are quite different.4 The basic impurities of interest are described in sections 2.1 through 2.4.
2.1 Oxygen
The setting of a maximum permissible level for O required not only knowledge of the effect of O on wetting, corrosion, plugging, wear of components, and the related transport of radioactive corro-sion products, but also on the interrelationship that may exist between them. While available information suggested that maintenance of O levels be as low as practical and desirable for reducing corrosion, as well as activated corrosion product transfer and buildup, reduction of the O—below an established level, which is temperature dependent—could lead to wear problems. Thus, recommended levels were set at 5 ppm, with <2 ppm as the nominal level during the late 1960s and early 1970s.
2.2 Carbon
The C level was of concern. Whether the C level should be considered a control variable was not fully determined at that time. Experimental work by Westinghouse Advanced Reactors Division, Waltz Mill, PA, and at the ANL, explored this problem. This work used a special facility that simulated FFTF conditions as closely as possible. The ANL studied the Na-stainless steel-C system and attempted to state this relationship in computer language to enable prediction of possible results.
Carbon concentration data, obtained by the tab equilibration method, suggested that the equi-librium concentration of active C in Na with stainless steel systems fell in the 3 to 30 ppm range. Later methods indicated that the C level in most enclosed stainless steel systems fell in the 0.6 to 2 ppm range. The difference in the apparent data was used to determine C content of Na-stainless steel systems. Total C methods suggested that C not in equilibrium with C in solution (active C) was present, suggesting that active C was smaller than the total C content. Based on total C, the recommended level for C became 10 ppm.

4
2.3 Nitrogen
Determining nitrogen (N) levels in the late 1960s presented a challenge. Although N levels were a suspected problem, there was only limited information about N’s effect in a Na system. The ANL conducted a program to find a way to monitor N. Since the ANL had good results from wire equilibration methods for determining O levels, it was presumed that N could be approached in the same way.
2.4 Hydrogen
The maximum permissible level for H was based on the following: the need to maintain a well cold-trapped condition in all systems, the criterion for use of a plugging temperature indicator (PTI) as an impurity monitor, and the control-limit specification for O. A well cold-trapped environment was desirable because it was definable, achievable, and reproducible. By definition, a well cold-trapped condition was one in which the O level was <2 ppm. Because the cold trap sets H and O levels, the level for H was automatically fixed by the cold trap temperature required to achieve a particular O level. The use of the PTI required that impurities, such as H that have high solubility, be kept below their satu-ration level at all temperatures in the operational range of the system. At the temperature that the solubil-ity of O in Na is 2 ppm, that of H is ≈0.2 ppm. Hence, the H level had to be maintained below this value in order to maximize the probability that the PTI would respond to O and not plug due to H.
During its operation, the FFTF experimental system contained sufficient instrumentation and analytical sampling capability and could provide system analysis for characterization of impurities. This capability provided valuable experience and assistance for determining the need for measurement devices on future demonstration facilities. Conventional sampling was used to provide a baseline for operational information.
At that time, cold traps were the best means for removing impurities.5,6 Cold traps became an integral part of the FFTF systems and were the primary coolant purity-control device. Actions required by the cold-trap operator to control coolant purity were not always clearcut. In systems operat-ing at 850 °F (455 °C) and below, taking action was straightforward. At system temperatures of 900 °F (483 °C) and above, there were some anomalies. For example, EBR–II operated their system at a maxi-mum cold-trapping temperature (plugging temperature) of 300 °F (149 °C). If the plugging temperature was exceeded, the reactor operators would shut down the reactor or reduce system temperatures. When systems operated above 900 °F (483 °C), plugging temperatures in excess of 300 °F (149 °C) were pos-sible. The PTI was a good device for following total impurity levels and for indicating that the cold trap was operating effectively. However, the device could not determine if O levels were in control. The PTI needed additional supporting analyses to characterize impurity content and to confirm recommended actions. Instrumentation must provide rapid, reliable, sensitive responses and must include cross-check-able devices/procedures that provide the operator with reliable impurity data that can be depended on to take appropriate action.4
There were a number of factors considered in sizing a cold trap for each system, as well as considerations concerning sizing the cold trap as a crystallization device. While somewhat arbitrary, a one-system turnover per day through the cold trap provided both reasonable cleanup time and the

5
capability to handle small source terms without cold trap operational changes. Impurity buildup time was an important factor when sizing the crystallizer portion of the cold trap. If the crystallizer tempera-ture difference was excessive, premature plugging and poor utilization of the packed volume could be expected. If residence time in the cold trap was too short, then a highly effective, per-pass removal rate could not be achieved because there is insufficient time for the nucleation and precipitation phenomena to occur. Actually, the combination of crystallizer temperature difference and resident time determined how efficient the unit performed, and ultimately, coolant purity.
Reactor systems have generally not used hot traps for O removal in Na. Such systems were not used in the FFTF because extensive redesign would have been required. These reasons are as follows:
• The 1,400 °F (760 °C) temperatures required for operation would result in system C.
• Zirconium (Zr) was commonly used as the getter material, and experience suggested that embrittle-ment of the Zr could allow Zr particles to enter the system.
• State-of-the-art hot trap designs suggested that these traps were relatively inefficient for O removal.
• High-temperature operation posed many complex structural materials problems.4

6
3. CONSEQUENCES OF ALKALI METAL SYSTEM IMPURITY
3.1 Nonwetting
Wetting of the internal surfaces of an alkali liquid metal system is essential for achieving removal of surface contamination, high heat transfer, and efficient pumping and flow measurement of the coolant when electromagnetic devices are used. Surface impurities inhibit wetting by alkali liquid metals. Knowledge of the conditions required to accomplish wetting is important during startup and heatup of newly constructed alkali liquid metal systems.
The wetting behavior of liquid alkali metals, particularly Na, was investigated in many laborato-ries during the last two or three decades. Much of this work was motivated by the development of liquid metal-cooled reactor systems. Many supporting programs evaluated candidate reactor materials as well. These programs found that complex alloys, such as the stainless steels employed for fuel pin cladding, were less readily wetted than many pure metals.
Other factors that tend to inhibit or delay wetting in some alloys were the presence of O in the Na and the use of certain techniques, such as pickling, to prepare the solid metal surfaces. Information of this type was considered in the context of fuel pin failures in the Dounreay Fast Reactor. These failures were sometimes associated with “tear drop” staining of the cladding, the majority of which occurred in regions where the temperature never exceeded 841 °F (450 °C). This gave rise to the sugges-tion that they were caused by gas bubbles in the liquid Na, which came in contact with the cladding and adhered because of imperfect wetting. While the argument was plausible, a more thorough review concluded that more quantitative wetting data, measured by direct experimentation, was needed before the suggestion’s validity could be tested.
A consistent series of experiments was then conducted to define the effects on wetting behavior at 265 to 1,021 °F (130 to 550 °C) and how this affected the purity and presence of alloying elements in Na. Most of the experiments employed Na, which was filtered to reduce the O level to ≈20 ppm. A few experiments employed triple-distilled Na containing <5 ppm of O, while others used as-received Na containing ≈ 60 ppm of O.
During the experiments, particular attention was paid to defining the temperatures at which the sessile drop contact angle of the liquid Na samples fell below 90° and 20°. A contact angle of <90° signified that the liquid wets the substrate, and hence would penetrate pores and crevices to maximize contact with the cladding, while a contact angle of less than ≈20° was significant because of the improb-ability that the liquid would be displaced from the substrate, and hence permit bubble attachment once such an excellent degree of wetting was achieved.

7
Significant conclusions from the experiments include the following:
• Sodium containing 20 ppm of O did not wet mechanically polished surfaces at temperatures below 571 °F (300 °C). Excellent wetting was not attained in short times at temperatures below 931 °F
(500 °C).
• Surface preparation techniques had marked effects on wetting behavior. Ion bombardment appeared to have beneficial effects, but other nonmechanical techniques, such as electrolytic polishing or
etching, could increase the wetting temperature by more than 300 °F (167 °C).
• The presence of thick oxide films on the substrate surfaces usually had little effect on the temperature at which wetting occurred. The high-temperature wetting rates suggested that the process has an acti-vation energy of 15–20 kcal/mole.
• Decreasing the O content of the Na to <5 ppm decreased the temperature at which wetting first occurred. Increasing the O content to 60 ppm increased the temperature at which wetting first occurred by 180 °F (100 °C).
3.2 Corrosion
The fact that liquid metal corrosion is generally the result of impurities in the alkali metals rather than the attack of structural materials by pure alkali metals has been known for some time. The presence of O above 100 ppm increases the total amount of corrosion, accelerates intergranular penetration, and is responsible for excessive mass transfer. In some systems, 30 to 40 ppm O is barely tolerable. Oxygen-catalyzed corrosion in Na was observed, which showed that increasing the O content of Na at 931 °F (500 °C) from 30 to 100 ppm increased the rate of attack of stainless steel by an order of magnitude. At O levels <30 ppm, no surface-oxide phases are likely to be formed.
Refractory metals are also susceptible to O attack; i.e., O in Na, dissolves in and embrittles refractory metals. The maximum O level in Na, to avoid embrittlement of niobium (Nb) at 1,290 °F (700 °C), was estimated to be <10 ppm. Refractory metals (Nb-1%Zr) have a Zr additive that getters O from solid solution to reduce embrittlement from low-level contaminants, such as O.
The early development of lithium (Li) systems was plagued by corrosion attributed to N impuri-ties. Nitrogen catalyzes the dissolution of structural metals by Li. Prepurification and proper handling of refractory metals resolved much of the earlier problems. Hydrogen impurity, as a hydride in refractory metals, can cause embrittlement at temperatures less than 1,000 °F (538 °C). Above 1,600 °F (871 °C), absorption of H is less. However, H can be transferred to colder sections of an operating refractory metal loop, which can lead to severe embrittlement at the cold side.
Alkali-refractory metal system life behavior is summarized in several textbooks7–9 and discussed in articles.10,11 When a working fluid condenses, it is free of impurities, compared with the condenser wall. Nonmetallic impurities, such as O and N, may diffuse from the condenser wall and into the work-ing fluid. These impurities are carried toward the evaporator, where they concentrate. Impurities can precipitate and clog the wick, form low melting point eutectics with the container, or form ternary compounds with the container and working fluid.

8
If any elements in the wick or wall are soluble in the working fluid, they can dissolve and move to the evaporator end of the pipe. In practice, most clean refractory metal systems have low solubility in alkali metals and low dissolution rates. In the absence of nonmetallic impurities, the solubility of refrac-tory metals in alkali metals is typically «100 ppm by weight.
Solubility increases in the presence of nonmetallic impurities. Ternary compounds form with the working fluid and containment. Impurity corrosion rate in Na heat transfer systems is proportional to accumulation of elements, such as O, Si, and C, in the heat pipe evaporator. As working fluid flows into the evaporator, it vaporizes, concentrating the impurities and making the corrosion rate somewhat dependent on mass fluence. The radial heat flux applied to the evaporator is / ,q q dLerad= ro o _ i the massflux through the evaporator is a function of the radial heat flux G = /q hfgrado , and the mass fluence through the evaporator is M˝ = Gτ.
Mass diffusion transfers impurities from the heat transfer system structure to the working fluid. The Arrhenius equation relates impurity diffusion rates to heat transfer system temperature. To the first order, data can be Arrhenius normalized for heat transfer system tests conducted away from the operat-ing temperature by
/ ,(T) exp H k T T1 1o
= -α ∆^ h< F) 3 (1)
where α(T) is the Arrhenius diffusion rate factor at temperature, T, to the diffusion rate at To, k is Boltzmann’s constant, To is the operating temperature, T is the heat transfer system test temperature, and ΔH is the activation energy. Testing on the order of 100 °C over the design temperature greatly acceler-ates the Arrhenius-governed diffusion rate for Nb-1%Zr/Na heat transfer systems. Mass fluence can be accelerated by applying power along a shortened heat pipe evaporator length.
3.3 Niobium 1% Zirconium/Sodium System
The solubility ranges for Nb in vacuum-distilled and filtered Na over the temperature range 800 °C to 1,300 °C are 0.25 to 250 ppm.12 Despite measurable solubility of one of its constituents, the alloy Nb-1%Zr shows good resistance to solubility-induced attack in purified Na. The corrosion resistance of Nb alloys, such as Nb-1%Zr and C-103, results from Zr, titanium (Ti), and hafnium (Hf) substitution elements that scavenge O from solid solution and precipitate it as ZrO2, TiO, or HfO2. Figure 1 shows the relative thermodynamic stability of ZrO2 and TiO, compared with Nb and Na compounds containing O.13,14 Keeping the Nb lattice pure with additives, such as Zr, inhibits corrosion and reduces embrittling effects from low-level contaminants. Such Ellingham plots are useful guides, but they are not always reliable indicators of element distributions.15

9
–600
–550
–500
–450
–400
–350
–300
–250
–200
400 600 800 1,000 1,200 1,400 1,600
��G
° (k
J/g-
atom
O)
Na2ONa+100 ppm ONa+10 ppm ONa+1 ppm ONa+0.1 ppm ONbO
Nb+250 ppm ONb+100 ppm ONb+10 ppm ONa3NbO4ZrO2TiO
Na3NbO4
Na2ONbO
TiOZrO2
T (K)
Figure 1. Partial molar free energies of Nb/Na/O compounds.
Perkins reported O diffusion rates in Nb and Nb-Zr alloys as a function of temperature.16 The values given by Perkins can be used to estimate O transfer rates within an Nb-1%Zr heat transfer system. Ignoring chemical partitions between compounds and diffusion through ternary oxide scales, the time-dependent O distribution in the condenser and evaporator can be approximated by a coupled system of diffusion equations. The time to deplete O from the condenser of an Nb-1%Zr heat transfer system at 1,273 K and transport it to the evaporator is on the order of days.
Nb-1%Zr has been extensively tested in phase change Na systems and has shown excellent cor-rosion resistance. Nb-1%Zr tested in Na that had been purified in Zr at 650 °C for 250 hr showed only slight Na attack at the liquid vapor interface after 6,000 hr exposure at 1,150 °C.17 In another study,18 Nb-1%Zr specimens with O levels ranging from 2,250 to 6,125 ppm were tested in capsules contain-ing hot trapped refluxing Na (<10 ppm O) for 500 hr at 1,095 °C. Micrographs and depths of corrosion of the 1,200 °C annealed specimens at various initial O concentrations are shown in figure 2. Nb-1%Zr alloy specimens annealed at 1,200 °C with <3,375 ppm O initially (stoichiometric with respect to Zr) showed little weight loss or evidence of corrosion. Intergranular corrosion occurred only when the initial O content of precipitation heat-treated Nb-1%Zr exceeded 3,375 ppm.

10
2250 2400
0.002 in
3375
4050 4400 6125
Figure 2. Depth and type of corrosion of Nb-1%Zr containing various amounts of initial O (ppm) tested in refluxing Na at 1,095 °C for 500 hr. The Na initially contained <10 ppm O.18
Table 1 compares O concentrations for various Nb-1%Zr systems. Based on the photographic evidence of figure 2, noticeable intergranular attack of Nb-1%Zr did not occur until the material exceeded 3,375 ppm O.
Table 1. Initial O content Nb-1%Zr components.
OxygenConcentration
(ppm) Characteristic
6,1253,3752,250
15060
<10<1
–0.05-mm Nb-1%Zr after 500 hr in Na 1,095 °COxygen stoichiometry for Zr in Nb-1%Zr≈0.00-mm Nb-1%Zr after 500 hr in Na 1,095 °COxygen concentration reactor grade Nb-1%ZrOxygen concentration high purity Nb-1%Zr*Oxygen concentration possible in purified Nb**Oxygen concentration possible in purified Na***
* Source: Wah Chang, Albany, OR. ** Using techniques found in Kim.38
*** Using cold trapping and/or distillation.
A first-order estimate of long-term corrosion of an Nb-1%Zr/Na system can be made with a series of very conservative assumptions. First, ignore the observations that stoichiometric concentra-tion is needed to start corrosion in Nb-1%Zr and that corrosion rate decreases with exposure time (see ASTM G68–80).19

11
Instead, assume corrosion rate is linear with O concentration and exposure time. Assume also that impu-rity isolation can be achieved between the heat transfer system and surroundings by material selection, getters, impurity depletion, and geometric features; e.g., isolating gas gap.
Linear ratios of (corrosion depth)/(exposure time-initial Nb-1%Zr O concentration product) are used to estimate long-term corrosion depth. Romano (1968) observed a 0.05-mm penetration after Nb-1%Zr with an initial concentration of 4,400 ppm O was exposed to refluxing Na for 500 hr at 1,095 °C.18 Bounding estimates are made. An upper bound estimate uses commercially purified Nb-1%Zr with 60 ppm O. A lower bound estimate uses getter-purified Nb-1%Zr initially with 10 ppm O. A final estimate assumes that the 3,375 ppm O threshold (stoichiometry) is not reached and no corrosion occurs. Calculation results are summarized and compared to a typical heat transfer system wall thickness in table 2.
Table 2. Nb-1%Zr/Na corrosion depth at 1,095 °C.*
Time(hr)
Initial Oin Nb-1%Zr
(ppm)Depth(mm) Description
500105,120105,120105,120
–
4,400≈1,000
1060–
0.0500≈0.0000
0.04900.25000.8900
Romano (1968)Threshold not reachedLower boundUpper boundHeat transfer system wall thickness
*Initial Na purity <10 ppm O, Nb-1%Zr initially heated to form ZrO2.
The assumptions used in this estimate tend to overpredict corrosion rate. The upper bound corrosion depth estimate predicts no Nb-1%Zr wall penetration after 12-yr operation at 1,095 °C. Using penetration of unirradiated material as a failure criteria, these estimates suggest ample margin for >30 yr to penetration. Long-term (≈10,000 hr) Na corrosion trends support this contention.20,21 Corrosion rate usually decreases with exposure time,19 so long-term extrapolation from 500-hr data is conservative.
3.4 Low Carbon Arc Cast Molybdenum/Sodium System
Molybdenum (Mo) does not have the same impurity-induced corrosion mechanism in Na as Nb-based alloys. Figure 3 plots partial molar-free energies of various Mo/Na/O compounds versus tem-perature. These data suggest that Na2O does not transfer O to Mo as MoO2. Sodium molybdate is a more stable reaction product.

12
–500
–450
–400
–350
–300
–250
–200
–150
–100
400 600 800 1,000 1,200 1,400 1,600T (K)
MoO2Mo+10 ppm OMo+1 ppm ONa2ONa+100 ppm O
Na+10 ppm ONa+1 ppm ONa+0.1 ppm ONa2MoO4SiO2
Na2O
MoO2
SiO2
Na2MoO4
��G
° (k
J/g-
atom
O)
Figure 3. Partial molar free energies of Mo/Na/O compounds.
An Mo/Na heat pipe operated for 45,039 hr at 24 W/cm2 and 1,391 K.22 This test ended for lack of support. This heat pipe was made from low carbon arc cast (LCAC) Mo that was 99.97 percent pure, with <50 ppm C and 15 ppm O. It is significant that this heat pipe operated near 1,400 K, over 100 °C higher than typical baseline designs, suggesting long-life potential for heat pipes made from materials with low levels of interstitial O. Many Mo alloys are corrosion resistant in pure Na. Titanium-zirco-nium-molybdenum (TZM) showed ≈ 0.01-mm grain boundary attack at welds in the Na vapor capsules after 6,271 hr at 1,315 °C.8
Mo/Na systems life-tested with UO2 fuel met with mixed success. Although stoichiometric UO2 is more stable than Mo, small deviations from stoichiometry can reverse this. Posttest examinations showed O-depleted fuel, suggesting O transport from nonstoichiometric regions of the fuel.23
3.5 Niobium 1% Zirconium/Potassium System
A thermal chemical simulation of the Nb/K system with typical contaminant levels found no life-limiting corrosion after 7 yr of operation at 875 K.24 Based on the Nb-1%Zr/K life test data and model-ing, it appears that Nb-1%Zr/K heat pipes have good potential for long life. Exposures of Nb-1%Zr up to 10,000 hr in refluxing K at temperatures to 1,150 °C showed virtually no attack.17 In the absence of O, alloys of Nb showed little evidence of corrosion mass transfer in refluxing K for up to 10,000 hr at 1,200 °C and 5,000 hr at 1,300 °C.25

13
Potassium rapidly depletes O from commercially pure Nb above 600 °C. This observation opposes what would be expected from the Ellingham diagram for Nb/K, suggesting ternary compound formation.
Startup data for an Nb-1%Zr/K heat pipe is given in the literature.26 Another study reported results for eight K-filled Nb-1%Zr heat pipes that were tested for 7,000 to 14,000 hr in the 850 K to 950 K range.27 One of these pipes developed a small evaporator leak at 13,000 hr that did not affect the operation of the heat pipe and was not detected by the vacuum system monitor. Tests on the other heat pipes concluded with no apparent problems. It is believed that Zr in an Nb-1%Zr centering wire touched the quartz tube during test, forming a bridge between the heat pipe and quartz tube.
Figure 4 shows a wire-quartz contact point on the failed heat pipe surface after 13,000 hr of test. Zirconium, being more stable than quartz, partitioned O, causing O to diffuse from the quartz to the condenser wall (fig. 5). Oxygen from the quartz appears to have migrated to the heat pipe and saturated evaporator Zr.
Figure 4. Example of contact point between Nb-1%Zr/K life test heat pipe and quartz enclosure.

14
–600
–550
–500
–450
–400
–350
–300
–250
–200
400 600 800 1,000 1,200 1,400 1,600
��G
°�(k
J/g
-ato
m O
)
T (K)
K2O
ZrO2
SiO2
TiO
NbO
K2OK+100 ppm OK+10 ppm OK+1 ppm OK+0.1 ppm ONbO
Nb+250 ppm ONb+100 ppm ONb+10 ppm OSiO2ZrO2TiO
Figure 5. Partial molar free energies of Nb/K/O compounds.
3.6 Refractory Metal Lithium System
Only brief mention of refractory metal Li system behavior is given here. A summary of pre-1980s Li heat pipe work is found in the literature.28 For reactor applications, Li heat pipes show excep-tional performance at >1,400 K. An axial power density of 23 kW/cm2 at 1,500 K was demonstrated with a Mo/Li heat pipe.29 Nb-1%Zr/Li and Mo/Li heat pipes have been tested on numerous occa-sions.30,31 Data on a Mo/Li heat pipe that was tested for 25,216 hr at 1,700 K before the evaporator perforated has also been reported.23 Failure of the Mo container was attributed to grain boundary attack from nickel (Ni) impurity. Operation for this length of time at >200 °C, above any designs considered to date, suggests good potential for lifetimes exceeding 100,000 hr. Control of initial impurities in the container and fluid (especially Ni, copper (Cu), O, N, and C) is essential for long-life operation.
Figures 6 and 7 show partial molar-free energies of O and N, compounds associated with some Li refractory metal systems. The solubility of N in Li is quite large. Values for N compounds above 1,200 K are extrapolations of free energy and solubility fits found in the literature.14 Lithium effectively getters O from Mo and Nb alloys but transfers N and C to refractory alloys.

15
–800
–700
–600
–500
–400
–300
–200
–100
400 600 800 1,000 1,200 1,400 1,600
��G
° (k
J/g-
atom
O)
T (K)
MoO2Mo+100 ppm OMo+10 ppm OMo+1 ppm O NbONb+1,000 ppm ONb+100 ppm O
Nb+10 ppm OZrO2LiO2Li+1,000 ppm OLi+100 ppm OLi+10 ppm OLi+1 ppm O
MoO2
NbO
LiO2ZrO2
Figure 6. Partial molar free energies of Mo/Nb/Li/O compounds.
–600
–500
–400
–300
–200
–100
0
100
400 600 800 1,000 1,200 1,400 1,600
��G
° (k
J/g-
atom
N)
T (K)
Mo2NMo+100 ppm NMo+10 ppm NMo+1 ppm N Li3NLi+1,000 ppm NLi+100 ppm NLi+10 ppm N
Li+1 ppm NNb2NNb+1,000 ppm NNb+100 ppm NNb+10 ppm NTiNZrN
Mo2N
Li3N
Nb2N
TiN ZrN
Figure 7. Partial molar free energies of Mo/Nb/Li/N compounds.

16
Li3N (melting point 1,086 K) is unstable in Mo >1,400 K and has been observed to contribute to Mo corrosion. As previously stated, residual Ni has also been found to play a role in Mo/Li corrosion.23
Hafnium foil disks, located at the evaporator end of the heat pipe, have been used to getter N in Mo/Li systems.30 Figure 7 indicates that Zr and Ti also getter N from Li. Combinations of these mate-rials might provide margin in the event of the breach of a rhenium (Re) uranium nitride (UN) fuel liner.
Merrigan summarized steps taken to control contamination sources within a 2-m-long Mo/Li artery heat pipe designed to operate at 15 kW and 1,500 K.30 Chemical characterization of heat pipe materials during fabrication and assembly, material cleaning during preprocessing, in situ cleaning during heat pipe fill by hot and cold trapping, and gettering during operation were used. Tests were satisfactorily conducted on this heat pipe near the design point for >100 hr. No problems were apparent during this test series.

17
4. METHODS TO PROMOTE LONG LIFE
The results of previous purity investigations, experiments, and liquid metal system operating experiences should guide future design, fabrication, assembly, and initial operation of new liquid metal test systems and reactor power systems. The purity of alkali liquid metals loaded in an alkali metal system will affect the wetting of the internal surfaces of that system. Wetting of the internal surfaces will be required to remove the impurities on these surfaces, which can be removed by draining, flush- ing, and/or by cold trapping. Reduction of impurities and maintenance of very low impurity levels (1 to 5 ppm) will reduce corrosion and the potential for mass transport between hot and colder regions of the closed system. Mass transport can cause changes in grain boundaries and may shorten the life of systems. For example, consider the results and application of previous wetting experiments:
• The liquid NaO purity before loading should be <20 ppm. Impurities >20 ppm require longer cleanup times and/or higher cleanup temperatures.
• Internal surfaces of components, subassemblies, and systems should be clean before assembly and kept clean thereafter. Oxidized surfaces require longer periods to remove and wet.
• Bakeout and outgassing of internal surfaces of test components, subsystems, and test systems should be considered before loading liquid metals.
• Complete wetting of internal mating surfaces, narrow crevices and cracks, valve bellows and operators, static pools, narrow channels, etc. requires more time and higher temperatures to achieve.
• Consider the exponential increase in the wetting rate as a function of increased surface temperatures. For example, at too low a temperature, wetting takes a very long time. A very high temperature may exceed the capacity of the cold trap to remove the increasing oxide concentration. If the oxide concen-tration is too high for the temperature, oxide plugs will start to form in cold spots, causing flow
to reduce or stop and additional solid plugging of the system will occur beyond the capacity to take corrective action. Temperature requirements for the unplugging of a system will be much higher,
at the location where the plugs occurred, than the original nominal plugging temperature.
• Initial wetting of internal surfaces can release trapped gases that can then be concentrated in void spaces created by valve bellows, heater bundles, expansion compensators, etc. The trapped gases
will expand at higher system temperatures and may not be removed until the entire system is drained and evacuated.
• Wetted systems are more difficult to drain due to surface tensions and pooling. Wetted systems are ferocious getters of impure inert gases, O, H, and N. Only ultra-high-purity inert gases should be used to backfill a wetted system.
Techniques to minimize and precisely measure impurities in the heat transfer system working fluid and structure are now discussed. Proper isolation of the heat transfer system from nonmetallic

18
impurity sources and the use of getters will significantly increase the likelihood of indefinite heat transfer system operating life.
4.1 Start With Proper Material Selection
Nb-1%Zr was used extensively in this Technical Memorandum (TM) as an example of a material that has reactor heritage and demonstrated compatibility in refluxing Na systems. Other refractory mate-rials, such as TZM, or LCAC Mo with getters, could work as well with proper fabrication techniques. Use of container and wick materials that contain materials such as Zr, Hf, and Ti greatly inhibits corro-sion in Na. Niobium-based alloys that contain these elements include Nb-1%Zr, C-103, and C-129Y.
Standards for reactor grade Nb-1%Zr are contained in ASTM B391–03, B392–99, B393–99, and B394–99.32–35 Note that ASTM B392–99 applies to wire with a diameter >0.5 mm. Since <0.25-mm-diameter wire is required for fine-mesh screen, ASTM B 392–99 does not strictly apply.
Use of UN contained within an Re diffusion barrier minimizes N contamination from the fuel. In addition, liberal use of Zr, Hf, or Ti foils, films, or wires within the heat transfer system or on the out-side of the heat transfer system can protect the system from external sources of contamination, providing almost unlimited life margin.
4.2 Deplete Impurities From Structure
For long heat transfer system life, the container and working fluid must be sufficiently free of nonmetallic impurities to prevent the initiation of corrosion. Processing procedures have evolved to keep nonmetallic impurities in the wick and wall within acceptable levels. These processing proce-dures have the side benefit of eliminating outgas products. All parts that are to be exposed to working fluid must be chemically cleaned and vacuum-fired above the core operating temperature in an ultra-clean furnace. Examples of the chemical cleaning and welding steps for Nb alloys are found in the literature.36,37
Electron beam welding is considered essential for proper long-life joints, and refinement of existing techniques will no doubt be required. The welded assembly is then vacuum fired above the core operating temperature to rid it of residual contamination from the weld process. Any O held by Zr in the Nb-1%Zr lattice should remain immobile after an appropriate high-temperature anneal.15
Heat pipe wicks, particularly those made from sintered powder or felt, have large surface-to-volume ratios. Care must be taken to ensure that surface and bulk contaminants are kept low in these structures. Once materials enter the fabrication process, avoid exposing them to noninert atmosphere. Inert gas carriers can be built for transfer of articles between dry boxes or vacuum systems.
Kim used Ti gettering to deplete O from reactor grade Nb.38 A temporary Ti or Zr layer can be deposited on to Nb by vacuum sputtering or chemical vapor deposition. The assembly can then be heated to a temperature based on diffusion rates for a time sufficient to deplete the wall of impurities but insufficient to cause significant diffusion between the tube lattice and the getter. If desired, the layer can be removed by chemical or mechanical means. Similar approaches are found in the U.S.

19
patent literature.39,40 Adsorbed O on refractory metal surfaces or in solution can be reduced with Ca, barium (Ba), or molten Li immersed in getters. A heat pipe built using molten Li gettering has been described.30
The total impurity concentration of C, O, H, and N in Nb and Nb-1%Zr might be measured using glow discharge mass spectrometry or possibly the residual resistance ratio value. Coupon samples should be removed from the heat transfer system wall and wick at each step during fabrication as part of the quality control process. Periodic chemical analysis should be used to cross-check these impurity measurements.
4.3 Minimize Mobile Nonmetallic Impurities in Working Fluid
Techniques have been developed to control Na purity to the demonstrated detection limit (≈0.1 ppm O). These techniques can be incorporated into a flow loop connected to a Na distillation apparatus.19,41 Specifications for reactor grade Na are contained in ASTM C 1051–85.42 Electrolytic reactor grade Na stock can be procured, such as DuPont Niapure™ brand. Reactor grade Na is among the cleanest source stocks available. It contains trace impurities of phosphorus (P), chlorine (Cl), sulfur (S), Si, boron (B), and iodine (I). Corrosion mechanisms for these elements have not been established and are likely unimportant. Cold trapping and distillation should reduce these elements to negligible levels.
Raw Niapure Na supplied to Los Alamos in early 2000 contained 105±30 ppm O, determined by neutron activation analysis. Passing the raw Na stock through a 15-μm filter at 120 °C cleans it to <10 ppm O level. The filtered Na can be introduced into a loop containing hot and cold traps, as well as impurity measuring devices. A port at one end of the flow loop might be configured to allow Na transfer to a distillation apparatus.
High-purity alkali metal working fluid can be introduced into the heat transfer system by vacuum distillation or directly transferred from the loop. A distillation unit should be made from stainless steel or Ni. Distillation of Na at approximately 350 to 400 °C removes common impurities, except K, to neg-ligible levels. Table 3 lists approximate O impurity concentrations after typical purification steps.
Table 3. Sodium impurity reduction steps.
Step Impurity in Na, ppm O
Obtain reactor grade NaCold filter Na (15 µm, 120 °C)Cold/hot trap NaVacuum distill Na Getter trap Na (theoretical)
100≈10
1≈0.1<0.01
The options for alkali metal purification include cold trapping, filtration, distillation, and hot trapping. Each option has attributes that are useful for reduction of impurities in alkali liquid metals.

20
The first three techniques are physical processes in which the chemical nature of the impurity is not altered, while hot trapping is dependant on chemical reaction.
4.3.1 Cold Trapping
Cold trapping involves local cooling of liquid metals to precipitate an impurity that is soluble at a higher temperature. The cold trapping process can be performed by allowing the contaminants to diffuse to a cold point; i.e., like a “cold finger” in the fill tank, or by forced circulation of the liquid metal through a cold container. It is also necessary that the precipitated impurity adheres mechanically to the internal metal components of the cold trap and is not carried back into the main loop where resolution can occur.
Forced circulation cold trap designs have been based on the learning experiences gained from previous operation of test loops. Several factors must be considered in sizing a cold trap for each system, as well as sizing the cold trap as a crystallization device. A one-system turnover per day through the cold trap provides a reasonable cleanup time and the capacity to handle small impurity sources without cold trap operational changes.
Actually, the combination of crystallizer temperature difference and resident time determines how efficient the cold trap unit will perform, and ultimately, the purity of the coolant.
If the crystallizer differential temperature becomes excessive, premature plugging and poor utilization of the precipitation volume can occur. If the residence time is too short, then a highly effec-tive per pass precipitate removal rate will not be achieved because sufficient time was not provided for the nucleation precipitation process to occur.
Cold trap volume should provide a holdup time of at least 5 min or more near or at the precipita-tion temperatures of the circulating liquid metal and provide a sufficient volume to retain the solidified precipitate within the cold trap. Cold trap flow should be based on the turnover time of the total loop volume and the desired temperature difference between inlet and outlet of the cold trap.
Removal of oxides below 100 ppm from liquid Li by cold trapping has not been effective, but reduction of N in Li by cold trapping has been reported.
4.3.2 Filtration
Filtration is generally effective in the removal of transition-metal impurities from alkali metals and can be used as an O removal technique with NaK and Na to a level of ≈50 ppm. Filtration of Li has not been effective for removal of oxides. Filtration of alkali liquid metals was normally performed by heating the metal to a temperature approximately 25 °F (14 °C), higher than its melting temperature. Filtration too near the melting temperature can result in freezing the alkali metal adjacent to the filter. Filtration at high temperatures can result in nonremoval of impurities that have high-temperature-dependent solubility. Ten-micron stainless steel filters were found to be most effective during the initial filling of NaK and Na loops.

21
4.3.3 Distillation
High-purity alkali metal working fluid can be introduced into the heat transfer system by vacuum distillation or directly transferred from a liquid metal loop. Vacuum distillation involves the separation of a material, such as metallic Na, from impurities with much lower vapor pressure. The liquid metal is vaporized in a distillation pot and condensed in a line that allows the pure distillate to gravity feed into a container. A Na distillation unit should be made from stainless steel or Ni.
The most common form of O impurity in Na is sodium monoxide (Na2O), which is stable to at least 700 °C. A pernicious impurity that forms when Na saturated with O is kept at a temperature >250 °C for extended periods is sodium peroxide (Na2O2). Figure 8 compares the dissociation pressure of Na2O2 to the saturation temperature of Na at various temperatures.43 Na2O2 dissociates near distillation temperature and can greatly reduce distillation effectiveness.
T (°C)
p (P
a)
105
104
103
102
101
100
10–1
10–2
10–3
300 400 500 600 700
Na2O2 Dissociation
Dissociated O
Na Saturation
Figure 8. Na2O2 dissociation and Na saturation pressures versus temperature.
Distillation of Na at approximately 350 to 400 °C should remove common impurities, except K, to negligible levels. The sonic velocity of vapor flowing through the transfer line limits the Na mass transport rate at distillation temperatures. If properly implemented, distillation through several stages can produce Na pure to the 0.1-ppm O level. Distillation of large quantities of Na is time and energy intensive. However, with good alkali metal-handling infrastructure, distillation can be a simple and effective means of producing high-purity Na.

22
4.3.4 Hot Traps
The hot trapping process involves chemical conversion of soluble impurities, such as O, N, C, and H, into insoluble compounds. This process generally results in removal of trace impurities and is employed as a final step in alkali metal purification. The getter material used in hot trapping may be soluble; e.g., Ca, or insoluble; e.g., Zr. Insoluble materials are generally preferred. The requirements for insoluble getters are as follows:
• The reaction of the getter with the containment of a particular alkali metal should be favorable.
• The compounds formed on the getter should not markedly inhibit further hot trapping.
• The getter alloy should be compatible with the structural material and be relatively insensitive to mass transfer under nonisothermal conditions.
• Compounds formed during hot trapping should be insoluble in the alkali metal.
• The compounds formed should not spall.
Alkali metals suspected of having considerable contamination should be purified by other means to remove the bulk of the contaminants.
Cold trapping of H from NaK at 212 °F (100 °C) has been shown to be more effective than hot trapping with Zr at 1,200 °F (650 °C).

23
5. METHODS TO MEASURE SODIUM-IMPURITY CONCENTRATION
Impurity concentrations in Na can be measured by a number of industry-standard techniques discussed in ASTM C 997–83. Candidate methods for prefill (inloop) purity monitoring of a representa-tive Na sample include the following:
• Plug meter with a range of >5 ppm O.
• Cold trap temperature with a range of 5 to 100 ppm O.
• Electrochemical meter with a range of 0.1 to 30 ppm O.
• Vanadium wire O activity technique with a range of approximately 0.1 to 20 ppm O.
• Distillation of Na from a crucible (residual O in the crucible is measured by analytical techniques with range 1 to 100 ppm O).
• Neutron activation analysis with a range of 30 to 10,000 ppm O.
• Mercury amalgamation with a range of 1 to 100 ppm O.
Slightly different methods apply for the measurement of C and H in Na. The cost versus benefit of measuring for these elements, as well as others, should be carefully examined.
5.1 Plug Meter and Cold Trap Temperatures
A plug meter consists of a cooled, constricted channel running parallel to a liquid metal loop. Total impurity is found by measuring Na temperature where precipitation begins as a flow and is gradu-ally cooled. The saturation solubility versus temperature relation then establishes the O concentration. Interpreting Na2O plugging temperatures as Na2O saturation temperatures is customary. A solubility plug meter is sensitive above the 5 ppm O level.
Figure 9 shows O solubility in Na versus temperature, which forms the basis for O measurement with a plug meter. Other impurities present in the Na can cause precipitation to occur in the absence of O. Used in conjunction with other techniques, a plug meter is especially useful in determining total nonmetallic impurity levels. The major requirements are to accurately establish Na temperature, flow rate, and a solubility relation. A plug meter can be easily implemented in a Na loop. However, a plug meter appears to have limited use in measuring impurity levels in completed heat pipe modules. Cost to implement a plug meter system should be no more than several thousand dollars.

24
T (K)
Oxy
gen
Solu
bilit
y (p
pm)
10
100
1,000
10,000
100,000
1400 600 1,000800 1,200 1,400
Figure 9. Solubility of O in Na versus temperature.
Using the cold trap discussed in the preceding section, the temperature of the bulk Na stream flowing through a loop’s cold trap can be used to estimate Na purity. This approach is also nonspecific to O, so other impurities could interfere with measurement. This technique appears most suitable together with the V wire method or neutron activation analysis.
5.2 Electrochemical Meter
An electrochemical cell consists of an yttria-doped ceramic tube filled with a reference gas electrode that is placed in flowing liquid Na. Cell voltage (V) provides measurement of O activity in Na and is described by
V aF
RT ln ,4 ref= _ i (2)
where
R = gas constant T = Na temperature (≈550 °C) F = Faraday’s constant aref = activity of the Na.
Reported sensitivity for electrochemical meters is 1 to 30 ppm O. An electrochemical meter is difficult to build and calibrate. Calibration requires independent measurement techniques, such as cold trap temperature or V wire method. ASTM C997–83, sections 158–164, discusses use of these meters.44

25
Even meters developed for the Na reactor program during the 1960s were not considered completely reliable. Such equipment is not commercially available. Unless a usable meter can be found from sal-vage, a considerable development effort would be required to build one. The cost of a suitably calibrated electrochemical meter could greatly exceed $100 K.
5.3 Vanadium Wire Technique
The V wire technique was successfully used for Na loops in the EBR–II program.45 A V wire present in the heat pipe during processing appears suitable to characterize O levels in fully assembled and filled heat pipe modules. A method has been devised to remove the wire from the Na during closure with negligible impurity introduction. The validity of this technique can be independently confirmed by analysis of sample heat pipe modules.
Figure 10 depicts one possible sequence of steps. Sodium is introduced into the heat pipe by transfer through a fill stem containing a 0.25-mm-diameter by 3-cm-long V wire (step A). The heat pipe is then closed and wetted over a 48-hr period at the core design temperature.
Na Fill
V Wire
Heat Pipe Heat Pipe
Heat Pipe
Cap
Sample
A B C D
Figure 10. Method to measure working fluid O concentration in Na-filled heat pipes.
The heat pipe is inverted and heated to immerse the V wire in Na. The assembly is then brought to temperature for a time sufficient to reach equilibrium O concentration between the Na and the wire (step B). Figure 11 shows a time-temperature relation for two wire diameters, assuming that O diffusion through the V is the rate-limiting mechanism.

26
1
10
100
1,000
0.85 0.90 0.95 1 1.05 1.10 1.15
600700800900
0.25-mm Diameter0.5-mm Diameter
T –1�10 –3 (K–1)
T (°C)
t (hr
)
Figure 11. Estimated time required for equilibrium O concentrations in static Na-immersed V wires.
The heat pipe is cooled to room temperature, and the fill stem containing the V wire is severed from the heat pipe inside an argon (Ar) dry box (step C). The wire and a Na sample are extracted from the fill stem for analysis. A cap is attached to the heat pipe using an electron beam welder connected to the dry box (step D). Since the V wire further purifies the Na during equilibration, some correction will be necessary to establish the true O concentration in the working fluid before and after equilibration. This correction is given by the following equations:
,M C 10 2O (V) O (V) #= - (3)
/ /
/,N
M MW M MW
M MW
1O (V)O (V) V O (V) O
O (V) O=
- +` j (4)
. . ,expN N N28 22 39 42 12
O (Na) O (V) O (V)= - -` j; E (5)

27
/ /
/,M
N MW MW
N MW MW
1 1FO
O (Na)O (Na) Na
O (Na) O Na=
+ -` j (6)
,M M Md
d
L
LI F V
V V V2
O (Na) O (Na) O ( ) Na Na Na= + t
te f eo p o (7)
,C M 10( ) ( )F FO Na O Na6#= (8)
and ,C M 10( ) ( )I IO Na O Na
6#= (9)
where
CO (V) = concentration of O dissolved in V (wt%)
M (V)O = mass fraction of O dissolved in V
MWO = molecular weight of O (15.9994)
MWV = molecular weight of V (50.9415)
NO (V) = atom fraction of O dissolved in V
N NaO ( ) = atom fraction of O dissolved in Na
MWNa = molecular weight of Na (22.98997)
M ( )FNaO = final mass fraction of O dissolved in Na
M ( ) INaO = initial mass fraction of O dissolved in Na
ρV = density of V (6.1 g/cc)
ρNa = density of liquid Na at 750 °C (7.727 g/cc)
dV = diameter of V wire (0.01 in)
dNa = diameter of Na in container (0.555 in)
LV = length of V wire in test volume
LNa = length of Na in container
C ( )FNaO = final concentration of O in Na (ppm)
C ( ) INaO = initial concentration of O in Na (ppm).

28
These equations are used to generate figure 12. The V wire technique appears most promising for not only determining O concentration in sealed heat pipes but also for performing an additional purification of the working fluid as part of the closure. The V wire technique should also be among the easiest high-accuracy methods to implement.
0.001
0.01
0.1
1
10
0.001
0.01
0.1
1
10
100
1,000
0.1 1 10 100
CO
(Na) F (ppm
)
CO (Na) I (ppm)
CO
( V ) (w
t%)
Figure 12. Corresponding equilibrium O concentrations, V versus Na at 750 °C.
Appendix B provides a complete stand-alone description of the standard V wire technique adapted for use with heat pipe systems (based on ASTM C977–83, secs. 65–74). In addition, appen-dices C–E provide descriptions of the Early Flight Fission-Test facility (EFF-TF) fill machine glove box that will be used in these procedures, a proposed purification loop to produce purified alkali metal stock, and concept layouts for a sample cylinder/heat pipe module and equilibration tube furnace to test the technique.
5.4 Distillation
Oxygen measurement though distillation involves vaporizing a Na sample under vacuum at ≈350 °C. Nonvolatile residual O in the crucible is measured by analytical techniques, such as titration or flame photometry. Glow discharge mass spectrometry is another possible analytical technique. This method is reported to be sensitive to ≈1 ppm O.9 Discussion of the laboratory scale distillation tech-niques can be found in ASTM C997–83, sections 25–31. Distillation requires some setup and the trans-fer of Na from the source to the crucible. Low distillation temperatures require considerable time for ample Na vaporization. Suitable hardware for this technique, principally a dedicated induction heating system, may cost well over $10K.

29
5.5 Neutron Activation Analysis
Neutron activation analysis (NAA) can measure O content in Na by interaction of O nuclei with 14-MeV neutrons. Through a 16O(n,p)16N reaction, 6.129-MeV gamma rays are emitted and detected during the 7.10-s half life of 16N. Using low O Cu to encapsulate the Na, NAA should give accurate measurement of O concentrations above 30 ppm.
NAA can provide reasonably accurate results for minimal cost and effort. Preparation and fill of Na containers for NAA normally costs <$0.5K per sample. The actual measurements conducted at Texas A&M are ≈$0.2K/sample.
Although used primarily to measure O concentration, neutron activation can also be used to measure the concentration of other nonmetallic impurities (W.D. James, Personal Communication, February 1999). Fast neutron activation analysis (FNAA) has been used for N measurement by a (n,2n) reaction on 14N, producing the positron emitter, 13N. Nitrogen concentration is identified by way of a 511-keV annihilation peak. This method of N measuring is only good at percent levels in most materi-als. Phosphorus can be measured by a similar technique, but since it also produces a positron emitter, the two elements interfere with each other. If both are present at percent level, the decay curves can be resolved (10-min versus 2.5-min half-lives, respectively).
Carbon cannot be measured with NAA. Silicon can be measured with an (n,p) reaction at about the 1 percent level. Calcium and Cu can be determined most sensitively with reactor-based thermal NAA, generally called instrumental neutron activation analysis (INAA). At higher concentrations, Cu can be measured with FNAA. As far as simultaneous measurements, O is always separate. Nitrogen, Si, Cu, and, potentially, P could be measured in a single FNAA run, although the run would be complicated. Copper and Ca could be determined in a single INAA run.
5.6 Mercury Amalgamation
The Hg amalgamation method measures O content in Na by extracting Na from Na2O via pure Hg. Na2O is insoluble in Hg amalgam. The residue is dissolved in deionized water and tritrated to determine the hydroxyl ion equivalent of Na2O in the residue. General tritration procedures with Na are discussed in ASTM C997–83, sections 190–199.
Although this method requires little equipment, sample preparation for the Hg amalgamation O measurement method is time and labor intensive. Mercury handling can be troublesome. DuPont recently estimated that to set up a lab for O measurements using this technique would cost at least $10K. The Hg amalgamation method is sensitive to ≈10 ppm O, but other compounds present in the Na, such as NaH can interfere with the measurement. The lack of accuracy, coupled with difficulties associated with handling, makes several competing techniques appear more suitable for the measurement of O concentration in Na.

30
5.7 Incorporate Getters as Part of the Material System
Nonsoluble getters remove interstitial impurities from heat transfer system materials during processing as well as slow diffusion rates and trap impurities during operation. Group IVB elements, such as Ti, Zr, and Hf, are virtually insoluble in Na. They form low, free-energy compounds with corrosion-inducing impurities. Exposing these materials to Na removes these impurities. The rate-determining mechanism associated with O gettering is solid state diffusion of O through the material. To work properly, these materials must have a large, active surface area that is well distributed through the heat transfer system, especially near the evaporator. Alloys with Ti-Zr combinations have enhanced gettering rates when compared with pure group IVB elements. Getters may be considered for use in either Nb or Mo systems.

31
6. QUALITY CONTROL PRACTICES
To date, most alkali metal heat pipes have been built in small quantities in research and develop-ment (R&D) environments. Production and R&D reliabilities necessarily differ; the former far exceeds the latter. R&D prototypes fail more frequently than production systems as new processes are estab-lished. When failure sources become known, corrective action enhances prototype reliability. As invest-ment is made in successively larger lot sizes, quality control practices improve and reliability increases.
Lewis summarizes general engineering reliability practices.46 A bathtub-shaped curve describes the time-dependent failure rate of component life. Early in life, variability, due to manufacturing process defects, can result in high component failure rate. Juvenile failures might result from weld failures and corrosion or dewetting from excess nonmetallic impurities not removed by processing and fill. Failure rate remains small and roughly constant during the normal operating period, if working fluid and struc-ture impurity concentrations are controlled during processing. Steps that should maximize heat pipe reli-ability and life for cores containing tens to hundreds of heat pipes47 are listed in the recommendations of this TM.

32

33
7. SUMMARY AND RECOMMENDATIONS
The following are some recommendations:
(1) Clear choices for a combination of performance and practicality in Na purity verification to <5 ppm O consists of the following options (in order of preference):
(a) Vanadium wire with LECO Approximately 0.1–20 ppm O (b) Cold trap incorporated into flow loop with range 5–100 ppm O (c) Plug meter incorporated into flow loop with range 5–100 ppm O (d) Neutron activation analysis (coarse measurements) 30–10,000 ppm O (e) Distillation to confirm V wire results >1 ppm O.
(2) The electrochemical meter and Hg amalgamation techniques do not appear suited for this program and will only be considered as supplemental methods.
(3) A Na flow loop should be built (app. D). Sodium samples of various O concentrations (as determined by cold trap and plug meter temperatures) should be extracted. The O content measure-ment by the solubility methods should be compared and correlated with measurements taken using the V wire technique and neutron activation analysis.
(4) A V wire test systems should be built to characterize Na samples taken from flowing loops and static heat pipe systems. Measurements should be cross-correlated for consistency. For example, a Na sample with 100 ppm O initially should be brought to equilibrium (≈50 ppm O) with a V wire. The same source stock should be subsequently equilibrated to 9 ppm O, then 0.2 ppm O, using different wires.
(5) Sodium purity verification procedures are the first steps to assure reliability and life for Na-cooled cores. Other steps include:
(a) Build each flight component under a strict quality control program. Use procedures during all manufacturing phases to minimize nonmetallic impurities in the working fluid and structure.
(b) Identify substandard material batches and monitor material and weld defects ultrasonically and via radiography.
(c) Measure impurity levels in the structure and working fluid samples as part of the fabrication quality control process.
(d) Perform accelerated life tests on sample components at elevated temperature, mass flux, and various impurity levels to determine corrosion sensitivity. Shorter, accelerated tests may be possible by operating the heat pipe nearer its operating limit.

34
(e) Conduct destructive chemical and metallographic examinations on sample components during and after accelerated life test for evidence of corrosive attack, and to determine impurity distributions. Compare measured impurity distributions to thermal chemical model predictions.
(f) Conduct acceptance tests on each flight component to identify processing errors and to weed out defects. A 6- to 8-mo acceptance test should be sufficient. If scheduling becomes tight, acceptance tests might be accelerated in a fashion similar to life tests.
(g) Assay completed flight components as a quality control check to ensure nothing went wrong during the closeout process.
(h) Perform postacceptance destructive evaluation on a representative sample of components.

35
8. CONCLUSIONS
Current technology can produce the alkali metal purity levels required to support long-life reactor components, such as heat pipes and flow loops. Adequate handling, purification, and assay techniques are essential in the production of pure alkali metal stock, which is necessary for several potential reactor concepts. A rigorous quality control plan must be a component of these operations, which can be accomplished by developing appropriate standard procedures.

36

37
APPENDIX A—SYSTEM FOR NUCLEAR AUXILIARY POWER 10A REACTOR SYSTEM PROGRAM—A RELEVANT FLIGHT SYSTEM DEVELOPMENT EXPERIENCE
The SNAP program was sponsored by the USAEC and Air Force at Atomics International and included the SNAP 2, 8, and 10A systems. Considerable effort was expended by the Federal Gov-ernment and its contractors during the late 1950s and 1960s in the development, qualification, accep-tance, and successful flight demonstration of the world’s first and the United States’ only compact space reactor power system. SNAP reactor systems and test systems used, and were cooled by, the alkali liquid metals NaK and Na at temperatures approximately 1,000 °F (538 °C) to 1,300 °F (705 °C).
The SNAP 10A FS–4 system (fig. 13) was launched from Vandenberg Air Force Base on April 3, 1965, into a 700-nmi polar orbit. The system operated as designed for 43 days before shutdown, caused by a failed voltage regulator in the spacecraft. Eight thermal-hydraulic operating systems were designed, assembled, and tested at designed temperatures during the development, qualification, acceptance, and demonstration of the system’s performance. Other systems—structural and electrical mockups—were also assembled and tested to explore and demonstrate the capability to endure ground handling and launch loads, electrical compatibility with test equipment, ground support equipment, launch systems, and spacecraft.
Figure 13. SNAP 10A FS–4 at the Acceptance Test facility.

38
The initial purity and control of the purity of liquid metals loaded into the test loops—used for component subsystem and system evaluation, qualification, and acceptance—were evolving, creat-ing significant challenges throughout the SNAP 10A program. The NaK loading and purification system used during the acceptance testing of the FS–4 flight system, before sending it to the launch site, is illus-trated in figure 14 (obtained from the SNAP 10A test program report). The NaK purity level for these systems was based on the cold trap temperature and was confirmed by Hg amalgamation analysis. Plugging temperatures were used to observe trends/changes in oxide concentrations.
NaK Loading System
Drain Tank
Fill Tank
EM PumpRefrigNo. 1
P1 P2
SNAP 10A NaK Loading System (Simplified)
SNAP 10AFSN4
Core
A
B
Heater
F/M
RefrigNo. 2
F/M
ABH
X
Plug
Loo
p
FilterFilter
Expansion
Figure 14. NaK loading schematic for SNAP 10A units.
Many other NaK loading and purification systems were designed and used to support the thermal-hydraulic development of liquid metal components, subsystems, and systems. These other NaK loading and purification systems are too numerous to describe in this TM.
Many learning experiences were gained during purification and testing of alkali liquid metal systems. A few are cited as follows for consideration by operators with little experience:
(1) One size, one design, and one configuration of a generic purification and loading system does not fit all requirements or accommodate the individual requirements of any specific liquid metal test loop. Each loop and test article will be different, and each must be tailored to the testing being planned and performed. Consider the following: source materials, construction materials, temperatures

39
and temperature sensors, pressures and pressure sensors, flows and flowmeters, volume expansion, fill and drain tank sizes, and cold trapping requirements (volumes, precipitation temperatures and tempera-ture differences, cold trap flows, volume turnovers per day, use of economizers, desired purity levels, etc.)
A portable liquid metal purification and loading cart/system was designed by system engineers on the SNAP program to save time and money during the development and qualification effort. The complex portable system, built at considerable cost, could not fulfill the minimum purity level require-ments for its own system, was abandoned after numerous configuration changes, and was never used thereafter.
(2) Keep the design and construction of purification and loading systems and test loops very simple.
(3) Loading a newly constructed test loop with NaK or Na is usually very straightforward and can be performed quickly, using the appropriate filters, evacuated loop, fill pressures, and level sen-sors. However, starting loop circulation, heater and temperature control, flow determination and control, and initiation of wetting must be done slowly to ensure that the operator is fully aware of the pending consequences of oxide plugging, prevention, and/or corrective action required.
During the initial NaK loading of the first SNAP 10A system (PSM–1), some of the 40 converter/radiator tubes did not increase in temperature within the first several hours of operation. This was dis-covered 2 days later, and after several weeks, the solution to unplug the tubes, and prevent the plugging thereafter, was implemented.
(4) Before initial operation of a new test loop, anticipate potential problems or indications that a problem already exists. Be aware of the procedure for mitigation and prevention of potential or existing problems.

40

41
APPENDIX B—STANDARD TECHNIQUE FOR ANALYSIS OF NUCLEAR-GRADE SODIUM HEAT PIPES BY THE EQUILIBRATION METHOD USING VANADIUM WIRES
This technique is based on ASTM C997–83, sections 65–74.
B.1 Scope
B.1.1 Oxygen in Sodium
This method is applicable for determining O in Na using the wire and foil equilibration sampling procedure. This procedure requires 3 to 4 hr, excluding equilibration time.
B.1.2 Oxygen in Vanadium
This method appears applicable in the range of 10 to 1,000 μg of O in V (0.1 to 15 μg/g of O in Na with the amount of V wire usually available). The range may be extended down to 0.003 μg of O in Na, if V wires of 0.1 g are available.
B.2 Summary of Method
A V wire is immersed in Na at 750 °C (1,382 °F) for a time sufficient to establish equilibrium with respect to O. Subsequent measurement of the O concentration in the wire is related to the concen-tration of active O in Na at that temperature by means of the distribution coefficient.
B.3 Interferences
Temperature-induced equilibrium shifts, involving O and other impurities, can theoretically affect the O concentration determined by this procedure, if the equilibration occurs at a temperature other than the system temperature. Extensive experience indicates that this is not a problem in measuring the O in a 300 to 650 °C (572 to 1,202 °F) system.
B.4 Apparatus
B.4.1 Specimen-Equilibration Device Options
Figure 15 is a schematic drawing of the holder for use with Na heat pipes and small Na specimens. Figure 16 is a schematic drawing showing steps in the equilibration process for Na heat pipes and small Na containers.

42
Sodium Fill Tube
Sodium Test VolumeMaterial – Nickel – Stainless Steel – Nb-1%Zr
Vanadium Wire Test Cells – Typical �2 Wire in Cell – Length 1 to 2 in – Wire Diameter 0.01 to 0.02 in
Connecting Stem Sectionedand Drilled to Accommodate a Number of Vanadium WireSample Sections
Heat Pipe Module – Stainless Steel – Nb-1%Zr
Wick Structure
Evaporator Plug
Figure 15. Equilibration holder for use with heat pipe assemblies.
Na Fill
V Wire
Heat Pipe Heat Pipe
Heat Pipe
Cap
Sample
A B C D
Figure 16. Method to measure O concentration in Na-filled heat pipes.
B.4.2 Electropolishing Apparatus
Figure 17 shows a typical electropolishing apparatus. The electrolysis cell consists of a 250-mL tall-form beaker with a cylindrical cathode (>1,000 mm2) near the bottom. Platinum and tantalum are suitable cathode materials. The lead from this electrode is insulated with shrink-fit tetrafluoroethyl-ene (TFE)-fluorocarbon or polyethylene. Anode contact is made through spring-loaded forceps with

43
Power Supply Magnetic Stirrer
+ – Cathode
Electrolysis Cell
Vanadium WireSample
Clamp
Figure 17. Typical electropolishing apparatus.
platinum tips. The electrolysis cell rests on a magnetic stirrer. Direct current is supplied from batteries or a rectifier capable of providing up to 4 A at 4–25 V.
B.4.3 Oxygen-Determination Apparatus
This apparatus is capable of determining 0.1 to 1.5 percent O in V metal by an inert gas or vacuum-fusion technique. A LECO RO–16 (currently marketed equivalent TC500) O determinator has been used successfully.
B.4.4 Magnetic Stirrer
The magnetic stirrer is TFE-fluorocarbon-coated stirring bars.
B.4.5 Forceps
The self-locking type of forceps were used.
B.5 Reagents and Materials The following materials are required for this technique:
• Acetone, technical grade.
• Electropolishing solution—cautiously add 200 mL of concentrated sulfuric acid to 800 mL of chilled methanol (CH3OH) while stirring. Store in a glass bottle. Discard after use.
• Ethanol (C2H5OH), technical grade.

44
• Lintless tissue, Cel-Fibe wipes No. 1745, or equivalent.
• Nickel flux, LECO part 763–065 or equivalent.
• Oxygen standards, approximately 100 and 300 μg/g O in steel; LECO O standards; stock Nos. 501–645 and 501–646, have been found satisfactory.
• Vanadium wire high purity, annealed, 0.25-mm (0.010-in) or 0.50-mm (0.020-in) diameter with a tolerance of 0.005 mm (0.0002 in). Typical impurity concentrations are <300 μg/g total metallic impurities (Ti + Zr + Hf shall be ≈20 μg/g), ≈300 μg/g total of O, N, H, and C (none of which shall be >150 μg/g). The wire surface shall be smooth and free of scale, showing only line
drawing marks. This surface must be free of galling and pitting marks. Ductility and surface condition of the wire must permit bending the wire 180° about its own diameter without surface cracking. The ductility of the wire must be sufficient to withstand, without fracture, six bends about its own diameter. A general description of the bend test is found in ASTM A370, sections 14 and S22. Vanadium wire of sufficient purity has been obtained from the Materials Research Corporation, Orangeburg, NY. Other potential V wire sources are Goodfellow and All-Chemie.
B.6 Precautions
Observe the usual precautions for handling Na, acids, and flammable liquids. Avoid electrical sparks when electropolishing to prevent ignition of the polishing solution.
B.7 Calibration of Vacuum-Fusion Analyzer
Check the instrument in accordance with the instruction manual and the precautions in sec- tion B.6. Determine a crucible blank, and standardize the instrument with one high (≈300 μg of O) and one low (≈100 μg of O) standard.
B.8 Procedure
B.8.1 Wire Preparation and Equilibration
(1) Cut the V wire into lengths suitable for the intended holder, and coil or straighten as required (see fig. 15). Equal lengths of wire should be prepared for the heat pipe and test volume.
(2) Degrease the wire with acetone. Handle the degreased wire with forceps or clean cotton gloves.
(3) Place wires in wire holders located on the heat pipe/test volume end caps assembly. If a holder like that in figure 15 is used, fix the wires in place by bending their ends around the holder. Nickel is the preferred material for the wire holder and the test volume. Typically 50 to 75 mm of 0.25-mm-diameter wire or 20 to 30 mm of 0.50-mm-diameter wire is exposed in an equilibration. Figure 16 depicts the subsequent sequence of steps.
(4) Weld the holder to the heat pipe and the test volume bodies in an inert atmosphere.

45
(5) Inside an inert atmosphere, introduce Na into the heat pipe and test volume by transfer through the fill stem (step A) with a quantity of Na sufficient to occupy the fill stem, test volume, connecting holder tube, and cover the V wire contained within the heat pipe. The heat pipe orientation during the fill operation is typically with the condenser end above the evaporator.
(6) Choose an equilibration time from figure 18 from the estimated concentration of O in the Na; if no reliable concentration estimate is available, assume 0.01 μg/g. The equilibration time for 0.25-mm-diameter wires must be in the 4- to 30-hr range. The equilibration time for 0.50-mm-diameter wires must be in the 16- to 120-hr range.
0.001
0.01
0.1
1
10
0.001
0.01
0.1
1
10
100
1,000
0.1 1 10 100
CO
(Na) F (ppm
)
CO (Na) I (ppm)
CO
( V ) (w
t%)
Figure 18. Corresponding equilibrium O concentrations, V versus Na at 750 °C (1,382 °F).
(7) Place heat pipe assembly condenser side down in a vacuum furnace that can be tilted 180° while at 750 °C (1,382 °F). Orient heat pipe assembly as shown in figure 16, step B. Bring the furnace to 10–5 torr or better. Turn on furnace heaters. Once Na melting temperature is reached, approximately 100 °C (212 °F), tap assembly as needed to move Na to the condenser end of heat pipe assembly. Bring heat pipe assembly to 750 ± 2 °C (1382 ± 4 °F) for the chosen time.

46
B.8.2 Postequilibration Treatment
Following is the procedure for nonradioactive systems:
(1) After the chosen equilibration period has elapsed, tilt vacuum furnace at 750 °C to bring the heat pipe condenser above the evaporator. Tap the furnace to assist the Na flow from the condenser end to the evaporator end. Shut off furnace heaters.
(2) Cool the heat pipe assembly to a convenient temperature, not less than 110 °C (230 °F).
(3) Tilt vacuum furnace to return the heat pipe condenser below the evaporator; this will move the Na back to the condenser end. Tap assembly as needed. Cool the heat pipe to room temperature.
(4) Sever test volume from the heat pipe inside an Ar-purged dry box (fig. 16, step C).
(5) The wire and a Na sample are extracted from the test volume for analysis.
(6) A cap is attached to the heat pipe, using an electron beam welder connected in an inert atmosphere (fig. 16, step D).
(7) Dissolve the Na adhering to the V wires in ≈1,000 mL of technical grade C2H5OH. The large volume of C2H5OH prevents excessive wire heating.
(8) Rinse holder and wires with water and allow the wires to dry.
Note: For the rest of the procedure, handle the wires with forceps.
(9) Remove the wires from the holder. Use only straight portions of the wire for analysis. Make cuts, as necessary, at least 3 mm from each bend.
(10) Separate the wires for archival storage from those for immediate analysis.
(11) Store the archival wires in a properly identified, capped vial.
(12) Fill the electrolytic cell with electropolishing solution. Grasp the wire with the forceps and adjust the anode position so that the forcep tips just contact the liquid and the wire is centered in the cell. If the wire is too long, cut or bend it into a “J” shape. With the stirrer at a low speed, start the electrolytic current. Adjust the voltage to provide a current of 5–10 mA/mm for 0.25-mm wire or 10–20 mA/mm for 0.5-mm wire. Polish each end of the wire for 30 s to reduce the diameter 0.03 to 0.05 mm. Rinse the wires in water and then HCHO. Use only forceps to handle the clean wires.
(13) Determine the O content of the wire by a standard inert gas-fusion or vacuum-fusion tech-nique; i.e., by method ASTM E146, or if a vacuum-fusion analyzer is used, by the procedure described in section B.8.3.

47
B.8.3 Determination of Oxygen by Vacuum Fusion Analyzer
(1) Cut 0.25 in (6.4 mm) off each end of the wire.
(2) Cut the rest of the wire into lengths just under 3/8 in (9.5 mm) and place them into clean glass vials (≈10 pieces are obtained per wire).
(3) Select and weigh a wire, based on the estimated O concentration that will contain 100–300 μg of O.
(4) Put a Ni flux spiral into a new graphite crucible and insert the crucible into the lower electrode; without the Ni flux, the wires do not always completely fuse.
(5) Using forceps, transfer the weighed group of wire sections to the empty wire loader. Using a flashlight, ascertain that all wires are at the bottom of the loader. Occasionally, a wire will not fall to the bottom and may hang up in the loader.
(6) Slide the wire holder to the left after ascertaining that the furnace assembly is open. The furnace assembly must be open to prevent N pressure from blowing wires out of the holder.
(7) Close the furnace assembly and proceed according to the instruction manual.
Note: Successful operation requires that both a purge and a measure pressure be approximately 12 psig (83 kPa) and that they be equal within 0.1 psig (0.7 kPa).
Note: Effective operation requires the maintenance of a fixed N purge rate of 0.8 to 2 L/min. To prevent blockage of the purge gas-exit orifice by particulates, the LECO RO–16 instrument is equipped with a paper filter in the line. This filter may become plugged and will require removal and replacement. The LECO instruction manual covers this maintenance step.
(8) Record the readout.
(9) Open the furnace assembly to relieve the N pressure when the determination is complete. Using a flashlight and a mirror, check the cavity to ascertain that no wires are hung up. If a wire section has hung up, remove and weigh it, and correct the wire weight.
(10) Analyze a standard that will correspond to the level of O in the wires after approximately every six determinations.
B.9 Calculation
Calculate the O concentration in the V wire:
/ ,C m m m10O F O I2
O (V) (V) (V) V#= -` j (10)
where
m FO (V) = oxygen content of wire (mg)

48
m IO (V) = oxygen content of fusion blank (mg) mV = weight of wire (mg).
(1) Determine the O concentration in Na (in micrograms per gram) corresponding to the weight percent O in the equilibrated V wire by reference to figure 18. Since the V wire further purifies the Na during equilibration, correction will be necessary to establish the true O concentration in the Na before and after equilibration.
(2) Figure 19 was prepared to establish the true O concentration in the Na before equilibration, applicable to the equilibrium O distribution between V and Na at 750 °C (1,382 °F):
,M C 10 2O (V) O (V) #= - (11)
/ /
/,N
M MW M MW
M MW
1O (V)O (V) V O (V) O
O (V) O=
- +` j (12)
. . ,N N N28 22 39 42 1exp( )O Na2
O (V) O (V)= - -` j; E (13)
/
/,M
N MW MW
N MW MW
1 1FO (Na)O (Na) O Na
O (Na) O Na=
+ -_ i (14)
,M M Md
d
L
L( ) ( ) ( )I FO Na O Na O V
Na
V
Na
V
Na
V2
= + tte f eo p o (15)
,C M 10( ) ( )F FO Na O Na6#= (16)
and ,C M 10( ) ( )I IO Na O Na
6#= (17)
where
CO (V) = concentration of O dissolved in V (wt%)
M (V)O = mass fraction of O dissolved in V
MWO = molecular weight of O (15.9994)
MWV = molecular weight of V (50.9415)
NO (V) = atom fraction of O dissolved in V
N NaO ( ) = atom fraction of O dissolved in Na
MWNa = molecular weight of Na (22.98997)
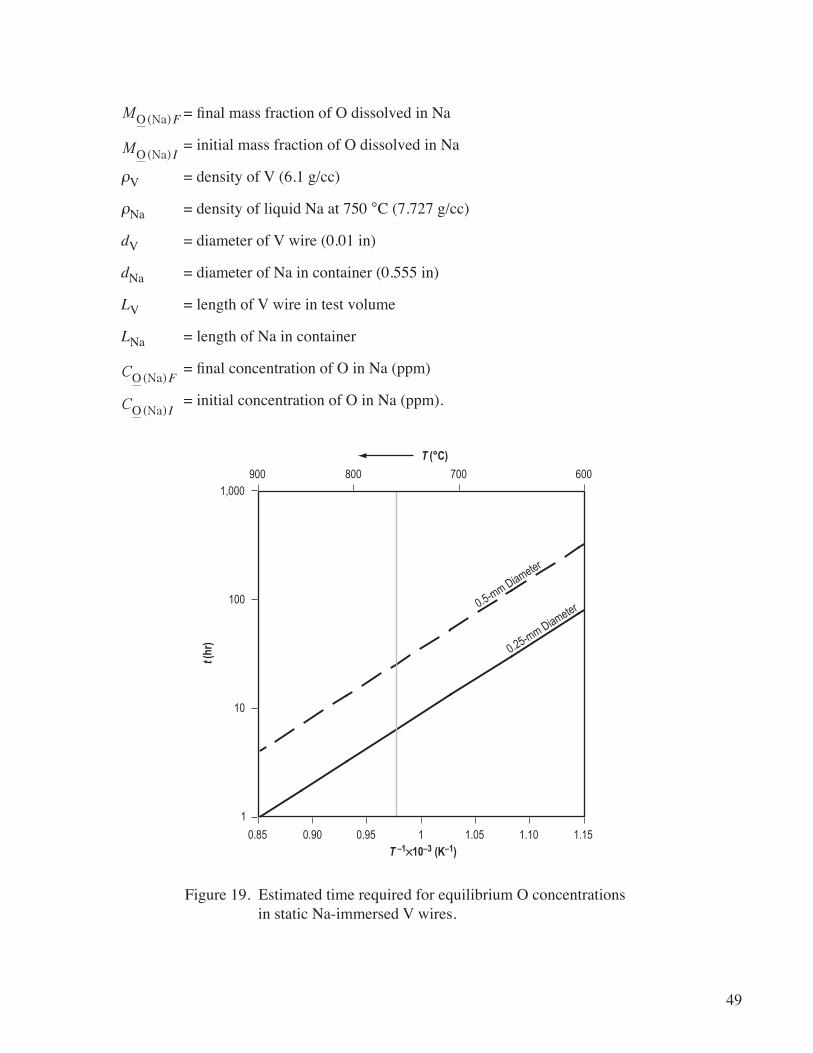
49
M ( )FNaO = final mass fraction of O dissolved in Na
M ( ) INaO = initial mass fraction of O dissolved in Na
ρV = density of V (6.1 g/cc)
ρNa = density of liquid Na at 750 °C (7.727 g/cc)
dV = diameter of V wire (0.01 in)
dNa = diameter of Na in container (0.555 in)
LV = length of V wire in test volume
LNa = length of Na in container
C ( )FNaO = final concentration of O in Na (ppm)
C ( ) INaO = initial concentration of O in Na (ppm).
1
10
100
1,000
0.85 0.90 0.95 1 1.05 1.10 1.15
600700800900
0.25-mm Diameter0.5-mm Diameter
T –1�10–3 (K–1)
T (°C)
t (hr
)
Figure 19. Estimated time required for equilibrium O concentrations in static Na-immersed V wires.

50
B.10 Precision and Accuracy
B.10.1 Precision
For the concentration range of 0.5 to 5 μg/g of O in Na, the relative standard deviation is expected to be within 10 percent. For results in that concentration range, one laboratory reported relative standard deviations ranging from 1 to 7 percent for 10 sets of triplicate determinations made over a period of several months.
B.10.2 Accuracy
No standards are available for accuracy assessment. The O analyzer is calibrated to eliminate bias in the measurement of O contained in the V wire.

51
APPENDIX C—DESCRIPTION OF ALKALI METAL HANDLING MACHINE AND PROPOSED PURIFICATION SYSTEM
C.1 Alkali Metal Handling Glove Box/Fill Machine
Two of the three reactor system concepts tested in the EFF-TF required expertise in handling alkali metals; e.g., Na and Li for heat pipes and NaK, Na, or Li for the liquid metal concepts. To accom-modate this activity, an alkali metal handling machine (inert glove box system equipped with dry-cool and Ni-train units) was assembled. This machine provided the capability to build expertise and test hard-ware (fig. 20). The bulk alkali material was contained in bulk storage containers (ranging from 3 to 8 kg) located on the top of the machine and integrated with a stainless steel liquid metal distribution system. All liquid metal feedlines, valves, and filters were equipped with heaters, insulation, and thermocouples controlled by a LabView™ system to regulate transfer temperatures.
Figure 20. Alkali metal handling machine (glove box).
While the machine capabilities were first demonstrated by filling heat pipe modules with Na,the experience gained was applicable to all concepts utilizing alkali metals. Using stainless steel heat pipe modules (designed for the safe, affordable fission engine (SAFE–100)), a fill process was devel-oped, optimized, and validated. Specifically, each received ≈35 g of pure liquid Na metal dispensed under the inert dry Ar glove box atmosphere (maintained at <1 ppm O and water vapor). A total of 25 stainless steel heat pipe module was successfully filled with Na. In addition to performing the fill,
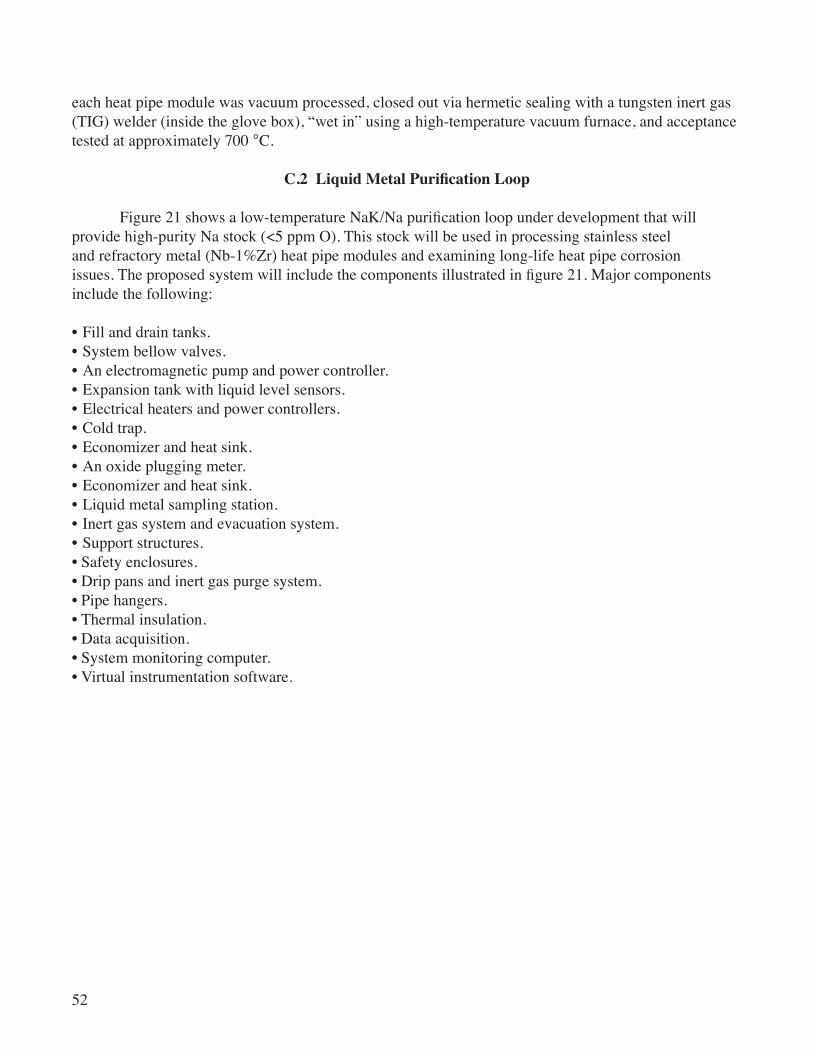
52
each heat pipe module was vacuum processed, closed out via hermetic sealing with a tungsten inert gas (TIG) welder (inside the glove box), “wet in” using a high-temperature vacuum furnace, and acceptance tested at approximately 700 °C.
C.2 Liquid Metal Purification Loop
Figure 21 shows a low-temperature NaK/Na purification loop under development that will provide high-purity Na stock (<5 ppm O). This stock will be used in processing stainless steel and refractory metal (Nb-1%Zr) heat pipe modules and examining long-life heat pipe corrosion issues. The proposed system will include the components illustrated in figure 21. Major components include the following:
• Fill and drain tanks.• System bellow valves.• An electromagnetic pump and power controller.• Expansion tank with liquid level sensors.• Electrical heaters and power controllers.• Cold trap.• Economizer and heat sink.• An oxide plugging meter.• Economizer and heat sink.• Liquid metal sampling station.• Inert gas system and evacuation system.• Support structures.• Safety enclosures.• Drip pans and inert gas purge system.• Pipe hangers.• Thermal insulation.• Data acquisition.• System monitoring computer.• Virtual instrumentation software.

53
Vac/Gas
Vac/Gas
VolumeCompensator
EM Pump
Economizer
ColdTrap
PlugMeter
Liquid Metal Safety Box Inert Glove Box
Na Fill Cylinders Oxide Samples
Internal Glove BoxWork Area
Filter
DrainTank
FillTank
HeatersValvesFlowmeter
Level Sensors
Legend
Figure 21. Proposed NaK/Na purification loop schematic (Glen L. Schmidt, February 4, 2004, rev. O).

54
APPENDIX D—SAMPLE CYLINDERS AND TUBE FURNACE FOR VANADIUM WIRE EQUILIBRATION ANALYSIS
D.1 Basic Sample Cylinder Design
To validate the V wire technique for measuring the O concentration in Na, a basic sample cylin-der is required. The initial concept for this cylinder is based on the current design used to fill heat pipe modules. This concept is attractive since it is relatively simple and has already been used with the Marshall Space Flight Center (MSFC) EFF-TF glove box/fill machine. Cylinders will be constructed out of three different materials: stainless steel 316L, pure Ni, and Nb-1%Zr (the Ni cylinder serving as the baseline in ASTM C997–83). All welding processes for these cylinders shall be performed in the MSFC glove box or separate vacuum E-beam welder, if available.
The proposed sample cylinder is illustrated in figure 22. The cylinder barrel is 4 in long with a 1-in diameter made of 0.035-in-thick material. The fill stem is at least 3 in long and the V stem is 1 in long. The V wire is held in place using a small crimped plug that is TIG/E-beam welded to the lower V stem. The V wire length can be adjusted as necessary. An all-stainless-steel bellows-sealed valve (NuPro model SS-4H) is attached, using Swagelok fittings to the fill stem for filling/evacuation operations.
The cylinder is filled with a predetermined quantity of Na, using the upper fill stem and then evacuated into the 10 –7 torr range. Once evacuated, the fill stem is pressed and welded, sealing the sample. An alternate approach to crimping is E-beam welding by making a small plug to cap off the end of the fill stem. The sample cylinder/cap is placed into the E-beam welder (the cap loosely inserted in the fill stem), the welder vacuum chamber evacuated into the 10–6 torr range, and the cap is welded in place. The main issue with using the E-beam welder is that the welder is not equipped with a glove box. Atmo-spheric contamination is possible while the sample is being transferred and placed in the welder vacuum chamber. This will be a very difficult process, requiring tricky purges. This is one of the many reasons why an E-beam welder attached to the fill machine glove box is needed.
Once the sample is filled and sealed, it can be placed in the tube furnace and thermally processed at the required equilibrating temperature and time. Once equilibration is complete, the sample can be returned to the glove box where the fill stem crimp/weld is cut off. The sample cylinder is then hooked to a Cu cylinder, and the Na transferred at low temperature (just above the melting point). The Na sam-ple in the Cu cylinder can then be used for neutron activation or glow discharge mass spectroscopy test-ing to determine the O concentration. The V wire stem can then be cut and the V wire removed and sent for processing to determine O concentration.

55
Vacuum Valve UsedAfter Sodium Fill toEvacuate Sample CylinderAll Stainless Bellows Sealed Valve
Fill Stem CloseoutProcess to Sealfor Equilibration Stem Closout (Crimping Method)
Stem PressedUsing 1-in Dies
TIG Fusion Cutoffand Weld
Vanadium Wire Retaining Method
VanadiumWire
Vanadium WireRetaining Hole#60 Drill
Plug Pressed toRetain Vanadium
Wire
Plug Base Cylinder0.25 in�0.25 in
Vanadium WireHolder Plug
Vanadium WireLength = 3 in
Upper Fillstem
Welded to SampleCylinder
Basic Sample Cylinder – Total Length = 6 in – Barrel Length = 4 in – Diameter = 1 in – Stem = 0.25-in OD�0.035-in Wall – Vanadium Stem Length = 1 inMaterial – Stainless Steel 316L – Nickel – Niobium 1% Zirconium
1.5-in Stem Lengthso That it can be Cut and Drained
Lower (Vanadium)Wire Stem
Figure 22. Basic Na V wire sample cylinder.
D.2 Small Tube Furnace Design
Processing the V wire/Na samples requires heating to temperatures on the order of 700 °C with hold times ranging from tens to hundreds of hours to allow for equilibration. Accomplishing this requires a small tube furnace to hold and position the sample cylinders. Figure 23 illustrates a poten-tial setup for this furnace, which can be operated with vacuum or inert gas. Figure 24 illustrates how the sample is placed or attached to the unit. Figure 25 shows how the entire assembly can be rotated to move the Na from top to bottom of the cylinder, if necessary. The sample cylinder shown in these figures is the typical charging unit used with the fill machine to load heat pipe modules with 35 g of material. The sample cylinder geometry can be changed as needed to accommodate the V wire testing.

56
×
×
× Thermocouple Positions
Pivot Axis Allowing TubeFurnace to be RotatedUpside Down (Inverted)
Omegalux MineralHeater Cable Ratedup to 950 °C
Insulation Overwrap(1- to 2-in Insulfrax)
Sample Stem Clamp
4.5-in Conflat FlangeBoth Ends
ThermocoupleFeed-Through(Type K)Pressure TransducerConnection
Outer Tube 2.5-in ODWith 0.095-in Wall – Stainless Steel – Length = 18 in
Heater Tube 1.5-in ODWith 0.095-in Wall – Stainless Steel – Length = 12 in
Heater PowerFeed Throughs
Basic Sample Cylinder1-in OD – Length = 6 in Total – Length Barrel = 4 in
Figure 23. Sample tube furnace layout.

57
�
�12-in-LongHeated TestSection
Clamp is Placed so That theSample Cylinder is Held Againstthe Top Plate—Minimize Motion
Both Ends of Sample Cylinderare Welded Closed for Testing(Cylinder Sample is Sealed)
Sample Retaining Bracketis Screwed Into the HeaterTube Flange. Tighten Sufficientlyto Keep in Place (Not Vacuum Tight)
Basic Sample Cylinder – 1-in OD – Length = 6 in Total – Length Barrel = 4 in
Thermocouples areSpot Welded to Surfaceof Sample Cylinder (�2)
Heater Tube is Permanently MountedInside the Outer Tube Structure; theSample Cylinder Unit is LoweredInto and Tightened in Place
Figure 24. Sample cylinder inserted into heated section.
Mounting Points(Rotation Axis)
Figure 25. Furnace hardware layout with rotation axis.

58
APPENDIX E—SAMPLE HEAT PIPE CONFIGURATION FOR VANADIUM WIRE EQUILIBRATION ANALYSIS
E.1 Basic Sample Heat Pipe and Sample Cylinder Evaluation Design
Once validation of the V wire equilibration method using the basic sample cylinder is complete, the next step is to implement the process with a geometry characteristic to that of a heat pipe module. Figure 26 illustrates a concept to accomplish this task. A sample heat pipe module is welded to a sample cylinder (app. D) and then filled with the required quantity of Na. A 0.125-in rod is used to hold two V wire sampling cells—one positioned in the sample cylinder and the other in the heat pipe module. The V cell support rod is pressed into a plug, which is placed against the fill stem and welded using an E-beam welder; the welder also evacuates the module. These components can be fabricated from Ni, stainless steel 316, or Nb-1%Zr, depending on test objectives. After equilibration is completed,
Basic Sample Cylinder – Total Length = 7 in – Barrel Length = 4 in – Diameter = 1 in – Stem = 0.25-in OD�0.035-in Wall – Heat Pipe Stem Length = 1 inMaterial – Stainless Steel 316 – Nickel – Niobium 1% Zirconium
Heat Pipe Simulator – Total Length = 11 in – Barrel Length = 8 in – Fill Stem Length = 1 in – Diameter = 5/8 in – Stem = 0.25-in OD�0.035-in Wall Material – Stainless Steel 316 – Nickel – Niobium 1% Zirconium
Fill Stem Closeout – Valve Removed – Placed in Evacuated Welder
Vacuum Valve Usedto Transfer SodiumModule
Vanadium Wire SupportPlug Welded to SampleCylinder
Sample CylinderVanadium Wire Cell
Heat Pipe ModuleVanadium Wire Cell
Wick Structure
Evaporator Plug
Vanadium Wire Holding Cell
Support Wire0.125-in DiameterFlattened at Attached Point to 0.0625-in Thick
Vanadium WireRetaining Holes0.028 to 0.046 in(#70 or #56 Drill)
Vanadium Wire �2 per Cell Typical1- to 2-in Length
Vanadium Wire is Benton Ends to Hold it inPlace on Support Wire
Support Wire Holding Method
Plug Base Cylinder0.25 in�0.25 inPressure to HoldSupport Wire
Retaining Hole0.128-in Diameter(#30 Drill)
Support Wire0.125-in Diameter
Welded Joint ConnectingSample Cylinder to Module
Figure 26. Heat pipe module/sample cylinder V wire equilibration setup.

59
• The Na can be repositioned such that it fills the sample cylinder and condenser end of the module. The sample cylinder can be severed from the module near the weld joint for evaluation while a plug
is welded on the module to cap it. One of the V wire cells is extracted while the other remains in the module.
• The Na could also be positioned to the evaporator end of the module and the sample cylinder severed near the weld joint, allowing both V wire cells to be removed for evaluation.

60
APPENDIX F—BASIC MATERIAL CLEANING PROCEDURE FOR SAMPLING COMPONENTS
The sample cylinders, sample heat pipe modules, support wires, and other components that are used in assembling the evaluation hardware must be cleaned prior to exposure to purified Na. Sections F.1 and F.2 outline the basic approach to clean stainless steel and Nb components.
F.1 Stainless Steel Cleaning Procedure
This procedure applies to austenitic stainless steel in the as-milled condition. It may be used for screen and wire cloth for heat pipes, tubing, plate, and other forms of material that, although machined in part, contain surfaces in the as-milled condition. The term “wash” constitutes full immersion in fluid: (1) Wash part in Freon™ trifluoroethane (TF) in an ultrasonic cleaner for at least 5 min to remove all signs of grease.
(2) Wash part in ultrasonic cleaner containing a caustic solution consisting of 11 parts (by volume) deionized water, 1 part sodium hydroxide, and 1 part hydrogen peroxide for up to 5 min.
(3) Wash part in hot deionized water for at least 5 min.
(4) Repeat steps (2) and (3) three times.
(5) Wash part in hot deionized water in ultrasonic cleaner for at least 5 min.
(6) Wash part in C2H5OH in ultrasonic cleaner for at least 5 min.
(7) Proceed to vacuum bakeout; establish a pressure of 10–6 torr and a temperature 50 °C over the maximum operating temperature, bakeout for a minimum of 3 hr.
F.2 Niobium 1% Zirconium Cleaning Procedure
This procedure may be used for screen and wire cloth for heat pipes, tubing, plate, and other forms of material that although machined in part, contain surfaces in the as-milled condition.
(1) Wash part in Freon TF in an ultrasonic cleaner for at least 5 min to remove all signs of grease. (2) Rapidly dunk part (initially for 5 s) in cleaning solution consisting of two parts (by volume) HNO3, two parts deionized water, and one part hydrofluoric acid. Part should be immersed long enough to thoroughly remove scale, but not long enough to remove measurable amounts of material from the part.

61
(3) Flush part in hot deionized water.
(4) Rinse part in hot deionized water in ultrasonic cleaner for at least 5 min.
(5) Rinse part in C2H5OH in ultrasonic cleaner for at least 5 min.
(6) Proceed to vacuum bakeout; establish a pressure of 10–8 torr and a temperature 50 °C over the maximum operating temperature, bakeout for a minimum of 3 hr.

62
REFERENCES
1. Schmidt, G.L.: “Snap 10a Test Program,” DCN: SP–100–XT–002, Air Force Systems Command—Kirtland Air Force Base, Albuquerque, NM, September 1988.
2. Aberdam, M.; Claxton, K.; and Gros, G.: “Liquid Metal Cooled Reactors—Coolant Purification,” Chemical Engineering Progress, Vol. 47, No. 2, p. 74–82, February 1966.
3. Acton, R.U.; Weatherbee, R.L.; and Smith, L.A.: Sandia Sodium Purification Loop Description and Operations Manual, August 1985.
4. Hunter, R.A.; and Ballif, J.L.: “Purity Requirements and Control With Certain Impurity Levels,” Paper presented at IAEA-IWFRA-Specialists Meeting, Cadarache, France, November 14–17, 1972.
5. Gadeken, D.; and Plummer, K.C.: “SEFOR Cold Trap Experience,” GEP–10548, General Electric Co, Sunnyvale, CA, April 1972.
6. Pekinpaugh, L.; and Hess, J.W.: “Forced Circulation Cold Trap Assemblies for Removal of Sodium Impurities From FFTF and HTSF,” Specification HWS–1147, Rev. 1, Westinghouse Hanford Com-pany, Hanford, WA, May 1972.
7. Addison, C.C.: The Chemistry of the Liquid Alkali Metals, John Wiley and Sons, New York, pp. 269–292, 1984.
8. Berry, W.E.: Corrosion in Nuclear Applications, John Wiley and Sons, New York, pp. 237–307, 1971.
9. Borgstedt, H.U.; and Mathews, C.K.: Applied Chemistry of the Alkali Metals, Plenum Press, New York, pp. 191–225, 1987.
10. Hoffman, E.E.: and Harrison, R.W.: “The Compatibility of Refractory Metals With Liquid Metals,” in Refractory Metal Alloys Metallurgy and Technology, I. Machlin (ed.), Plenum Press, New York, pp. 251–287, 1968.
11. King, J.C.; and El-Genk, M.S.: “Review of Refractory Materials for Alkali Metal Thermal- to-Electric Conversion Cells,” J. Propulsion Power, Vol. 17, p. 547, 2001.
12. Kovacina, T.A.; and Miller, R.R.: “The Solubility of Columbium-1% Zirconium in Sodium by Activation Analysis,” NRL–6051, Naval Research Laboratory, Washington, DC, 1964.
13. Chase, M.W.; Davies, C.A.; and Downey, J.R.: JANAF Thermochemical Tables, American Chemical Society and American Institute of Physics, New York, 1985.

63
14. Natesan, K.: “Influence of Nonmetallic Elements on the Compatibility of Structural Materials With Liquid Alkali Metals,” J. Nucl. Mater., Vol. 115, p. 251, 1983.
15. DiStefano, J.R.; and Litman, A.P.: “Effects of Impurities in Some Refractory Metal-Alkali Metal Systems,” Nace Corrosion, Vol. 20, p. 392t, 1964.
16. Perkins, R.A.; and Padgett, R.A.: “Oxygen Diffusion in Niobium and Nb-Zr Alloys,” Acta Metall., Vol. 25, p. 1221, 1977.
17. Romano, A.J.; Fleitman, R.A.; and Klamut, C.: “Behavior of Refractory Metals and Alloys in Boil-ing Sodium and Other Boiling Alkali Metals,” Proc. Symposium on Alkali Metal Coolants, IAEA, Vienna, 1966.
18. Romano, J.; and Klamut, C.J.: “Corrosion of Oxygen-Contaminated Nb-1%Zr and Ta-8w-2hf Alloys by Reflux-Boiling Sodium at 1095 °C,” 14th Annual Meeting, Trans. Am. Nucl. Soc., Toronto,
Canada, 1968.
19. ASTM International, “Standard Practice for Liquid Sodium Corrosion Testing of Metals and Alloys,” ASTM G 68–80, ASTM International, West Conshohocken, PA, 1980.
20. DiStefano, J.R.: “Review of Alkali Metal and Refractory Alloy Compatibility for Rankine Cycle Applications,” J. Mater. Eng., Vol. 11, p. 215, 1989.
21. Hoffman, E.E.; Devan, J.H.; and Distefano, J.R.: “Compatibility of Refractory Metals and Alloys With Alkali Metals,” Proc. TMS Annual Meeting, Minerals, Metals, and Materials Soc., Denver, CO, pp. 137–182, 1993.
22. Lundberg, L.B.: “Alkali Heat Pipe Corrosion Phenomena,” Proc. VI Int. Heat Pipe Conf., Paper 1.3.43, Grenoble, France, pp. 280–284, 1987.
23. Lundberg, L.B.; and Feber, R.C.: “Corrosion in Alkali Metal/Molybdenum Heat Pipes,” AIAA 19th Thermophysics Conf., Paper AIAA–84–1722, Snowmass, CO, pp. 1–12, 1984. 24. Feber, R.C.; and Merrigan, M.A.: “Thermochemical Modeling of Mass Transport in High- Temperature Heat Pipes,” Proc. VI Int. Heat Pipe Conf., Paper 1.3.49, Grenoble, France,
pp. 308–313, 1987.
25. Devan, J.H.; Litman, A.P.; Distefano, J.R.; and Sessions, C.E.: “Lithium and Potassium Corrosion Studies With Refractory Metals,” Proc. Symposium on Alkali Metal Coolants, IAEA, Vienna, pp. 675–697, 1966.
26. Glass, D.E.; Merrigan, M.A.; and Sena, J.T.; and Camarda, C.J.: “Startup and Transient Perfor-mance of a Nb-1%Zr Potassium Heat Pipe,” J. Thermophysics Heat Transfer, Vol. 13, p. 153, 1999.

64
27. Sena, J.T.; and Merrigan, M.A.: “Niobium 1% Zirconium Potassium and Titanium Potassium Life-Test Heat Pipe Design And Testing,” Proc. Seventh Symposium on Space Nuclear Power and Propulsion, Albuquerque, NM, Vol. 1, pp. 848–853, 1990.
28. Devan, J.H.; DiStefano, J.R.; and Hoffman, E.E.: “Compatibility of Refractory Alloys With Space Reactor System Coolants and Working Fluids,” Proc. Symposium on Refractory Alloy Technology for Space Nuclear Power Applications, CONF–8308130, Oak Ridge National Laboratory, pp. 34–85, 1984.
29. Merrigan, M.A.; Keddy, E.S.; and Sena, J.T.: “Transient Performance of a Space Power System Heat Pipe,” Proc. AIAA/ASME Fourth Joint Thermophysics and Heat Transfer Conf., Paper AIAA–86–1273, Boston, MA, June 2–4, 1986.
30. Merrigan, M.A.; Runyan, J.E.; Martinez, H.E.; and Keddy, E.S.: “Development and Test of a Space Reactor Core Heat Pipe,” AIAA 18th Thermophysics Conf., Paper AIAA–83–1530, Montreal, Can-ada, June 1–3, 1983.
31. Reid, R.S.; Sena, J.T.; and Merrigan, M.A.: “Transient Tests of a Molybdenum-Lithium Heat Pipe,” Proc. 11th International Heat Pipe Conf., Tokyo, Japan, Vol. 1, pp. 238–243, September 12–16, 1999.
32. ASTM International, “Standard Specification for Niobium and Niobium Alloy Ingots,” ASTM B 391–03, ASTM International, West Conshohocken, PA, 2003.
33. ASTM International, “Standard Specification for Niobium And Niobium Alloy Bar, Rod, and Wire,” ASTM B 392–99, ASTM International, West Conshohocken, PA, 1999.
34. ASTM International, “Standard Specification for Niobium and Niobium Alloy Strip, Sheet, and Plate,” ASTM B 393–99, ASTM International, West Conshohocken, PA, 1999.
35. ASTM International, “Standard Specification For Niobium And Niobium Alloy Seamless and Welded Tubes,” ASTM B 394–99, ASTM International, West Conshohocken, PA, 1999.
36. American Society for Metals, Metals Handbook, Vol. 6, ASM, Metals Park, OH, p. 294, 1971.
37. Lessmann, G.G.: “Welding of Refractory Alloys,” Proc. Symposium on Refractory Alloy Technology for Space Nuclear Power Applications, CONF–8308130, pp. 146–167, 1984.
38. Kim, Y.H.; Suzuki, R.O.; Numakura, H.; et al.: “Removal of Oxygen and Nitrogen From Niobium by External Gettering,” J. Alloys Compounds, Vol. 248, p. 251, 1997.
39. Wurm, J.: “Process for De-Oxidation of Refractory Metals,” U.S. Patent 4,126,493, November 21, 1978.
40. Fisher, R.L.: “Deoxidation of a Refractory Metal,” U.S. Patent 5,022,935, June 11, 1991.

65
41. Lundberg, L.B.; and Martinez, H.E.: “Fabrication of High-Temperature (1400–1700 K) Molybde-num Heat Pipes,” Proc. 15th Intersociety Energy Conversion Engineering Conf., Seattle, WA, pp. 753–761, 1980.
42. ASTM International, “Standard Specification for Sodium as a Coolant For Liquid Metal-Cooled Reactors,” ASTM C 1051–85, ASTM International, West Conshohocken, PA, Reapproved 1994.
43. Centnerszwer, M.; and Blumental, M.: “Peroxyde Der Alkalimetalle,” Bull. Int. Acad. Polon. Sci., Vol. A1933, p. 499, 1933.
44. ASTM International, “Standard Test Methods for Chemical and Instrumental Analysis of Nuclear-Grade Sodium and Cover Gas,” ASTM C 997–83, ASTM International, West Conshohocken, PA, Reapproved 1993.
45. Smith, D.L.; and Lee, R.H.: “Characterization of the Vanadium-Wire Equilibration Method for Measurement of Oxygen Activity in Liquid Sodium,” ANL–7891, Argonne National Laboratories
Report, 1972.
46. Lewis, E.E.: Introduction to Reliability Engineering, John Wiley and Sons, New York, 1996.
47. Reid, R.S.: “Safe Alkali Metal Heat Pipe Reliability,” Proc. Space Technology and Applications International Forum (STAIF 2003), Albuquerque, NM, Vol. 651, pp. 114–121, 2003.

66
REPORT DOCUMENTATION PAGE Form Approved
OMB No. 0704-0188
Public reporting burden for this collection of information is estimated to average 1 hour per response, including the time for reviewing instructions, searching existing data sources, gathering and maintain-ing the data needed, and completing and reviewing the collection of information. Send comments regarding this burden estimate or any other aspect of this collection of information, including suggestions for reducing this burden, to Washington Headquarters Services, Directorate for Information Operation and Reports, 1215 Jefferson Davis Highway, Suite 1204, Arlington, VA 22202-4302, and to the Office of Management and Budget, Paperwork Reduction Project (0704-0188), Washington, DC 20503
1. AGENCY USE ONLY (Leave Blank) 2. REPORT DATE 3. REPORT TYPE AND DATES COVERED
4. TITLE AND SUBTITLE 5. FUNDING NUMBERS
6. AUTHORS
7. PERFORMING ORGANIZATION NAME(S) AND ADDRESS(ES) 8. PERFORMING ORGANIZATION REPORT NUMBER
9. SPONSORING/MONITORING AGENCY NAME(S) AND ADDRESS(ES) 10. SPONSORING/MONITORING AGENCY REPO NUMBER
11. SUPPLEMENTARY NOTES
12a. DISTRIBUTION/AVAILABILITY STATEMENT 12b. DISTRIBUTION CODE
13. ABSTRACT (Maximum 200 words)
14. SUBJECT TERMS 15. NUMBER OF PAGES
16. PRICE CODE
17. SECURITY CLASSIFICATION OF REPORT
18. SECURITY CLASSIFICATION OF THIS PAGE
19. SECURITY CLASSIFICATION OF ABSTRACT
20. LIMITATION OF ABSTRACT
NSN 7540-01-280-5500 Standard Form 298 (Rev. 2-89)Prescribed by ANSI Std. 239-18298-102
Unclassified Unclassified Unclassified Unlimited
Method for Determination of <5 ppm Oxygen in Sodium Samples
R.S. Reid, J.J. Martin, and G.L. Schmidt*
George C. Marshall Space Flight CenterMarshall Space Flight Center, AL 35812
National Aeronautics and Space AdministrationWashington, DC 20546–0001
Prepared by the Propulsion Research Center, Space Transportation Directorate*New Mexico Institute of Mining and Technology, 901 University Blvd. SE, Albuquerque, NM 87106
Unclassified-UnlimitedSubject Category 20Availability: NASA CASI 301–621–0390
Alkali metals used in pumped loops or heat pipes must be sufficiently free of nonmetallic impuri-ties to ensure long heat rejection system life. Life issues are well established for alkali metal sys-tems. Impurities can form ternary compounds between the container and working fluid, leading to corrosion. This Technical Memorandum discusses the consequences of impurities and candidate measurement techniques to determine whether impurities have been reduced to sufficiently low levels within a single-phase liquid metal loop or a closed two-phase heat transfer system, such as a heat pipe. These techniques include the vanadium wire equilibration, neutron activation analy-sis, plug traps, distillation, and chemical analysis. Conceptual procedures for performing vana-dium wire equilibration purity measurements on sodium contained in a heat pipe are discussed in detail.
80
M–1140
Technical MemorandumJuly 2005
NASA/TM—2005–213902
alkali metals, sodium, purity requirements, long-life heat pipes, refractory metals, corrosion, fission power systems, purity testing techniques


National Aeronautics andSpace AdministrationIS04George C. Marshall Space Flight CenterMarshall Space Flight Center, Alabama35812