Embed Size (px)
Citation preview

No. 348LEGISLATIVE ASSEMBLY OF THE NORTHERN TERRITORY
WRITTEN QUESTION
Mrs Lambley to the Minister for Children and Families, in relation to the portfolio areas within the Department of Children and Families
Department of Children and Families
HR Questions:
1. What is the NTG FTE Cap for your Agency?
Answer: 628.5
2. At Pay day 20, 28 March 2012, what is the current FTE staffing of the department, by level?
Answer: 682.93
Classification Code TotalAO2 17.7AO3 85.6AO4 74.22AO5 33.29AO6 70.29AO7 57.13
AQF3A 1BM 0
COMPO 0EO1C 8.9EO2 2
EO2C 8.5EO3C 1EO5C 1
N5 0.8P1 44.64P2 87.21P3 68.84
PH3 1.9PH4 21.47
PH4R 6.7SAO1 20.7SAO2 18.6SP1 40.94SP2 9.7SSC 0.8Total 682.93
3. Is this figure in line with the NTG FTE Cap?

- If not, please explain
Yes
4. At Pay day 20, 28 March 2012, how many funded permanent positions are
there in your department?
Answer: 771 positions
5. At Pay day 20, 28 March 2012, how many of these positions were nominally filled and how many were filled by persons acting in positions or are temporary appointments?
- Please separate by permanent/temporary/acting by level
Answer: 359 positions are permanently filled, and 319 positions are temporarily filled as follows:
Classification # of Perm Staff # of Temp Acting StaffAO2 14 3AO3 38 68AO4 45 35AO5 14 16AO6 44 27AO7 21 24EO1C -- 4EO2C -- 8EO3C -- 1EO5C -- 1N5 1 1P1 26 12P2 67 52P3 40 33PH4R 4 7SAO1 15 8SAO2 4 5SP1 20 13SP2 5 1SSC 1 --Total 359 319
6. In the period 01 July 2011 to 31 March 2012, what was the turnover rate of staff in the Agency?
Answer: 19%
7. What is the rate per level?
Classification Code TotalAO1 N/AAO2 17%AO3 20%AO4 17%AO5 20%

AO6 14%AO7 9%AQF3A 154%BM N/ACOMPO N/AEO1C 84%EO2 0%EO2C 14%EO3C 0%EO5C 0%ICS N/AN3 0%N5 0%P1 28%P2 22%P3 11%PH3 49%PH4 17%PH4R 0%SAO1 22%SAO2 19%SP1 11%SP2 36%SSC 0%THSMO N/ATOTAL 19%
8. At Pay day 20, 28 March 2012, how many funded positions are vacant in the Agency?
Answer: 319
9. How long, in total days, have funded positions been vacant since 01 July 2011?
Answer: 241 positions have been nominally and actually vacant for the period 1 July 2011 – 31 March 2012. This represents a vacancy of approx 9 months per position.
10.At Pay day 20, 28 March 2012, how many staff are currently employed on a temporary contract?
Answer: 389 – Please note: 136 staff are currently employed in Australian Government funded programs which are temporarily funded.
11. In the period 01 July 2011 to 31 March 2012, how many temporary contracts have been extended, broken down by level and the number of times extended?

Answer: 229 – see detail provided in the table
Classification ExtendedOnce Ext. X2 Ext. X3 Ext. X4 Total
AO2 7 2 - - 9
AO3 27 4 1 1 33
AO4 18 7 - - 25
AO5 7 2 1 - 10
AO6 13 6 2 - 21
AO7 10 3 - - 13
EO2 - 1 - - 1
N3 1 - - - 1
N5 1 - - - 1
P1 7 - 1 - 8
P2 13 3 - - 16
P3 7 5 1 - 13
PH3 14 - - - 14
PH4 15 18 12 - 45
PO2 1 - - - 1
PO3 1 - - - 1
SAO1 3 2 - - 5
SAO2 5 1 - 1 7
SP1 2 - 1 - 3
SP2 1 1 - - 2
TOTALS 153 55 19 2 229
12. In the period 01 July 2011 to 31 March 2012, how many positions have been advertised by “expression of interest”?
Answer: 121 positions have been advertised by EOI.
13.At 31 March 2012, In relation to all vacant positions, what is the breakdown of recruitment actions by:
- Selection process commenced and- Selection process (including position advertising) not commenced
Answer: 294 selection processes had commenced, or were active as at 31 March 2012. All selection processes where there is a known vacancy for a funded position are at varying stages of recruitment or review.
25 positions have not commenced selection processes.
14. In the period 01 July 2011 to 31 March 2012, per position level, what is the average length of time taken for recruitment from advertising to successful applicant?
Answer: 56.38 days
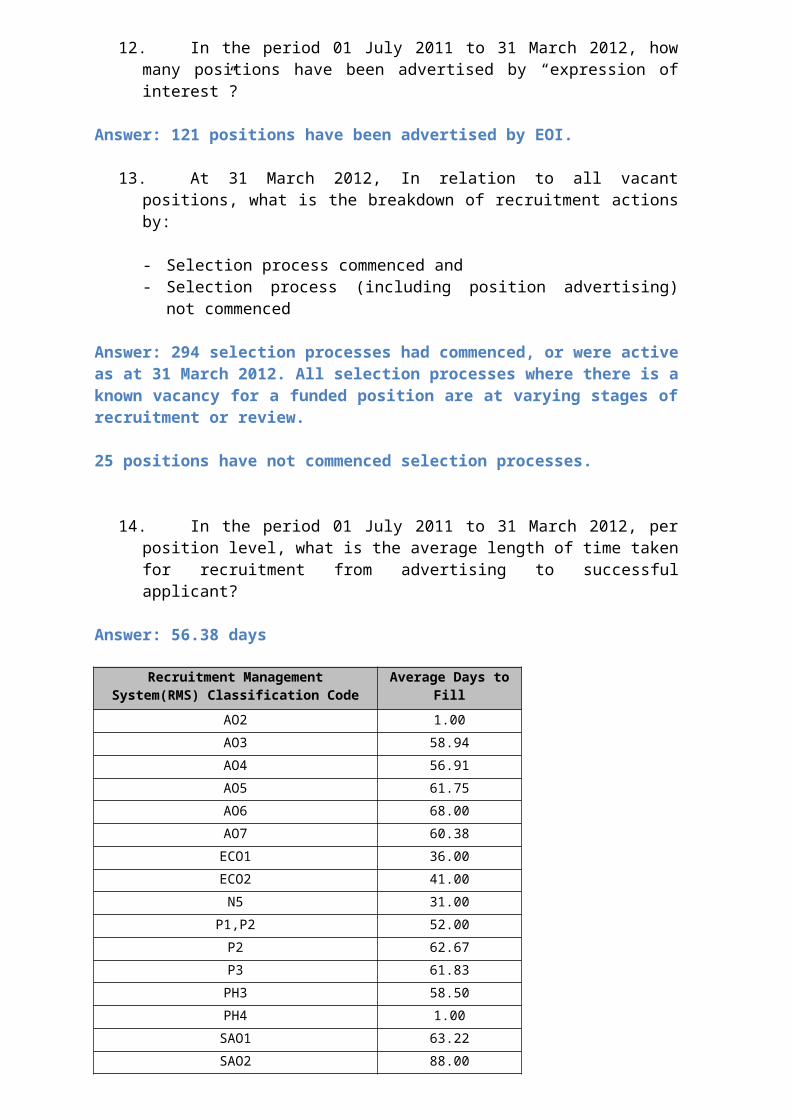
Recruitment Management System(RMS) Classification Code
Average Days to Fill
AO2 1.00
AO3 58.94
AO4 56.91
AO5 61.75
AO6 68.00
AO7 60.38
ECO1 36.00
ECO2 41.00
N5 31.00
P1,P2 52.00
P2 62.67
P3 61.83
PH3 58.50
PH4 1.00
SAO1 63.22
SAO2 88.00
SAO2,ECO1 61.00
SP1 62.25
SP2 46.00
Total Department of Children & Families 56.38
15. In the period 01 July 2011 to 31 March 2012, what is the number of positions that have been filled by the recruitment of an existing public servant, and how many from the general public?
Answer: 79
NTG Non NTG Not Advised Total
79 32 83 194

16. In the period 01 July 2011 to 31 March 2012, how many positions have been reclassified in the department? What are the level of those positions?
Answer: Reclassified positions: 32
17.At Pay day 20, 28 March 2012, how many permanent supernumerary unattached employees do you have in your agency? What levels are they?
Answer: 23
Number of
Staff
Classification
2 AO33 AO52 AO62 AO74 P16 P24 P3
18. In the period 01 July 2011 to 31 March 2012, how many unattached employees have successfully gained nominal positions within the Agency or gained employment in another Agency?
Answer: 19.
19. In the period 01 July 2011 to 31 March 2012, how many unattached employees resigned?
Answer: 13
20.At Pay day 20, 28 March 2012, what is the average length of stay of staff in the department? Please break this down by position level.

Please note: the maximum length of service for staff in DCF (as it commenced from 1 January 2011) is 1.25 years.
21. In the period 01 July 2011 to 31 March 2012, how much has been spent to date on advertising employee positions, and can you provide a breakdown of these costs?
Answer: $106,586
22. In relation to Apprentices and Graduates, who commenced during the 2011 calendar year:
- How many graduates started with the department2 x Apprentices commenced
- How many have completed the year1
- How many how won nominal positions0
- How many have left the NTG, and 1
- What was the length of time each stayed within the NTG before leaving?5 months
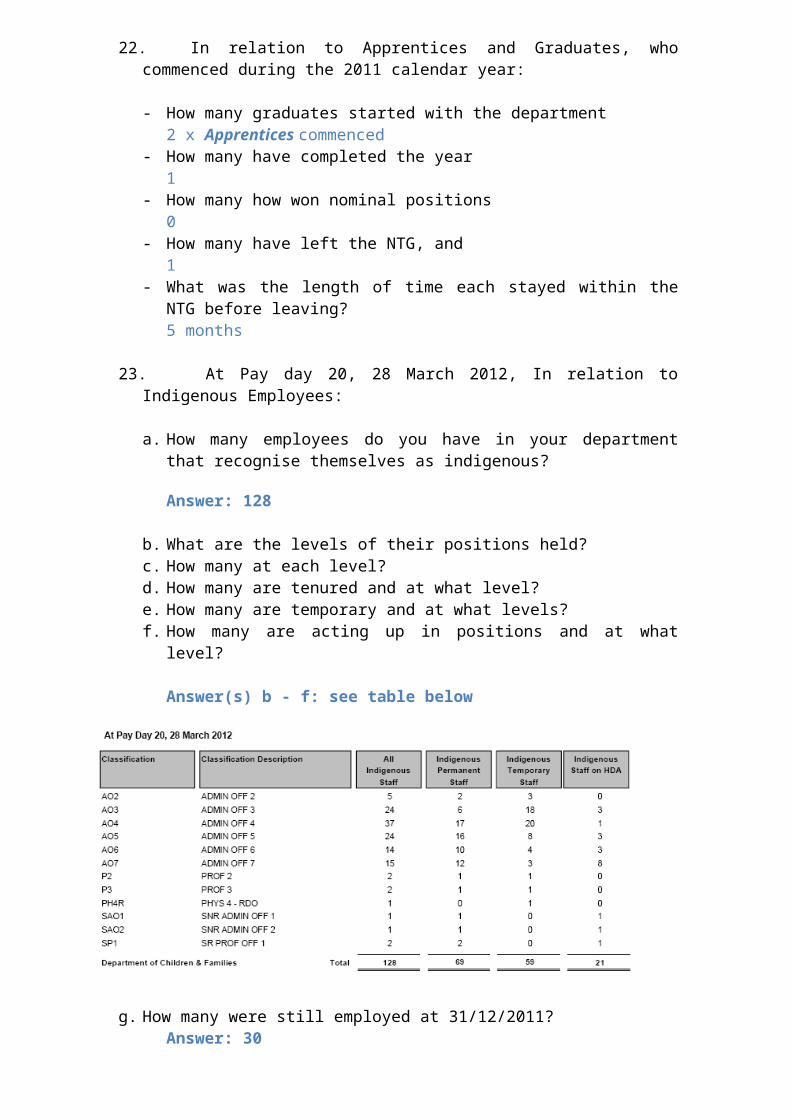
23. At Pay day 20, 28 March 2012, In relation to Indigenous Employees:

a. How many employees do you have in your department that recognise themselves as indigenous?
Answer: 128
b. What are the levels of their positions held? c. How many at each level?d. How many are tenured and at what level?e. How many are temporary and at what levels?f. How many are acting up in positions and at what level?
Answer(s) b - f: see table below
g. How many were still employed at 31/12/2011?Answer: 30
h. How many have left the NTG?Answer: 8 employees have left the Department of Children and Familes.
24. In relation to NTPS staff as at 31 March 2012:
a. What is the total amount of accrued leave in the department, broken down by level, long service leave and recreation leave
Answer: See table in Q24c
b. What is the financial value of that leave?Answer: $10,547,567.18
c. What is the highest individual amount of accrued leave at each position level?
Classification
Accrued Long Service Leave
(Months)
Staff Accrued Long Service
Leave ($Value)
Highest Individual Amount
Accrued LSL (Months)
Staff Accrued Recreation
Leave (Days)
Staff Accrued Recreation
Leave ($Value)
Highest Individual Amount
Accrued Rec (Days)
AO2 10.87 $43,630.50 2.63 323.69 $58,296.28 76.00
AO3 83.76 $325,293.24 8.70 1,997.32 $377,603.89 106.50
AO4 59.95 $287,183.27 3.55 2,116.36 $464,191.12 124.00
AO5 37.55 $206,632.28 2.82 842.06 $218,430.88 63.36
AO6 104.03 $649,218.36 5.12 2,328.34 $683,763.62 103.50
AO7 98.50 $662,899.47 12.75 2,281.48 $741,446.34 106.50
AQF3A 0.17 $307.57 0.17 14.45 $1,168.80 14.45
EO2 2.70 $25,564.57 2.40 59.30 $28,235.08 31.99
N5 0.15 $535.70 0.10 4.50 $1,584.43 4.50
P1 12.98 $71,971.69 1.37 665.00 $168,082.18 56.96
P2 53.46 $356,231.67 4.47 1,493.20 $468,146.65 115.00
P3 63.99 $457,881.54 4.45 2,095.05 $728,919.85 127.50
PH4 0.60 $2,287.50 0.25 49.08 $8,281.89 14.57
PH4R 1.92 $7,135.95 0.42 65.77 $11,106.71 27.22
SAO1 44.27 $347,776.94 4.49 948.95 $360,264.58 103.12
SAO2 44.37 $385,724.62 5.43 687.27 $289,642.28 88.50
SP1 63.59 $507,515.47 4.00 1,552.07 $599,083.89 96.21
SP2 21.87 $200,526.70 5.45 356.87 $156,882.80 71.50
SSC 1.20 $16,647.30 1.20 37.58 $29,980.26 37.58
TOTAL 705.93 4,554,964.34 69.77 17,918.34 5,395,111.53 1,368.97
d. What is the current total of sick leave entitlement of employees in the department?
Answer: 4183.66 weeks

e. How many days sick leave were taken between 01 July 2011 and 31 March 2012, at each employee level?
Answer: 4123.77 days – refer table below
25. In relation to Contract (ECO1 and above) staff as of 31 March 2012:
a. What is the total amount of accrued leave in the department, broken down by level, long service leave and recreation leave?
Classification Contract Staff Accrued Long Service Leave
(Months)
Contract Staff Accrued
Recreation Leave (Days)
EO1C 7.48 193.81
EO2C 10.44 185.71
EO3C 0.32 2.61
EO5C 0.62 22.73
Exec TOTAL 18.86 404.86
b. What is the financial value of that leave?

Answer: $597,491.31
c. What is the highest individual amount of accrued leave at each employee level?
Classification
Highest Individual Amount of Long Service Leave Accrued
(Months)
Highest Individual Amount of Recreation Leave Accrued
(Days)
EO1C 2.52 75.69
EO2C 2.50 39.89
EO3C 0.32 2.61
EO5C 0.62 22.73
Exec TOTAL 5.96 140.93
d. What is the current total of sick leave entitlement of employees in the department?
Answer: 218.57 weeks
e. How many days sick leave were taken between 01 July 2011 and 31 March 2012, at each employee level?
Answer: 50.15 days (approx 10 weeks) – refer to table 24.e
26. In the period 01 July 2011 to 31 March 2012, how many employees have utilised section 52.8 Cash-out of Leave – (Recreation Leave), under the NTPS 2010-2013 Enterprise Agreement?f. Break down by level and amount of leave
Answer: 18 x Employees cashed out leave
LevelAmount of Leave Days cashed out
AO3 14
AO4 26
AO5 40
AO6 10
AO7 38
SAO1 30
SAO2 50
P1 10
P2 10
P3 30
SP1 10
SP2 30
TOTAL 298
27. In the period 01 July 2011 to 31 March 2012, how many employees have utilised section 55.3 (b) Long Service Leave cash out of 10 years, under the NTPS 2010-2013 Enterprise Agreement?a. Break down by level and amount of leave

Answer: 1 x AO3 cashed out 3 months
28.During the period 01 July 2011 to 31 March 2012, did the CEO direct any employee under section 52.7 Excess Leave of the NTPS 2010-2013 Enterprise Agreement to take leave?a. Break down by level and the amount of leave taken
Answer: No
29.During the period 01 July 2011 to 31 March 2012, did the CEO direct any employee under section 55.3 (a) Long Service Leave to take leave?a. Break down by level and the amount of leave
Answer: No
30.At Pay day 20, 28 March 2012, how many workers were on workers compensation? At what level and is there an expected return date?
Answer: 8 – see details below. Expected return dates vary according to the nature of the injury, therefore specific return dates cannot be provided, however it is expected that 4 of the identified 8 people on workers compensation will return to work.
31.From 01 July 2011 to 31 March 2012, how many people received workers compensation, at what position level and geographic location and how long for each person?
Answer: 8. The breakdown of data any further has the potential to identify individuals and on that basis cannot be provided for reasons of privacy.

32.At Pay day 20, 28 March 2012, how many workers were on sick leave or extended leave (excluding recreation leave), longer than 3 weeks, at what level, and for what reason?
Answer: 29
Classification Leave TypeAO2 LWOP
AO3 LWOP
AO4 LWOP
AO4 LWOP
AO5 Mat Leave 3yrs W/Out Pay
AO6 LWOP
AO6 LWOP
AO6 LWOP
AO6 Mat Leave 1yr W/O Pay
AO7 Long Service Leave
AO7 Mat Leave Mand Half NTCAS
AO7 Parental 6yr W/O Pay
AO7 LWOP
EO2C Mat Leave 1yr W/O Pay
EO2C LWOP
P1 Parental 6yr W/O Pay
P2 Mat Leave Mand Half NTCAS
P2 LWOP
P2 Parental 6yr W/O Pay
P3 Compensation Leave
P3 LWOP
P3 Mat Leave 3yrs W/Out Pay
P3 Sick Leave
PH4R Mat Leave 3yrs W/Out Pay
SAO1 Mat Leave 3yrs W/Out Pay
SAO2 Mat Leave Mand Half NTCAS
SP1 LWOP
SP1 LWOP
SP2 Long Service Leave

33.At Pay day 20, 28 March 2012, were there any NTPS public servants who were employed in the 80’s and eligible for return flight to Adelaide every 2 years? How many and at what level?
Answer: 10
34.How many complaints have been made in the Department in relation to workplace bullying and harassment?
Answer: 6
In relation to each output group within the Department
35.From 01 July 2011 to 31 March 2012, how much has been spent on relocation cost for commencement of employment and either completion or termination of employment (removalists, airfares, accommodation and allowances) in the Department.
Answer: $821,000
36.Please provide a breakdown per business unit.
Answer: The expenditure is attributed to recruitment of child protection workforce and are recorded against the central cost centre.
37.How much is budgeted for relocation and other appointment and termination expenses in 2011/12.
Answer: $1.1 million

38.How much was spent on travel from 01 July 2011 to 31 March 2012, broken down by intrastate, interstate and international fares, accommodation and other expenses?
Answer:Below is a breakdown of travel (staff expenses) from July 2011 to March 2012:
Travelling Allowance 31 March 2012
Intra Territory $430,155
Interstate $32,162
International $5,986
Accommodation 31 March 2012
Intra Territory $528,217
Interstate $42,698
International $11,000
39.How much was spent on vehicles by the Department from 01 July 2011 to 31 March 2012?
Answer: $2,081,705
40.How many vehicles does the Department have responsibility for?
Answer: 135
41.What is the change, if any, in these vehicle numbers from the previous year?
Answer: An increase of 37 vehicles
42.What proportion of those vehicles meet the emission standard of 5.5 out of 10 under the Commonwealth Government’s Green Vehicle Guide?
Answer: 100%
43.How many vehicles are home garaged?
Answer: 33
Type of Fares(Air, bus, train)
31 March 2012
Intra Territory $760,447
Interstate $176,853
International $3,961
Air, bus, boat charter $723,195

44.What position levels have vehicles attached or are allowed to home garage?
Answer: Employees below the level of Senior Administration Officer 2 or equivalent are not permitted to home-garage a departmental vehicle on a permanent basis, unless it is for on-call purposes or departmental duties require the employee to home-garage a vehicle on a permanent basis.
45.How many credit cards have been issued to department staff?
Answer:84 DCF employees 8 DOH employees that have DCF credit cards for shared services transactions ie travel and phone expenses
46.How many repayment transactions (and the value) for personal items and services are outstanding?
Answer: 0
47.How many reports of the improper use of Information Technology have been made?
Answer: 0
48.How many reports resulted in formal disciplinary action?
Answer: 0
49.How many staff are considered ‘Essential’ in your Agency, for the purposes of an Emergency eg- Cyclone
g. Break down by level
Answer:The determination of essential personnel in any disaster event is dependent on the level of threat and likely impact of a specific disaster event in a particular locality. A survey of agency personnel identifies there are 112 positions that are likely to be essential in a disaster situation.
Marketing:
50.From 01 July 2011 to 31 March 2012, how much was spent by the Department on advertising and marketing programs?
Answer: $446,008.

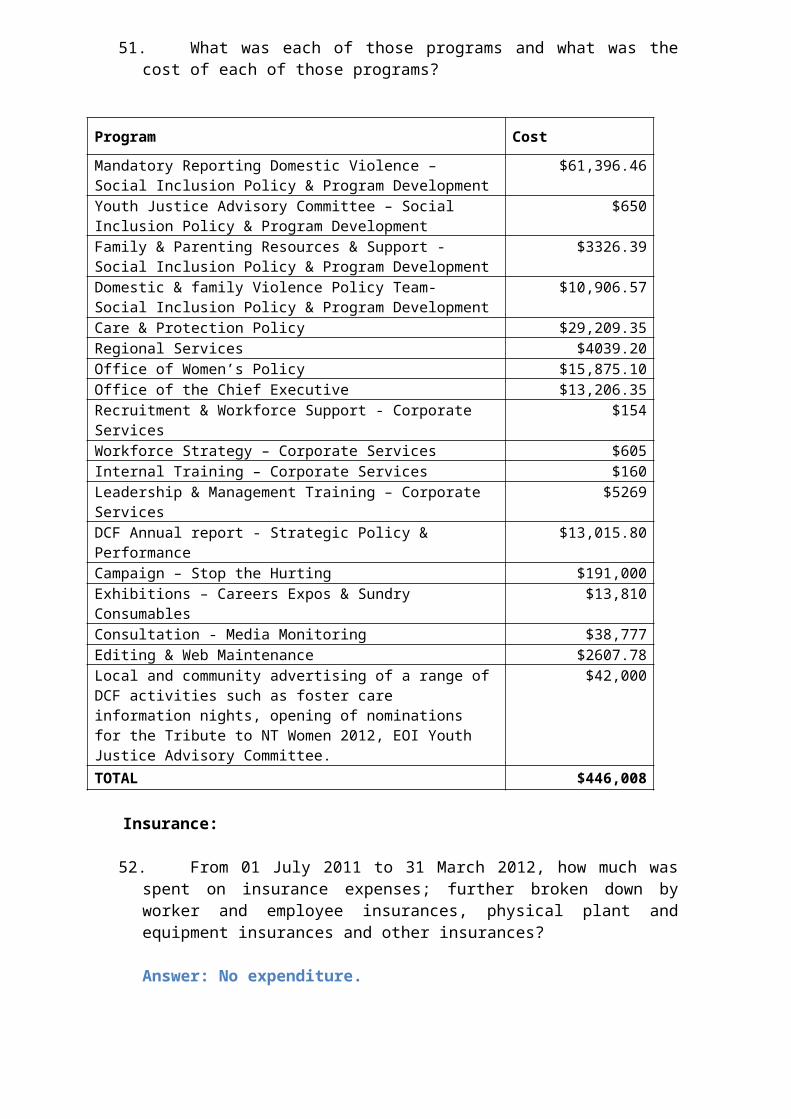
51.What was each of those programs and what was the cost of each of those programs?
Program Cost
Mandatory Reporting Domestic Violence – Social Inclusion Policy & Program Development
$61,396.46
Youth Justice Advisory Committee – Social Inclusion Policy & Program Development
$650
Family & Parenting Resources & Support - Social Inclusion Policy & Program Development
$3326.39
Domestic & family Violence Policy Team- Social Inclusion Policy & Program Development
$10,906.57
Care & Protection Policy $29,209.35Regional Services $4039.20Office of Women’s Policy $15,875.10Office of the Chief Executive $13,206.35Recruitment & Workforce Support - Corporate Services $154Workforce Strategy – Corporate Services $605Internal Training – Corporate Services $160Leadership & Management Training – Corporate Services $5269DCF Annual report - Strategic Policy & Performance $13,015.80Campaign – Stop the Hurting $191,000Exhibitions – Careers Expos & Sundry Consumables $13,810Consultation - Media Monitoring $38,777Editing & Web Maintenance $2607.78Local and community advertising of a range of DCF activities such as foster care information nights, opening of nominations for the Tribute to NT Women 2012, EOI Youth Justice Advisory Committee.
$42,000
TOTAL $446,008
Insurance:
52.From 01 July 2011 to 31 March 2012, how much was spent on insurance expenses; further broken down by worker and employee insurances, physical plant and equipment insurances and other insurances?
Answer: No expenditure.
53.What areas of the department are self-insured? What areas are commercially insured? If there are areas that are commercially insured, who provides this insurance, when is it due for renewal and what is the cost of this insurance provision and does it attract any thresholds under which insurance is not provided or any payments on item replacement?
Answer: The Northern Territory Government applies a self insurance policy for its general government sector insurable risks. The self insurance policy covers property and assets, workers compensation, public liability and professional indemnity related liabilities. Any whole of government insurance policy related questions should be referred to the Treasurer.

54.What provision has been made for disaster or major catastrophe insurance?
Answer: The Territory does not purchase reinsurance cover for natural disasters or other insurable risks under the self insurance policy. Instead, the Territory makes provision in the Budget for disaster related events, complemented by the Natural Disaster Recovery and Relief Arrangements (NDRRA) with the Commonwealth to provide assistance for natural disaster events that are outside of the Territory’s control and where commercial insurance is not readily available or affordable.
Climate Change:
55.From 01 July 2011 to 31 March 2012, how many tonnes of CO2 did the department emit?
Answer: The Department of Children and Families emitted 509 tonnes of fleet related CO2 in 9 months as at 31 March 2012.
56.From 01 July 2011 to 31 March 2012, what programs and strategies were introduced to reduce CO2 emissions across the department?
Answer: Establish annual agency fleet emission target as part of an NT Fleet
target to reduce emissions by 20% over 5 years Introduction of minimum greenhouse emissions ratings of 5.5 for
passenger vehicles and 3.5 for light commercial vehicles Introduction of functional requirement categories with agencies
having to justify requests for vehicles outside the NT Fleet recommended list.
Introduce incentives for Executive Contractors to select more fuel efficient vehicles appropriate to level which would be cost neutral to Government.
Option to present to cabinet revised emission standards for years 3 to 5.
57.Has a target for departmental CO2 emissions been set for the coming financial year?- If yes, what % reduction is that from the previous year?- If no, why has a target not been set?
Answer: DCF has achieved a 15% reduction on emissions from the third year target of 16%. The Fleet related CO2 emissions target for DCF for the coming financial year is a 2% reduction from the current year.

Utilities:
58.From 01 July 2011 to 31 March 2012, what was the cost of power and water to the department?
Answer: Facility YTD expenditure 2011-12Water $31,000Power $272,000TOTAL $303,000
59.What is the projected cost for power and water to the department for the 2012-2013 financial year?
Answer: Facility Projection 2012-13Water $46,000Power $400,000TOTAL $446,000
DCF predicts that the power and water will increase by 10% but this will be highly dependent on the growth in accommodation needs of the department.
Public Events:
60.From 01 July 2011 to 31 March 2012, list the public events/conferences/forums that were sponsored by the department. What are projected for the 2012-2013 financial year?
Answer:
DCF has funded or provided in-kind support to the following:
DCF has funded the following:International Women’s Day grantsBarkly Women’s Day for the Long Walk Home women’s luncheonWorking Women’s Centre Our Work Our Lives conference Business Professional Women for Equal Pay Day seminarsponsored two female mining CDU students to attend the Darwin Mining Club function with the Minerals Council of AustraliaUnited Nations Association of Australia NT “Sisters in Islam” forumWomen’s Leadership Symposium 30 Nov 2011 sponsored 6 participants Youth Round TableNational Youth WeekYouth Engagement Grants ProgramYoung Achievers AwardCE NGO ForumChild Protection weekChildren’s weekBernardo’s Mother of the Year Domestic Violence Shelter ForumNT Families and Children’s Advisory CouncilYouth Justice Advisory CommitteeSorry Day

NAIDOC weekNational Reconciliation WeekCare and Protection Week
Projected events/conferences/forums 2012-13
Youth Round TableYouth ConferenceNational Youth WeekYouth Engagement Grants ProgramYoung Achiever AwardInternational Women’s Day Grants programTribute to Territory Women LunchDomestic Violence Shelter ForumNT Homelessness SummitEqual Pay SeminarFred’s Pass Rural ShowDarwin, Katherine, Tennant Creek and Alice Springs showsInaugural Youth Conference – October 2012 (this is cost neutral)CE NGO ForumSupport to hosting AASW social work conference at CDUSponsoring an award for CDU social work student each yearHost Mary Moylan award international SW Day function at parliament house Foster Care Awards- annually
61.What is the level of sponsorship provided in terms of financial support or in kind support?
Answer: $359,465 year to date from July 2011 to 31 March 2012.
Advertising:
62.What is the department’s budget for advertising for the 2011-2012 financial year?
Answer: The Department of Children and Families does not have a fixed advertising budget, rather funds are allocated from divisional budgets in response to issues depending on need.
63.How much is year to date expenditure? Please breakdown into newspaper, radio and TV?
Answer: $324, 507July 1, 2011 – March 31, 2012
Print $152,613 (Incl. $58,931 of campaign advertising)
TV $137,312 (all campaign spending)
Radio $17,653 (all campaign spending)
Online $16,929 (all campaign spending)
TOTAL $324,507
64.What advertising campaigns have been undertaken or will be undertaken by the department in 2011-2012 financial year?
Answer: “Stop the Hurting” – anti domestic violence campaign “Be Someone” V3 – mandatory reporting of domestic violence
65.From 01 July 2011 to 31 March 2012, how many consultancies were let in the year, at what cost, how many were NT firms and how many interstate and what was the value of those intra-territory and those interstate?
Answer: 1 Consultancy was let. $1,683,000.00 over two years. No interstate consultancies were let during the period.
____________________