Embed Size (px)
Citation preview

........................
TWEEDY, BROWNEGLOBAL VALUE FUND
ANNUALMARCH 31, 1994
........................
Tweedy Browne 17388 [Saved: 10/9/98 12:42 AM ] [Output: 10/9/98 3:22 AM ] Page 3 [Composite]
[Workstation: Electronic Prepress IV] [Location: (BOB) Art:Mutual Funds:First Data Investor Service:B30120 First D
TWEEDY, BROWNE GLOBAL VALUE FUND
Investment Manager's Report
To our Shareholders in Tweedy, Browne Global Value Fund:
We are pleased to present our Ñrst Annual Report to shareholders of
Tweedy, Browne Global Value Fund (""TBGVF'') for the Ñscal year
ended March 31, 1994. As the Fund commenced operations on June 15,
1993, this report covers nine months and two weeks rather than a full
year. Investment results for this period show an increase in net asset value
of 22.6% with a per share net asset value of $12.26. At year end, the Fund
was approximately 86% invested in 152 diÅerent issues in 17 countries. At
more than 60% of net assets and 110 issues, Europe continues to
represent the majority of our investments. However, we have expanded
our portfolio beyond Europe to include Asia and Australia with approxi-
mately 16% of net assets and 19 issues, and the U.S. at approximately 12%
of net assets with 23 issues. The four general partners of Tweedy, Browne
Company L.P., the investment adviser to the Fund, have approximately $8
million of their own money invested in TBGVF.*
In the past year there was much talk in the Ñnancial press about
investing abroad to the point where it became the ""in'' thing to do. The
investment community is constantly searching for new products to sell to
the investor, perhaps more for the reason of justifying their existence than
in providing sound Ñnancial advice. Non-U.S. securities are a legitimate
area of investment as long as the investor is aware of the particular risks
involved. Unlike Tweedy, Browne Global Value Fund, many, if not most
of the funds that invest abroad, do not provide a hedge against currency
Öuctuations. In essence, the unhedged investor in non-U.S. securities is
making two investments: Ñrst, he or she is buying a share of stock in a
business in a market that may have diÅerent economic fundamentals than
a similar U.S. company in U.S. markets; and second, the investor is
speculating in currency. The Ñrst part of the decision is fairly easy to
equalize vis-fia-vis a U.S. company once the particular accounting rules
have been mastered. The second part of the decision, the currency, is in
* Investment in shares of TBGVF should not be considered a complete investment program, whichfor many investors may include cash and Ñxed income investments.
m m m m m m m m m m m m m m m m m m m m m m m m m m m m m m m m
1
our estimation, is a roll of the dice. Investment decisions that in large
measure are dependent on political considerations are diÇcult, if not
impossible, to make. A government, or a central bank, may choose to
defend or devalue a nation's currency based upon internal political
considerations, which may well have no rational economic foundation.
For this reason, we choose to remain fully hedged at all times. As we like
to say, if you think the British pound is cheap, go to London and buy a
raincoat.
The process of hedging our exposure to stocks in London or Paris or
Zurich does not involve some arcane trading strategies or esoteric Ñnancial
derivatives. It is actually quite simple and merely involves selling forward
an amount of a particular currency equivalent to the market value of our
stocks in that country. Therefore, if the pound rises against the dollar; i.e.,
it takes more dollars to buy a British pound, we lose money on our
forward pound position, but the value of our British stocks has increased
in dollar terms by an equivalent amount, assuming the local stock price
has not changed. The same happens in reverse. Remaining fully hedged
against currency Öuctuations permits us to analyze companies free of
concern about the future prospects for the value of their home currency.
It reduces the research process to something akin to a New York-based
investor looking at companies based in New Jersey or Delaware. The
major eÅect on our research is to increase the number of potential
investment opportunities from 9,000 U.S. companies to 16,000 compa-
nies domiciled in developed countries. We say ""developed countries''
because we are not investing in emerging markets, countries with per
capita income below a speciÑed level. We interpret this to mean poor
countries with little history of political stability, or a lot of history of
political instability. While the party in power can change in European
countries, or Japan, or Canada, there is little chance the army will take
over the government, impose currency controls, or nationalize corporate
assets. The political risk to our universe of global investments, in our
opinion, is not signiÑcantly diÅerent than in the U.S.
We have been fortunate to have started auspiciously with TBGVF.
We have also been fortunate in achieving a nearly 86% level of invest-
ment, much of which is in small or medium capitalization companies, in
the midst of a rising stock market. We believe much of our success in the
Ñrst year is due to the fact that small and medium capitalization companies
were particularly depressed last year, and began to rise as interest rates in
m m m m m m m m m m m m m m m m m m m m m m m m m m m m m m m m
2

Europe began to decline. However, as of March 31, 1994, the fundamen-
tal investment characteristics of our holdings are far cheaper than the
broader market indices. Investments fall into two broad categories of
undervaluation in relation to intrinsic value: (i) issues based on a low
market price in relation to book value; i.e., what the respective companies
themselves have paid for their own assets; and (ii) issues based on a low
market price in relation to current or estimated earnings.
Among the stocks which are undervalued primarily on the basis of
book value, you own shares of Banco di Napoli, a bank based in Naples,
Italy, with over 200 branch oÇces in Italy, Asia and the United States. At
April 7, 1994, Banco di Napoli's stock price, 2,103 Italian lira (""ITL''),
was 49% of book value, 4,253 ITL per share, and 9.6x earnings, which is
an earnings yield of 10.4% if 100% of earnings were to be paid out to us as
a dividend. If earnings recover to the level attained in 1990, 395 ITL per
share, the current price would be 5.3x earnings, an 18.9% earnings yield.
The current dividend yield is 6.7%. Banks have often been valued at
prices in excess of book value in acquisition transactions.
At April 7, 1994, approximately 48% of your money was invested in
89 stocks, which were valued in the stock market at much less than book
value. The weighted average stock price in relation to book value for these
holdings was 72% of book value, a 28% discount. By comparison,
according to Euro Equities, the average European stock is priced at 290%
of book value. The Standard & Poor's 500 Stock Index (the ""S&P
500'')is 320% of book value. In our global database, less than 2% of the
5,777 companies throughout the world with a market value in excess of
$100 million are priced at less than 72% of book value.
Among companies that are valued primarily on the basis of current
and prospective earnings (cash Öow), we acquired shares of Heineken
Holdings N.V., a holding company whose primary asset is shares of
Heineken N.V., the Netherlands-based company whose beer is sold in
over 150 countries. Through Heineken Holdings N.V., we have acquired
shares of Heineken N.V. at 9.5x earnings. Heineken N.V. has the
following ""good business/franchise business'' characteristics: a branded
product which has provided enough competitive advantage to allow the
company to earn more than 30% pretax on the money it has invested in its
business; real cash earnings which we could take out of the business and
put in our pocket (or reinvest) if we owned the whole company; steady
m m m m m m m m m m m m m m m m m m m m m m m m m m m m m m m m
3
historical earnings per share growth above 10% over the last Ñve years;
and a favorable outlook for growth in earnings and intrinsic value as the
company expands in new markets around the world. At our price, 9.5x
earnings, the earnings yield on Heineken Holdings N.V., 10.5%, com-
pares favorably to long-term bond yields in the Netherlands, 6.2%. This
earnings yield seems likely to increase with the passage of time. Branded
consumer product companies with business characteristics similar to
Heineken have been valued at more than 20x earnings in corporate
acquisitions. Since making our initial investment, Heineken's price has
increased to 11.5x earnings, and we have continued to add to our
holdings.
At April 7, 1994, about 36% of your money was invested in 50
stocks, which were priced low in relation to earnings. The weighted
average price/earnings multiple for these stocks was 10x current year
earnings. If all of these companies were to pay out 100% of their earnings
to us as a dividend, the earnings yield would be 10%. We get part of this
earnings yield paid out to us as a dividend, and the remaining part builds
up for us within the companies while we sleep. In addition to being
undervalued in relation to earnings, our holdings are inexpensive in
relation to most other public companies in Europe and the United States.
According to Euro Equities, the average European stock is 21.6x earnings,
which is an earnings yield of 4.6%. The S&P 500 is 21x earnings, which is
an earnings yield of 4.8%. In our global database, less than 8% of the 5,777
companies throughout the world with a market value in excess of $100
million are priced at under 10x earnings.
In summary, we are pleased with the fundamentals of our portfolio
and conÑdent they will yield positive returns in time. What we cannot
predict is when the market will agree with our appraisals of value. Market
timing would help if only it were humanly possible. In an industry with
hundreds if not thousands of pundits making predictions about stocks,
indices, interest rates, etc., someone will always be right at some point in
time. However, to win in the investment business you need to be right
more than 50% of the time. Personally, we have never placed much faith
in investment oracles. Charles Ellis, a Ñnancial author and a partner in
Greenwich Associates, a leading Ñnancial services consulting Ñrm, believes
market timing is futile. He determined that in the period between 1982
and 1990, if an investor was out of the market for the ten best days, we
repeat, days, the investor's annual rate of return would have been reduced
m m m m m m m m m m m m m m m m m m m m m m m m m m m m m m m m
4

from 18% to 12%. Now, the average investor is not trying to avoid the ten
best days, but the ten worst days. Either way, picking the ten best or worst
days out of 2,500 is an odds play no one will win. As Charles Schwab's
mutual fund newsletter states: ""The lesson: once you're in, stay in. Don't
try to time the market, because no one knows when the best days will
come.''
In our view, common stocks continue to be the best long-term
investment as compared to bonds or short-term cash investments. Over
long periods of time, stocks as measured by the S&P 500 have com-
pounded at approximately 10% per annum. This result is understandable
when we examine the components that make up this return. The 10%
return is composed of the following: 3% real growth, which approximates
the average growth in U.S. Gross Domestic Product; 3% inÖation, which
is passed along in higher prices; and 4%, which has been the average
dividend yield of the S&P 500 over long periods of time.
Since we have dismissed market timing as a viable alternative to
beating the market, we will examine the other two principal alternatives
available to the investor. One approach is to buy companies growing faster
than the average return of the S&P 500 of 10% per year on the
assumption that their growth will be reÖected in increases in the stock
price. While we are not opposed to owning growth stocks, we see several
pitfalls. More often than not, the higher growth rate is already reÖected in
the stock price; i.e., the stock market has already discounted the future
growth in earnings thereby increasing investor risk if the company is
unable to achieve the investment community's expectations. This has
happened on numerous occasions in the past. Few, if any, businesses grow
forever. By this we mean companies that can sustain high growth rates
over long periods of time. While certain businesses can grow rapidly in
their early stages, the task of compounding an ever larger sales and
earnings base eventually leads to a slower growth rate. In our estimation,
the diÇculty of Ñnding very many great businesses, at reasonable prices,
which are likely to sustain fairly high earnings growth rates over a long
period of time is demonstrated by the holdings of Berkshire Hathaway,
the company managed by Warren BuÅett, one of this century's most
successful investors. Warren BuÅett's ability to invest in good businesses
which generate cash earnings and earnings growth has produced outstand-
ing results for his shareholders. However, just nine stocks make up the
vast majority of the value of Berkshire Hathaway's equity holdings. In our
m m m m m m m m m m m m m m m m m m m m m m m m m m m m m m m m
5

opinion, this small number of signiÑcant holdings reÖects the lack of true,
long-term growth stock opportunities.
The second approach to outperforming the market is generally
described as the ""value approach to investing.'' Value investing opportu-
nities occur either because of a wholesale undervaluation of stocks versus
bonds, which is not the case today, but was very deÑnitely the case in the
mid-1970s and the early 1980s, or because of negative perceptions about
the future prospects of a particular company, industry or country. These
negative perceptions often result in excessive selling pressure on certain
stocks, which gives rise to signiÑcant discrepancies between market price
and a more normal valuation of a company's assets or earning power. If
the discrepancies are wide enough and the market corrects them soon
enough, the investor can beat the average 10% return of the S&P 500.
Broadly stated, value investing involves buying stocks at a low ratio of
price-to-book value on the assumption that in time the assets will be
worth at least their stated book value, or a low price/earnings ratio. If a
stock is purchased at a price/earnings ratio of 8, the investor would enjoy
a return of 12.5% if all the earnings were paid out. This is the earnings
yield of a stock. If the earnings yield exceeds the long-term performance of
the S&P 500, one should expect to ultimately outperform the stock
market. If the company is also able to grow its earnings and/or reinvest
the earnings to produce future earnings growth in excess of 10%, there is
additional proÑt potential.
In a market environment such as today, these are the kinds of
investment opportunities we seek. The ability to look for opportunities
globally merely increases our chances of Ñnding undervalued stocks.
Unlike growth stock investing, which may require a high degree of
concentration given the small number of truly great businesses, value
investing requires broad diversiÑcation. We cannot determine, on a stock-
by-stock basis, when a company will go from being undervalued to being
fairly valued. Historical data will provide averages but the stock-by-stock
variations can be dramatic.
Rates of return are not earned in stocks as they are in certiÑcates of
deposit in a predictable, steady way. There is much more variability year to
year or even decade to decade. While the S&P 500 has compounded on
average at 10% per annum, in the 1960s the average was 6.5%, in the
1970s it was 7.5%, and in the 1980s it was 17%°. Moreover, if you have a
m m m m m m m m m m m m m m m m m m m m m m m m m m m m m m m m
6

portfolio of undervalued stocks like we do, there is no assurance that in
the short run an overall decline in the stock market will not reduce your
stated net worth. The investor's goal should be to own stocks that over
time have the fundamental investment characteristics to produce superior
rates of return. We think we have that. And, as it is impossible to predict
when the next ten best days will occur in the stock market over the next
ten years, we conclude that, as long as we can Ñnd enough bargains, we
must stay invested realizing that in the short run the stock market can
reduce our net worth. As Ben Graham said, ""In the short run, the stock
market is a voting machine. In the long run, it is a weighing machine.''
Sincerely,
Christopher H. Browne
William H. Browne
James M. Clark, Jr.
John D. Spears
General Partners,
TWEEDY, BROWNE COMPANY L.P.
Investment Adviser to the Fund
April 7, 1994
m m m m m m m m m m m m m m m m m m m m m m m m m m m m m m m m
7

TWEEDY, BROWNE GLOBAL VALUE FUND
Portfolio Highlights
March 31, 1994
Hypothetical Illustration of $10,000 Invested inTweedy, Browne Global Value Fund vs. Morgan Stanley
Capital International (MSCI) World Index6/15/93 through 3/31/94
The Morgan Stanley Capital International (MSCI) World Index represents the monthly change inmarket capitalizations of Europe, Australia and the Far East (EAFE) plus Canada, the U.S. and SouthAfrican Gold Mines, including dividends reinvested monthly, net after withholding taxes for foreigners.
Index information is available at month end only; therefore, the closest month end to inception date of theFund, May 31, 1993, has been used.
The Fund had an aggregate total return of 22.60%AGGREGATE TOTAL RETURNfor the period from inception (June 15, 1993)
Without through March 31, 1994. The Fund's benchmarkindex, the Morgan Stanley Capital InternationalActual Waivers*(MSCI) World Index, had an aggregate total
Inceptionreturn for the same period of 6.10%.
(6/15/93)
through
3/31/94 22.60% 22.51%
Note: The performance shown represents past performance and is not a guarantee of future results. AFund's share price and investment return will vary with market conditions, and the principalvalue of shares, when redeemed, may be more or less than original cost.
* See Note 2 to Financial Statements.
8

TWEEDY, BROWNE GLOBAL VALUE FUND
Portfolio Highlights
March 31, 1994
In accordance with rules and guidelines set out by the Securities and
Exchange Commission, we have provided a comparison of the historical
investment results of Tweedy, Browne Global Value Fund to the histori-
cal investment results of an index, the Morgan Stanley Capital Interna-
tional (MSCI) World Index, which in large measure represents the
investments results of stocks that we do not own. Any portfolio which
does not own exactly the same stocks in exactly the same proportions as
the index to which the particular portfolio is being compared is not likely
to have the same results as the index. The investment behavior of a
diversiÑed portfolio of undervalued stocks tends to be correlated to the
investment behavior of a broad index; i.e., when the index is up, probably
more than one-half of the stocks in the entire universe of public
companies in all the countries that are included in the same index will be
up, albeit, in greater or lesser percentages than the index. Similarly, when
the index declines, probably most of the stocks in the entire universe of
public companies in all countries that are included in the index will be
down in greater or lesser percentages than the index. But it is almost a
mathematical truth that ""diÅerent stocks equals diÅerent results.''
Favorable or unfavorable historical investment results in comparison
to an index are not necessarily predictive of future comparative invest-
ment results. In Are Short-Term Performance and Value Investing
Mutually Exclusive? The Hare and the Tortoise Revisited (an article in
the Spring 1986 issue of Columbia University's Hermes magazine),
V. Eugene Shahan analyzed the investment records of seven investment
managers with exceptional long-term track records. This sample of invest-
ment managers had investment results which exceeded either the Dow
Jones Industrial Average (the ""DJIA'') or the Standard & Poor's 500
Stock Index (the ""S&P 500'') by between 7.7% and 16.5% per year over
periods ranging from 13 years to 28.25 years. None of the seven managers
outperformed the S&P 500 each year. Six of the seven investment
managers underperformed either the DJIA or the S&P 500 from between
28.3% to 42.1% of the years covered. In examining the seven long-term
m m m m m m m m m m m m m m m m m m m m m m m m m m m m m m m m
9
TWEEDY, BROWNE GLOBAL VALUE FUND
Portfolio Highlights
March 31, 1994
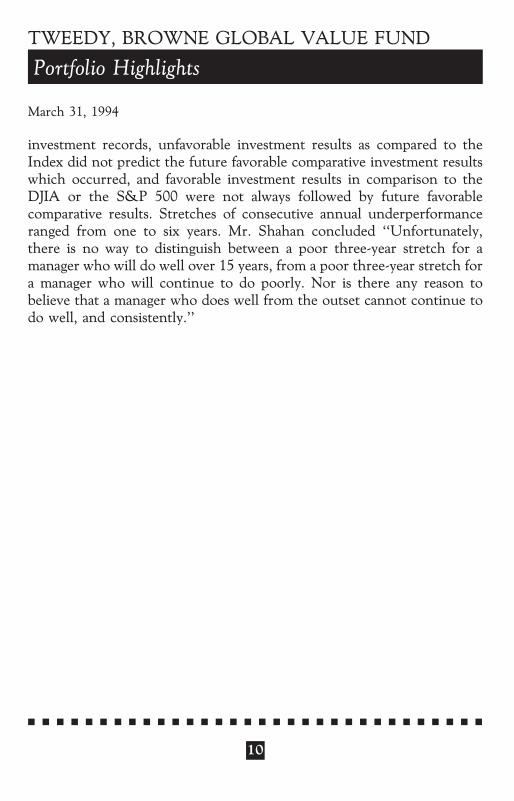
investment records, unfavorable investment results as compared to the
Index did not predict the future favorable comparative investment results
which occurred, and favorable investment results in comparison to the
DJIA or the S&P 500 were not always followed by future favorable
comparative results. Stretches of consecutive annual underperformance
ranged from one to six years. Mr. Shahan concluded ""Unfortunately,
there is no way to distinguish between a poor three-year stretch for a
manager who will do well over 15 years, from a poor three-year stretch for
a manager who will continue to do poorly. Nor is there any reason to
believe that a manager who does well from the outset cannot continue to
do well, and consistently.''
m m m m m m m m m m m m m m m m m m m m m m m m m m m m m m m m
10
TWEEDY, BROWNE GLOBAL VALUE FUND
Portfolio of Investments
March 31, 1994
MarketValue
Shares (Note 1)
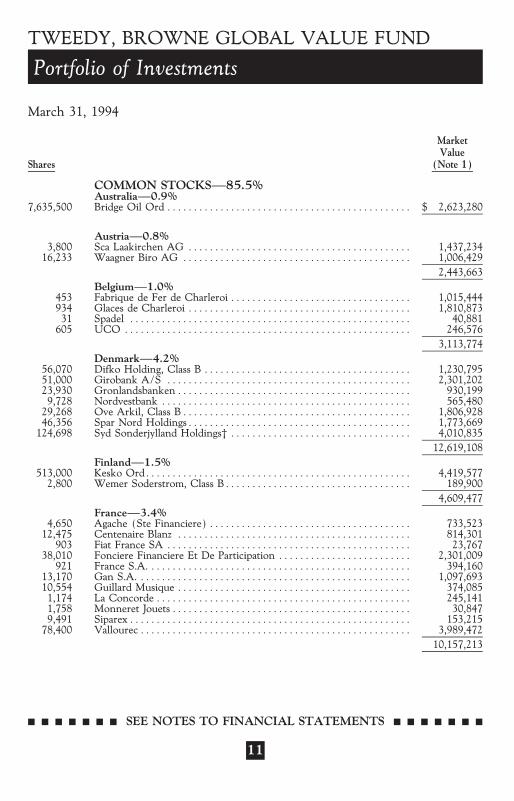
COMMON STOCKSÌ85.5%AustraliaÌ0.9%
7,635,500 Bridge Oil Ord ÏÏÏÏÏÏÏÏÏÏÏÏÏÏÏÏÏÏÏÏÏÏÏÏÏÏÏÏÏÏÏÏÏÏÏÏÏÏÏÏÏÏÏÏÏÏ $ 2,623,280
AustriaÌ0.8%3,800 Sca Laakirchen AG ÏÏÏÏÏÏÏÏÏÏÏÏÏÏÏÏÏÏÏÏÏÏÏÏÏÏÏÏÏÏÏÏÏÏÏÏÏÏÏÏÏÏ 1,437,234
16,233 Waagner Biro AG ÏÏÏÏÏÏÏÏÏÏÏÏÏÏÏÏÏÏÏÏÏÏÏÏÏÏÏÏÏÏÏÏÏÏÏÏÏÏÏÏÏÏÏ 1,006,429
2,443,663
BelgiumÌ1.0%453 Fabrique de Fer de Charleroi ÏÏÏÏÏÏÏÏÏÏÏÏÏÏÏÏÏÏÏÏÏÏÏÏÏÏÏÏÏÏÏÏÏÏ 1,015,444934 Glaces de Charleroi ÏÏÏÏÏÏÏÏÏÏÏÏÏÏÏÏÏÏÏÏÏÏÏÏÏÏÏÏÏÏÏÏÏÏÏÏÏÏÏÏÏÏ 1,810,87331 Spadel ÏÏÏÏÏÏÏÏÏÏÏÏÏÏÏÏÏÏÏÏÏÏÏÏÏÏÏÏÏÏÏÏÏÏÏÏÏÏÏÏÏÏÏÏÏÏÏÏÏÏÏÏÏ 40,881
605 UCO ÏÏÏÏÏÏÏÏÏÏÏÏÏÏÏÏÏÏÏÏÏÏÏÏÏÏÏÏÏÏÏÏÏÏÏÏÏÏÏÏÏÏÏÏÏÏÏÏÏÏÏÏÏÏ 246,576
3,113,774
DenmarkÌ4.2%56,070 Difko Holding, Class B ÏÏÏÏÏÏÏÏÏÏÏÏÏÏÏÏÏÏÏÏÏÏÏÏÏÏÏÏÏÏÏÏÏÏÏÏÏÏÏ 1,230,79551,000 Girobank A/S ÏÏÏÏÏÏÏÏÏÏÏÏÏÏÏÏÏÏÏÏÏÏÏÏÏÏÏÏÏÏÏÏÏÏÏÏÏÏÏÏÏÏÏÏÏÏ 2,301,20223,930 GronlandsbankenÏÏÏÏÏÏÏÏÏÏÏÏÏÏÏÏÏÏÏÏÏÏÏÏÏÏÏÏÏÏÏÏÏÏÏÏÏÏÏÏÏÏÏÏ 930,1999,728 Nordvestbank ÏÏÏÏÏÏÏÏÏÏÏÏÏÏÏÏÏÏÏÏÏÏÏÏÏÏÏÏÏÏÏÏÏÏÏÏÏÏÏÏÏÏÏÏÏÏÏ 565,480
29,268 Ove Arkil, Class BÏÏÏÏÏÏÏÏÏÏÏÏÏÏÏÏÏÏÏÏÏÏÏÏÏÏÏÏÏÏÏÏÏÏÏÏÏÏÏÏÏÏÏ 1,806,92846,356 Spar Nord HoldingsÏÏÏÏÏÏÏÏÏÏÏÏÏÏÏÏÏÏÏÏÏÏÏÏÏÏÏÏÏÏÏÏÏÏÏÏÏÏÏÏÏÏ 1,773,669
124,698 Syd Sonderjylland Holdings‰ ÏÏÏÏÏÏÏÏÏÏÏÏÏÏÏÏÏÏÏÏÏÏÏÏÏÏÏÏÏÏÏÏÏÏ 4,010,835
12,619,108
FinlandÌ1.5%513,000 Kesko OrdÏÏÏÏÏÏÏÏÏÏÏÏÏÏÏÏÏÏÏÏÏÏÏÏÏÏÏÏÏÏÏÏÏÏÏÏÏÏÏÏÏÏÏÏÏÏÏÏÏÏ 4,419,577
2,800 Wemer Soderstrom, Class BÏÏÏÏÏÏÏÏÏÏÏÏÏÏÏÏÏÏÏÏÏÏÏÏÏÏÏÏÏÏÏÏÏÏÏ 189,900
4,609,477
FranceÌ3.4%4,650 Agache (Ste Financiere) ÏÏÏÏÏÏÏÏÏÏÏÏÏÏÏÏÏÏÏÏÏÏÏÏÏÏÏÏÏÏÏÏÏÏÏÏÏÏ 733,523
12,475 Centenaire Blanz ÏÏÏÏÏÏÏÏÏÏÏÏÏÏÏÏÏÏÏÏÏÏÏÏÏÏÏÏÏÏÏÏÏÏÏÏÏÏÏÏÏÏÏÏ 814,301903 Fiat France SA ÏÏÏÏÏÏÏÏÏÏÏÏÏÏÏÏÏÏÏÏÏÏÏÏÏÏÏÏÏÏÏÏÏÏÏÏÏÏÏÏÏÏÏÏÏÏ 23,767
38,010 Fonciere Financiere Et De Participation ÏÏÏÏÏÏÏÏÏÏÏÏÏÏÏÏÏÏÏÏÏÏÏÏÏ 2,301,009921 France S.A. ÏÏÏÏÏÏÏÏÏÏÏÏÏÏÏÏÏÏÏÏÏÏÏÏÏÏÏÏÏÏÏÏÏÏÏÏÏÏÏÏÏÏÏÏÏÏÏÏÏ 394,160
13,170 Gan S.A. ÏÏÏÏÏÏÏÏÏÏÏÏÏÏÏÏÏÏÏÏÏÏÏÏÏÏÏÏÏÏÏÏÏÏÏÏÏÏÏÏÏÏÏÏÏÏÏÏÏÏÏ 1,097,69310,554 Guillard Musique ÏÏÏÏÏÏÏÏÏÏÏÏÏÏÏÏÏÏÏÏÏÏÏÏÏÏÏÏÏÏÏÏÏÏÏÏÏÏÏÏÏÏÏÏ 374,0851,174 La Concorde ÏÏÏÏÏÏÏÏÏÏÏÏÏÏÏÏÏÏÏÏÏÏÏÏÏÏÏÏÏÏÏÏÏÏÏÏÏÏÏÏÏÏÏÏÏÏÏÏ 245,1411,758 Monneret JouetsÏÏÏÏÏÏÏÏÏÏÏÏÏÏÏÏÏÏÏÏÏÏÏÏÏÏÏÏÏÏÏÏÏÏÏÏÏÏÏÏÏÏÏÏÏ 30,8479,491 SiparexÏÏÏÏÏÏÏÏÏÏÏÏÏÏÏÏÏÏÏÏÏÏÏÏÏÏÏÏÏÏÏÏÏÏÏÏÏÏÏÏÏÏÏÏÏÏÏÏÏÏÏÏÏ 153,215
78,400 VallourecÏÏÏÏÏÏÏÏÏÏÏÏÏÏÏÏÏÏÏÏÏÏÏÏÏÏÏÏÏÏÏÏÏÏÏÏÏÏÏÏÏÏÏÏÏÏÏÏÏÏÏ 3,989,472
10,157,213
m m m m m m m SEE NOTES TO FINANCIAL STATEMENTS m m m m m m m
11

TWEEDY, BROWNE GLOBAL VALUE FUND
Portfolio of Investments
March 31, 1994
MarketValue
Shares (Note 1)
COMMON STOCKSGermanyÌ1.5%
16,868 Sinn AG ÏÏÏÏÏÏÏÏÏÏÏÏÏÏÏÏÏÏÏÏÏÏÏÏÏÏÏÏÏÏÏÏÏÏÏÏÏÏÏÏÏÏÏÏÏÏÏÏÏÏÏ $ 3,872,9363,069 Tiag Tabbert-ind AF ÏÏÏÏÏÏÏÏÏÏÏÏÏÏÏÏÏÏÏÏÏÏÏÏÏÏÏÏÏÏÏÏÏÏÏÏÏÏÏÏÏ 447,076
4,320,012
Hong KongÌ1.1%1,756,000 Semi Tech (Global) ÏÏÏÏÏÏÏÏÏÏÏÏÏÏÏÏÏÏÏÏÏÏÏÏÏÏÏÏÏÏÏÏÏÏÏÏÏÏÏÏÏ 3,385,750
ItalyÌ8.7%232,400 Avir Finanziaria SPA ÏÏÏÏÏÏÏÏÏÏÏÏÏÏÏÏÏÏÏÏÏÏÏÏÏÏÏÏÏÏÏÏÏÏÏÏÏÏÏÏÏ 1,048,280
1,225,000 Banca Toscana ÏÏÏÏÏÏÏÏÏÏÏÏÏÏÏÏÏÏÏÏÏÏÏÏÏÏÏÏÏÏÏÏÏÏÏÏÏÏÏÏÏÏÏÏÏÏ 2,803,179265,100 Banco di Sardegna ÏÏÏÏÏÏÏÏÏÏÏÏÏÏÏÏÏÏÏÏÏÏÏÏÏÏÏÏÏÏÏÏÏÏÏÏÏÏÏÏÏÏÏ 2,556,492
1,490,700 Banco di Napoli ÏÏÏÏÏÏÏÏÏÏÏÏÏÏÏÏÏÏÏÏÏÏÏÏÏÏÏÏÏÏÏÏÏÏÏÏÏÏÏÏÏÏÏÏÏ 1,923,5442,567,500 Banco di Napoli di Risp ÏÏÏÏÏÏÏÏÏÏÏÏÏÏÏÏÏÏÏÏÏÏÏÏÏÏÏÏÏÏÏÏÏÏÏÏÏÏ 2,696,410
13,000 Bassetti SPA ÏÏÏÏÏÏÏÏÏÏÏÏÏÏÏÏÏÏÏÏÏÏÏÏÏÏÏÏÏÏÏÏÏÏÏÏÏÏÏÏÏÏÏÏÏÏÏÏ 68,33687,000 Cementerie di Augusta ÏÏÏÏÏÏÏÏÏÏÏÏÏÏÏÏÏÏÏÏÏÏÏÏÏÏÏÏÏÏÏÏÏÏÏÏÏÏÏ 184,198
113,000 Cementerie di Barletta Ord ÏÏÏÏÏÏÏÏÏÏÏÏÏÏÏÏÏÏÏÏÏÏÏÏÏÏÏÏÏÏÏÏÏÏÏ 407,765556,000 Cementerie di Sardegna Ord ÏÏÏÏÏÏÏÏÏÏÏÏÏÏÏÏÏÏÏÏÏÏÏÏÏÏÏÏÏÏÏÏÏÏ 1,902,569459,000 Cementerie Sicilia ÏÏÏÏÏÏÏÏÏÏÏÏÏÏÏÏÏÏÏÏÏÏÏÏÏÏÏÏÏÏÏÏÏÏÏÏÏÏÏÏÏÏÏ 1,556,082575,000 Falck Ord ÏÏÏÏÏÏÏÏÏÏÏÏÏÏÏÏÏÏÏÏÏÏÏÏÏÏÏÏÏÏÏÏÏÏÏÏÏÏÏÏÏÏÏÏÏÏÏÏÏÏ 1,884,589834,000 Fidis OrdÏÏÏÏÏÏÏÏÏÏÏÏÏÏÏÏÏÏÏÏÏÏÏÏÏÏÏÏÏÏÏÏÏÏÏÏÏÏÏÏÏÏÏÏÏÏÏÏÏÏÏ 2,642,150257,800 Franco TosiÏÏÏÏÏÏÏÏÏÏÏÏÏÏÏÏÏÏÏÏÏÏÏÏÏÏÏÏÏÏÏÏÏÏÏÏÏÏÏÏÏÏÏÏÏÏÏÏÏ 3,614,140625,000 Gilardini Industrie ÏÏÏÏÏÏÏÏÏÏÏÏÏÏÏÏÏÏÏÏÏÏÏÏÏÏÏÏÏÏÏÏÏÏÏÏÏÏÏÏÏÏÏ 1,398,308127,500 MaÅei SPA ÏÏÏÏÏÏÏÏÏÏÏÏÏÏÏÏÏÏÏÏÏÏÏÏÏÏÏÏÏÏÏÏÏÏÏÏÏÏÏÏÏÏÏÏÏÏÏÏÏ 351,57142,500 Marangoni SPA ÏÏÏÏÏÏÏÏÏÏÏÏÏÏÏÏÏÏÏÏÏÏÏÏÏÏÏÏÏÏÏÏÏÏÏÏÏÏÏÏÏÏÏÏÏ 143,05038,000 SerÑ SPAÏÏÏÏÏÏÏÏÏÏÏÏÏÏÏÏÏÏÏÏÏÏÏÏÏÏÏÏÏÏÏÏÏÏÏÏÏÏÏÏÏÏÏÏÏÏÏÏÏÏÏ 136,652
1,010,000 Vianini Industria ÏÏÏÏÏÏÏÏÏÏÏÏÏÏÏÏÏÏÏÏÏÏÏÏÏÏÏÏÏÏÏÏÏÏÏÏÏÏÏÏÏÏÏÏ 690,593
26,007,908
JapanÌ13.1%170,000 Amada Sonoike CompanyÏÏÏÏÏÏÏÏÏÏÏÏÏÏÏÏÏÏÏÏÏÏÏÏÏÏÏÏÏÏÏÏÏÏÏÏÏ 1,369,62998,000 Chofu Seisakusho ÏÏÏÏÏÏÏÏÏÏÏÏÏÏÏÏÏÏÏÏÏÏÏÏÏÏÏÏÏÏÏÏÏÏÏÏÏÏÏÏÏÏÏ 2,402,14996,000 Chobu Steel Plate CompanyÏÏÏÏÏÏÏÏÏÏÏÏÏÏÏÏÏÏÏÏÏÏÏÏÏÏÏÏÏÏÏÏÏÏÏ 525,000
278,000 Daiichi Cement CompanyÏÏÏÏÏÏÏÏÏÏÏÏÏÏÏÏÏÏÏÏÏÏÏÏÏÏÏÏÏÏÏÏÏÏÏÏÏ 1,669,629505,000 Dowa Fire & Marine Insurance CompanyÏÏÏÏÏÏÏÏÏÏÏÏÏÏÏÏÏÏÏÏÏÏÏ 3,195,703143,000 Fuji Photo Film Ltd. Ord ÏÏÏÏÏÏÏÏÏÏÏÏÏÏÏÏÏÏÏÏÏÏÏÏÏÏÏÏÏÏÏÏÏÏÏÏÏ 3,197,949247,000 Inabata & Company ÏÏÏÏÏÏÏÏÏÏÏÏÏÏÏÏÏÏÏÏÏÏÏÏÏÏÏÏÏÏÏÏÏÏÏÏÏÏÏÏÏ 2,120,244577,000 Kirin Brewery Company ÏÏÏÏÏÏÏÏÏÏÏÏÏÏÏÏÏÏÏÏÏÏÏÏÏÏÏÏÏÏÏÏÏÏÏÏÏÏ 6,536,328170,000 Koa Fire & Marine Insurance Company ÏÏÏÏÏÏÏÏÏÏÏÏÏÏÏÏÏÏÏÏÏÏÏÏ 1,145,508268,000 Matsuo ElectricÏÏÏÏÏÏÏÏÏÏÏÏÏÏÏÏÏÏÏÏÏÏÏÏÏÏÏÏÏÏÏÏÏÏÏÏÏÏÏÏÏÏÏÏÏÏ 1,190,820362,000 Nichido Fire & Marine Insurance ÏÏÏÏÏÏÏÏÏÏÏÏÏÏÏÏÏÏÏÏÏÏÏÏÏÏÏÏÏÏ 3,040,234104,000 NichimoÏÏÏÏÏÏÏÏÏÏÏÏÏÏÏÏÏÏÏÏÏÏÏÏÏÏÏÏÏÏÏÏÏÏÏÏÏÏÏÏÏÏÏÏÏÏÏÏÏÏÏÏ 457,031497,000 Nissan Fire & Marine Insurance Company ÏÏÏÏÏÏÏÏÏÏÏÏÏÏÏÏÏÏÏÏÏÏ 3,445,996414,000 Nisshinbo Industries ÏÏÏÏÏÏÏÏÏÏÏÏÏÏÏÏÏÏÏÏÏÏÏÏÏÏÏÏÏÏÏÏÏÏÏÏÏÏÏÏÏ 4,204,688341,000 Nittetsu Mining ÏÏÏÏÏÏÏÏÏÏÏÏÏÏÏÏÏÏÏÏÏÏÏÏÏÏÏÏÏÏÏÏÏÏÏÏÏÏÏÏÏÏÏÏÏ 2,930,469
m m m m m m m SEE NOTES TO FINANCIAL STATEMENTS m m m m m m m
12

TWEEDY, BROWNE GLOBAL VALUE FUND
Portfolio of Investments
March 31, 1994
MarketValue
Shares (Note 1)
COMMON STOCKSJapanÌ(Continued)
90,000 Oak ÏÏÏÏÏÏÏÏÏÏÏÏÏÏÏÏÏÏÏÏÏÏÏÏÏÏÏÏÏÏÏÏÏÏÏÏÏÏÏÏÏÏÏÏÏÏÏÏÏÏÏÏÏÏÏ $ 610,840123,000 Taisei Fire & Marine InsuranceÏÏÏÏÏÏÏÏÏÏÏÏÏÏÏÏÏÏÏÏÏÏÏÏÏÏÏÏÏÏÏÏ 749,531
38,791,748
NetherlandsÌ9.8%2,500 Akzo NV OrdÏÏÏÏÏÏÏÏÏÏÏÏÏÏÏÏÏÏÏÏÏÏÏÏÏÏÏÏÏÏÏÏÏÏÏÏÏÏÏÏÏÏÏÏÏÏÏ 289,2981,050 Beers Zonen ÏÏÏÏÏÏÏÏÏÏÏÏÏÏÏÏÏÏÏÏÏÏÏÏÏÏÏÏÏÏÏÏÏÏÏÏÏÏÏÏÏÏÏÏÏÏÏÏ 83,507
39,850 Berghuizer Papier ÏÏÏÏÏÏÏÏÏÏÏÏÏÏÏÏÏÏÏÏÏÏÏÏÏÏÏÏÏÏÏÏÏÏÏÏÏÏÏÏÏÏÏÏ 965,67431,350 Crown Van Gelder CVA ÏÏÏÏÏÏÏÏÏÏÏÏÏÏÏÏÏÏÏÏÏÏÏÏÏÏÏÏÏÏÏÏÏÏÏÏÏ 2,560,20897,000 Econosto ÏÏÏÏÏÏÏÏÏÏÏÏÏÏÏÏÏÏÏÏÏÏÏÏÏÏÏÏÏÏÏÏÏÏÏÏÏÏÏÏÏÏÏÏÏÏÏÏÏÏÏ 1,263,30422,050 Gelderse PapierÏÏÏÏÏÏÏÏÏÏÏÏÏÏÏÏÏÏÏÏÏÏÏÏÏÏÏÏÏÏÏÏÏÏÏÏÏÏÏÏÏÏÏÏÏÏ 860,3443,500 Giessen Noord ÏÏÏÏÏÏÏÏÏÏÏÏÏÏÏÏÏÏÏÏÏÏÏÏÏÏÏÏÏÏÏÏÏÏÏÏÏÏÏÏÏÏÏÏÏÏ 859,354
310,700 Hal Trust Units ÏÏÏÏÏÏÏÏÏÏÏÏÏÏÏÏÏÏÏÏÏÏÏÏÏÏÏÏÏÏÏÏÏÏÏÏÏÏÏÏÏÏÏÏÏ 3,565,546102,684 Heineken Holdings NVÏÏÏÏÏÏÏÏÏÏÏÏÏÏÏÏÏÏÏÏÏÏÏÏÏÏÏÏÏÏÏÏÏÏÏÏÏÏÏ 10,906,92126,734 Nedschroef Holdings ÏÏÏÏÏÏÏÏÏÏÏÏÏÏÏÏÏÏÏÏÏÏÏÏÏÏÏÏÏÏÏÏÏÏÏÏÏÏÏÏÏ 1,043,1047,000 N.K.F. Holdings CertiÑcates ÏÏÏÏÏÏÏÏÏÏÏÏÏÏÏÏÏÏÏÏÏÏÏÏÏÏÏÏÏÏÏÏÏÏÏ 747,265
30,915 Polynorm NV ÏÏÏÏÏÏÏÏÏÏÏÏÏÏÏÏÏÏÏÏÏÏÏÏÏÏÏÏÏÏÏÏÏÏÏÏÏÏÏÏÏÏÏÏÏÏÏ 2,887,71028,600 Unilever NV CVA ÏÏÏÏÏÏÏÏÏÏÏÏÏÏÏÏÏÏÏÏÏÏÏÏÏÏÏÏÏÏÏÏÏÏÏÏÏÏÏÏÏÏ 3,017,998
29,050,233
NorwayÌ0.8%115,390 D.N.L. Ord, Class B‰ ÏÏÏÏÏÏÏÏÏÏÏÏÏÏÏÏÏÏÏÏÏÏÏÏÏÏÏÏÏÏÏÏÏÏÏÏÏÏÏÏ 2,448,999
SpainÌ4.4%66,035 Banco Herrero SA ÏÏÏÏÏÏÏÏÏÏÏÏÏÏÏÏÏÏÏÏÏÏÏÏÏÏÏÏÏÏÏÏÏÏÏÏÏÏÏÏÏÏÏ 2,090,177
100,400 Cordoracino Financiaere Reunida ÏÏÏÏÏÏÏÏÏÏÏÏÏÏÏÏÏÏÏÏÏÏÏÏÏÏÏÏÏÏ 317,05342,601 Grupo Anaya ÏÏÏÏÏÏÏÏÏÏÏÏÏÏÏÏÏÏÏÏÏÏÏÏÏÏÏÏÏÏÏÏÏÏÏÏÏÏÏÏÏÏÏÏÏÏÏ 1,081,880
119,700 Grupo FosforeraÏÏÏÏÏÏÏÏÏÏÏÏÏÏÏÏÏÏÏÏÏÏÏÏÏÏÏÏÏÏÏÏÏÏÏÏÏÏÏÏÏÏÏÏÏ 1,141,04953,122 Hullas C. Cortes ÏÏÏÏÏÏÏÏÏÏÏÏÏÏÏÏÏÏÏÏÏÏÏÏÏÏÏÏÏÏÏÏÏÏÏÏÏÏÏÏÏÏÏÏ 1,270,86117,584 Indo Internacional ÏÏÏÏÏÏÏÏÏÏÏÏÏÏÏÏÏÏÏÏÏÏÏÏÏÏÏÏÏÏÏÏÏÏÏÏÏÏÏÏÏÏÏ 550,107
160,446 Interclisa ÏÏÏÏÏÏÏÏÏÏÏÏÏÏÏÏÏÏÏÏÏÏÏÏÏÏÏÏÏÏÏÏÏÏÏÏÏÏÏÏÏÏÏÏÏÏÏÏÏÏÏ 1,122,00040,043 Moulinex Espana SA ÏÏÏÏÏÏÏÏÏÏÏÏÏÏÏÏÏÏÏÏÏÏÏÏÏÏÏÏÏÏÏÏÏÏÏÏÏÏÏÏÏ 972,70418,743 Omsa ÏÏÏÏÏÏÏÏÏÏÏÏÏÏÏÏÏÏÏÏÏÏÏÏÏÏÏÏÏÏÏÏÏÏÏÏÏÏÏÏÏÏÏÏÏÏÏÏÏÏÏÏÏÏ 100,02754,055 Prim GrupoÏÏÏÏÏÏÏÏÏÏÏÏÏÏÏÏÏÏÏÏÏÏÏÏÏÏÏÏÏÏÏÏÏÏÏÏÏÏÏÏÏÏÏÏÏÏÏÏÏ 407,85019,960 Roberto Zubiri ÏÏÏÏÏÏÏÏÏÏÏÏÏÏÏÏÏÏÏÏÏÏÏÏÏÏÏÏÏÏÏÏÏÏÏÏÏÏÏÏÏÏÏÏÏÏ 104,3189,200 Tableros de Fibras SA ÏÏÏÏÏÏÏÏÏÏÏÏÏÏÏÏÏÏÏÏÏÏÏÏÏÏÏÏÏÏÏÏÏÏÏÏÏÏÏÏ 70,430
105,495 Unipapel ÏÏÏÏÏÏÏÏÏÏÏÏÏÏÏÏÏÏÏÏÏÏÏÏÏÏÏÏÏÏÏÏÏÏÏÏÏÏÏÏÏÏÏÏÏÏÏÏÏÏÏ 3,145,04826,000 Unipapel NV 93ÏÏÏÏÏÏÏÏÏÏÏÏÏÏÏÏÏÏÏÏÏÏÏÏÏÏÏÏÏÏÏÏÏÏÏÏÏÏÏÏÏÏÏÏÏ 526,316
12,899,820
SwedenÌ2.1%618,360 Bure Forvaltning AB‰ ÏÏÏÏÏÏÏÏÏÏÏÏÏÏÏÏÏÏÏÏÏÏÏÏÏÏÏÏÏÏÏÏÏÏÏÏÏÏÏÏ 2,848,109221,440 Hidef CapitalÏÏÏÏÏÏÏÏÏÏÏÏÏÏÏÏÏÏÏÏÏÏÏÏÏÏÏÏÏÏÏÏÏÏÏÏÏÏÏÏÏÏÏÏÏÏÏÏ 793,280550,520 Partnerinvesteringar ÏÏÏÏÏÏÏÏÏÏÏÏÏÏÏÏÏÏÏÏÏÏÏÏÏÏÏÏÏÏÏÏÏÏÏÏÏÏÏÏÏÏ 1,866,516172,500 Vencap AB Ord‰ ÏÏÏÏÏÏÏÏÏÏÏÏÏÏÏÏÏÏÏÏÏÏÏÏÏÏÏÏÏÏÏÏÏÏÏÏÏÏÏÏÏÏÏÏ 595,889
6,103,794
m m m m m m m SEE NOTES TO FINANCIAL STATEMENTS m m m m m m m
13

TWEEDY, BROWNE GLOBAL VALUE FUND
Portfolio of Investments
March 31, 1994
MarketValue
Shares (Note 1)
COMMON STOCKSSwitzerlandÌ12.7%
33 Bank of International Settlements America ÏÏÏÏÏÏÏÏÏÏÏÏÏÏÏÏÏÏÏÏÏÏ $ 245,0731,044 Bobst AG, BearerÏÏÏÏÏÏÏÏÏÏÏÏÏÏÏÏÏÏÏÏÏÏÏÏÏÏÏÏÏÏÏÏÏÏÏÏÏÏÏÏÏÏÏÏ 1,236,0723,800 Ciba-Geigy AGÏÏÏÏÏÏÏÏÏÏÏÏÏÏÏÏÏÏÏÏÏÏÏÏÏÏÏÏÏÏÏÏÏÏÏÏÏÏÏÏÏÏÏÏÏÏ 2,349,2382,085 Daetwyler, BearerÏÏÏÏÏÏÏÏÏÏÏÏÏÏÏÏÏÏÏÏÏÏÏÏÏÏÏÏÏÏÏÏÏÏÏÏÏÏÏÏÏÏÏÏ 3,584,633
100 Danzas Holding, Namen ÏÏÏÏÏÏÏÏÏÏÏÏÏÏÏÏÏÏÏÏÏÏÏÏÏÏÏÏÏÏÏÏÏÏÏÏÏÏ 99,2564,430 Georg Fischer AG, Bearer ÏÏÏÏÏÏÏÏÏÏÏÏÏÏÏÏÏÏÏÏÏÏÏÏÏÏÏÏÏÏÏÏÏÏÏÏ 4,082,9496,580 Immuno International AG, BearerÏÏÏÏÏÏÏÏÏÏÏÏÏÏÏÏÏÏÏÏÏÏÏÏÏÏÏÏÏÏ 2,799,007
18,577 Loeb Holdings PS ÏÏÏÏÏÏÏÏÏÏÏÏÏÏÏÏÏÏÏÏÏÏÏÏÏÏÏÏÏÏÏÏÏÏÏÏÏÏÏÏÏÏÏ 2,897,51212,289 Nestle SA, Registered ÏÏÏÏÏÏÏÏÏÏÏÏÏÏÏÏÏÏÏÏÏÏÏÏÏÏÏÏÏÏÏÏÏÏÏÏÏÏÏÏ 10,333,0413,300 Rieter Holding PC AG ÏÏÏÏÏÏÏÏÏÏÏÏÏÏÏÏÏÏÏÏÏÏÏÏÏÏÏÏÏÏÏÏÏÏÏÏÏÏÏ 699,5391,627 Rig Rentsch, BearerÏÏÏÏÏÏÏÏÏÏÏÏÏÏÏÏÏÏÏÏÏÏÏÏÏÏÏÏÏÏÏÏÏÏÏÏÏÏÏÏÏÏ 2,422,333
100 Saurer N, Registered ÏÏÏÏÏÏÏÏÏÏÏÏÏÏÏÏÏÏÏÏÏÏÏÏÏÏÏÏÏÏÏÏÏÏÏÏÏÏÏÏÏ 43,24780 Saurer I, Bearer ÏÏÏÏÏÏÏÏÏÏÏÏÏÏÏÏÏÏÏÏÏÏÏÏÏÏÏÏÏÏÏÏÏÏÏÏÏÏÏÏÏÏÏÏÏ 164,481
2,320 Sig Schweiz Industrie, Namen (Reg) ÏÏÏÏÏÏÏÏÏÏÏÏÏÏÏÏÏÏÏÏÏÏÏÏÏÏÏ 2,442,5384,635 Sprecher N, Registered ÏÏÏÏÏÏÏÏÏÏÏÏÏÏÏÏÏÏÏÏÏÏÏÏÏÏÏÏÏÏÏÏÏÏÏÏÏÏÏ 1,265,1361,900 Vetropack PCÏÏÏÏÏÏÏÏÏÏÏÏÏÏÏÏÏÏÏÏÏÏÏÏÏÏÏÏÏÏÏÏÏÏÏÏÏÏÏÏÏÏÏÏÏÏÏ 707,1964,524 Zschokke, Reg ÏÏÏÏÏÏÏÏÏÏÏÏÏÏÏÏÏÏÏÏÏÏÏÏÏÏÏÏÏÏÏÏÏÏÏÏÏÏÏÏÏÏÏÏÏÏ 2,429,585
37,800,836
United KingdomÌ7.9%500,000 Albert Fisher Group PLCÏÏÏÏÏÏÏÏÏÏÏÏÏÏÏÏÏÏÏÏÏÏÏÏÏÏÏÏÏÏÏÏÏÏÏÏÏ 457,71415,000 Baldwin PLCÏÏÏÏÏÏÏÏÏÏÏÏÏÏÏÏÏÏÏÏÏÏÏÏÏÏÏÏÏÏÏÏÏÏÏÏÏÏÏÏÏÏÏÏÏÏÏÏ 21,658
1,912,000 British Steel Ord ÏÏÏÏÏÏÏÏÏÏÏÏÏÏÏÏÏÏÏÏÏÏÏÏÏÏÏÏÏÏÏÏÏÏÏÏÏÏÏÏÏÏÏÏ 4,041,339753,000 Folkes Group NV ÏÏÏÏÏÏÏÏÏÏÏÏÏÏÏÏÏÏÏÏÏÏÏÏÏÏÏÏÏÏÏÏÏÏÏÏÏÏÏÏÏÏÏ 448,336
1,950 French Property Trusts ÏÏÏÏÏÏÏÏÏÏÏÏÏÏÏÏÏÏÏÏÏÏÏÏÏÏÏÏÏÏÏÏÏÏÏÏÏÏÏ 2,656833,465 Guinness PLCÏÏÏÏÏÏÏÏÏÏÏÏÏÏÏÏÏÏÏÏÏÏÏÏÏÏÏÏÏÏÏÏÏÏÏÏÏÏÏÏÏÏÏÏÏÏÏ 5,787,460507,000 Higgs & HillÏÏÏÏÏÏÏÏÏÏÏÏÏÏÏÏÏÏÏÏÏÏÏÏÏÏÏÏÏÏÏÏÏÏÏÏÏÏÏÏÏÏÏÏÏÏÏÏ 1,018,804350,000 Johnston Group PLCÏÏÏÏÏÏÏÏÏÏÏÏÏÏÏÏÏÏÏÏÏÏÏÏÏÏÏÏÏÏÏÏÏÏÏÏÏÏÏÏÏ 817,931590,000 McAlpine (Alfred) PLCÏÏÏÏÏÏÏÏÏÏÏÏÏÏÏÏÏÏÏÏÏÏÏÏÏÏÏÏÏÏÏÏÏÏÏÏÏÏ 2,371,182815,000 Owners Abroad ÏÏÏÏÏÏÏÏÏÏÏÏÏÏÏÏÏÏÏÏÏÏÏÏÏÏÏÏÏÏÏÏÏÏÏÏÏÏÏÏÏÏÏÏÏ 1,443,622
1,308,978 Proudfoot Alexander ÏÏÏÏÏÏÏÏÏÏÏÏÏÏÏÏÏÏÏÏÏÏÏÏÏÏÏÏÏÏÏÏÏÏÏÏÏÏÏÏÏ 1,344,406496,225 Tesco PLC ÏÏÏÏÏÏÏÏÏÏÏÏÏÏÏÏÏÏÏÏÏÏÏÏÏÏÏÏÏÏÏÏÏÏÏÏÏÏÏÏÏÏÏÏÏÏÏÏÏ 1,573,285770,000 Triton Europe PLC ÏÏÏÏÏÏÏÏÏÏÏÏÏÏÏÏÏÏÏÏÏÏÏÏÏÏÏÏÏÏÏÏÏÏÏÏÏÏÏÏÏÏ 372,497346,300 Zeneca ÏÏÏÏÏÏÏÏÏÏÏÏÏÏÏÏÏÏÏÏÏÏÏÏÏÏÏÏÏÏÏÏÏÏÏÏÏÏÏÏÏÏÏÏÏÏÏÏÏÏÏÏÏ 3,737,141
23,438,031
United StatesÌ11.6%71,000 American Express CompanyÏÏÏÏÏÏÏÏÏÏÏÏÏÏÏÏÏÏÏÏÏÏÏÏÏÏÏÏÏÏÏÏÏÏÏ 1,961,37522,700 American National Insurance Company ÏÏÏÏÏÏÏÏÏÏÏÏÏÏÏÏÏÏÏÏÏÏÏÏÏ 1,078,25046,000 BanPonce Corporation, New ÏÏÏÏÏÏÏÏÏÏÏÏÏÏÏÏÏÏÏÏÏÏÏÏÏÏÏÏÏÏÏÏÏÏ 1,449,00084,500 Chase Manhattan CorporationÏÏÏÏÏÏÏÏÏÏÏÏÏÏÏÏÏÏÏÏÏÏÏÏÏÏÏÏÏÏÏÏÏ 2,735,68850,000 Comerica Inc. ÏÏÏÏÏÏÏÏÏÏÏÏÏÏÏÏÏÏÏÏÏÏÏÏÏÏÏÏÏÏÏÏÏÏÏÏÏÏÏÏÏÏÏÏÏÏÏ 1,268,750
111,700 Continental Medical Systems‰ ÏÏÏÏÏÏÏÏÏÏÏÏÏÏÏÏÏÏÏÏÏÏÏÏÏÏÏÏÏÏÏÏÏ 1,158,88767,300 Digital Equipment Corporation‰ ÏÏÏÏÏÏÏÏÏÏÏÏÏÏÏÏÏÏÏÏÏÏÏÏÏÏÏÏÏÏÏ 1,985,35035,000 Federal Home Loan Mortgage Corporation ÏÏÏÏÏÏÏÏÏÏÏÏÏÏÏÏÏÏÏÏÏÏ 1,776,25020,000 First Chicago Corporation ÏÏÏÏÏÏÏÏÏÏÏÏÏÏÏÏÏÏÏÏÏÏÏÏÏÏÏÏÏÏÏÏÏÏÏÏ 960,00084,000 Great Atlantic & PaciÑc Tea Company ÏÏÏÏÏÏÏÏÏÏÏÏÏÏÏÏÏÏÏÏÏÏÏÏÏ 2,058,000
m m m m m m m SEE NOTES TO FINANCIAL STATEMENTS m m m m m m m
14

TWEEDY, BROWNE GLOBAL VALUE FUND
Portfolio of Investments
March 31, 1994
MarketValue
Shares (Note 1)
COMMON STOCKSUnited StatesÌ(Continued)
60,000 Hasbro Inc. ÏÏÏÏÏÏÏÏÏÏÏÏÏÏÏÏÏÏÏÏÏÏÏÏÏÏÏÏÏÏÏÏÏÏÏÏÏÏÏÏÏÏÏÏÏÏÏÏÏ $ 2,085,00065,700 Household International Inc. ÏÏÏÏÏÏÏÏÏÏÏÏÏÏÏÏÏÏÏÏÏÏÏÏÏÏÏÏÏÏÏÏÏÏ 1,946,36320,000 Independent Insurance Group Inc. ÏÏÏÏÏÏÏÏÏÏÏÏÏÏÏÏÏÏÏÏÏÏÏÏÏÏÏÏÏ 315,00013,000 JeÅeries Group Inc. ÏÏÏÏÏÏÏÏÏÏÏÏÏÏÏÏÏÏÏÏÏÏÏÏÏÏÏÏÏÏÏÏÏÏÏÏÏÏÏÏÏÏ 481,00050,000 K Mart Stores ÏÏÏÏÏÏÏÏÏÏÏÏÏÏÏÏÏÏÏÏÏÏÏÏÏÏÏÏÏÏÏÏÏÏÏÏÏÏÏÏÏÏÏÏÏÏÏ 906,25060,500 Medical Care America, Inc.‰ ÏÏÏÏÏÏÏÏÏÏÏÏÏÏÏÏÏÏÏÏÏÏÏÏÏÏÏÏÏÏÏÏÏÏ 1,285,62532,500 Mercantile Bancorporation, Inc.ÏÏÏÏÏÏÏÏÏÏÏÏÏÏÏÏÏÏÏÏÏÏÏÏÏÏÏÏÏÏÏÏ 1,555,938
141,000 National Health Labs, Inc. ÏÏÏÏÏÏÏÏÏÏÏÏÏÏÏÏÏÏÏÏÏÏÏÏÏÏÏÏÏÏÏÏÏÏÏÏ 1,885,87550,000 Philip Morris Companies Inc.ÏÏÏÏÏÏÏÏÏÏÏÏÏÏÏÏÏÏÏÏÏÏÏÏÏÏÏÏÏÏÏÏÏÏ 2,537,50015,000 Polaroid CorporationÏÏÏÏÏÏÏÏÏÏÏÏÏÏÏÏÏÏÏÏÏÏÏÏÏÏÏÏÏÏÏÏÏÏÏÏÏÏÏÏÏ 478,12544,500 Reebok International Ltd.ÏÏÏÏÏÏÏÏÏÏÏÏÏÏÏÏÏÏÏÏÏÏÏÏÏÏÏÏÏÏÏÏÏÏÏÏÏ 1,524,12539,200 Salomon Inc.ÏÏÏÏÏÏÏÏÏÏÏÏÏÏÏÏÏÏÏÏÏÏÏÏÏÏÏÏÏÏÏÏÏÏÏÏÏÏÏÏÏÏÏÏÏÏÏÏ 1,896,3007,500 Wells Fargo & Company ÏÏÏÏÏÏÏÏÏÏÏÏÏÏÏÏÏÏÏÏÏÏÏÏÏÏÏÏÏÏÏÏÏÏÏÏÏ 1,045,312
34,373,963
TOTAL COMMON STOCKS(Cost $223,555,909) ÏÏÏÏÏÏÏÏÏÏÏÏÏÏÏÏÏÏÏÏÏÏÏÏÏÏÏÏÏÏÏÏÏÏÏÏÏÏ 254,187,609
PREFERRED STOCKÌ0.3%(Cost $754,067)
1,595 Stuttgarter Hofbrau, Preferred ÏÏÏÏÏÏÏÏÏÏÏÏÏÏÏÏÏÏÏÏÏÏÏÏÏÏÏÏÏÏÏÏÏ 784,066
COMMON STOCK RIGHTSÌ0.0%(Cost $64,091)
373,994 Proudfoot Alexander, Rights, Expires 4/13/94 ÏÏÏÏÏÏÏÏÏÏÏÏÏÏÏÏÏÏÏ 50,102
FaceValue
CONVERTIBLE CORPORATE BONDÌ0.1%(Cost $176,125)
$24,500,000 Grupo Anaya, Convertible Bond, 7.000% due 3/18/98ÏÏÏÏÏÏÏÏÏÏÏÏ 180,346
U.S. TREASURY BILLSÌ0.6%255,000 3.200%** due 6/9/94 ÏÏÏÏÏÏÏÏÏÏÏÏÏÏÏÏÏÏÏÏÏÏÏÏÏÏÏÏÏÏÏÏÏÏÏÏÏÏ 253,310510,000 3.380%** due 8/11/94 ÏÏÏÏÏÏÏÏÏÏÏÏÏÏÏÏÏÏÏÏÏÏÏÏÏÏÏÏÏÏÏÏÏÏÏÏÏ 503,243
1,020,000 3.854%** due 9/1/94 ÏÏÏÏÏÏÏÏÏÏÏÏÏÏÏÏÏÏÏÏÏÏÏÏÏÏÏÏÏÏÏÏÏÏÏÏÏÏ 1,004,163
TOTAL U.S. TREASURY BILLS(Cost $1,760,946)ÏÏÏÏÏÏÏÏÏÏÏÏÏÏÏÏÏÏÏÏÏÏÏÏÏÏÏÏÏÏÏÏÏÏÏÏÏÏÏ 1,760,716
m m m m m m m SEE NOTES TO FINANCIAL STATEMENTS m m m m m m m
15
TWEEDY, BROWNE GLOBAL VALUE FUND
Portfolio of Investments
March 31, 1994
MarketFace ValueValue (Note 1)
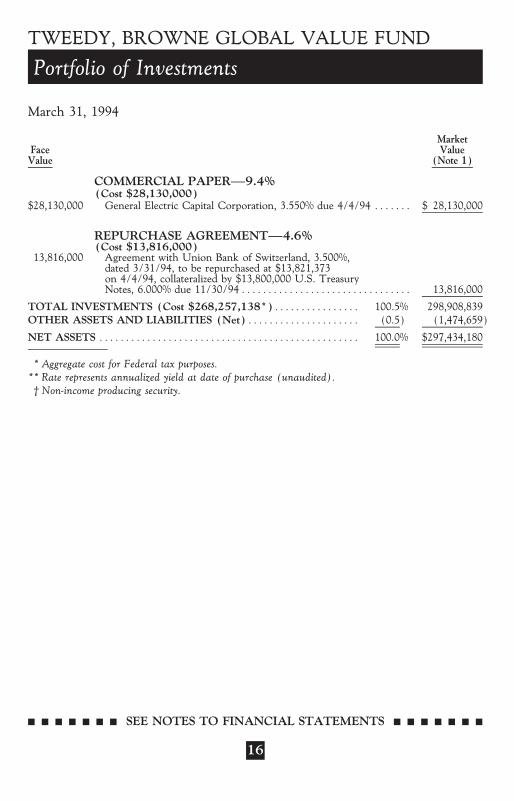
COMMERCIAL PAPERÌ9.4%(Cost $28,130,000)
$28,130,000 General Electric Capital Corporation, 3.550% due 4/4/94 ÏÏÏÏÏÏÏ $ 28,130,000
REPURCHASE AGREEMENTÌ4.6%(Cost $13,816,000)
13,816,000 Agreement with Union Bank of Switzerland, 3.500%,dated 3/31/94, to be repurchased at $13,821,373on 4/4/94, collateralized by $13,800,000 U.S. TreasuryNotes, 6.000% due 11/30/94ÏÏÏÏÏÏÏÏÏÏÏÏÏÏÏÏÏÏÏÏÏÏÏÏÏÏÏÏÏÏÏÏ 13,816,000
TOTAL INVESTMENTS (Cost $268,257,138*)ÏÏÏÏÏÏÏÏÏÏÏÏÏÏÏÏ 100.5% 298,908,839
OTHER ASSETS AND LIABILITIES (Net)ÏÏÏÏÏÏÏÏÏÏÏÏÏÏÏÏÏÏÏÏÏ (0.5) (1,474,659)
NET ASSETS ÏÏÏÏÏÏÏÏÏÏÏÏÏÏÏÏÏÏÏÏÏÏÏÏÏÏÏÏÏÏÏÏÏÏÏÏÏÏÏÏÏÏÏÏÏÏÏÏÏ 100.0% $297,434,180
* Aggregate cost for Federal tax purposes.
** Rate represents annualized yield at date of purchase (unaudited).
‰ Non-income producing security.
m m m m m m m SEE NOTES TO FINANCIAL STATEMENTS m m m m m m m
16

TWEEDY, BROWNE GLOBAL VALUE FUND
Portfolio of Investments
March 31, 1994 (Unaudited)
Percentage Marketof Value
Sector DiversiÑcation Net Assets (Note 1)
COMMON STOCKS:Banking ÏÏÏÏÏÏÏÏÏÏÏÏÏÏÏÏÏÏÏÏÏÏÏÏÏÏÏÏÏÏÏÏÏÏÏÏÏÏÏÏÏÏÏÏÏ 19.5% $ 58,131,326
Food and Beverages ÏÏÏÏÏÏÏÏÏÏÏÏÏÏÏÏÏÏÏÏÏÏÏÏÏÏÏÏÏÏÏÏÏÏÏ 10.0 29,726,671
Financial Services ÏÏÏÏÏÏÏÏÏÏÏÏÏÏÏÏÏÏÏÏÏÏÏÏÏÏÏÏÏÏÏÏÏÏÏÏÏ 7.6 22,684,445
Engineering and Construction ÏÏÏÏÏÏÏÏÏÏÏÏÏÏÏÏÏÏÏÏÏÏÏÏÏÏ 5.3 15,659,436
Mining and Metal FabricationÏÏÏÏÏÏÏÏÏÏÏÏÏÏÏÏÏÏÏÏÏÏÏÏÏÏÏ 4.1 12,232,141
Consumer Non-Durables ÏÏÏÏÏÏÏÏÏÏÏÏÏÏÏÏÏÏÏÏÏÏÏÏÏÏÏÏÏÏÏ 3.9 11,556,577
ChemicalsÏÏÏÏÏÏÏÏÏÏÏÏÏÏÏÏÏÏÏÏÏÏÏÏÏÏÏÏÏÏÏÏÏÏÏÏÏÏÏÏÏÏÏÏ 2.9 8,623,879
TextilesÏÏÏÏÏÏÏÏÏÏÏÏÏÏÏÏÏÏÏÏÏÏÏÏÏÏÏÏÏÏÏÏÏÏÏÏÏÏÏÏÏÏÏÏÏÏ 2.7 8,077,623
Retail ÏÏÏÏÏÏÏÏÏÏÏÏÏÏÏÏÏÏÏÏÏÏÏÏÏÏÏÏÏÏÏÏÏÏÏÏÏÏÏÏÏÏÏÏÏÏÏ 2.7 8,021,666
TransportationÏÏÏÏÏÏÏÏÏÏÏÏÏÏÏÏÏÏÏÏÏÏÏÏÏÏÏÏÏÏÏÏÏÏÏÏÏÏÏÏ 2.3 6,973,154
PaperÏÏÏÏÏÏÏÏÏÏÏÏÏÏÏÏÏÏÏÏÏÏÏÏÏÏÏÏÏÏÏÏÏÏÏÏÏÏÏÏÏÏÏÏÏÏÏÏ 2.1 6,408,300
Multi-IndustriesÏÏÏÏÏÏÏÏÏÏÏÏÏÏÏÏÏÏÏÏÏÏÏÏÏÏÏÏÏÏÏÏÏÏÏÏÏÏÏ 1.9 5,656,347
Health Care ÏÏÏÏÏÏÏÏÏÏÏÏÏÏÏÏÏÏÏÏÏÏÏÏÏÏÏÏÏÏÏÏÏÏÏÏÏÏÏÏÏÏ 1.8 5,234,989
Machinery ÏÏÏÏÏÏÏÏÏÏÏÏÏÏÏÏÏÏÏÏÏÏÏÏÏÏÏÏÏÏÏÏÏÏÏÏÏÏÏÏÏÏÏ 1.6 4,760,220
Electronics ÏÏÏÏÏÏÏÏÏÏÏÏÏÏÏÏÏÏÏÏÏÏÏÏÏÏÏÏÏÏÏÏÏÏÏÏÏÏÏÏÏÏÏ 1.6 4,650,886
Iron and Steel ÏÏÏÏÏÏÏÏÏÏÏÏÏÏÏÏÏÏÏÏÏÏÏÏÏÏÏÏÏÏÏÏÏÏÏÏÏÏÏÏ 1.2 3,425,033
Consumer Durables ÏÏÏÏÏÏÏÏÏÏÏÏÏÏÏÏÏÏÏÏÏÏÏÏÏÏÏÏÏÏÏÏÏÏÏ 1.1 3,197,949
Oil and Gas ÏÏÏÏÏÏÏÏÏÏÏÏÏÏÏÏÏÏÏÏÏÏÏÏÏÏÏÏÏÏÏÏÏÏÏÏÏÏÏÏÏÏ 1.0 2,995,777
Technology and Computers ÏÏÏÏÏÏÏÏÏÏÏÏÏÏÏÏÏÏÏÏÏÏÏÏÏÏÏÏ 1.0 2,857,027
Medical Research and SuppliesÏÏÏÏÏÏÏÏÏÏÏÏÏÏÏÏÏÏÏÏÏÏÏÏÏÏ 1.0 2,852,362
Printing and Publishing ÏÏÏÏÏÏÏÏÏÏÏÏÏÏÏÏÏÏÏÏÏÏÏÏÏÏÏÏÏÏÏÏ 0.9 2,750,108
Autos ÏÏÏÏÏÏÏÏÏÏÏÏÏÏÏÏÏÏÏÏÏÏÏÏÏÏÏÏÏÏÏÏÏÏÏÏÏÏÏÏÏÏÏÏÏÏÏ 0.6 1,845,384
Consumer Services ÏÏÏÏÏÏÏÏÏÏÏÏÏÏÏÏÏÏÏÏÏÏÏÏÏÏÏÏÏÏÏÏÏÏÏÏ 0.5 1,573,284
Leisure ÏÏÏÏÏÏÏÏÏÏÏÏÏÏÏÏÏÏÏÏÏÏÏÏÏÏÏÏÏÏÏÏÏÏÏÏÏÏÏÏÏÏÏÏÏÏ 0.5 1,496,127
Closed-End Funds ÏÏÏÏÏÏÏÏÏÏÏÏÏÏÏÏÏÏÏÏÏÏÏÏÏÏÏÏÏÏÏÏÏÏÏÏ 0.0 2,656
Other ÏÏÏÏÏÏÏÏÏÏÏÏÏÏÏÏÏÏÏÏÏÏÏÏÏÏÏÏÏÏÏÏÏÏÏÏÏÏÏÏÏÏÏÏÏÏÏ 7.7 22,794,242
Total Common Stocks ÏÏÏÏÏÏÏÏÏÏÏÏÏÏÏÏÏÏÏÏÏÏÏÏÏÏÏÏÏÏÏÏ 85.5 254,187,609
Preferred Stock ÏÏÏÏÏÏÏÏÏÏÏÏÏÏÏÏÏÏÏÏÏÏÏÏÏÏÏÏÏÏÏÏÏÏÏÏÏÏ 0.3 784,066
Common Stock Rights ÏÏÏÏÏÏÏÏÏÏÏÏÏÏÏÏÏÏÏÏÏÏÏÏÏÏÏÏÏÏÏÏ 0.0 50,102
Convertible Corporate Bond ÏÏÏÏÏÏÏÏÏÏÏÏÏÏÏÏÏÏÏÏÏÏÏÏÏÏ 0.1 180,346
U.S. Treasury Bills ÏÏÏÏÏÏÏÏÏÏÏÏÏÏÏÏÏÏÏÏÏÏÏÏÏÏÏÏÏÏÏÏÏÏÏ 0.6 1,760,716
Commercial Paper ÏÏÏÏÏÏÏÏÏÏÏÏÏÏÏÏÏÏÏÏÏÏÏÏÏÏÏÏÏÏÏÏÏÏÏ 9.4 28,130,000
Repurchase Agreement ÏÏÏÏÏÏÏÏÏÏÏÏÏÏÏÏÏÏÏÏÏÏÏÏÏÏÏÏÏÏÏ 4.6 13,816,000
Other Assets and Liabilities (Net) ÏÏÏÏÏÏÏÏÏÏÏÏÏÏÏÏÏÏÏÏÏ (0.5) (1,474,659)
Total Investment Portfolio ÏÏÏÏÏÏÏÏÏÏÏÏÏÏÏÏÏÏÏÏÏÏÏÏÏÏÏÏ 100.0% $297,434,180
m m m m m m m SEE NOTES TO FINANCIAL STATEMENTS m m m m m m m
17
TWEEDY, BROWNE GLOBAL VALUE FUND
Schedule of Forward Exchange Contracts
March 31, 1994
Contract MarketValue Value
Contracts Date (Note 1)
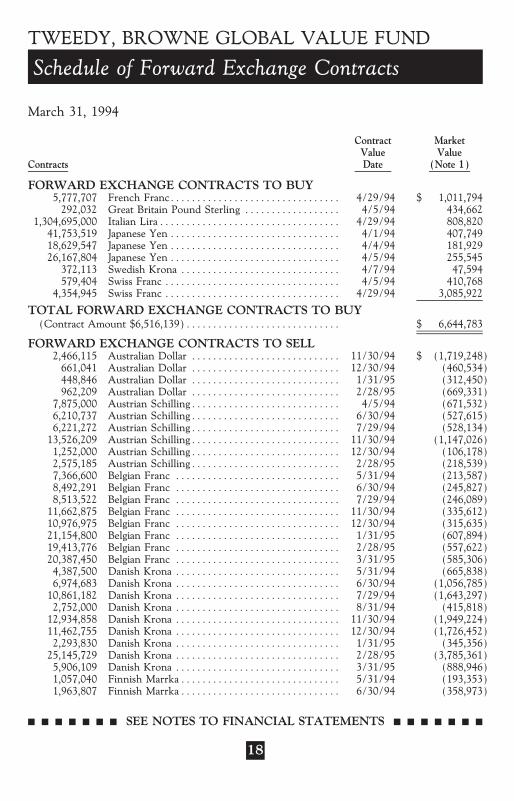
FORWARD EXCHANGE CONTRACTS TO BUY5,777,707 French FrancÏÏÏÏÏÏÏÏÏÏÏÏÏÏÏÏÏÏÏÏÏÏÏÏÏÏÏÏÏÏÏÏ 4/29/94 $ 1,011,794
292,032 Great Britain Pound Sterling ÏÏÏÏÏÏÏÏÏÏÏÏÏÏÏÏÏÏ 4/5/94 434,6621,304,695,000 Italian LiraÏÏÏÏÏÏÏÏÏÏÏÏÏÏÏÏÏÏÏÏÏÏÏÏÏÏÏÏÏÏÏÏÏÏ 4/29/94 808,820
41,753,519 Japanese Yen ÏÏÏÏÏÏÏÏÏÏÏÏÏÏÏÏÏÏÏÏÏÏÏÏÏÏÏÏÏÏÏÏ 4/1/94 407,74918,629,547 Japanese Yen ÏÏÏÏÏÏÏÏÏÏÏÏÏÏÏÏÏÏÏÏÏÏÏÏÏÏÏÏÏÏÏÏ 4/4/94 181,92926,167,804 Japanese Yen ÏÏÏÏÏÏÏÏÏÏÏÏÏÏÏÏÏÏÏÏÏÏÏÏÏÏÏÏÏÏÏÏ 4/5/94 255,545
372,113 Swedish Krona ÏÏÏÏÏÏÏÏÏÏÏÏÏÏÏÏÏÏÏÏÏÏÏÏÏÏÏÏÏÏ 4/7/94 47,594579,404 Swiss Franc ÏÏÏÏÏÏÏÏÏÏÏÏÏÏÏÏÏÏÏÏÏÏÏÏÏÏÏÏÏÏÏÏÏ 4/5/94 410,768
4,354,945 Swiss Franc ÏÏÏÏÏÏÏÏÏÏÏÏÏÏÏÏÏÏÏÏÏÏÏÏÏÏÏÏÏÏÏÏÏ 4/29/94 3,085,922
TOTAL FORWARD EXCHANGE CONTRACTS TO BUY(Contract Amount $6,516,139)ÏÏÏÏÏÏÏÏÏÏÏÏÏÏÏÏÏÏÏÏÏÏÏÏÏÏÏÏÏ $ 6,644,783
FORWARD EXCHANGE CONTRACTS TO SELL2,466,115 Australian Dollar ÏÏÏÏÏÏÏÏÏÏÏÏÏÏÏÏÏÏÏÏÏÏÏÏÏÏÏÏ 11/30/94 $ (1,719,248)
661,041 Australian Dollar ÏÏÏÏÏÏÏÏÏÏÏÏÏÏÏÏÏÏÏÏÏÏÏÏÏÏÏÏ 12/30/94 (460,534)448,846 Australian Dollar ÏÏÏÏÏÏÏÏÏÏÏÏÏÏÏÏÏÏÏÏÏÏÏÏÏÏÏÏ 1/31/95 (312,450)962,209 Australian Dollar ÏÏÏÏÏÏÏÏÏÏÏÏÏÏÏÏÏÏÏÏÏÏÏÏÏÏÏÏ 2/28/95 (669,331)
7,875,000 Austrian SchillingÏÏÏÏÏÏÏÏÏÏÏÏÏÏÏÏÏÏÏÏÏÏÏÏÏÏÏÏ 4/5/94 (671,532)6,210,737 Austrian SchillingÏÏÏÏÏÏÏÏÏÏÏÏÏÏÏÏÏÏÏÏÏÏÏÏÏÏÏÏ 6/30/94 (527,615)6,221,272 Austrian SchillingÏÏÏÏÏÏÏÏÏÏÏÏÏÏÏÏÏÏÏÏÏÏÏÏÏÏÏÏ 7/29/94 (528,134)
13,526,209 Austrian SchillingÏÏÏÏÏÏÏÏÏÏÏÏÏÏÏÏÏÏÏÏÏÏÏÏÏÏÏÏ 11/30/94 (1,147,026)1,252,000 Austrian SchillingÏÏÏÏÏÏÏÏÏÏÏÏÏÏÏÏÏÏÏÏÏÏÏÏÏÏÏÏ 12/30/94 (106,178)2,575,185 Austrian SchillingÏÏÏÏÏÏÏÏÏÏÏÏÏÏÏÏÏÏÏÏÏÏÏÏÏÏÏÏ 2/28/95 (218,539)7,366,600 Belgian Franc ÏÏÏÏÏÏÏÏÏÏÏÏÏÏÏÏÏÏÏÏÏÏÏÏÏÏÏÏÏÏÏ 5/31/94 (213,587)8,492,291 Belgian Franc ÏÏÏÏÏÏÏÏÏÏÏÏÏÏÏÏÏÏÏÏÏÏÏÏÏÏÏÏÏÏÏ 6/30/94 (245,827)8,513,522 Belgian Franc ÏÏÏÏÏÏÏÏÏÏÏÏÏÏÏÏÏÏÏÏÏÏÏÏÏÏÏÏÏÏÏ 7/29/94 (246,089)
11,662,875 Belgian Franc ÏÏÏÏÏÏÏÏÏÏÏÏÏÏÏÏÏÏÏÏÏÏÏÏÏÏÏÏÏÏÏ 11/30/94 (335,612)10,976,975 Belgian Franc ÏÏÏÏÏÏÏÏÏÏÏÏÏÏÏÏÏÏÏÏÏÏÏÏÏÏÏÏÏÏÏ 12/30/94 (315,635)21,154,800 Belgian Franc ÏÏÏÏÏÏÏÏÏÏÏÏÏÏÏÏÏÏÏÏÏÏÏÏÏÏÏÏÏÏÏ 1/31/95 (607,894)19,413,776 Belgian Franc ÏÏÏÏÏÏÏÏÏÏÏÏÏÏÏÏÏÏÏÏÏÏÏÏÏÏÏÏÏÏÏ 2/28/95 (557,622)20,387,450 Belgian Franc ÏÏÏÏÏÏÏÏÏÏÏÏÏÏÏÏÏÏÏÏÏÏÏÏÏÏÏÏÏÏÏ 3/31/95 (585,306)4,387,500 Danish Krona ÏÏÏÏÏÏÏÏÏÏÏÏÏÏÏÏÏÏÏÏÏÏÏÏÏÏÏÏÏÏÏ 5/31/94 (665,838)6,974,683 Danish Krona ÏÏÏÏÏÏÏÏÏÏÏÏÏÏÏÏÏÏÏÏÏÏÏÏÏÏÏÏÏÏÏ 6/30/94 (1,056,785)
10,861,182 Danish Krona ÏÏÏÏÏÏÏÏÏÏÏÏÏÏÏÏÏÏÏÏÏÏÏÏÏÏÏÏÏÏÏ 7/29/94 (1,643,297)2,752,000 Danish Krona ÏÏÏÏÏÏÏÏÏÏÏÏÏÏÏÏÏÏÏÏÏÏÏÏÏÏÏÏÏÏÏ 8/31/94 (415,818)
12,934,858 Danish Krona ÏÏÏÏÏÏÏÏÏÏÏÏÏÏÏÏÏÏÏÏÏÏÏÏÏÏÏÏÏÏÏ 11/30/94 (1,949,224)11,462,755 Danish Krona ÏÏÏÏÏÏÏÏÏÏÏÏÏÏÏÏÏÏÏÏÏÏÏÏÏÏÏÏÏÏÏ 12/30/94 (1,726,452)2,293,830 Danish Krona ÏÏÏÏÏÏÏÏÏÏÏÏÏÏÏÏÏÏÏÏÏÏÏÏÏÏÏÏÏÏÏ 1/31/95 (345,356)
25,145,729 Danish Krona ÏÏÏÏÏÏÏÏÏÏÏÏÏÏÏÏÏÏÏÏÏÏÏÏÏÏÏÏÏÏÏ 2/28/95 (3,785,361)5,906,109 Danish Krona ÏÏÏÏÏÏÏÏÏÏÏÏÏÏÏÏÏÏÏÏÏÏÏÏÏÏÏÏÏÏÏ 3/31/95 (888,946)1,057,040 Finnish MarrkaÏÏÏÏÏÏÏÏÏÏÏÏÏÏÏÏÏÏÏÏÏÏÏÏÏÏÏÏÏÏ 5/31/94 (193,353)1,963,807 Finnish MarrkaÏÏÏÏÏÏÏÏÏÏÏÏÏÏÏÏÏÏÏÏÏÏÏÏÏÏÏÏÏÏ 6/30/94 (358,973)
m m m m m m m SEE NOTES TO FINANCIAL STATEMENTS m m m m m m m
18
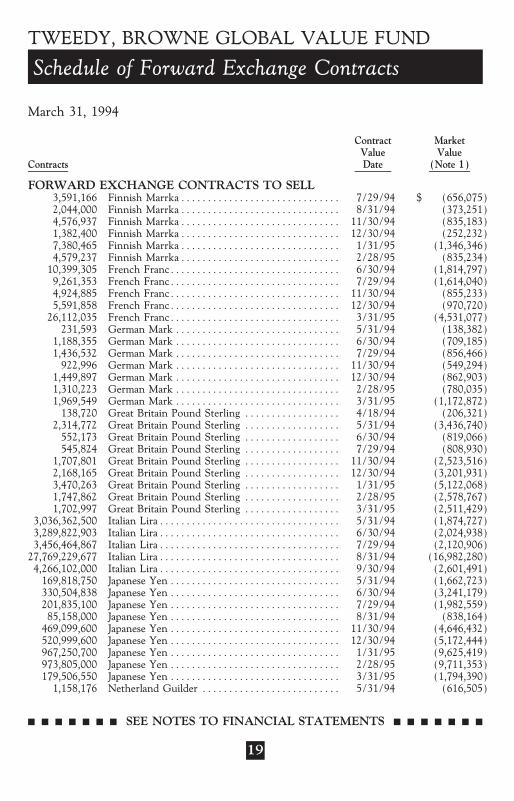
TWEEDY, BROWNE GLOBAL VALUE FUND
Schedule of Forward Exchange Contracts
March 31, 1994
Contract MarketValue Value
Contracts Date (Note 1)
FORWARD EXCHANGE CONTRACTS TO SELL3,591,166 Finnish MarrkaÏÏÏÏÏÏÏÏÏÏÏÏÏÏÏÏÏÏÏÏÏÏÏÏÏÏÏÏÏÏ 7/29/94 $ (656,075)2,044,000 Finnish MarrkaÏÏÏÏÏÏÏÏÏÏÏÏÏÏÏÏÏÏÏÏÏÏÏÏÏÏÏÏÏÏ 8/31/94 (373,251)4,576,937 Finnish MarrkaÏÏÏÏÏÏÏÏÏÏÏÏÏÏÏÏÏÏÏÏÏÏÏÏÏÏÏÏÏÏ 11/30/94 (835,183)1,382,400 Finnish MarrkaÏÏÏÏÏÏÏÏÏÏÏÏÏÏÏÏÏÏÏÏÏÏÏÏÏÏÏÏÏÏ 12/30/94 (252,232)7,380,465 Finnish MarrkaÏÏÏÏÏÏÏÏÏÏÏÏÏÏÏÏÏÏÏÏÏÏÏÏÏÏÏÏÏÏ 1/31/95 (1,346,346)4,579,237 Finnish MarrkaÏÏÏÏÏÏÏÏÏÏÏÏÏÏÏÏÏÏÏÏÏÏÏÏÏÏÏÏÏÏ 2/28/95 (835,234)
10,399,305 French FrancÏÏÏÏÏÏÏÏÏÏÏÏÏÏÏÏÏÏÏÏÏÏÏÏÏÏÏÏÏÏÏÏ 6/30/94 (1,814,797)9,261,353 French FrancÏÏÏÏÏÏÏÏÏÏÏÏÏÏÏÏÏÏÏÏÏÏÏÏÏÏÏÏÏÏÏÏ 7/29/94 (1,614,040)4,924,885 French FrancÏÏÏÏÏÏÏÏÏÏÏÏÏÏÏÏÏÏÏÏÏÏÏÏÏÏÏÏÏÏÏÏ 11/30/94 (855,233)5,591,858 French FrancÏÏÏÏÏÏÏÏÏÏÏÏÏÏÏÏÏÏÏÏÏÏÏÏÏÏÏÏÏÏÏÏ 12/30/94 (970,720)
26,112,035 French FrancÏÏÏÏÏÏÏÏÏÏÏÏÏÏÏÏÏÏÏÏÏÏÏÏÏÏÏÏÏÏÏÏ 3/31/95 (4,531,077)231,593 German Mark ÏÏÏÏÏÏÏÏÏÏÏÏÏÏÏÏÏÏÏÏÏÏÏÏÏÏÏÏÏÏÏ 5/31/94 (138,382)
1,188,355 German Mark ÏÏÏÏÏÏÏÏÏÏÏÏÏÏÏÏÏÏÏÏÏÏÏÏÏÏÏÏÏÏÏ 6/30/94 (709,185)1,436,532 German Mark ÏÏÏÏÏÏÏÏÏÏÏÏÏÏÏÏÏÏÏÏÏÏÏÏÏÏÏÏÏÏÏ 7/29/94 (856,466)
922,996 German Mark ÏÏÏÏÏÏÏÏÏÏÏÏÏÏÏÏÏÏÏÏÏÏÏÏÏÏÏÏÏÏÏ 11/30/94 (549,294)1,449,897 German Mark ÏÏÏÏÏÏÏÏÏÏÏÏÏÏÏÏÏÏÏÏÏÏÏÏÏÏÏÏÏÏÏ 12/30/94 (862,903)1,310,223 German Mark ÏÏÏÏÏÏÏÏÏÏÏÏÏÏÏÏÏÏÏÏÏÏÏÏÏÏÏÏÏÏÏ 2/28/95 (780,035)1,969,549 German Mark ÏÏÏÏÏÏÏÏÏÏÏÏÏÏÏÏÏÏÏÏÏÏÏÏÏÏÏÏÏÏÏ 3/31/95 (1,172,872)
138,720 Great Britain Pound Sterling ÏÏÏÏÏÏÏÏÏÏÏÏÏÏÏÏÏÏ 4/18/94 (206,321)2,314,772 Great Britain Pound Sterling ÏÏÏÏÏÏÏÏÏÏÏÏÏÏÏÏÏÏ 5/31/94 (3,436,740)
552,173 Great Britain Pound Sterling ÏÏÏÏÏÏÏÏÏÏÏÏÏÏÏÏÏÏ 6/30/94 (819,066)545,824 Great Britain Pound Sterling ÏÏÏÏÏÏÏÏÏÏÏÏÏÏÏÏÏÏ 7/29/94 (808,930)
1,707,801 Great Britain Pound Sterling ÏÏÏÏÏÏÏÏÏÏÏÏÏÏÏÏÏÏ 11/30/94 (2,523,516)2,168,165 Great Britain Pound Sterling ÏÏÏÏÏÏÏÏÏÏÏÏÏÏÏÏÏÏ 12/30/94 (3,201,931)3,470,263 Great Britain Pound Sterling ÏÏÏÏÏÏÏÏÏÏÏÏÏÏÏÏÏÏ 1/31/95 (5,122,068)1,747,862 Great Britain Pound Sterling ÏÏÏÏÏÏÏÏÏÏÏÏÏÏÏÏÏÏ 2/28/95 (2,578,767)1,702,997 Great Britain Pound Sterling ÏÏÏÏÏÏÏÏÏÏÏÏÏÏÏÏÏÏ 3/31/95 (2,511,429)
3,036,362,500 Italian LiraÏÏÏÏÏÏÏÏÏÏÏÏÏÏÏÏÏÏÏÏÏÏÏÏÏÏÏÏÏÏÏÏÏÏ 5/31/94 (1,874,727)3,289,822,903 Italian LiraÏÏÏÏÏÏÏÏÏÏÏÏÏÏÏÏÏÏÏÏÏÏÏÏÏÏÏÏÏÏÏÏÏÏ 6/30/94 (2,024,938)3,456,464,867 Italian LiraÏÏÏÏÏÏÏÏÏÏÏÏÏÏÏÏÏÏÏÏÏÏÏÏÏÏÏÏÏÏÏÏÏÏ 7/29/94 (2,120,906)
27,769,229,677 Italian LiraÏÏÏÏÏÏÏÏÏÏÏÏÏÏÏÏÏÏÏÏÏÏÏÏÏÏÏÏÏÏÏÏÏÏ 8/31/94 (16,982,280)4,266,102,000 Italian LiraÏÏÏÏÏÏÏÏÏÏÏÏÏÏÏÏÏÏÏÏÏÏÏÏÏÏÏÏÏÏÏÏÏÏ 9/30/94 (2,601,491)
169,818,750 Japanese Yen ÏÏÏÏÏÏÏÏÏÏÏÏÏÏÏÏÏÏÏÏÏÏÏÏÏÏÏÏÏÏÏÏ 5/31/94 (1,662,723)330,504,838 Japanese Yen ÏÏÏÏÏÏÏÏÏÏÏÏÏÏÏÏÏÏÏÏÏÏÏÏÏÏÏÏÏÏÏÏ 6/30/94 (3,241,179)201,835,100 Japanese Yen ÏÏÏÏÏÏÏÏÏÏÏÏÏÏÏÏÏÏÏÏÏÏÏÏÏÏÏÏÏÏÏÏ 7/29/94 (1,982,559)85,158,000 Japanese Yen ÏÏÏÏÏÏÏÏÏÏÏÏÏÏÏÏÏÏÏÏÏÏÏÏÏÏÏÏÏÏÏÏ 8/31/94 (838,164)
469,099,600 Japanese Yen ÏÏÏÏÏÏÏÏÏÏÏÏÏÏÏÏÏÏÏÏÏÏÏÏÏÏÏÏÏÏÏÏ 11/30/94 (4,646,432)520,999,600 Japanese Yen ÏÏÏÏÏÏÏÏÏÏÏÏÏÏÏÏÏÏÏÏÏÏÏÏÏÏÏÏÏÏÏÏ 12/30/94 (5,172,444)967,250,700 Japanese Yen ÏÏÏÏÏÏÏÏÏÏÏÏÏÏÏÏÏÏÏÏÏÏÏÏÏÏÏÏÏÏÏÏ 1/31/95 (9,625,419)973,805,000 Japanese Yen ÏÏÏÏÏÏÏÏÏÏÏÏÏÏÏÏÏÏÏÏÏÏÏÏÏÏÏÏÏÏÏÏ 2/28/95 (9,711,353)179,506,550 Japanese Yen ÏÏÏÏÏÏÏÏÏÏÏÏÏÏÏÏÏÏÏÏÏÏÏÏÏÏÏÏÏÏÏÏ 3/31/95 (1,794,390)
1,158,176 Netherland Guilder ÏÏÏÏÏÏÏÏÏÏÏÏÏÏÏÏÏÏÏÏÏÏÏÏÏÏ 5/31/94 (616,505)
m m m m m m m SEE NOTES TO FINANCIAL STATEMENTS m m m m m m m
19
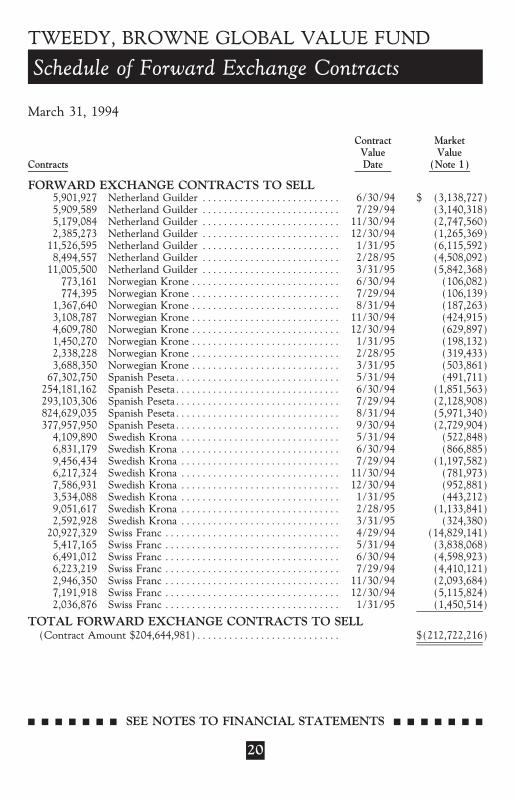
TWEEDY, BROWNE GLOBAL VALUE FUND
Schedule of Forward Exchange Contracts
March 31, 1994
Contract MarketValue Value
Contracts Date (Note 1)
FORWARD EXCHANGE CONTRACTS TO SELL5,901,927 Netherland Guilder ÏÏÏÏÏÏÏÏÏÏÏÏÏÏÏÏÏÏÏÏÏÏÏÏÏÏ 6/30/94 $ (3,138,727)5,909,589 Netherland Guilder ÏÏÏÏÏÏÏÏÏÏÏÏÏÏÏÏÏÏÏÏÏÏÏÏÏÏ 7/29/94 (3,140,318)5,179,084 Netherland Guilder ÏÏÏÏÏÏÏÏÏÏÏÏÏÏÏÏÏÏÏÏÏÏÏÏÏÏ 11/30/94 (2,747,560)2,385,273 Netherland Guilder ÏÏÏÏÏÏÏÏÏÏÏÏÏÏÏÏÏÏÏÏÏÏÏÏÏÏ 12/30/94 (1,265,369)
11,526,595 Netherland Guilder ÏÏÏÏÏÏÏÏÏÏÏÏÏÏÏÏÏÏÏÏÏÏÏÏÏÏ 1/31/95 (6,115,592)8,494,557 Netherland Guilder ÏÏÏÏÏÏÏÏÏÏÏÏÏÏÏÏÏÏÏÏÏÏÏÏÏÏ 2/28/95 (4,508,092)
11,005,500 Netherland Guilder ÏÏÏÏÏÏÏÏÏÏÏÏÏÏÏÏÏÏÏÏÏÏÏÏÏÏ 3/31/95 (5,842,368)773,161 Norwegian Krone ÏÏÏÏÏÏÏÏÏÏÏÏÏÏÏÏÏÏÏÏÏÏÏÏÏÏÏÏ 6/30/94 (106,082)774,395 Norwegian Krone ÏÏÏÏÏÏÏÏÏÏÏÏÏÏÏÏÏÏÏÏÏÏÏÏÏÏÏÏ 7/29/94 (106,139)
1,367,640 Norwegian Krone ÏÏÏÏÏÏÏÏÏÏÏÏÏÏÏÏÏÏÏÏÏÏÏÏÏÏÏÏ 8/31/94 (187,263)3,108,787 Norwegian Krone ÏÏÏÏÏÏÏÏÏÏÏÏÏÏÏÏÏÏÏÏÏÏÏÏÏÏÏÏ 11/30/94 (424,915)4,609,780 Norwegian Krone ÏÏÏÏÏÏÏÏÏÏÏÏÏÏÏÏÏÏÏÏÏÏÏÏÏÏÏÏ 12/30/94 (629,897)1,450,270 Norwegian Krone ÏÏÏÏÏÏÏÏÏÏÏÏÏÏÏÏÏÏÏÏÏÏÏÏÏÏÏÏ 1/31/95 (198,132)2,338,228 Norwegian Krone ÏÏÏÏÏÏÏÏÏÏÏÏÏÏÏÏÏÏÏÏÏÏÏÏÏÏÏÏ 2/28/95 (319,433)3,688,350 Norwegian Krone ÏÏÏÏÏÏÏÏÏÏÏÏÏÏÏÏÏÏÏÏÏÏÏÏÏÏÏÏ 3/31/95 (503,861)
67,302,750 Spanish PesetaÏÏÏÏÏÏÏÏÏÏÏÏÏÏÏÏÏÏÏÏÏÏÏÏÏÏÏÏÏÏÏ 5/31/94 (491,711)254,181,162 Spanish PesetaÏÏÏÏÏÏÏÏÏÏÏÏÏÏÏÏÏÏÏÏÏÏÏÏÏÏÏÏÏÏÏ 6/30/94 (1,851,563)293,103,306 Spanish PesetaÏÏÏÏÏÏÏÏÏÏÏÏÏÏÏÏÏÏÏÏÏÏÏÏÏÏÏÏÏÏÏ 7/29/94 (2,128,908)824,629,035 Spanish PesetaÏÏÏÏÏÏÏÏÏÏÏÏÏÏÏÏÏÏÏÏÏÏÏÏÏÏÏÏÏÏÏ 8/31/94 (5,971,340)377,957,950 Spanish PesetaÏÏÏÏÏÏÏÏÏÏÏÏÏÏÏÏÏÏÏÏÏÏÏÏÏÏÏÏÏÏÏ 9/30/94 (2,729,904)
4,109,890 Swedish Krona ÏÏÏÏÏÏÏÏÏÏÏÏÏÏÏÏÏÏÏÏÏÏÏÏÏÏÏÏÏÏ 5/31/94 (522,848)6,831,179 Swedish Krona ÏÏÏÏÏÏÏÏÏÏÏÏÏÏÏÏÏÏÏÏÏÏÏÏÏÏÏÏÏÏ 6/30/94 (866,885)9,456,434 Swedish Krona ÏÏÏÏÏÏÏÏÏÏÏÏÏÏÏÏÏÏÏÏÏÏÏÏÏÏÏÏÏÏ 7/29/94 (1,197,582)6,217,324 Swedish Krona ÏÏÏÏÏÏÏÏÏÏÏÏÏÏÏÏÏÏÏÏÏÏÏÏÏÏÏÏÏÏ 11/30/94 (781,973)7,586,931 Swedish Krona ÏÏÏÏÏÏÏÏÏÏÏÏÏÏÏÏÏÏÏÏÏÏÏÏÏÏÏÏÏÏ 12/30/94 (952,881)3,534,088 Swedish Krona ÏÏÏÏÏÏÏÏÏÏÏÏÏÏÏÏÏÏÏÏÏÏÏÏÏÏÏÏÏÏ 1/31/95 (443,212)9,051,617 Swedish Krona ÏÏÏÏÏÏÏÏÏÏÏÏÏÏÏÏÏÏÏÏÏÏÏÏÏÏÏÏÏÏ 2/28/95 (1,133,841)2,592,928 Swedish Krona ÏÏÏÏÏÏÏÏÏÏÏÏÏÏÏÏÏÏÏÏÏÏÏÏÏÏÏÏÏÏ 3/31/95 (324,380)
20,927,329 Swiss Franc ÏÏÏÏÏÏÏÏÏÏÏÏÏÏÏÏÏÏÏÏÏÏÏÏÏÏÏÏÏÏÏÏÏ 4/29/94 (14,829,141)5,417,165 Swiss Franc ÏÏÏÏÏÏÏÏÏÏÏÏÏÏÏÏÏÏÏÏÏÏÏÏÏÏÏÏÏÏÏÏÏ 5/31/94 (3,838,068)6,491,012 Swiss Franc ÏÏÏÏÏÏÏÏÏÏÏÏÏÏÏÏÏÏÏÏÏÏÏÏÏÏÏÏÏÏÏÏÏ 6/30/94 (4,598,923)6,223,219 Swiss Franc ÏÏÏÏÏÏÏÏÏÏÏÏÏÏÏÏÏÏÏÏÏÏÏÏÏÏÏÏÏÏÏÏÏ 7/29/94 (4,410,121)2,946,350 Swiss Franc ÏÏÏÏÏÏÏÏÏÏÏÏÏÏÏÏÏÏÏÏÏÏÏÏÏÏÏÏÏÏÏÏÏ 11/30/94 (2,093,684)7,191,918 Swiss Franc ÏÏÏÏÏÏÏÏÏÏÏÏÏÏÏÏÏÏÏÏÏÏÏÏÏÏÏÏÏÏÏÏÏ 12/30/94 (5,115,824)2,036,876 Swiss Franc ÏÏÏÏÏÏÏÏÏÏÏÏÏÏÏÏÏÏÏÏÏÏÏÏÏÏÏÏÏÏÏÏÏ 1/31/95 (1,450,514)
TOTAL FORWARD EXCHANGE CONTRACTS TO SELL(Contract Amount $204,644,981)ÏÏÏÏÏÏÏÏÏÏÏÏÏÏÏÏÏÏÏÏÏÏÏÏÏÏÏ $(212,722,216)
m m m m m m m SEE NOTES TO FINANCIAL STATEMENTS m m m m m m m
20
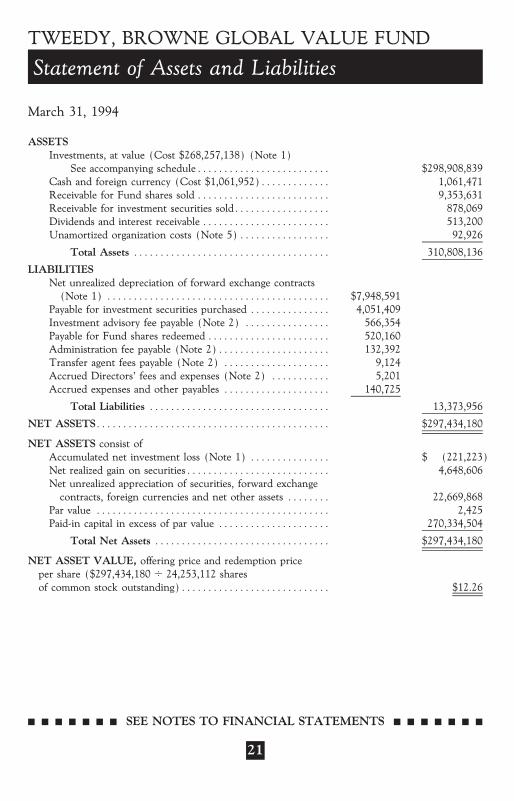
TWEEDY, BROWNE GLOBAL VALUE FUND
Statement of Assets and Liabilities
March 31, 1994
ASSETSInvestments, at value (Cost $268,257,138) (Note 1)
See accompanying scheduleÏÏÏÏÏÏÏÏÏÏÏÏÏÏÏÏÏÏÏÏÏÏÏÏÏ $298,908,839
Cash and foreign currency (Cost $1,061,952)ÏÏÏÏÏÏÏÏÏÏÏÏÏ 1,061,471
Receivable for Fund shares sold ÏÏÏÏÏÏÏÏÏÏÏÏÏÏÏÏÏÏÏÏÏÏÏÏÏ 9,353,631
Receivable for investment securities soldÏÏÏÏÏÏÏÏÏÏÏÏÏÏÏÏÏÏ 878,069
Dividends and interest receivable ÏÏÏÏÏÏÏÏÏÏÏÏÏÏÏÏÏÏÏÏÏÏÏÏ 513,200
Unamortized organization costs (Note 5)ÏÏÏÏÏÏÏÏÏÏÏÏÏÏÏÏÏ 92,926
Total Assets ÏÏÏÏÏÏÏÏÏÏÏÏÏÏÏÏÏÏÏÏÏÏÏÏÏÏÏÏÏÏÏÏÏÏÏÏÏ 310,808,136
LIABILITIESNet unrealized depreciation of forward exchange contracts
(Note 1) ÏÏÏÏÏÏÏÏÏÏÏÏÏÏÏÏÏÏÏÏÏÏÏÏÏÏÏÏÏÏÏÏÏÏÏÏÏÏÏÏÏÏ $7,948,591
Payable for investment securities purchased ÏÏÏÏÏÏÏÏÏÏÏÏÏÏÏ 4,051,409
Investment advisory fee payable (Note 2) ÏÏÏÏÏÏÏÏÏÏÏÏÏÏÏÏ 566,354
Payable for Fund shares redeemed ÏÏÏÏÏÏÏÏÏÏÏÏÏÏÏÏÏÏÏÏÏÏÏ 520,160
Administration fee payable (Note 2)ÏÏÏÏÏÏÏÏÏÏÏÏÏÏÏÏÏÏÏÏÏ 132,392
Transfer agent fees payable (Note 2) ÏÏÏÏÏÏÏÏÏÏÏÏÏÏÏÏÏÏÏÏ 9,124
Accrued Directors' fees and expenses (Note 2) ÏÏÏÏÏÏÏÏÏÏÏ 5,201
Accrued expenses and other payables ÏÏÏÏÏÏÏÏÏÏÏÏÏÏÏÏÏÏÏÏ 140,725
Total Liabilities ÏÏÏÏÏÏÏÏÏÏÏÏÏÏÏÏÏÏÏÏÏÏÏÏÏÏÏÏÏÏÏÏÏÏ 13,373,956
NET ASSETSÏÏÏÏÏÏÏÏÏÏÏÏÏÏÏÏÏÏÏÏÏÏÏÏÏÏÏÏÏÏÏÏÏÏÏÏÏÏÏÏÏÏÏÏ $297,434,180
NET ASSETS consist of
Accumulated net investment loss (Note 1) ÏÏÏÏÏÏÏÏÏÏÏÏÏÏÏ $ (221,223)
Net realized gain on securitiesÏÏÏÏÏÏÏÏÏÏÏÏÏÏÏÏÏÏÏÏÏÏÏÏÏÏÏ 4,648,606
Net unrealized appreciation of securities, forward exchange
contracts, foreign currencies and net other assets ÏÏÏÏÏÏÏÏ 22,669,868
Par value ÏÏÏÏÏÏÏÏÏÏÏÏÏÏÏÏÏÏÏÏÏÏÏÏÏÏÏÏÏÏÏÏÏÏÏÏÏÏÏÏÏÏÏÏ 2,425
Paid-in capital in excess of par value ÏÏÏÏÏÏÏÏÏÏÏÏÏÏÏÏÏÏÏÏÏ 270,334,504
Total Net Assets ÏÏÏÏÏÏÏÏÏÏÏÏÏÏÏÏÏÏÏÏÏÏÏÏÏÏÏÏÏÏÏÏÏ $297,434,180
NET ASSET VALUE, oÅering price and redemption price
per share ($297,434,180 § 24,253,112 shares
of common stock outstanding)ÏÏÏÏÏÏÏÏÏÏÏÏÏÏÏÏÏÏÏÏÏÏÏÏÏÏÏÏ $12.26
m m m m m m m SEE NOTES TO FINANCIAL STATEMENTS m m m m m m m
21
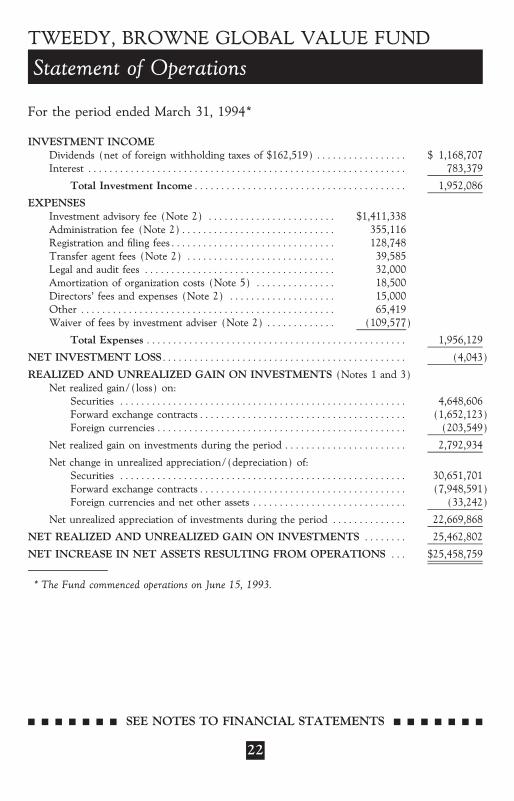
TWEEDY, BROWNE GLOBAL VALUE FUND
Statement of Operations
For the period ended March 31, 1994*
INVESTMENT INCOMEDividends (net of foreign withholding taxes of $162,519) ÏÏÏÏÏÏÏÏÏÏÏÏÏÏÏÏÏ $ 1,168,707
Interest ÏÏÏÏÏÏÏÏÏÏÏÏÏÏÏÏÏÏÏÏÏÏÏÏÏÏÏÏÏÏÏÏÏÏÏÏÏÏÏÏÏÏÏÏÏÏÏÏÏÏÏÏÏÏÏÏÏÏÏÏ 783,379
Total Investment IncomeÏÏÏÏÏÏÏÏÏÏÏÏÏÏÏÏÏÏÏÏÏÏÏÏÏÏÏÏÏÏÏÏÏÏÏÏÏÏÏÏ 1,952,086
EXPENSESInvestment advisory fee (Note 2) ÏÏÏÏÏÏÏÏÏÏÏÏÏÏÏÏÏÏÏÏÏÏÏÏ $1,411,338
Administration fee (Note 2)ÏÏÏÏÏÏÏÏÏÏÏÏÏÏÏÏÏÏÏÏÏÏÏÏÏÏÏÏÏ 355,116
Registration and Ñling feesÏÏÏÏÏÏÏÏÏÏÏÏÏÏÏÏÏÏÏÏÏÏÏÏÏÏÏÏÏÏÏ 128,748
Transfer agent fees (Note 2) ÏÏÏÏÏÏÏÏÏÏÏÏÏÏÏÏÏÏÏÏÏÏÏÏÏÏÏÏ 39,585
Legal and audit fees ÏÏÏÏÏÏÏÏÏÏÏÏÏÏÏÏÏÏÏÏÏÏÏÏÏÏÏÏÏÏÏÏÏÏÏÏ 32,000
Amortization of organization costs (Note 5) ÏÏÏÏÏÏÏÏÏÏÏÏÏÏÏ 18,500
Directors' fees and expenses (Note 2) ÏÏÏÏÏÏÏÏÏÏÏÏÏÏÏÏÏÏÏÏ 15,000
Other ÏÏÏÏÏÏÏÏÏÏÏÏÏÏÏÏÏÏÏÏÏÏÏÏÏÏÏÏÏÏÏÏÏÏÏÏÏÏÏÏÏÏÏÏÏÏÏÏ 65,419
Waiver of fees by investment adviser (Note 2) ÏÏÏÏÏÏÏÏÏÏÏÏÏ (109,577)
Total Expenses ÏÏÏÏÏÏÏÏÏÏÏÏÏÏÏÏÏÏÏÏÏÏÏÏÏÏÏÏÏÏÏÏÏÏÏÏÏÏÏÏÏÏÏÏÏÏÏÏÏ 1,956,129
NET INVESTMENT LOSSÏÏÏÏÏÏÏÏÏÏÏÏÏÏÏÏÏÏÏÏÏÏÏÏÏÏÏÏÏÏÏÏÏÏÏÏÏÏÏÏÏÏÏÏÏÏ (4,043)
REALIZED AND UNREALIZED GAIN ON INVESTMENTS (Notes 1 and 3)
Net realized gain/(loss) on:
Securities ÏÏÏÏÏÏÏÏÏÏÏÏÏÏÏÏÏÏÏÏÏÏÏÏÏÏÏÏÏÏÏÏÏÏÏÏÏÏÏÏÏÏÏÏÏÏÏÏÏÏÏÏÏÏ 4,648,606
Forward exchange contractsÏÏÏÏÏÏÏÏÏÏÏÏÏÏÏÏÏÏÏÏÏÏÏÏÏÏÏÏÏÏÏÏÏÏÏÏÏÏÏ (1,652,123)
Foreign currenciesÏÏÏÏÏÏÏÏÏÏÏÏÏÏÏÏÏÏÏÏÏÏÏÏÏÏÏÏÏÏÏÏÏÏÏÏÏÏÏÏÏÏÏÏÏÏÏ (203,549)
Net realized gain on investments during the period ÏÏÏÏÏÏÏÏÏÏÏÏÏÏÏÏÏÏÏÏÏÏÏ 2,792,934
Net change in unrealized appreciation/(depreciation) of:
Securities ÏÏÏÏÏÏÏÏÏÏÏÏÏÏÏÏÏÏÏÏÏÏÏÏÏÏÏÏÏÏÏÏÏÏÏÏÏÏÏÏÏÏÏÏÏÏÏÏÏÏÏÏÏÏ 30,651,701
Forward exchange contractsÏÏÏÏÏÏÏÏÏÏÏÏÏÏÏÏÏÏÏÏÏÏÏÏÏÏÏÏÏÏÏÏÏÏÏÏÏÏÏ (7,948,591)
Foreign currencies and net other assets ÏÏÏÏÏÏÏÏÏÏÏÏÏÏÏÏÏÏÏÏÏÏÏÏÏÏÏÏÏ (33,242)
Net unrealized appreciation of investments during the period ÏÏÏÏÏÏÏÏÏÏÏÏÏÏ 22,669,868
NET REALIZED AND UNREALIZED GAIN ON INVESTMENTS ÏÏÏÏÏÏÏÏ 25,462,802
NET INCREASE IN NET ASSETS RESULTING FROM OPERATIONS ÏÏÏ $25,458,759
* The Fund commenced operations on June 15, 1993.
m m m m m m m SEE NOTES TO FINANCIAL STATEMENTS m m m m m m m
22
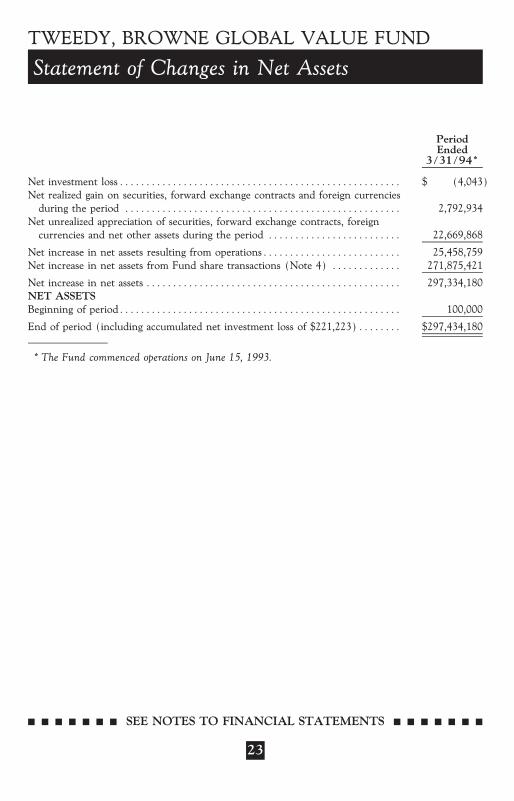
TWEEDY, BROWNE GLOBAL VALUE FUND
Statement of Changes in Net Assets
PeriodEnded
3/31/94*
Net investment lossÏÏÏÏÏÏÏÏÏÏÏÏÏÏÏÏÏÏÏÏÏÏÏÏÏÏÏÏÏÏÏÏÏÏÏÏÏÏÏÏÏÏÏÏÏÏÏÏÏÏÏÏÏ $ (4,043)
Net realized gain on securities, forward exchange contracts and foreign currencies
during the period ÏÏÏÏÏÏÏÏÏÏÏÏÏÏÏÏÏÏÏÏÏÏÏÏÏÏÏÏÏÏÏÏÏÏÏÏÏÏÏÏÏÏÏÏÏÏÏÏÏÏÏÏ 2,792,934
Net unrealized appreciation of securities, forward exchange contracts, foreign
currencies and net other assets during the period ÏÏÏÏÏÏÏÏÏÏÏÏÏÏÏÏÏÏÏÏÏÏÏÏÏ 22,669,868
Net increase in net assets resulting from operationsÏÏÏÏÏÏÏÏÏÏÏÏÏÏÏÏÏÏÏÏÏÏÏÏÏÏ 25,458,759
Net increase in net assets from Fund share transactions (Note 4) ÏÏÏÏÏÏÏÏÏÏÏÏÏ 271,875,421
Net increase in net assets ÏÏÏÏÏÏÏÏÏÏÏÏÏÏÏÏÏÏÏÏÏÏÏÏÏÏÏÏÏÏÏÏÏÏÏÏÏÏÏÏÏÏÏÏÏÏÏÏ 297,334,180
NET ASSETSBeginning of periodÏÏÏÏÏÏÏÏÏÏÏÏÏÏÏÏÏÏÏÏÏÏÏÏÏÏÏÏÏÏÏÏÏÏÏÏÏÏÏÏÏÏÏÏÏÏÏÏÏÏÏÏÏ 100,000
End of period (including accumulated net investment loss of $221,223)ÏÏÏÏÏÏÏÏ $297,434,180
* The Fund commenced operations on June 15, 1993.
m m m m m m m SEE NOTES TO FINANCIAL STATEMENTS m m m m m m m
23
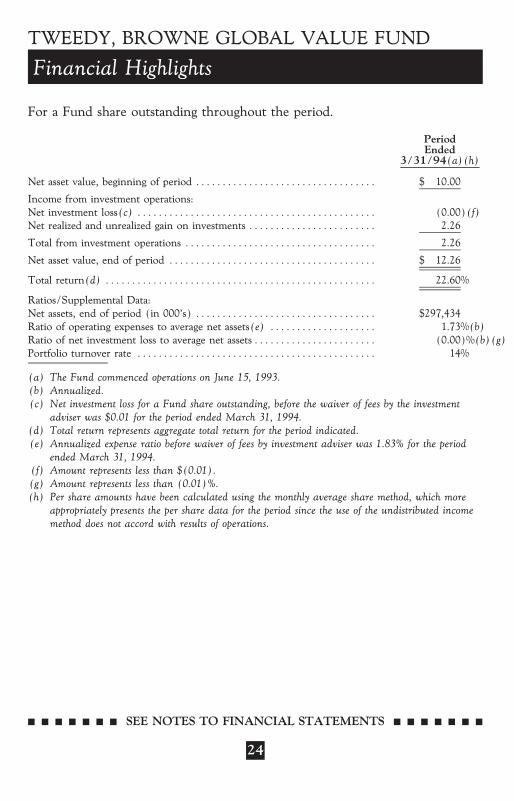
TWEEDY, BROWNE GLOBAL VALUE FUND
Financial Highlights
For a Fund share outstanding throughout the period.
PeriodEnded
3/31/94(a)(h)
Net asset value, beginning of period ÏÏÏÏÏÏÏÏÏÏÏÏÏÏÏÏÏÏÏÏÏÏÏÏÏÏÏÏÏÏÏÏÏÏ $ 10.00
Income from investment operations:
Net investment loss(c) ÏÏÏÏÏÏÏÏÏÏÏÏÏÏÏÏÏÏÏÏÏÏÏÏÏÏÏÏÏÏÏÏÏÏÏÏÏÏÏÏÏÏÏÏÏ (0.00)(f)
Net realized and unrealized gain on investments ÏÏÏÏÏÏÏÏÏÏÏÏÏÏÏÏÏÏÏÏÏÏÏÏ 2.26
Total from investment operations ÏÏÏÏÏÏÏÏÏÏÏÏÏÏÏÏÏÏÏÏÏÏÏÏÏÏÏÏÏÏÏÏÏÏÏÏ 2.26
Net asset value, end of period ÏÏÏÏÏÏÏÏÏÏÏÏÏÏÏÏÏÏÏÏÏÏÏÏÏÏÏÏÏÏÏÏÏÏÏÏÏÏÏ $ 12.26
Total return(d) ÏÏÏÏÏÏÏÏÏÏÏÏÏÏÏÏÏÏÏÏÏÏÏÏÏÏÏÏÏÏÏÏÏÏÏÏÏÏÏÏÏÏÏÏÏÏÏÏÏÏÏ 22.60%
Ratios/Supplemental Data:
Net assets, end of period (in 000's) ÏÏÏÏÏÏÏÏÏÏÏÏÏÏÏÏÏÏÏÏÏÏÏÏÏÏÏÏÏÏÏÏÏÏ $297,434
Ratio of operating expenses to average net assets(e) ÏÏÏÏÏÏÏÏÏÏÏÏÏÏÏÏÏÏÏÏ 1.73%(b)
Ratio of net investment loss to average net assetsÏÏÏÏÏÏÏÏÏÏÏÏÏÏÏÏÏÏÏÏÏÏÏ (0.00)%(b)(g)
Portfolio turnover rate ÏÏÏÏÏÏÏÏÏÏÏÏÏÏÏÏÏÏÏÏÏÏÏÏÏÏÏÏÏÏÏÏÏÏÏÏÏÏÏÏÏÏÏÏÏ 14%
(a) The Fund commenced operations on June 15, 1993.
(b) Annualized.
(c) Net investment loss for a Fund share outstanding, before the waiver of fees by the investment
adviser was $0.01 for the period ended March 31, 1994.
(d) Total return represents aggregate total return for the period indicated.
(e) Annualized expense ratio before waiver of fees by investment adviser was 1.83% for the period
ended March 31, 1994.
(f) Amount represents less than $(0.01).
(g) Amount represents less than (0.01)%.
(h) Per share amounts have been calculated using the monthly average share method, which more
appropriately presents the per share data for the period since the use of the undistributed income
method does not accord with results of operations.
m m m m m m m SEE NOTES TO FINANCIAL STATEMENTS m m m m m m m
24
TWEEDY, BROWNE GLOBAL VALUE FUND
Notes to Financial Statements
1. SigniÑcant Accounting Policies
Tweedy, Browne Global Value Fund (the ""Fund'') is a diversiÑed series of
Tweedy, Browne Fund Inc. (the ""Company''). The Company is an open-end
management investment company registered with the Securities and Exchange
Commission under the Investment Company Act of 1940, as amended. The
Company was organized as a Maryland corporation on January 28, 1993. The
Fund commenced operations on June 15, 1993. The following is a summary of
signiÑcant accounting policies consistently followed by the Fund in the prepara-
tion of its Ñnancial statements.
Portfolio Valuation Generally, the Fund's investments are valued at
market value or, in the absence of market value with respect to any portfolio
securities, at fair value as determined by or under the direction of the Company's
Board of Directors. Portfolio securities that are traded primarily on a domestic
exchange are valued at the last sale price on that exchange or, if there were no
sales during the day, at the mean between the last ask price and the last bid price
prior to the close of regular trading. Over-the-counter securities and securities
listed or traded on certain foreign exchanges whose operations are similar to the
United States (""U.S.'') over-the-counter market are valued at the mean between
the current bid and ask prices. Portfolio securities that are traded primarily on
foreign exchanges generally are valued at the preceding closing values of such
securities on their respective exchanges, except that when an occurrence subse-
quent to the time that a value was so established is likely to have changed such
value, then the fair value of those securities will be determined by consideration
of other factors by or under the direction of the Company's Board of Directors.
Short-term investments that mature in 60 days or less are valued at amortized
cost.
Repurchase Agreements The Fund engages in repurchase agreement
transactions. Under the terms of a typical repurchase agreement, the Fund takes
possession of an underlying debt obligation subject to an obligation of the seller
to repurchase, and the Fund to resell, the obligation at an agreed-upon price and
time, thereby determining the yield during the Fund's holding period. This
arrangement results in a Ñxed rate of return that is not subject to market
Öuctuations during the Fund's holding period. The value of the collateral is at
least equal at all times to the total amount of the repurchase obligations, including
interest. In the event of counterparty default, the Fund has the right to use the
m m m m m m m m m m m m m m m m m m m m m m m m m m m m m m m m
25

TWEEDY, BROWNE GLOBAL VALUE FUND
Notes to Financial Statements
collateral to oÅset losses incurred. There is potential loss to the Fund in the event
the Fund is delayed or prevented from exercising its rights to dispose of the
collateral securities, including the risk of a possible decline in the value of the
underlying securities during the period while the Fund seeks to assert its rights.
The Fund's investment adviser, acting under the supervision of the Company's
Board of Directors, reviews the value of the collateral and the creditworthiness of
those banks and dealers with which the Fund enters into repurchase agreements
to evaluate potential risks.
Foreign Currency The books and records of the Fund are maintained in
U.S. dollars. Foreign currencies, investments and other assets and liabilities are
translated into U.S. dollars at the exchange rates prevailing at the end of the
period, and purchases and sales of investment securities, income and expenses are
translated on the respective dates of such transactions. Unrealized gains and
losses which result from changes in foreign currency exchange rates have been
included in the unrealized appreciation/(depreciation) of currencies and net
other assets. Net realized foreign currency gains and losses resulting from changes
in exchange rates include foreign currency gains and losses between trade date
and settlement date on investment securities transactions, foreign currency
transactions and the diÅerence between the amounts of interest and dividends
recorded on the books of the Fund and the amount actually received. The
portion of foreign currency gains and losses related to Öuctuation in the exchange
rates between the initial purchase trade date and subsequent sale trade date is
included in realized gains and losses on investment securities sold.
Forward Exchange Contracts The Fund has entered into forward ex-
change contracts to reduce its exposure to Öuctuations in foreign currency
exchange on its portfolio holdings. Forward exchange contracts are valued at the
forward rate and are marked-to-market daily. The change in market value is
recorded by the Fund as an unrealized gain or loss. When the contract is closed,
the Fund records a realized gain or loss equal to the diÅerence between the value
of the contract at the time that it was opened and the value at the time that it was
closed.
The use of forward exchange contracts does not eliminate Öuctuations in the
underlying prices of the Fund's investment securities, but it does establish a rate
of exchange that can be achieved in the future. Although forward exchange
m m m m m m m m m m m m m m m m m m m m m m m m m m m m m m m m
26

TWEEDY, BROWNE GLOBAL VALUE FUND
Notes to Financial Statements
contracts limit the risk of loss due to a decline in the value of the hedged
currency, they also limit any potential gain that might result should the value of
the currency increase. In addition, the Fund could be exposed to risks if the
counterparties to the contracts are unable to meet the terms of their contracts.
Securities Transactions and Investment Income Securities transactions
are recorded as of the trade date. Realized gains and losses from securities
transactions are recorded on the identiÑed cost basis. Dividend income and
distributions to shareholders are recorded on the ex-dividend date. Interest
income is recorded on the accrual basis.
Dividends and Distributions to Shareholders Dividends from net invest-
ment income, if any, and distributions from realized capital gains after utilization
of capital loss carryforwards, if any, will be declared and paid annually. Additional
distributions of net investment income and capital gains from the Fund may be
made at the discretion of the Board of Directors in order to avoid the application
of a 4% non-deductible Federal excise tax on certain undistributed amounts of
ordinary income and capital gains. Income distributions and capital gain distribu-
tions are determined in accordance with income tax regulations which may diÅer
from generally accepted accounting principles. These diÅerences are primarily
due to diÅering treatments of income and gains on various investment securities
held by the Fund, timing diÅerences and diÅering characterization of distribu-
tions made by the Fund.
For the period ended March 31, 1994, permanent reclassiÑcation adjust-
ments for forward exchange contracts and currency transactions were made
between accumulated net investment loss and accumulated net realized gains. In
addition permanent diÅerences incurred resulting from a tax basis net operating
loss were reclassiÑed to paid-in-capital.
Federal Income Taxes The Fund intends to qualify as a regulated invest-
ment company, if such qualiÑcation is in the best interest of its shareholders, by
complying with the requirements of the Internal Revenue Code of 1986, as
amended, applicable to regulated investment companies and by distributing
substantially all of its taxable income to its shareholders. Therefore, no Federal
income tax provision is required.
m m m m m m m m m m m m m m m m m m m m m m m m m m m m m m m m
27
TWEEDY, BROWNE GLOBAL VALUE FUND
Notes to Financial Statements
2. Investment Advisory Fee, Administration Fee and Other PartyTransactions
The Company on behalf of the Fund has entered into an investment
advisory agreement (the ""Advisory Agreement'') with Tweedy, Browne Com-
pany L.P. (""Tweedy, Browne''). Under the Advisory Agreement, the Company
pays Tweedy, Browne a fee at the annual rate of 1.25% of the value of its average
daily net assets. The fee is payable monthly, provided the Fund will make such
interim payments as may be requested by the adviser not to exceed 75% of the
amount of the fee then accrued on the books of the Fund and unpaid. From time
to time, Tweedy, Browne may voluntarily waive a portion of its fee otherwise
payable to it. For the period from commencement of operations on June 15, 1993
through March 31, 1994, Tweedy, Browne voluntarily waived fees of $109,577.
The four general partners of Tweedy, Browne Company L.P., the invest-
ment advisor to the Fund, have approximately $8 million of their own money
invested in the Fund.
The Company on behalf of the Fund has entered into an administration
agreement (the ""Administration Agreement'') with The Boston Company Advi-
sors, Inc. (""Boston Advisors''), an indirect wholly owned subsidiary of Mellon
Bank Corporation (""Mellon''). Under the Administration Agreement, the
Company pays Boston Advisors an administrative fee and a fund accounting fee
computed daily and payable monthly at the following annual rates of the value of
the average daily net assets of the Fund.Fees on Assets
BetweenUp to $200 and Exceeding
$200 Million $500 Million $500 Million
Administration Fees 0.12% 0.10% 0.08%
BetweenUp to $50 and Exceeding
$50 Million $100 Million $100 Million
Accounting Fees 0.08% 0.06% 0.04%
Under the terms of the Administration Agreement, the Company will pay
for Fund Administration Services, a minimum fee of $40,000 per portfolio per
m m m m m m m m m m m m m m m m m m m m m m m m m m m m m m m m
28
TWEEDY, BROWNE GLOBAL VALUE FUND
Notes to Financial Statements
annum, not to be aggregated with fees for Fund Accounting Services and the
Company will pay for Fund Accounting Services a minimum fee of $20,000 per
portfolio per annum, not to be aggregated with fees for Fund Administration
Services.
No oÇcer, director or employee of Tweedy, Browne, Boston Advisors or any
parent or subsidiary of those corporations receives any compensation from the
Company for serving as a director or oÇcer of the Company. The Company pays
each director who is not an oÇcer, director or employee of Tweedy, Browne,
Boston Advisors or any of their aÇliates $2,000 per annum plus $500 per Regular
or Special Board Meeting attended in person or by telephone, plus out-of-pocket
expenses.
Boston Safe Deposit and Trust Company (""Boston Safe''), an indirect
wholly owned subsidiary of Mellon, serves as the Fund's custodian pursuant to a
custody agreement (the ""Custody Agreement''). UniÑed Advisers, Inc., serves as
the Fund's transfer agent. Tweedy, Browne also serves as the distributor to the
Fund.
Notwithstanding the foregoing, Boston Advisors and Boston Safe have each
agreed to limit fees charged pursuant to the Administration Agreement and
Custody Agreement to 0.42% of the value of the Fund's average daily net assets
during the Fund's Ñrst 12 months of operation.
3. Purchases and Sales of Securities
Cost of purchases and proceeds from sales, excluding short-term invest-
ments, for the period from commencement of operations on June 15, 1993
through March 31, 1994 aggregated $235,878,009 and $15,976,423, respectively.
At March 31, 1994, the aggregate gross unrealized appreciation for all
securities in which there was an excess of value over tax cost was $34,734,565 and
the aggregate gross unrealized depreciation for all securities in which there was an
excess of tax cost over value was $4,082,864.
m m m m m m m m m m m m m m m m m m m m m m m m m m m m m m m m
29
TWEEDY, BROWNE GLOBAL VALUE FUND
Notes to Financial Statements
4. Capital Stock
The Company is authorized to issue one billion shares of $.0001 par value
capital stock. 400,000,000 of the unissued shares have been designated as shares
of the Fund. Changes in shares outstanding for the Fund were as follows:
Period Ended 3/31/94*
Shares Amount
Sold 26,617,894 $300,748,974Redeemed (2,374,782) (28,873,553)
Net Increase 24,243,112 $271,875,421
* The Fund commenced operations on June 15, 1993.
5. Organization Costs
The Fund bears all costs in connection with its organization including the
fees and expenses of registering and qualifying its shares for distribution under
Federal and state securities regulations. All such costs have been deferred and are
being amortized over a Ñve year period using the straight-line method from the
commencement of operations of the Fund. In the event that any of the initial
shares of the Fund are redeemed during such amortization period, the Fund will
be reimbursed for any unamortized organization costs in the same proportion as
the number of shares redeemed bears to the number of initial shares held at the
time of redemption.
6. Foreign Securities
Investing in securities of foreign companies and foreign governments in-
volves economic and political risks and considerations not typically associated
with investing in U.S. companies and the U.S. Government. These considera-
tions include changes in exchange rates and exchange rate controls (which may
include suspension of the ability to transfer currency from a given country), costs
incurred in conversions between currencies, non-negotiable brokerage commis-
sions, less publicly available information, diÅerent accounting standards, lower
trading volume, delayed settlements and greater market volatility, the diÇculty of
enforcing obligations in other countries, less securities regulation, diÅerent tax
provisions (including withholding on dividends paid to the Fund), war, expro-
priation, political and social instability and diplomatic developments.
m m m m m m m m m m m m m m m m m m m m m m m m m m m m m m m m
30

TWEEDY, BROWNE GLOBAL VALUE FUND
Notes to Financial Statements
7. Subsequent Events
On May 6, 1994, Boston Advisors sold the assets comprising their third
party mutual fund administration business to The Shareholder Services Group,
Inc. (""TSSG''), a wholly-owned subsidiary of First Data Corporation. EÅective
as of close of business on that day, TSSG became the Fund's administrator
pursuant to an assignment to TSSG by Boston Advisors of the Fund's administra-
tion agreement.
On April 29, 1994, the Fund and Mellon Bank, N.A. entered into a Line
of Credit Agreement (the ""Agreement'') which provides the Fund with a
$30 million line of credit primarily for temporary or emergency purposes,
including the meeting of redemption requests that might otherwise require the
untimely disposition of securities. The Fund may borrow up to the lesser of
$30 million or one-third of its net assets. Interest is payable at the bank's Money
Market Rate plus 0.75% on an annualized basis. Under the Agreement, the Fund
is charged a facility fee equal to 0.10% annually of the unutilized credit. The
Agreement requires, among other provisions, the Fund to maintain a ratio of net
assets (not including funds borrowed pursuant to the Agreement) to aggregate
amount of indebtedness pursuant to the Agreement of no less than three to one.
m m m m m m m m m m m m m m m m m m m m m m m m m m m m m m m m
31
TWEEDY, BROWNE GLOBAL VALUE FUND
Report of Ernst & Young, Independent Auditors
To the Shareholders and Board of DirectorsTweedy, Browne Global Value Fund
We have audited the accompanying statement of assets and liabilities,
including the portfolio of investments of the Tweedy, Browne Global
Value Fund as of March 31, 1994, and the related statements of opera-
tions and changes in net assets and the Ñnancial highlights for the period
from June 15, 1993 (date of commencement) to March 31, 1994. These
Ñnancial statements and Ñnancial highlights are the responsibility of the
Fund's management. Our responsibility is to express an opinion on these
Ñnancial statements and Ñnancial highlights based on our audit.
We conducted our audit in accordance with generally accepted
auditing standards. Those standards require that we plan and perform the
audit to obtain reasonable assurance about whether the Ñnancial state-
ments and Ñnancial highlights are free of material misstatement. An audit
includes examining, on a test basis, evidence supporting the amounts and
disclosures in the Ñnancial statements. Our procedures included conÑrma-
tion of securities owned as of March 31, 1994, by correspondence with
the custodian and brokers. An audit also includes assessing the accounting
principles used and signiÑcant estimates made by management, as well as
evaluating the overall Ñnancial statement presentation. We believe that
our audit provides a reasonable basis for our opinion.
In our opinion, the Ñnancial statements and Ñnancial highlights
referred to above present fairly, in all material respects, the Ñnancial
position of the Tweedy, Browne Global Value Fund at March 31, 1994,
the results of its operations, the changes in its net assets and Ñnancial
highlights for the period from June 15, 1993 (date of commencement) to
March 31, 1994, in conformity with generally accepted accounting
principles.
Boston, Massachusetts
May 13, 1994
32

..............................
..............................TWEEDY, BROWNE FUND INC.
42 Vanderbilt Avenue, NY, NY 10017800-432-4789 or 800-873-8242
Tweedy Browne 17388 [Saved: 10/9/98 12:42 AM ] [Output: 10/9/98 3:21 AM ] Page 2 [Composite]
[Workstation: Electronic Prepress IV] [Location: (BOB) Art:Mutual Funds:First Data Investor Service:B30120 First D