Embed Size (px)
Citation preview

HIGHPOINT AT PELLAPELLA, IA
OFFERING MEMORANDUM

Presented by:Presented by:Presented by:Presented by:
David N GainesDavid N GainesDavid N GainesDavid N Gaines Alex BlagojevichAlex BlagojevichAlex BlagojevichAlex Blagojevich Will RyanWill RyanWill RyanWill Ryan Barry A’HearnBarry A’HearnBarry A’HearnBarry A’HearnVice President Investments Vice President Investments Associate Broker of Record Iowa
Chicago Downtown Tampa, FL Chicago Downtown Cedar Rapids, IA
Direct (312) 327-5427 Direct (813) 387-4845 Tel: (312) 327-5419 Direct (319) 298-4658
Mobile (847) 340-3171 Mobile (773) 899-0391 Mobile: (415) 218-4535 Fax (866) 679-7320
[email protected] [email protected] [email protected] [email protected]
HIGHPOINT AT PELLAPELLA, IA

CONFIDENTIALITY AGREEMENT & DISCLAIMERCONFIDENTIALITY AGREEMENT & DISCLAIMERCONFIDENTIALITY AGREEMENT & DISCLAIMERCONFIDENTIALITY AGREEMENT & DISCLAIMER
The information contained in the following Marketing Brochure is proprietary and strictly confidential. It is intended to be reviewed only bythe party receiving it from Marcus & Millichap and should not be made available to any other person or entity without the written consent ofMarcus & Millichap. This Marketing Brochure has been prepared to provide summary, unverified information to prospective purchasers, andto establish only a preliminary level of interest in the subject property. The information contained herein is not a substitute for a thoroughdue diligence investigation. Marcus & Millichap has not made any investigation, and makes no warranty or representation, with respect tothe income or expenses for the subject property, the future projected financial performance of the property, the size and square footage ofthe property and improvements, the presence or absence of contaminating substances, PCB's or asbestos, the compliance with State andFederal regulations, the physical condition of the improvements thereon, or the financial condition or business prospects of any tenant, orany tenant’s plans or intentions to continue its occupancy of the subject property. The information contained in this Marketing Brochure hasbeen obtained from sources we believe to be reliable; however, Marcus & Millichap has not verified, and will not verify, any of theinformation contained herein, nor has Marcus & Millichap conducted any investigation regarding these matters and makes no warranty orrepresentation whatsoever regarding the accuracy or completeness of the information provided. All potential buyers must take appropriatemeasures to verify all of the information set forth herein.
NONNONNONNON----ENDORSEMENT ENDORSEMENT ENDORSEMENT ENDORSEMENT NOTICENOTICENOTICENOTICE
Marcus & Millichap Real Estate Investment Services, Inc. (“M&M”) is not affiliated with, sponsored by, or endorsed by any commercialtenant or lessee identified in this marketing package. The presence of any corporation’s logo or name is not intended to indicate or implyaffiliation with, or sponsorship or endorsement by, said corporation of M&M, its affiliates or subsidiaries, or any agent, product, service, orcommercial listing of M&M, and is solely included for the purpose of providing tenant lessee information about this listing to prospectivecustomers.
ALL ALL ALL ALL PROPERTY SHOWINGS ARE BY APPOINTMENT ONLY. PROPERTY SHOWINGS ARE BY APPOINTMENT ONLY. PROPERTY SHOWINGS ARE BY APPOINTMENT ONLY. PROPERTY SHOWINGS ARE BY APPOINTMENT ONLY. PLEASE PLEASE PLEASE PLEASE CONSULT YOUR MARCUS & MILLICHAP AGENT FOR MORE DETAILSCONSULT YOUR MARCUS & MILLICHAP AGENT FOR MORE DETAILSCONSULT YOUR MARCUS & MILLICHAP AGENT FOR MORE DETAILSCONSULT YOUR MARCUS & MILLICHAP AGENT FOR MORE DETAILS....

PROPERTY DESCRIPTIONPROPERTY DESCRIPTIONPROPERTY DESCRIPTIONPROPERTY DESCRIPTIONINVESTMENT OVERVIEW
Investment Highlights:
• 100 conventional market rate apartment units• Originally built in 1999• Average unit size – 1,041 square feet• Average rental rate – $765 per month• Offered with assumable CMBS financing• 100% fee simple interest
Marcus & Millichap has been retained on an exclusive basis to arrange thesale of Highpoint at Pella, a 100-unit multifamily complex consisting of fivethree-story buildings (104,120 total rentable square feet), built in 1999.
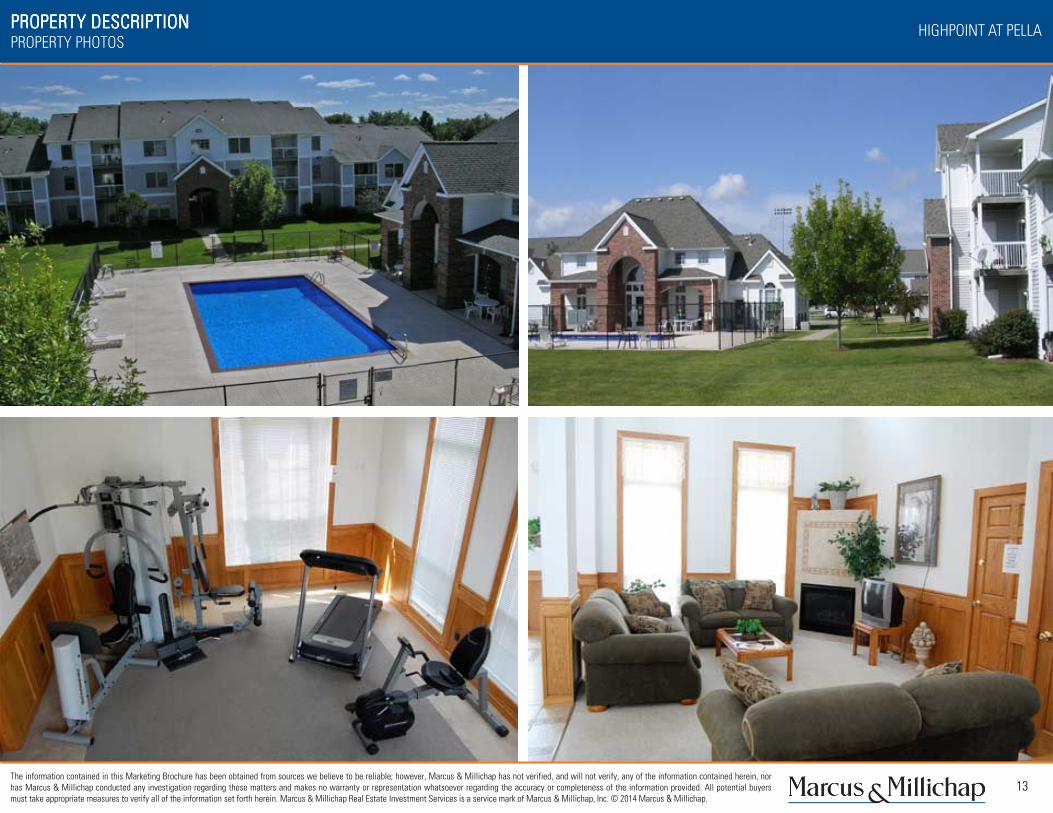
Highpoint at Pella is an ideal apartment community in the town of Pella,Iowa, approximately 45 miles southeast of Des Moines, 2 miles east ofLake Red Rock and just north of the Des Moines River. Highpoint at Pellaoffers spacious floor plans, exceptional unit and community amenities, anda convenient location to highways 163 and G28.
Located at 340 East 13th Street in Pella, Iowa, Highpoint offers both one-and two- bedroom apartments. The property is comprised of 12 one-bedroom/one-bath units, 85 two-bedroom/two-bath units, and 3 corporatelofts. One bedroom apartments are 830 square feet and two bedroomapartments are 1020 - 1130 square feet. Features include a fitness roomand clubhouse, pool, window coverings provided. Washers, dryers andgarages are available.
HIGHPOINT AT PELLA
4The information contained in this Marketing Brochure has been obtained from sources we believe to be reliable; however, Marcus & Millichap has not verified, and will not verify, any of the information contained herein, norhas Marcus & Millichap conducted any investigation regarding these matters and makes no warranty or representation whatsoever regarding the accuracy or completeness of the information provided. All potential buyersmust take appropriate measures to verify all of the information set forth herein. Marcus & Millichap Real Estate Investment Services is a service mark of Marcus & Millichap, Inc. © 2014 Marcus & Millichap.

PROPERTY DESCRIPTIONPROPERTY DESCRIPTIONPROPERTY DESCRIPTIONPROPERTY DESCRIPTIONMARKET OVERVIEW
Pella is a city in Marion County, Iowa, United States. The population was 10,352 at the2010 census. Pella is the home of Central College as well as several manufacturingcompanies, including Pella Corporation and Vermeer Manufacturing Company.
Pella was founded in 1847 by 800 Dutch immigrants led by Henry Peter Scholte. Scholteand the other immigrants were fleeing famine and religious persecution at the hands ofthe state church of the Netherlands. Before leaving the Netherlands, the immigrantsdecided to name their new home Pella, or City of Refuge, in the prairieland of Iowa.
After arriving in the United States, the group selected a settlement between the Skunkand Des Moines rivers in Marion County. They were able to purchase 18,000 acres offertile farm land for about $1.25 per acre. Within a decade of settling in Pella, theresidents had established three churches, a newspaper, and schools. Central Collegewas founded by the Baptists in 1853, when Scholte gave them 160 acres of land.
“America’s Dutch Treasure”, Pella lies in Central Iowa just 40 miles SE of Des Moines.Established in 1847, under leadership of Dominie Hendrik Peter Scholte, the Hollandersclaimed their new home as Pella, “city of refuge”.
Pella’s Annual Tulip Time Festival brings over 150,000 guests to our community the firstthree day weekend in May. Citizens today still grace their traditional Dutch costumesand wooden shoes for this annual celebration of heritage. Hundreds of thousands oftulips are bedded yearly in the Pella Historical Village grounds, Scholte House Gardens,Sunken Gardens Park and many other locations around the community.
Pella today boasts the largest working grain windmill in the United States, the VermeerMill; a treasured gem, now fully-restored from the 1900’s, the Pella Opera House; Iowa’slargest lake, Lake Red Rock; strong industry such as Pella Corporation and VermeerCorporation and a strong, healthy business community for the 10,000+ population.
# Employer # of Employees
1 Pella Corporation 2,500
2 Vermeer Corporation 2,364
3 Pella Regional Health Center 819
4 Central College 469
5 Pella Community Schools 341
6 Precision Pulley & Idler 193
7 City of Pella 149
8 Christian Opportunity Center 122
9 Van Gorp Corporation 60
10 Heritage Lace, Inc. 45
HIGHPOINT AT PELLA
5The information contained in this Marketing Brochure has been obtained from sources we believe to be reliable; however, Marcus & Millichap has not verified, and will not verify, any of the information contained herein, norhas Marcus & Millichap conducted any investigation regarding these matters and makes no warranty or representation whatsoever regarding the accuracy or completeness of the information provided. All potential buyersmust take appropriate measures to verify all of the information set forth herein. Marcus & Millichap Real Estate Investment Services is a service mark of Marcus & Millichap, Inc. © 2014 Marcus & Millichap.

PROPERTY DESCRIPTIONPROPERTY DESCRIPTIONPROPERTY DESCRIPTIONPROPERTY DESCRIPTIONMARKET OVERVIEW
CentralCentralCentralCentral CollegeCollegeCollegeCollege – 1.6 Miles from Subject
Founded in 1853, Central College of Pella, Iowa, is a private, residential four-year liberal arts college known for itsacademic rigor and strength in global experiential learning, STEM (science, technology, engineering and math),sustainability education, athletics success and tradition, and leadership and service. Central continues to value itslong-standing relationship with the Reformed Church in America that began in 1916. The college participates in NCAADivision III athletics and is a member of the Iowa Conference. Central is an active part of the Greater Des Moinesregion and just two minutes from Lake Red Rock, Iowa’s largest lake.
JoanJoanJoanJoan KuyperKuyperKuyperKuyper FarverFarverFarverFarver AuditoriumAuditoriumAuditoriumAuditorium - 1.5 Miles from Subject
The J.K.F. Auditorium is a completely renovated 329-seat multi-purpose facility, and is home to theatrical and musicalperformances and classes, public meetings, political forums, lectures and special events that occur throughout theyear. Each summer the Community Center offers a variety of theater classes and programs for students grade 1 thru 12.These classes are designed to be inclusive and explore all aspects of theater including set design, costumes, learning apart and participating in a production.
BigBigBigBig RockRockRockRock ParkParkParkPark– 3.0 Miles from Subject
Donated to the City of Pella in 1958, this park boasts 83-acres of native timber. Located in the northwest corner of thecity at the end of Big Rock Road, it has remained in its natural state as much as possible. Information signs guidevisitors through the maze of trails to get to the Big Rock itself. Wildlife abounds throughout the park and manywalkers, joggers, and cross country skiers take advantage of the park’s solitude as well as its 3 miles of paths.
HIGHPOINT AT PELLA
6The information contained in this Marketing Brochure has been obtained from sources we believe to be reliable; however, Marcus & Millichap has not verified, and will not verify, any of the information contained herein, norhas Marcus & Millichap conducted any investigation regarding these matters and makes no warranty or representation whatsoever regarding the accuracy or completeness of the information provided. All potential buyersmust take appropriate measures to verify all of the information set forth herein. Marcus & Millichap Real Estate Investment Services is a service mark of Marcus & Millichap, Inc. © 2014 Marcus & Millichap.
ECONOMYECONOMYECONOMYECONOMY &&&& ENTERTAINMENTENTERTAINMENTENTERTAINMENTENTERTAINMENTPella is a great place to live! We have it all – a scenic community with rich cultural heritage, low crime rate, great schools, excellent quality of life, and much more!Located just 3 miles from Iowa’s largest manmade lake, and 45 minutes southeast of Des Moines.

PROPERTY DESCRIPTIONPROPERTY DESCRIPTIONPROPERTY DESCRIPTIONPROPERTY DESCRIPTIONPROPERTY SUMMARY
The OfferingThe OfferingThe OfferingThe Offering
Name Highpoint at Pella
Address 340 East 13th Street
Pella, IA
Type of Ownership Fee Simple
Assessor’s Parcel Number 1581700230, 1581700225
Zoning R-3
Site DescriptionSite DescriptionSite DescriptionSite Description
Number of Units 100
Number of Buildings 5 (plus Clubhouse )
Number of Stories 3
Rentable Square Feet 104,120 SF
Year Built 1999
Lot Size 7.94 Acres
Parking Paid Garage/ Surfaces Spots Available
UtilitiesUtilitiesUtilitiesUtilities
Water Hot Water – Tenant Paid / Cold Water – Landlord Paid
Electric Tenant Paid
Gas Tenant Paid
ConstructionConstructionConstructionConstruction
Foundation Poured Concrete
Framing Wood
Exterior Vinyl
Parking Surface Asphalt
Roof Pitched Shingle
HIGHPOINT AT PELLA
7The information contained in this Marketing Brochure has been obtained from sources we believe to be reliable; however, Marcus & Millichap has not verified, and will not verify, any of the information contained herein, norhas Marcus & Millichap conducted any investigation regarding these matters and makes no warranty or representation whatsoever regarding the accuracy or completeness of the information provided. All potential buyersmust take appropriate measures to verify all of the information set forth herein. Marcus & Millichap Real Estate Investment Services is a service mark of Marcus & Millichap, Inc. © 2014 Marcus & Millichap.

PROPERTY DESCRIPTIONPROPERTY DESCRIPTIONPROPERTY DESCRIPTIONPROPERTY DESCRIPTIONAMENITIES
Common Area AmenitiesCommon Area AmenitiesCommon Area AmenitiesCommon Area Amenities
Unit AmenitiesUnit AmenitiesUnit AmenitiesUnit Amenities
• Clubhouse with Wood-Burning Fireplace
• Swimming Pool & Patio
• Fitness Center
• Barbeque Area
• Close to Schools, Parks, and Local Golf Courses
• Spacious Floor Plans
• Designer Countertops and Custom Kitchen Cabinets
• Washer and Dryer Connections
• GE Appliances
• Six-Panel Doors
• Ceiling Fans in Each Room
HIGHPOINT AT PELLA
8The information contained in this Marketing Brochure has been obtained from sources we believe to be reliable; however, Marcus & Millichap has not verified, and will not verify, any of the information contained herein, norhas Marcus & Millichap conducted any investigation regarding these matters and makes no warranty or representation whatsoever regarding the accuracy or completeness of the information provided. All potential buyersmust take appropriate measures to verify all of the information set forth herein. Marcus & Millichap Real Estate Investment Services is a service mark of Marcus & Millichap, Inc. © 2014 Marcus & Millichap.

PROPERTY DESCRIPTIONPROPERTY DESCRIPTIONPROPERTY DESCRIPTIONPROPERTY DESCRIPTIONPROPERTY PHOTOS
HIGHPOINT AT PELLA
9The information contained in this Marketing Brochure has been obtained from sources we believe to be reliable; however, Marcus & Millichap has not verified, and will not verify, any of the information contained herein, norhas Marcus & Millichap conducted any investigation regarding these matters and makes no warranty or representation whatsoever regarding the accuracy or completeness of the information provided. All potential buyersmust take appropriate measures to verify all of the information set forth herein. Marcus & Millichap Real Estate Investment Services is a service mark of Marcus & Millichap, Inc. © 2014 Marcus & Millichap.

PROPERTY DESCRIPTIONPROPERTY DESCRIPTIONPROPERTY DESCRIPTIONPROPERTY DESCRIPTIONPROPERTY PHOTOS
HIGHPOINT AT PELLA
10The information contained in this Marketing Brochure has been obtained from sources we believe to be reliable; however, Marcus & Millichap has not verified, and will not verify, any of the information contained herein, norhas Marcus & Millichap conducted any investigation regarding these matters and makes no warranty or representation whatsoever regarding the accuracy or completeness of the information provided. All potential buyersmust take appropriate measures to verify all of the information set forth herein. Marcus & Millichap Real Estate Investment Services is a service mark of Marcus & Millichap, Inc. © 2014 Marcus & Millichap.

PROPERTY DESCRIPTIONPROPERTY DESCRIPTIONPROPERTY DESCRIPTIONPROPERTY DESCRIPTIONPROPERTY PHOTOS
HIGHPOINT AT PELLA
11The information contained in this Marketing Brochure has been obtained from sources we believe to be reliable; however, Marcus & Millichap has not verified, and will not verify, any of the information contained herein, norhas Marcus & Millichap conducted any investigation regarding these matters and makes no warranty or representation whatsoever regarding the accuracy or completeness of the information provided. All potential buyersmust take appropriate measures to verify all of the information set forth herein. Marcus & Millichap Real Estate Investment Services is a service mark of Marcus & Millichap, Inc. © 2014 Marcus & Millichap.

PROPERTY DESCRIPTIONPROPERTY DESCRIPTIONPROPERTY DESCRIPTIONPROPERTY DESCRIPTIONPROPERTY PHOTOS
HIGHPOINT AT PELLA
12The information contained in this Marketing Brochure has been obtained from sources we believe to be reliable; however, Marcus & Millichap has not verified, and will not verify, any of the information contained herein, norhas Marcus & Millichap conducted any investigation regarding these matters and makes no warranty or representation whatsoever regarding the accuracy or completeness of the information provided. All potential buyersmust take appropriate measures to verify all of the information set forth herein. Marcus & Millichap Real Estate Investment Services is a service mark of Marcus & Millichap, Inc. © 2014 Marcus & Millichap.
PROPERTY DESCRIPTIONPROPERTY DESCRIPTIONPROPERTY DESCRIPTIONPROPERTY DESCRIPTIONPROPERTY PHOTOS
HIGHPOINT AT PELLA
13The information contained in this Marketing Brochure has been obtained from sources we believe to be reliable; however, Marcus & Millichap has not verified, and will not verify, any of the information contained herein, norhas Marcus & Millichap conducted any investigation regarding these matters and makes no warranty or representation whatsoever regarding the accuracy or completeness of the information provided. All potential buyersmust take appropriate measures to verify all of the information set forth herein. Marcus & Millichap Real Estate Investment Services is a service mark of Marcus & Millichap, Inc. © 2014 Marcus & Millichap.

PROPERTY DESCRIPTIONPROPERTY DESCRIPTIONPROPERTY DESCRIPTIONPROPERTY DESCRIPTIONFLOOR PLANS
HIGHPOINT AT PELLA
14The information contained in this Marketing Brochure has been obtained from sources we believe to be reliable; however, Marcus & Millichap has not verified, and will not verify, any of the information contained herein, norhas Marcus & Millichap conducted any investigation regarding these matters and makes no warranty or representation whatsoever regarding the accuracy or completeness of the information provided. All potential buyersmust take appropriate measures to verify all of the information set forth herein. Marcus & Millichap Real Estate Investment Services is a service mark of Marcus & Millichap, Inc. © 2014 Marcus & Millichap.

PROPERTY DESCRIPTIONPROPERTY DESCRIPTIONPROPERTY DESCRIPTIONPROPERTY DESCRIPTIONAERIAL MAP
HIGHPOINT AT PELLA
15The information contained in this Marketing Brochure has been obtained from sources we believe to be reliable; however, Marcus & Millichap has not verified, and will not verify, any of the information contained herein, norhas Marcus & Millichap conducted any investigation regarding these matters and makes no warranty or representation whatsoever regarding the accuracy or completeness of the information provided. All potential buyersmust take appropriate measures to verify all of the information set forth herein. Marcus & Millichap Real Estate Investment Services is a service mark of Marcus & Millichap, Inc. © 2014 Marcus & Millichap.

PROPERTY DESCRIPTIONPROPERTY DESCRIPTIONPROPERTY DESCRIPTIONPROPERTY DESCRIPTIONLOCAL MAP
HIGHPOINT AT PELLA
16The information contained in this Marketing Brochure has been obtained from sources we believe to be reliable; however, Marcus & Millichap has not verified, and will not verify, any of the information contained herein, norhas Marcus & Millichap conducted any investigation regarding these matters and makes no warranty or representation whatsoever regarding the accuracy or completeness of the information provided. All potential buyersmust take appropriate measures to verify all of the information set forth herein. Marcus & Millichap Real Estate Investment Services is a service mark of Marcus & Millichap, Inc. © 2014 Marcus & Millichap.

PROPERTY DESCRIPTIONPROPERTY DESCRIPTIONPROPERTY DESCRIPTIONPROPERTY DESCRIPTIONREGIONAL MAP
HIGHPOINT AT PELLA
17The information contained in this Marketing Brochure has been obtained from sources we believe to be reliable; however, Marcus & Millichap has not verified, and will not verify, any of the information contained herein, norhas Marcus & Millichap conducted any investigation regarding these matters and makes no warranty or representation whatsoever regarding the accuracy or completeness of the information provided. All potential buyersmust take appropriate measures to verify all of the information set forth herein. Marcus & Millichap Real Estate Investment Services is a service mark of Marcus & Millichap, Inc. © 2014 Marcus & Millichap.

FINANCIAL ANALYSISFINANCIAL ANALYSISFINANCIAL ANALYSISFINANCIAL ANALYSISFINANCIAL SUMMARY
HIGHPOINT AT PELLA
18The information contained in this Marketing Brochure has been obtained from sources we believe to be reliable; however, Marcus & Millichap has not verified, and will not verify, any of the information contained herein, norhas Marcus & Millichap conducted any investigation regarding these matters and makes no warranty or representation whatsoever regarding the accuracy or completeness of the information provided. All potential buyersmust take appropriate measures to verify all of the information set forth herein. Marcus & Millichap Real Estate Investment Services is a service mark of Marcus & Millichap, Inc. © 2014 Marcus & Millichap.
PROPERTY DESCRIPTIONPROPERTY DESCRIPTIONPROPERTY DESCRIPTIONPROPERTY DESCRIPTION
PropertyPropertyPropertyProperty Highpoint at PellaHighpoint at PellaHighpoint at PellaHighpoint at Pella
Property Address 340 East 13th Street
Pella, IA
Number of Units 100 Units
Net Rentable Area 104,120 SF
Year Built 1999
PROPERTY OPERATING PARAMETERSPROPERTY OPERATING PARAMETERSPROPERTY OPERATING PARAMETERSPROPERTY OPERATING PARAMETERS
Current Weighted-Average Market Rent per Unit ** $778 Unit
Current Weighted-Average GPR per Unit ** $781 Unit
Year 1 Operating Expenses per Unit $4,605 Unit
Year 1 Operating Expenses per SF $4.42 SF
Year 1 Income Loss *** 7.55%
10 Year Average Income Loss *** 7.06%
PROJECTED PRICING INDICATORS & RETURNSPROJECTED PRICING INDICATORS & RETURNSPROJECTED PRICING INDICATORS & RETURNSPROJECTED PRICING INDICATORS & RETURNS
Year 1 NOI $599,170
PRICINGPRICINGPRICINGPRICING
Sales PriceSales PriceSales PriceSales Price RequestRequestRequestRequest for Offersfor Offersfor Offersfor Offers
ANALYSIS TIMINGANALYSIS TIMINGANALYSIS TIMINGANALYSIS TIMING
Start of Analysis March-2015
End of First Year of Analysis February-2016
End of Analysis February-2025
Analysis Period 10 Years
MONTHLY RENT ROLL REPORTMONTHLY RENT ROLL REPORTMONTHLY RENT ROLL REPORTMONTHLY RENT ROLL REPORT
Rent Roll Report Dated February 1, 2015
Occupied Units Base Rent $76,535
Vacant Units at Market Rent $1,556
Gross Potential Rent $78,091
All Units at Market Rent $77,800
Gain (Loss)-to-Lease $291
Notes:*See Property Assumptions page for further details on Debt Financing
**Current Weighted-Average Market Rent & GPR based on 100% occupancy
***Income Loss figure is calculated as a percentage of GPR and includes: Vacancy & Collection Allowance, Model Apartments, Employee Apartment Discounts & Concessions
****The Outstanding Loan Balance(s) at the Start of the Analysis and at Maturity are ESTIMATES ONLY. The actual loan balance(s) may vary due to lender underwriting and/or interest accrual methodology.

FINANCIAL ANALYSISFINANCIAL ANALYSISFINANCIAL ANALYSISFINANCIAL ANALYSISUNIT MIX OVERVIEW
HIGHPOINT AT PELLA
19The information contained in this Marketing Brochure has been obtained from sources we believe to be reliable; however, Marcus & Millichap has not verified, and will not verify, any of the information contained herein, norhas Marcus & Millichap conducted any investigation regarding these matters and makes no warranty or representation whatsoever regarding the accuracy or completeness of the information provided. All potential buyersmust take appropriate measures to verify all of the information set forth herein. Marcus & Millichap Real Estate Investment Services is a service mark of Marcus & Millichap, Inc. © 2014 Marcus & Millichap.
Unit TypeUnit TypeUnit TypeUnit TypeNo. ofNo. ofNo. ofNo. of RentableRentableRentableRentable TotalTotalTotalTotal JanJanJanJan----2015201520152015 JanJanJanJan----2015201520152015 JanJanJanJan----2015201520152015UnitsUnitsUnitsUnits SquareSquareSquareSquare RentableRentableRentableRentable MarketMarketMarketMarket MarketMarketMarketMarket Total MarketTotal MarketTotal MarketTotal Market
FeetFeetFeetFeet Sq. Ft.Sq. Ft.Sq. Ft.Sq. Ft. Rent/UnitRent/UnitRent/UnitRent/Unit Rent/SFRent/SFRent/SFRent/SF Rent PotentialRent PotentialRent PotentialRent Potential
1BR 12 Units 830 SF 9,960 SF $650.00 $0.78 SF $7,800
2BR/2BA - Small 48 Units 1,020 SF 48,960 SF $750.00 $0.74 SF $36,000
2BR Large 20 Units 1,130 SF 22,600 SF $850.00 $0.75 SF $17,000
2BR Loft 17 Units 1,130 SF 19,210 SF $850.00 $0.75 SF $14,450
Corp Loft 3 Units 1,130 SF 3,390 SF $850.00 $0.75 SF $2,550
Totals / Wtd. AveragesTotals / Wtd. AveragesTotals / Wtd. AveragesTotals / Wtd. Averages 100 Units100 Units100 Units100 Units 1,041 SF1,041 SF1,041 SF1,041 SF 104,120 SF104,120 SF104,120 SF104,120 SF $778.00 $778.00 $778.00 $778.00 $0.75 SF $0.75 SF $0.75 SF $0.75 SF $77,800 $77,800 $77,800 $77,800
12%
48%20%
17% 3%
Unit MixUnit MixUnit MixUnit Mix
1BR 2BR/2BA - Small 2BR Lg 2BR Loft Corp Loft
$0.71 SF
$0.72 SF
$0.73 SF
$0.74 SF
$0.75 SF
$0.76 SF
$0.77 SF
$0.78 SF
$0.79 SF
$0
$100
$200
$300
$400
$500
$600
$700
$800
$900
Unit Market RentUnit Market RentUnit Market RentUnit Market Rent
Rent Rent SF

FINANCIAL ANALYSISFINANCIAL ANALYSISFINANCIAL ANALYSISFINANCIAL ANALYSISYEAR 1 INCOME & EXPENSE OVERVIEW
HIGHPOINT AT PELLA
20The information contained in this Marketing Brochure has been obtained from sources we believe to be reliable; however, Marcus & Millichap has not verified, and will not verify, any of the information contained herein, norhas Marcus & Millichap conducted any investigation regarding these matters and makes no warranty or representation whatsoever regarding the accuracy or completeness of the information provided. All potential buyersmust take appropriate measures to verify all of the information set forth herein. Marcus & Millichap Real Estate Investment Services is a service mark of Marcus & Millichap, Inc. © 2014 Marcus & Millichap.
Number of UnitsNumber of UnitsNumber of UnitsNumber of Units 100 Units100 Units100 Units100 Units TrailingTrailingTrailingTrailing TrailingTrailingTrailingTrailing TrailingTrailingTrailingTrailing Year 1Year 1Year 1Year 1
NotesNotesNotesNotes Per UnitPer UnitPer UnitPer Unit Per SFPer SFPer SFPer SFNet Rentable AreaNet Rentable AreaNet Rentable AreaNet Rentable Area 104,120 SF104,120 SF104,120 SF104,120 SF 12 Months12 Months12 Months12 Months 90 Days90 Days90 Days90 Days 30 Days30 Days30 Days30 Days FebFebFebFeb----2016201620162016 % of% of% of% of
ActualsActualsActualsActuals AnnualizedAnnualizedAnnualizedAnnualized AnnualizedAnnualizedAnnualizedAnnualized ProjectionProjectionProjectionProjection EGIEGIEGIEGI
RENTAL INCOMERENTAL INCOMERENTAL INCOMERENTAL INCOME
All Units at Market Rent $973,538 $958,859 $978,688 $961,608 (1) $9,616 $9.24
Gain (Loss)-to-Lease $0 $0 $0 $3,597 $36 $0.03
GROSS POTENTIAL RENTGROSS POTENTIAL RENTGROSS POTENTIAL RENTGROSS POTENTIAL RENT $973,538$973,538$973,538$973,538 $958,859$958,859$958,859$958,859 $978,688$978,688$978,688$978,688 965,205 965,205 965,205 965,205 $9,652$9,652$9,652$9,652 $9.27$9.27$9.27$9.27
Vacancy/Collection Allowance * $0 $0 $0 ($48,260) 5.00% (2) -$483 -$0.46
Concessions * $0 $0 $0 ($24,613) 2.55% (3) -$246 -$0.24
Employee Apartment Discount ($1,039) $0 $0 $0 0.00% (4) $0 $0.00
TOTAL ECONOMIC LOSSTOTAL ECONOMIC LOSSTOTAL ECONOMIC LOSSTOTAL ECONOMIC LOSS ($1,039)($1,039)($1,039)($1,039) $0 $0 $0 $0 $0 $0 $0 $0 ($72,873)($72,873)($72,873)($72,873) ----$729$729$729$729 ----$0.70$0.70$0.70$0.70
Other IncomeOther IncomeOther IncomeOther Income
Interest Income $24 $24 $24 $24 (5) $0 $0.00
Application Fee Income $3,580 $3,580 $3,580 $3,580 (5) $36 $0.03
Late Fee $455 $455 $455 $455 (5) $5 $0.00
Utilities $0 $0 $a0 $74,640 (6) $746 $0.72
Cable $0 $0 $0 $36,240 (6) $362 $0.35
Garage $0 $0 $0 $24,660 (6) $247 $0.24
Washer/Dryer $0 $0 $0 $24,480 (6) $245 $0.24
Pet $0 $0 $0 $3,240 (6) $32 $0.03
TOTAL OTHER INCOMETOTAL OTHER INCOMETOTAL OTHER INCOMETOTAL OTHER INCOME $4,059 $4,059 $4,059 $4,059 $4,059 $4,059 $4,059 $4,059 $4,059 $4,059 $4,059 $4,059 $167,319 $167,319 $167,319 $167,319 $1,673$1,673$1,673$1,673 $1.61$1.61$1.61$1.61
EFFECTIVE GROSS INCOMEEFFECTIVE GROSS INCOMEEFFECTIVE GROSS INCOMEEFFECTIVE GROSS INCOME $976,558 $976,558 $976,558 $976,558 $962,918 $962,918 $962,918 $962,918 $982,747 $982,747 $982,747 $982,747 $1,059,651 $1,059,651 $1,059,651 $1,059,651 (100.0%)(100.0%)(100.0%)(100.0%) $10,597$10,597$10,597$10,597 $10.18$10.18$10.18$10.18

FINANCIAL ANALYSISFINANCIAL ANALYSISFINANCIAL ANALYSISFINANCIAL ANALYSISYEAR 1 INCOME & EXPENSE OVERVIEW
HIGHPOINT AT PELLA
21The information contained in this Marketing Brochure has been obtained from sources we believe to be reliable; however, Marcus & Millichap has not verified, and will not verify, any of the information contained herein, norhas Marcus & Millichap conducted any investigation regarding these matters and makes no warranty or representation whatsoever regarding the accuracy or completeness of the information provided. All potential buyersmust take appropriate measures to verify all of the information set forth herein. Marcus & Millichap Real Estate Investment Services is a service mark of Marcus & Millichap, Inc. © 2014 Marcus & Millichap.
Notes:
*Calculated as a Percentage of Gross Potential Rent
**Calculated as a Percentage of Effective Gross Income
Number of UnitsNumber of UnitsNumber of UnitsNumber of Units 100 Units100 Units100 Units100 Units TrailingTrailingTrailingTrailing TrailingTrailingTrailingTrailing TrailingTrailingTrailingTrailing Year 1Year 1Year 1Year 1
NotesNotesNotesNotes Per UnitPer UnitPer UnitPer Unit Per SFPer SFPer SFPer SFNet Rentable AreaNet Rentable AreaNet Rentable AreaNet Rentable Area 104,120 SF104,120 SF104,120 SF104,120 SF 12 Months12 Months12 Months12 Months 90 Days90 Days90 Days90 Days 30 Days30 Days30 Days30 Days FebFebFebFeb----2016201620162016 % of% of% of% of
ActualsActualsActualsActuals AnnualizedAnnualizedAnnualizedAnnualized AnnualizedAnnualizedAnnualizedAnnualized ProjectionProjectionProjectionProjection EGIEGIEGIEGI
EXPENSESEXPENSESEXPENSESEXPENSES
Real Estate Taxes $123,588 $123,588 $123,588 $123,254 (7) (11.6%) $1,233 $1.18
Insurance $27,063 $27,063 $27,063 $27,063 (8) (2.6%) $271 $0.26
Utilities $44,605 $44,605 $44,605 $44,605 (9) (4.2%) $446 $0.43
TOTAL NONTOTAL NONTOTAL NONTOTAL NON----CONTROLLABLECONTROLLABLECONTROLLABLECONTROLLABLE $195,256 $195,256 $195,256 $195,256 $195,256 $195,256 $195,256 $195,256 $195,256 $195,256 $195,256 $195,256 $194,923 $194,923 $194,923 $194,923 (18.4%)(18.4%)(18.4%)(18.4%) $1,949$1,949$1,949$1,949 $1.87$1.87$1.87$1.87
Contract Services $54,428 $54,428 $54,428 $54,428 (9) (5.1%) $544 $0.52
Repairs & Maintenance $56,531 $56,531 $56,531 $56,531 (9) (5.3%) $565 $0.54
Marketing & Promotion $1,772 $1,772 $1,772 $1,772 (9) (0.2%) $18 $0.02
On-Site Payroll $63,920 $63,920 $63,920 $63,920 (9) (6.0%) $639 $0.61
General & Administrative $16,520 $16,520 $16,520 $16,520 (9) (1.6%) $165 $0.16
Management Fee ** $36,000 $36,000 $36,000 $42,386 4.00% (10) (4.0%) $424 $0.41
Replacement & Reserves $30,000 $30,000 $30,000 $30,000 (11) (2.8%) $300 $0.29
TOTAL CONTROLLABLETOTAL CONTROLLABLETOTAL CONTROLLABLETOTAL CONTROLLABLE $259,172 $259,172 $259,172 $259,172 $259,172 $259,172 $259,172 $259,172 $259,172 $259,172 $259,172 $259,172 $265,558 $265,558 $265,558 $265,558 (25.1%)(25.1%)(25.1%)(25.1%) $2,656$2,656$2,656$2,656 $2.55$2.55$2.55$2.55
TOTAL EXPENSESTOTAL EXPENSESTOTAL EXPENSESTOTAL EXPENSES $454,428 $454,428 $454,428 $454,428 $454,428 $454,428 $454,428 $454,428 $454,428 $454,428 $454,428 $454,428 $460,480 $460,480 $460,480 $460,480 (43.5%)(43.5%)(43.5%)(43.5%) $4,605$4,605$4,605$4,605 $4.42$4.42$4.42$4.42
NET OPERATING INCOMENET OPERATING INCOMENET OPERATING INCOMENET OPERATING INCOME $522,130 $522,130 $522,130 $522,130 $508,490 $508,490 $508,490 $508,490 $528,319 $528,319 $528,319 $528,319 $599,170 $599,170 $599,170 $599,170 (56.5%)(56.5%)(56.5%)(56.5%) $5,992$5,992$5,992$5,992 $5.75$5.75$5.75$5.75

FINANCIAL ANALYSISFINANCIAL ANALYSISFINANCIAL ANALYSISFINANCIAL ANALYSISYEAR 1 INCOME & EXPENSE NOTES
HIGHPOINT AT PELLA
22The information contained in this Marketing Brochure has been obtained from sources we believe to be reliable; however, Marcus & Millichap has not verified, and will not verify, any of the information contained herein, norhas Marcus & Millichap conducted any investigation regarding these matters and makes no warranty or representation whatsoever regarding the accuracy or completeness of the information provided. All potential buyersmust take appropriate measures to verify all of the information set forth herein. Marcus & Millichap Real Estate Investment Services is a service mark of Marcus & Millichap, Inc. © 2014 Marcus & Millichap.
(1)(1)(1)(1) Figures based on current rent roll.
(2)(2)(2)(2) 5% vacancy assumed for year 1.
(3)(3)(3)(3) 2.55% concessions assumed for year 1. Current rent roll shows $2,156 in discounts/concessions for January 2015, $25,872 annually.
(4)(4)(4)(4) $1,039 in manager apartment rent discount removed based on T-12 actuals.
(5)(5)(5)(5) Based on T-12 actuals.
(6)(6)(6)(6) Historically these figures are represented in the aggregated "rental income".
(7)(7)(7)(7) Based on 2014 tax bill.
(8)(8)(8)(8) These figures are based on T-12 Actuals
(9)(9)(9)(9) Management Fee set at 4% of EGI
(10)(10)(10)(10) Replacement & Reserve set at $300 per unit

FINANCIAL ANALYSISFINANCIAL ANALYSISFINANCIAL ANALYSISFINANCIAL ANALYSISGROWTH RATE OVERVIEW
HIGHPOINT AT PELLA
23The information contained in this Marketing Brochure has been obtained from sources we believe to be reliable; however, Marcus & Millichap has not verified, and will not verify, any of the information contained herein, norhas Marcus & Millichap conducted any investigation regarding these matters and makes no warranty or representation whatsoever regarding the accuracy or completeness of the information provided. All potential buyersmust take appropriate measures to verify all of the information set forth herein. Marcus & Millichap Real Estate Investment Services is a service mark of Marcus & Millichap, Inc. © 2014 Marcus & Millichap.
1111 2222 3333 4444 5555 6666 7777 8888 9999 10101010 11111111Fiscal Year Ending:Fiscal Year Ending:Fiscal Year Ending:Fiscal Year Ending: FebFebFebFeb----2016201620162016 FebFebFebFeb----2017201720172017 FebFebFebFeb----2018201820182018 FebFebFebFeb----2019201920192019 FebFebFebFeb----2020202020202020 FebFebFebFeb----2021202120212021 FebFebFebFeb----2022202220222022 FebFebFebFeb----2023202320232023 FebFebFebFeb----2024202420242024 FebFebFebFeb----2025202520252025 FebFebFebFeb----2026202620262026
RENTAL INCOMERENTAL INCOMERENTAL INCOMERENTAL INCOMEMarket Rent 3.00% 3.00% 3.00% 3.00% 3.00% 3.00% 3.00% 3.00% 3.00% 3.00% 3.00% Occupied Units Base Rent 3.00% Vacancy/Collection Allowance * 5.00% 5.00% 5.00% 5.00% 5.00% 5.00% 5.00% 5.00% 5.00% 5.00% 5.00% Concessions * 2.55% 2.00% 2.00% 2.00% 2.00% 2.00% 2.00% 2.00% 2.00% 2.00% 2.00% Model Apartments 3.00% 3.00% 3.00% 3.00% 3.00% 3.00% 3.00% 3.00% 3.00% 3.00% 3.00% Employee Apartment Discount 3.00% 3.00% 3.00% 3.00% 3.00% 3.00% 3.00% 3.00% 3.00% 3.00% 3.00%
OTHER INCOMEOTHER INCOMEOTHER INCOMEOTHER INCOMEInterest Income 3.00% 3.00% 3.00% 3.00% 3.00% 3.00% 3.00% 3.00% 3.00% 3.00% Application Fee Income 3.00% 3.00% 3.00% 3.00% 3.00% 3.00% 3.00% 3.00% 3.00% 3.00% Late Fee 3.00% 3.00% 3.00% 3.00% 3.00% 3.00% 3.00% 3.00% 3.00% 3.00% Utilities 3.00% 3.00% 3.00% 3.00% 3.00% 3.00% 3.00% 3.00% 3.00% 3.00% Cable 3.00% 3.00% 3.00% 3.00% 3.00% 3.00% 3.00% 3.00% 3.00% 3.00% Garage 3.00% 3.00% 3.00% 3.00% 3.00% 3.00% 3.00% 3.00% 3.00% 3.00% Washer/Dryer 3.00% 3.00% 3.00% 3.00% 3.00% 3.00% 3.00% 3.00% 3.00% 3.00% Pet 3.00% 3.00% 3.00% 3.00% 3.00% 3.00% 3.00% 3.00% 3.00% 3.00%
EXPENSESEXPENSESEXPENSESEXPENSESReal Estate Taxes 3.00% 3.00% 3.00% 3.00% 3.00% 3.00% 3.00% 3.00% 3.00% 3.00% Insurance 3.00% 3.00% 3.00% 3.00% 3.00% 3.00% 3.00% 3.00% 3.00% 3.00% Utilities 3.00% 3.00% 3.00% 3.00% 3.00% 3.00% 3.00% 3.00% 3.00% 3.00% Contract Services 3.00% 3.00% 3.00% 3.00% 3.00% 3.00% 3.00% 3.00% 3.00% 3.00% Repairs & Maintenance 3.00% 3.00% 3.00% 3.00% 3.00% 3.00% 3.00% 3.00% 3.00% 3.00% Marketing & Promotion 3.00% 3.00% 3.00% 3.00% 3.00% 3.00% 3.00% 3.00% 3.00% 3.00% On-Site Payroll 3.00% 3.00% 3.00% 3.00% 3.00% 3.00% 3.00% 3.00% 3.00% 3.00% General & Administrative 3.00% 3.00% 3.00% 3.00% 3.00% 3.00% 3.00% 3.00% 3.00% 3.00% Management Fee ** 4.00% 4.00% 4.00% 4.00% 4.00% 4.00% 4.00% 4.00% 4.00% 4.00% 4.00% Replacement & Reserves 3.00% 3.00% 3.00% 3.00% 3.00% 3.00% 3.00% 3.00% 3.00% 3.00%
Notes: * Calculated as a Percentage of Gross Potential Rent
** Calculated as a Percentage of Effective Gross Income

FINANCIAL ANALYSISFINANCIAL ANALYSISFINANCIAL ANALYSISFINANCIAL ANALYSIS10 YEAR CASH FLOW
HIGHPOINT AT PELLA
24The information contained in this Marketing Brochure has been obtained from sources we believe to be reliable; however, Marcus & Millichap has not verified, and will not verify, any of the information contained herein, norhas Marcus & Millichap conducted any investigation regarding these matters and makes no warranty or representation whatsoever regarding the accuracy or completeness of the information provided. All potential buyersmust take appropriate measures to verify all of the information set forth herein. Marcus & Millichap Real Estate Investment Services is a service mark of Marcus & Millichap, Inc. © 2014 Marcus & Millichap.
1111 2222 3333 4444 5555 6666 7777 8888 9999 10101010 11111111Fiscal Year Ending:Fiscal Year Ending:Fiscal Year Ending:Fiscal Year Ending: FebFebFebFeb----2016201620162016 FebFebFebFeb----2017201720172017 FebFebFebFeb----2018201820182018 FebFebFebFeb----2019201920192019 FebFebFebFeb----2020202020202020 FebFebFebFeb----2021202120212021 FebFebFebFeb----2022202220222022 FebFebFebFeb----2023202320232023 FebFebFebFeb----2024202420242024 FebFebFebFeb----2025202520252025 FebFebFebFeb----2026202620262026
RENTAL INCOMERENTAL INCOMERENTAL INCOMERENTAL INCOMEAll Units at Market Rent $961,608 $990,456 $1,020,170 $1,050,775 $1,082,298 $1,114,767 $1,148,210 $1,182,657 $1,218,136 $1,254,680 $1,292,321 Gain (Loss)-to-Lease 3,597 0 0 0 0 0 0 0 0 0 0
GROSS POTENTIAL RENTGROSS POTENTIAL RENTGROSS POTENTIAL RENTGROSS POTENTIAL RENT $965,205 $965,205 $965,205 $965,205 $990,456 $990,456 $990,456 $990,456 $1,020,170 $1,020,170 $1,020,170 $1,020,170 $1,050,775 $1,050,775 $1,050,775 $1,050,775 $1,082,298 $1,082,298 $1,082,298 $1,082,298 $1,114,767 $1,114,767 $1,114,767 $1,114,767 $1,148,210 $1,148,210 $1,148,210 $1,148,210 $1,182,657 $1,182,657 $1,182,657 $1,182,657 $1,218,136 $1,218,136 $1,218,136 $1,218,136 $1,254,680 $1,254,680 $1,254,680 $1,254,680 $1,292,321 $1,292,321 $1,292,321 $1,292,321
TOTAL ECONOMIC LOSSTOTAL ECONOMIC LOSSTOTAL ECONOMIC LOSSTOTAL ECONOMIC LOSS ($72,873)($72,873)($72,873)($72,873) ($69,332)($69,332)($69,332)($69,332) ($71,412)($71,412)($71,412)($71,412) ($73,554)($73,554)($73,554)($73,554) ($75,761)($75,761)($75,761)($75,761) ($78,034)($78,034)($78,034)($78,034) ($80,375)($80,375)($80,375)($80,375) ($82,786)($82,786)($82,786)($82,786) ($85,270)($85,270)($85,270)($85,270) ($87,828)($87,828)($87,828)($87,828) ($90,462)($90,462)($90,462)($90,462)
TOTAL OTHER INCOMETOTAL OTHER INCOMETOTAL OTHER INCOMETOTAL OTHER INCOME $167,319 $167,319 $167,319 $167,319 $172,338 $172,338 $172,338 $172,338 $177,508 $177,508 $177,508 $177,508 $182,834 $182,834 $182,834 $182,834 $188,319 $188,319 $188,319 $188,319 $193,968 $193,968 $193,968 $193,968 $199,787 $199,787 $199,787 $199,787 $205,781 $205,781 $205,781 $205,781 $211,954 $211,954 $211,954 $211,954 $218,313 $218,313 $218,313 $218,313 $224,862 $224,862 $224,862 $224,862
EFFECTIVE GROSS INCOMEEFFECTIVE GROSS INCOMEEFFECTIVE GROSS INCOMEEFFECTIVE GROSS INCOME $1,059,651 $1,059,651 $1,059,651 $1,059,651 $1,093,463 $1,093,463 $1,093,463 $1,093,463 $1,126,266 $1,126,266 $1,126,266 $1,126,266 $1,160,054 $1,160,054 $1,160,054 $1,160,054 $1,194,856 $1,194,856 $1,194,856 $1,194,856 $1,230,702 $1,230,702 $1,230,702 $1,230,702 $1,267,623 $1,267,623 $1,267,623 $1,267,623 $1,305,652 $1,305,652 $1,305,652 $1,305,652 $1,344,821 $1,344,821 $1,344,821 $1,344,821 $1,385,166 $1,385,166 $1,385,166 $1,385,166 $1,426,721 $1,426,721 $1,426,721 $1,426,721
EXPENSESEXPENSESEXPENSESEXPENSESReal Estate Taxes $123,254 $126,952 $130,760 $134,683 $138,723 $142,885 $147,172 $151,587 $156,134 $160,819 $165,643 Insurance 27,063 27,875 28,712 29,573 30,460 31,374 32,315 33,285 34,283 35,312 36,371 Utilities 44,605 45,944 47,322 48,742 50,204 51,710 53,261 54,859 56,505 58,200 59,946
TOTAL NONTOTAL NONTOTAL NONTOTAL NON----CONTROLLABLECONTROLLABLECONTROLLABLECONTROLLABLE 194,923 194,923 194,923 194,923 200,771 200,771 200,771 200,771 206,794 206,794 206,794 206,794 212,997 212,997 212,997 212,997 219,387 219,387 219,387 219,387 225,969 225,969 225,969 225,969 232,748 232,748 232,748 232,748 239,731 239,731 239,731 239,731 246,922 246,922 246,922 246,922 254,330 254,330 254,330 254,330 261,960 261,960 261,960 261,960
Contract Services 54,428 56,061 57,742 59,475 61,259 63,097 64,990 66,939 68,947 71,016 73,146 Repairs & Maintenance 56,531 58,227 59,974 61,773 63,626 65,535 67,501 69,526 71,612 73,760 75,973 Marketing & Promotion 1,772 1,826 1,880 1,937 1,995 2,055 2,116 2,180 2,245 2,313 2,382 On-Site Payroll 63,920 65,838 67,813 69,847 71,943 74,101 76,324 78,614 80,972 83,401 85,903 General & Administrative 16,520 17,016 17,526 18,052 18,593 19,151 19,726 20,317 20,927 21,555 22,201 Management Fee 42,386 43,739 45,051 46,402 47,794 49,228 50,705 52,226 53,793 55,407 57,069 Replacement & Reserves 30,000 30,900 31,827 32,782 33,765 34,778 35,822 36,896 38,003 39,143 40,317
TOTAL CONTROLLABLETOTAL CONTROLLABLETOTAL CONTROLLABLETOTAL CONTROLLABLE 265,558 265,558 265,558 265,558 273,605 273,605 273,605 273,605 281,813 281,813 281,813 281,813 290,268 290,268 290,268 290,268 298,976 298,976 298,976 298,976 307,945 307,945 307,945 307,945 317,183 317,183 317,183 317,183 326,699 326,699 326,699 326,699 336,500 336,500 336,500 336,500 346,595 346,595 346,595 346,595 356,993 356,993 356,993 356,993
TOTAL EXPENSESTOTAL EXPENSESTOTAL EXPENSESTOTAL EXPENSES $460,480 $460,480 $460,480 $460,480 $474,376 $474,376 $474,376 $474,376 $488,607 $488,607 $488,607 $488,607 $503,265 $503,265 $503,265 $503,265 $518,363 $518,363 $518,363 $518,363 $533,914 $533,914 $533,914 $533,914 $549,931 $549,931 $549,931 $549,931 $566,429 $566,429 $566,429 $566,429 $583,422 $583,422 $583,422 $583,422 $600,925 $600,925 $600,925 $600,925 $618,953 $618,953 $618,953 $618,953
NET OPERATING INCOMENET OPERATING INCOMENET OPERATING INCOMENET OPERATING INCOME $599,170 $599,170 $599,170 $599,170 $619,087 $619,087 $619,087 $619,087 $637,659 $637,659 $637,659 $637,659 $656,789 $656,789 $656,789 $656,789 $676,493 $676,493 $676,493 $676,493 $696,788 $696,788 $696,788 $696,788 $717,691 $717,691 $717,691 $717,691 $739,222 $739,222 $739,222 $739,222 $761,399 $761,399 $761,399 $761,399 $784,241 $784,241 $784,241 $784,241 $807,768 $807,768 $807,768 $807,768
DEBT SERVICE DEBT SERVICE DEBT SERVICE DEBT SERVICE ---- CMBSCMBSCMBSCMBSPrincipal Payments $78,355 $82,621 $87,118 $91,861 $96,861 $102,134 $107,694 $113,557 $29,342 $0 Interest Payments 261,967 257,701 253,203 248,461 243,460 238,187 232,627 226,765 55,738 0 Mortgage Repaid 0 0 0 0 0 0 0 0 4,186,984 0
TOTAL DS TOTAL DS TOTAL DS TOTAL DS ---- CMBSCMBSCMBSCMBS $340,322 $340,322 $340,322 $340,322 $340,322 $340,322 $340,322 $340,322 $340,322 $340,322 $340,322 $340,322 $340,322 $340,322 $340,322 $340,322 $340,322 $340,322 $340,322 $340,322 $340,322 $340,322 $340,322 $340,322 $340,322 $340,322 $340,322 $340,322 $340,322 $340,322 $340,322 $340,322 $4,272,064 $4,272,064 $4,272,064 $4,272,064 $0 $0 $0 $0
NET CASH FLOW AFTER DEBT SERVICENET CASH FLOW AFTER DEBT SERVICENET CASH FLOW AFTER DEBT SERVICENET CASH FLOW AFTER DEBT SERVICE $258,848 $258,848 $258,848 $258,848 $278,765 $278,765 $278,765 $278,765 $297,338 $297,338 $297,338 $297,338 $316,468 $316,468 $316,468 $316,468 $336,171 $336,171 $336,171 $336,171 $356,466 $356,466 $356,466 $356,466 $377,370 $377,370 $377,370 $377,370 $398,900 $398,900 $398,900 $398,900 ($3,510,666)($3,510,666)($3,510,666)($3,510,666) $784,241 $784,241 $784,241 $784,241
DEBT SERVICE COVERAGE RATIODEBT SERVICE COVERAGE RATIODEBT SERVICE COVERAGE RATIODEBT SERVICE COVERAGE RATIO 1.76 1.82 1.87 1.93 1.99 2.05 2.11 2.17 0.18 0.00

FINANCIAL ANALYSISFINANCIAL ANALYSISFINANCIAL ANALYSISFINANCIAL ANALYSIS10 YEAR CASH FLOW
HIGHPOINT AT PELLA
25The information contained in this Marketing Brochure has been obtained from sources we believe to be reliable; however, Marcus & Millichap has not verified, and will not verify, any of the information contained herein, norhas Marcus & Millichap conducted any investigation regarding these matters and makes no warranty or representation whatsoever regarding the accuracy or completeness of the information provided. All potential buyersmust take appropriate measures to verify all of the information set forth herein. Marcus & Millichap Real Estate Investment Services is a service mark of Marcus & Millichap, Inc. © 2014 Marcus & Millichap.
MARKET RENT GROWTHMARKET RENT GROWTHMARKET RENT GROWTHMARKET RENT GROWTH TOTAL ECONOMIC LOSSTOTAL ECONOMIC LOSSTOTAL ECONOMIC LOSSTOTAL ECONOMIC LOSS
Year 1 3.00% Year 1 7.55%
Year 2 3.00% Year 2 7.00%
Year 3 3.00% Year 3 7.00%
Year 4 3.00% Year 4 7.00%
Year 5 3.00% Year 5 7.00%
3 Year Average3 Year Average3 Year Average3 Year Average 3.00% 3.00% 3.00% 3.00% 5 Year Average5 Year Average5 Year Average5 Year Average 7.11% 7.11% 7.11% 7.11%
5 Year Average5 Year Average5 Year Average5 Year Average 3.00% 3.00% 3.00% 3.00% 10 Year Average10 Year Average10 Year Average10 Year Average 7.06% 7.06% 7.06% 7.06%
GROSS POTENTIAL RENT (GPR) GROWTHGROSS POTENTIAL RENT (GPR) GROWTHGROSS POTENTIAL RENT (GPR) GROWTHGROSS POTENTIAL RENT (GPR) GROWTH PROJECTED YEAR 1 OPERATIONSPROJECTED YEAR 1 OPERATIONSPROJECTED YEAR 1 OPERATIONSPROJECTED YEAR 1 OPERATIONS
Year 1 3.00% Gross Potential Rent (GPR) per Month $80,434 per Month
Year 2 2.62% Net Rental Income per Month (excludes Other Income) $74,361 per Month
Year 3 3.00% Effective Gross Income (EGI) per Month $88,304 per Month
Year 4 3.00% Net Operating Income (NOI) per Month $49,931 per Month
Year 5 3.00% Total Expenses per Unit $4,605 per Unit
3 Year Average3 Year Average3 Year Average3 Year Average 2.87% 2.87% 2.87% 2.87% Controllable Expenses per Unit * $2,656 per Unit
5 Year Average5 Year Average5 Year Average5 Year Average 2.92% 2.92% 2.92% 2.92% Repairs & Maintenance/Contract Services per Unit $1,110 per Unit
Insurance per Unit $271 per Unit
Insurance per SF $0.26 per SF
GAIN (LOSS)GAIN (LOSS)GAIN (LOSS)GAIN (LOSS)----TOTOTOTO----LEASE LEASE LEASE LEASE (as a % of Market) Management Fee 4.00%
CurrentCurrentCurrentCurrent 0.37% 0.37% 0.37% 0.37% Replacements & Reserves per Unit $300 per Unit
Year 1 0.37%
Year 2 0.00% Notes:
Year 3 0.00% * Controllable Expense is derived by subtracting Real Estate Taxes, Insurance, and Utilities from the total operating expense figure.Year 4 0.00%
Year 5 0.00%

FINANCIAL ANALYSISFINANCIAL ANALYSISFINANCIAL ANALYSISFINANCIAL ANALYSISTERMINOLOGY
Monthly Rent Roll Report:Monthly Rent Roll Report:Monthly Rent Roll Report:Monthly Rent Roll Report:The Monthly Rent Roll Report is furnished by the Seller or property management company. The Occupied Units Base Rent is derived from this report and is subsequently annualized.
Start of Analysis:Start of Analysis:Start of Analysis:Start of Analysis: Month and year that the analysis is to start. The start date is always considered to occur at the beginning of the month.
First Year of Analysis:First Year of Analysis:First Year of Analysis:First Year of Analysis:Month and year that the first year of the analysis end. The month is always interpreted as the end of the month and is 12 months after the Start of the Analysis.
End of Analysis:End of Analysis:End of Analysis:End of Analysis: Month and year that the analysis ends. The end date is always considered to occur at the end of the month.
Analysis Period:Analysis Period:Analysis Period:Analysis Period: The number of years in the analysis.
Occupied Units Base Rent:Occupied Units Base Rent:Occupied Units Base Rent:Occupied Units Base Rent: Actual occupied (in-place) base rental income billed as of specific date . Does not include non-rental income, vacancy, loss-to-lease or model units.
Vacant Units at Market Rent:Vacant Units at Market Rent:Vacant Units at Market Rent:Vacant Units at Market Rent:Estimated rental income as of a certain date that could be obtained from vacant, and model, units if they were rented "at market." Does not include rent from occupied units or non-rental income.
Gross Potential Rent:Gross Potential Rent:Gross Potential Rent:Gross Potential Rent:Amount of potential rental income that could be obtained as of a certain date. Amount is the sum of Occupied Units Base Rent plus Vacant Units at Market Rent. Does not include non-rental income.
All Units at Market Rent:All Units at Market Rent:All Units at Market Rent:All Units at Market Rent: Estimated amount of money a unit or group of units could rent for in the "free & open market" at a given date.
Gain (Loss)Gain (Loss)Gain (Loss)Gain (Loss)----totototo----Lease:Lease:Lease:Lease:Amount of gain (lost) rental income from rented units due to a "gap" between the amount of rent tenants are paying according to their lease and the rent they would be paying if the unit could be rented "at market."
RUBS:RUBS:RUBS:RUBS:RUBS, for ratio (sometimes referred to as resident) utility billing system. The property's water/sewer &/or trash bill is allocated among residents based on the square footage of the apartment, number of occupants, number of taps, number of fixtures, or some other quantitative measure. Owner's then allocate, based upon the above methodology, a portion of the property's total water/sewer &/or trash bill among residents.
Sales Price:Sales Price:Sales Price:Sales Price: Price that the property is being offered or under contract at.
HIGHPOINT AT PELLA
26The information contained in this Marketing Brochure has been obtained from sources we believe to be reliable; however, Marcus & Millichap has not verified, and will not verify, any of the information contained herein, norhas Marcus & Millichap conducted any investigation regarding these matters and makes no warranty or representation whatsoever regarding the accuracy or completeness of the information provided. All potential buyersmust take appropriate measures to verify all of the information set forth herein. Marcus & Millichap Real Estate Investment Services is a service mark of Marcus & Millichap, Inc. © 2014 Marcus & Millichap.

FINANCIAL ANALYSISFINANCIAL ANALYSISFINANCIAL ANALYSISFINANCIAL ANALYSISTERMINOLOGY
Acquisition Reserves:Acquisition Reserves:Acquisition Reserves:Acquisition Reserves:Buyer costs &/or reserves that are added to the Sales/Listing Price for the purposes of calculating the internal rate of return and other financial ratios (ex: due diligence & closing costs, capital cost reserves, loan origination fees, etc.).
Total Unleveraged Acquisition Cost:Total Unleveraged Acquisition Cost:Total Unleveraged Acquisition Cost:Total Unleveraged Acquisition Cost: The total unleveraged capitalized cost used to determine the unleveraged internal rate of return and financial ratios.
Total Leveraged Acquisition Cost:Total Leveraged Acquisition Cost:Total Leveraged Acquisition Cost:Total Leveraged Acquisition Cost:The total leveraged capitalized cost used to determine the leveraged internal rate of return and financial ratios (ex: Total Leveraged Acquisition Cost less the Loan Amount/Balance equals Equity Required).
Reserves per Unit:Reserves per Unit:Reserves per Unit:Reserves per Unit:Amount of money per unit per year that is reserved or expended on replacement items, such as capital expenditures, appliance replacement, unit turnover preparation, etc.
GoingGoingGoingGoing----In CAP Rate:In CAP Rate:In CAP Rate:In CAP Rate: The first year of the analysis (Year 1) net operating income (NOI) divided by the Sales Price, Unleveraged Acquisition Cost or Leveraged Acquisition Cost.
Terminal CAP Rate:Terminal CAP Rate:Terminal CAP Rate:Terminal CAP Rate: CAP Rate used in the resale calculations. Resale is always calculated at the end of the year and is determined by the following year's net operating income.
Cost of Sale:Cost of Sale:Cost of Sale:Cost of Sale:Percentage that will be deducted from the gross proceeds from resale. Cost of sale should include the resale commission and any other expenditures associated with the resale.
Internal Rate of Return (IRR):Internal Rate of Return (IRR):Internal Rate of Return (IRR):Internal Rate of Return (IRR):The IRR is typically defined as "that rate of return that equates the present value of anticipated future benefits with the present value of the investment outlays." The IRR integrates the concepts of compounding and present value. It represents a way a measuring a return on investment over the entire investment period, expressed as a compound rate of interest.
Discount Rates:Discount Rates:Discount Rates:Discount Rates:The unleveraged or leveraged required IRR of an investor over a specified holding period. The discount rate is influenced by the degree of apparent systematic and non-systematic risk, prospective rates of return for alternative investment opportunities, historical rates of return earned by comparable properties, market attitudes with respect to future inflation or deflation, supply and demand for mortgage funds, etc.
Present Values:Present Values:Present Values:Present Values:
The present value of a prospective benefit must be less than its expected future value. A future benefit is discounted to a present value by calculating the amount that, if invested today, would grow with compound interest at a satisfactory rate to equal the future benefit. The procedures used to reduce a future value to a present value is called discounting, and the extent of the discounting depends on the discount rate required to satisfy the investor and the length of time that the investor must wait for payment.
HIGHPOINT AT PELLA
27The information contained in this Marketing Brochure has been obtained from sources we believe to be reliable; however, Marcus & Millichap has not verified, and will not verify, any of the information contained herein, norhas Marcus & Millichap conducted any investigation regarding these matters and makes no warranty or representation whatsoever regarding the accuracy or completeness of the information provided. All potential buyersmust take appropriate measures to verify all of the information set forth herein. Marcus & Millichap Real Estate Investment Services is a service mark of Marcus & Millichap, Inc. © 2014 Marcus & Millichap.
Presented by:Presented by:Presented by:Presented by:
David N GainesDavid N GainesDavid N GainesDavid N Gaines Alex BlagojevichAlex BlagojevichAlex BlagojevichAlex Blagojevich Will RyanWill RyanWill RyanWill Ryan Barry A’HearnBarry A’HearnBarry A’HearnBarry A’HearnVice President Investments Vice President Investments Associate Broker of Record IowaChicago Downtown Tampa, FL Chicago Downtown Cedar Rapids, IADirect (312) 327-5427 Direct (813) 387-4845 Tel: (312) 327-5419 Direct (319) 298-4658Mobile (847) 340-3171 Mobile (773) 899-0391 Mobile: (415) 218-4535 Fax (866) [email protected] [email protected] [email protected] [email protected]
HIGHPOINT AT PELLAPELLA, IA
Offices NationwideOffices NationwideOffices NationwideOffices Nationwidewww.marcusmillichap.comwww.marcusmillichap.comwww.marcusmillichap.comwww.marcusmillichap.com


![31 Tecton Edificio Highpoint [1]](https://img.dokumen.tips/doc/110x75/55640d59d8b42a0d0c8b4e15/31-tecton-edificio-highpoint-1.jpg)