Embed Size (px)
Citation preview

© Henley Business School 2008 www.henley.reading.ac.uk
School of Real Estate & Planning
Optimal Portfolio Allocation using TLI
Tommaso Gabrieli University of Reading
Davide Manstretta IPD
School of Real Estate & Planning
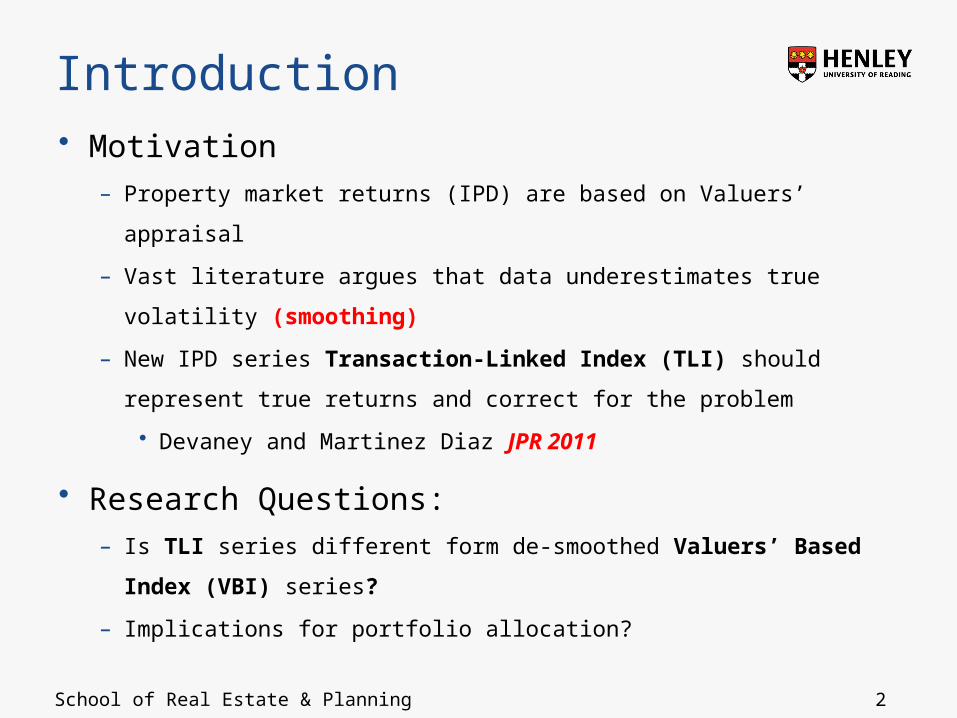
Introduction• Motivation
– Property market returns (IPD) are based on Valuers’ appraisal
– Vast literature argues that data underestimates true volatility
(smoothing)
– New IPD series Transaction-Linked Index (TLI) should
represent true returns and correct for the problem
• Devaney and Martinez Diaz JPR 2011
• Research Questions:– Is TLI series different form de-smoothed Valuers’ Based
Index (VBI) series?
– Implications for portfolio allocation?
2

School of Real Estate & Planning
Agenda
• Introduction and Results Overview
• A little bit of theory:– Problem definition
• Empirical Results:– Differences between TLI and de-smoothed VBI
– Portfolio Allocation analysis
• Conclusions• Main Result
– TLI and de-smoothed VBI are very different; strong implications for portfolio allocation
3

School of Real Estate & Planning
TLI vs. VBI capital growth, QTLY 2002-2010
4
Sep-
02
Jan-
03
May-0
3
Sep-
03
Jan-
04
May-0
4
Sep-
04
Jan-
05
May-0
5
Sep-
05
Jan-
06
May-0
6
Sep-
06
Jan-
07
May-0
7
Sep-
07
Jan-
08
May-0
8
Sep-
08
Jan-
09
May-0
9
Sep-
09
Jan-
10
May-1
0
Sep-
10
-15.0
-10.0
-5.0
0.0
5.0
10.0
15.0
TLI q410IPD VBI CG
Quarter
Returns

School of Real Estate & Planning
Smoothing • Assumptions:
– Property Market Returns are Valuation Based• May Lag Market Movements – Distorts Correlation• May Be “Smoothed” – Understates the Volatility
– “De-smoothing” Procedures• Remove the Impact of Valuations in Data
– Reported return is a blend of “true” and previous return
• De-smoothing:– Rv
t = a Rvt-1 + (1-a)Rt
Therefore Rt = {Rvt - a Rv
t-1 } / (1-a)
where a is the “smoothing parameter”
• Vast literature: – Blundell and Ward (1987), Quan and Quigley (1991), Brown
and Matysiak (2000), Geltner et al. (2002) and many others…
5

School of Real Estate & Planning
TLI vs. De-smoothedTLI Des
0.8Des 0.65
Des 0.5
Des 0.25
Des 0.1
VBI
St Dev
6.4 15.2 8.8 6.5 5.1 4.7 4.5
AR1 0.2 0.1 0.3 0.4 0.6 0.7 0.76
Corr with TLI
1 0.38 0.52 0.62 0.72 0.74 0.74
6

School of Real Estate & Planning
TLI vs. De-smoothed
7
Sep-02
Dec-02
Mar-03
Jun-03
Sep-03
Dec-03
Mar-04
Jun-04
Sep-04
Dec-04
Mar-05
Jun-05
Sep-05
Dec-05
Mar-06
Jun-06
Sep-06
Dec-06
Mar-07
Jun-07
Sep-07
Dec-07
Mar-08
Jun-08
Sep-08
Dec-08
Mar-09
Jun-09
Sep-09
Dec-09
Mar-10
Jun-10
Sep-10
Dec-10
-40.0
-30.0
-20.0
-10.0
0.0
10.0
20.0
30.0
TLI q410
VBI des 65%
VBI des 10%
Quarters
Returns

School of Real Estate & Planning
TLI vs. De-smoothed (Q3 2002 – Q1 2007)
TLI Des 0.8
Des 0.65
Des 0.5
Des 0.25
Des 0.1
VBI
St Dev
4.80 5.1 2.8 2.0 1.4 1.3 1.2
AR1 -0.34 -0.4 -0.3 -0.1 0.3 0.5 0.6
Corr with TLI
1.00 0.33 0.34 0.35 0.32 0.30 0.29
8
School of Real Estate & Planning
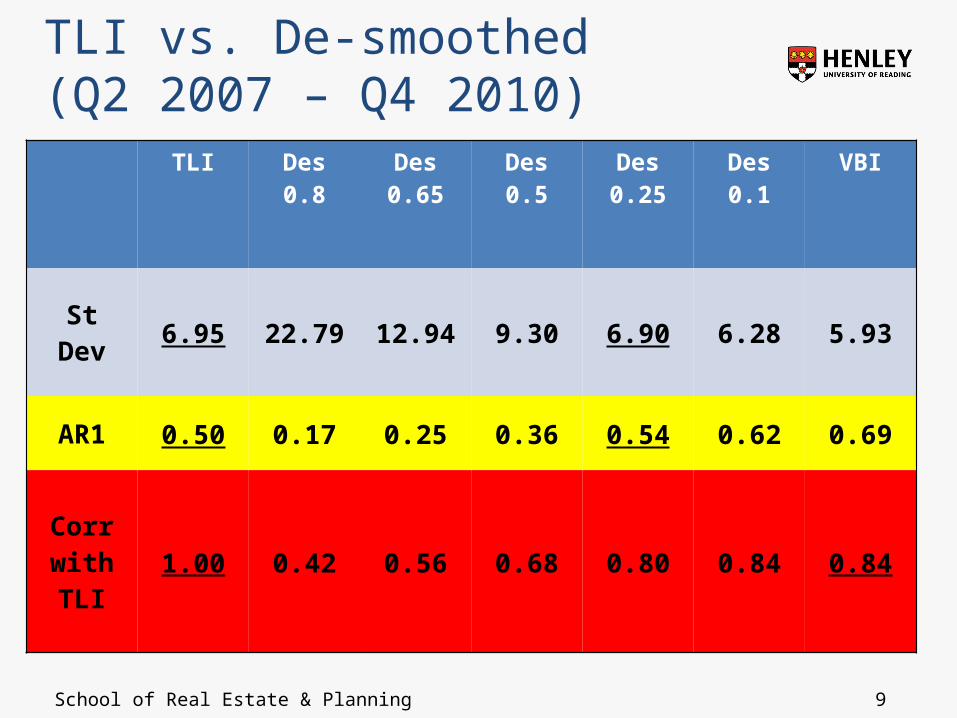
TLI vs. De-smoothed (Q2 2007 – Q4 2010)
TLI Des 0.8
Des 0.65
Des 0.5
Des 0.25
Des 0.1
VBI
St Dev
6.95 22.79 12.94 9.30 6.90 6.28 5.93
AR1 0.50 0.17 0.25 0.36 0.54 0.62 0.69
Corr with TLI
1.00 0.42 0.56 0.68 0.80 0.84 0.84
9
School of Real Estate & Planning
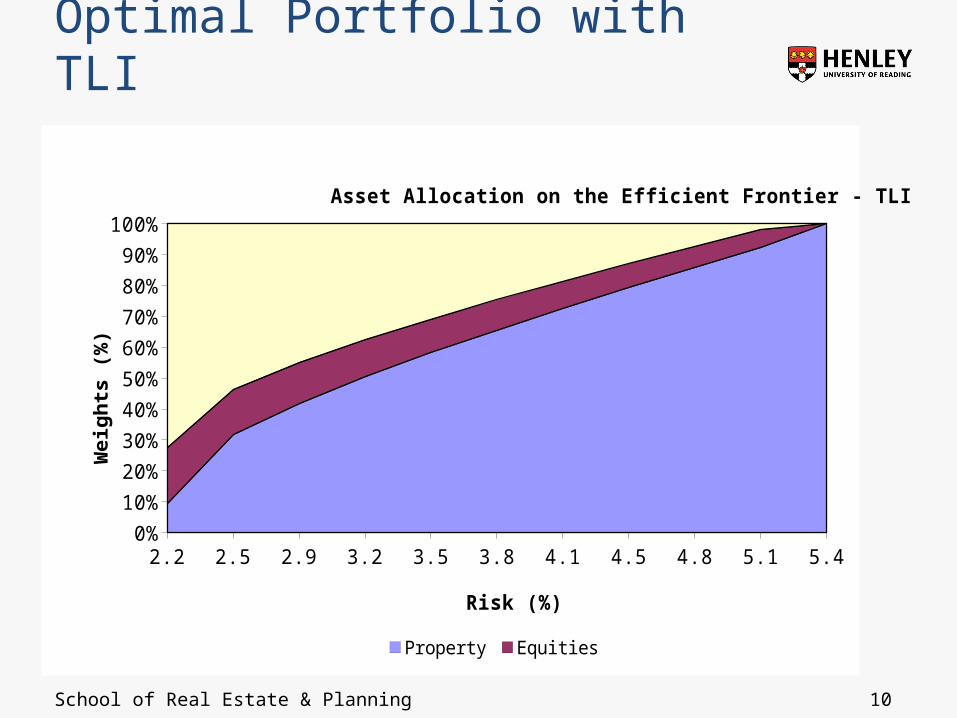
Optimal Portfolio with TLI
10
2.2 2.5 2.9 3.2 3.5 3.8 4.1 4.5 4.8 5.1 5.4 0%
10%
20%
30%
40%
50%
60%
70%
80%
90%
100%
Asset Allocation on the Efficient Frontier - TLI
Property Equities Gilts
Risk (%)
We
igh
ts (
%)

School of Real Estate & Planning
Optimal Portfolio, TLI vs. VBI
11
2.2
2.5
2.9
3.2
3.5
3.8
4.1
4.5
4.8
5.1
5.4
0%20%40%60%80%
100%Asset Allocation on the Efficient Frontier - TLI
Risk (%)
Wei
gh
ts (
%)
1.8
2.5
3.2
3.9
4.5
5.2
5.9
6.6
7.2
7.9
8.6
0%20%40%60%80%
100%
Asset Allocation on the Efficient FrontierUnsmoothed Property Data
Risk (%)
Wei
gh
ts (
%)
1.8
2.5
3.1
3.8
4.5
5.2
5.9
6.5
7.2
7.9
7.8
0%20%40%60%80%
100%
Asset Allocation on the Efficient FrontierDe-Smoothed (0.65) Property Data
Risk (%)Wei
gh
ts (
%)
1.8
2.5
3.1
3.8
4.5
5.2
5.9
6.5
7.2
7.9
7.8
0%20%40%60%80%
100%
Asset Allocation on the Efficient FrontierDe-Smoothed (0.25) Property Data
Risk (%)Wei
gh
ts (
%)

School of Real Estate & Planning
Optimal Portfolio, TLI vs. VBI (Q3 2002 – Q1 2007)
12
2.2
2.5
2.9
3.2
3.5
3.8
4.1
4.5
4.8
5.1
5.4
0%20%40%60%80%
100%Asset Allocation on the Efficient Frontier - TLI
Risk (%)
We
igh
ts (
%)
1.8
2.5
3.2
3.9
4.5
5.2
5.9
6.6
7.2
7.9
8.6
0%
50%
100%
Asset Allocation on the Efficient FrontierUnsmoothed Property Data
Risk (%)
Wei
gh
ts (
%)
1.8
2.5
3.1
3.8
4.5
5.2
5.9
6.5
7.2
7.9
7.8
0%
50%
100%
Asset Allocation on the Efficient FrontierDe-Smoothed (0.65) Property Data
Risk (%)
We
igh
ts (
%)
1.8
2.5
3.1
3.8
4.5
5.2
5.9
6.5
7.2
7.9
7.8
0%
50%
100%
Asset Allocation on the Efficient FrontierDe-Smoothed (0.25) Property Data
Risk (%)
Wei
gh
ts (
%)

School of Real Estate & Planning
Efficient Frontier
13
1.0 2.0 3.0 4.0 5.0 6.0 7.0 8.0 9.0 -
0.5
1.0
1.5
2.0
2.5
3.0
3.5
VBI
VBI des 025
TLI
VBI des 065
St Dev
Retu
rns
School of Real Estate & Planning
Conclusion• Findings
– According to TLI, property is a very attractive asset class– TLI and De-smoothed VBI are very different, which is
theoretically worrying...
• Extensions– Annual Data– Implied smoothing parameter
14

School of Real Estate & Planning
Thank you for your attention
Questions?
Comments?
15