Embed Size (px)
Citation preview

Improving methods for advanced
testing / examination and
optimization the catalytic
conversion processes
Delft 22nd April 2015
TOTeM 40 – IFRF “Gasification, a versatile technology converting biomass to produce synfuels, heat and power”
Dr Kyriakos Panopoulos Principal Researcher / Centre for Research & Technology Hellas / Chemical Process and Energy Resources Institute (CERTH/CPERI) / e-mail: [email protected] contributions by : CERTH, TUBITAK, PSI, ECN, TUM, ETC

Thermochemical value chain based on
gasification
---
--------
------
Gas cleaning Biomass
Coal Gasification Methanation
----
-----
---
--------
------
-----
----
Gas cleaning Biomass
Coal Gasification
Methanation
Gas cleaning Biomass
Coal Gasification Methanation
8.1 Developing methodologies for catalysts testing for FT and higher alcohols
8.2 Developing methodologies for catalysts testing for SNG with synthetic and real biosyngas.
8.3 Developing methodologies for catalysts testing with advanced synthesis gas impurities measurement for DME/MeOH syntheses
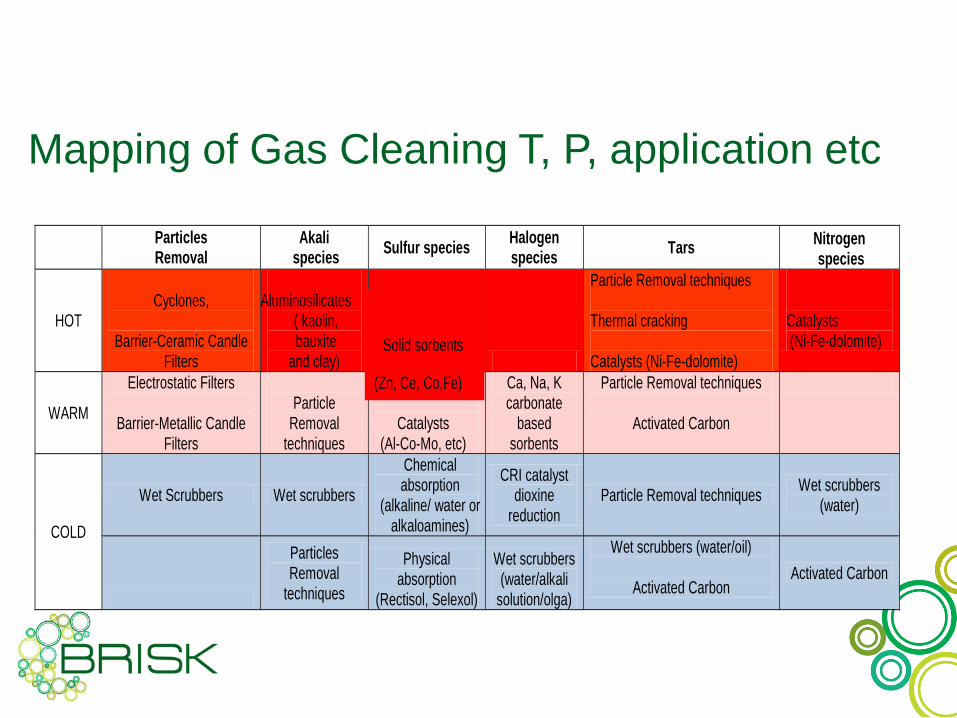
Mapping of Gas Cleaning T, P, application etc
Particles Removal
Akali species
Sulfur species Halogen species
Tars Nitrogen species
HOT
Cyclones,
Barrier-Ceramic Candle
Filters
Aluminosilicates
( kaolin, bauxite
and clay)
Particle Removal techniques Thermal cracking Catalysts (Ni-Fe-dolomite)
Catalysts (Ni-Fe-dolomite)
WARM
Electrostatic Filters
Barrier-Metallic Candle Filters
Particle
Removal techniques
Catalysts (Al-Co-Mo, etc)
Ca, Na, K carbonate
based sorbents
Particle Removal techniques
Activated Carbon
COLD
Wet Scrubbers Wet scrubbers
Chemical absorption
(alkaline/ water or alkaloamines)
CRI catalyst dioxine
reduction Particle Removal techniques
Wet scrubbers (water)
Particles Removal
techniques
Physical absorption
(Rectisol, Selexol)
Wet scrubbers (water/alkali
solution/olga)
Wet scrubbers (water/oil)
Activated Carbon Activated Carbon
Solid sorbents
(Zn, Ce, Co,Fe)

WP, tasks in relation to other WP’s
WP6
WP7 WP5 WP4 WP8
8.1 Developing methodologies for catalysts testing for FT and higher alcohols
8.2 Developing methodologies for catalysts testing for SNG with synthetic and real biosyngas.
8.3 Developing methodologies for catalysts testing with advanced synthesis gas impurities measurement for DME/MeOH syntheses
Biomass derived constituents Syngas quality
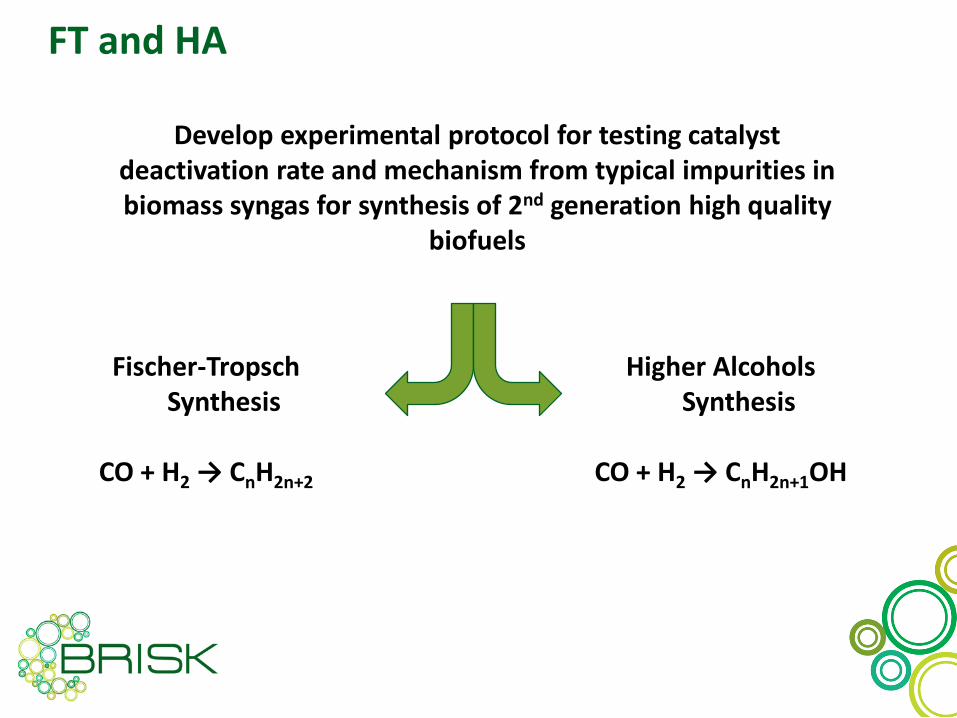
FT and HA
Develop experimental protocol for testing catalyst deactivation rate and mechanism from typical impurities in biomass syngas for synthesis of 2nd generation high quality
biofuels
Fischer-Tropsch Synthesis
CO + H2 → CnH2n+2
Higher Alcohols Synthesis
CO + H2 → CnH2n+1OH

TUBİTAK
Catalyst synthesis/Characterisation
Attrition assessment with nonreactive tests
Effect of operating conditions on FTS and catalyst
attrition in CSTR
Activity profiles of the catalyst in CSTR under
different operating conditions
Catalyst - wax separation studies
Used catalyst characterisation –PSD, SEM
Attrition assessment
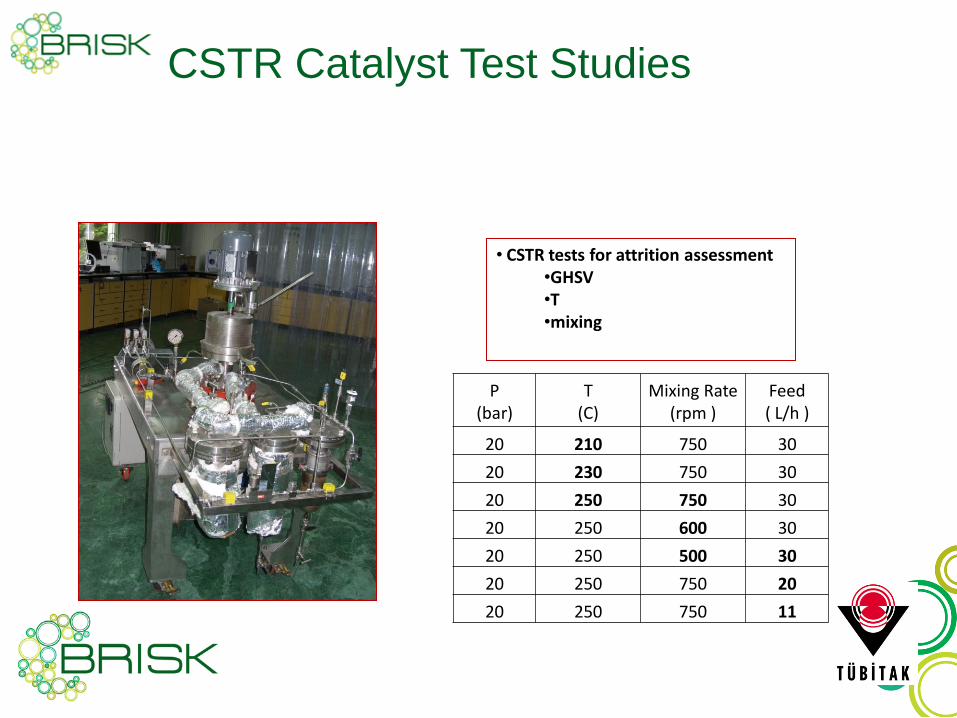
CSTR Catalyst Test Studies
P (bar)
T (C)
Mixing Rate (rpm )
Feed ( L/h )
20 210 750 30
20 230 750 30
20 250 750 30
20 250 600 30
20 250 500 30
20 250 750 20
20 250 750 11
• CSTR tests for attrition assessment •GHSV •T •mixing

Catalyst Recovery Studies
Wax- catalyst separation
Reactor media after reaction Wax-catalyst mixture Liquid product
Catalyst separation with soxhlet extraction

Attrition Assessment
Effect of Temperature
0
20
40
60
80
100
0 50 100 150
CO
co
nve
rsio
n (
%)
time (h)
CO Conversion vs. T
210C
230C
250C
0
20
40
60
80
100
0 50 100 150 200 250 300
Mea
n p
arti
cle
dia
met
er (
µ)
T (C)
Particle size - T
0
20
40
60
80
100
120
0.1 1 10 100
Mas
s Fi
ner
(%
)
Equivalent spherical diameter (µ)
Effect of T on PSD
Fresh
210 °C
230 °C
250 °C
T=210 C T=230 C T=250 C
Fresh catalyst
Used catalysts

Attrition Assessment
Effect of Gas Space Velocity
50
60
70
80
90
100
40 90 140
CO
co
nve
rsio
n (
%)
time (h)
CO Conversion vs. SV
2 nL/h
1 nL/h
0.7 nL/h
0
20
40
60
80
100
0 0.5 1 1.5 2 2.5
Mea
n p
arti
cle
dia
met
er (
µ)
SV (nL/h)
Particle diameter - SV
0
20
40
60
80
100
120
0.1 1 10 100
Mas
s Fi
ner
(%
)
Equivalent spherical diameter (µ)
Effect of SV on PSD
Fresh
0.7 nL/h
1 nL/h
2 nL/h
SV=2 SV=0.7 SV=1
Fresh catalyst
Used catalysts
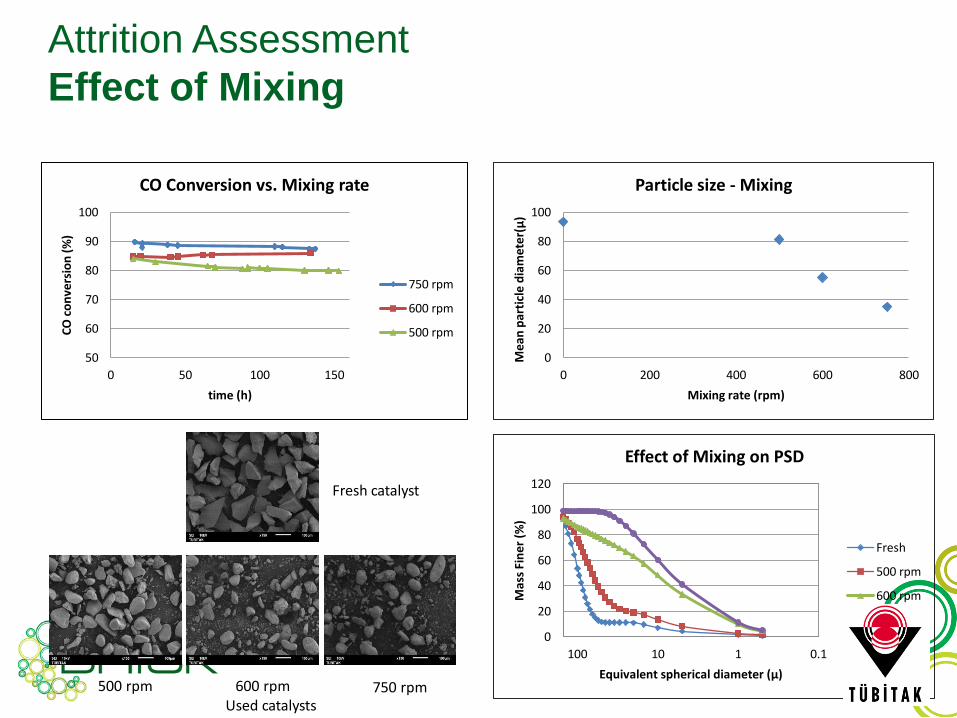
Attrition Assessment
Effect of Mixing
50
60
70
80
90
100
0 50 100 150
CO
co
nve
rsio
n (
%)
time (h)
CO Conversion vs. Mixing rate
750 rpm
600 rpm
500 rpm
0
20
40
60
80
100
0 200 400 600 800
Mea
n p
arti
cle
dia
met
er(µ
)
Mixing rate (rpm)
Particle size - Mixing
0
20
40
60
80
100
120
0.1 1 10 100
Mas
s Fi
ner
(%
)
Equivalent spherical diameter (µ)
Effect of Mixing on PSD
Fresh
500 rpm
600 rpm
750 rpm
500 rpm 750 rpm 600 rpm
Fresh catalyst
Used catalysts

Determination of standard testing protocol for higher alcohol synthesis from syngas • Development of complex product analysis method • Investigation of the effect of operating conditions (pressure,
temperature, CO/H2 ratio) • Definition of standard testing protocol T = 250-320°C, P = 40-60
bar, H2/CO = 2 Effect of pressure
(280cc/min, 300 C, H2/CO=2)
0
2
4
6
8
10
12
10 25 40
Πίεση, bar
Μετ
ατρ
οπ
ή,
%
CO
H2
Effect of temperature(280cc/min, 40bar, H2/CO=2)
0
2
4
6
8
10
12
280 300 320
Θερμοκρασία, °C
Μετ
ατρ
οπ
ή,
%
CO
H2
Temperature, °C Pressure, bar
Co
nv
ers
ion
, %
Co
nv
ers
ion
, %

Bench test unit operating conditions Operating Variable Effective range
Reactors Fixed bed 316SS
Catalyst volume max 25 cm3
Temperature max 600°C
Pressure max 80 bar
Temperature of liquid
feed/product max 300°C
Gas 1 flow rate, N2 0-500 cm3/min
Gas 2 flow rate, H2 0-500 cm3/min
Gas 3 flow rate, CO 0-500 cm3/min
Liquid feed flow rate 0-10 cm3/min
Task 8.1 Developing methodologies for catalysts testing for HA - Progress: M1- M18
Task 8.1 Developing methodologies for catalysts testing for HA - Progress: M1- M18
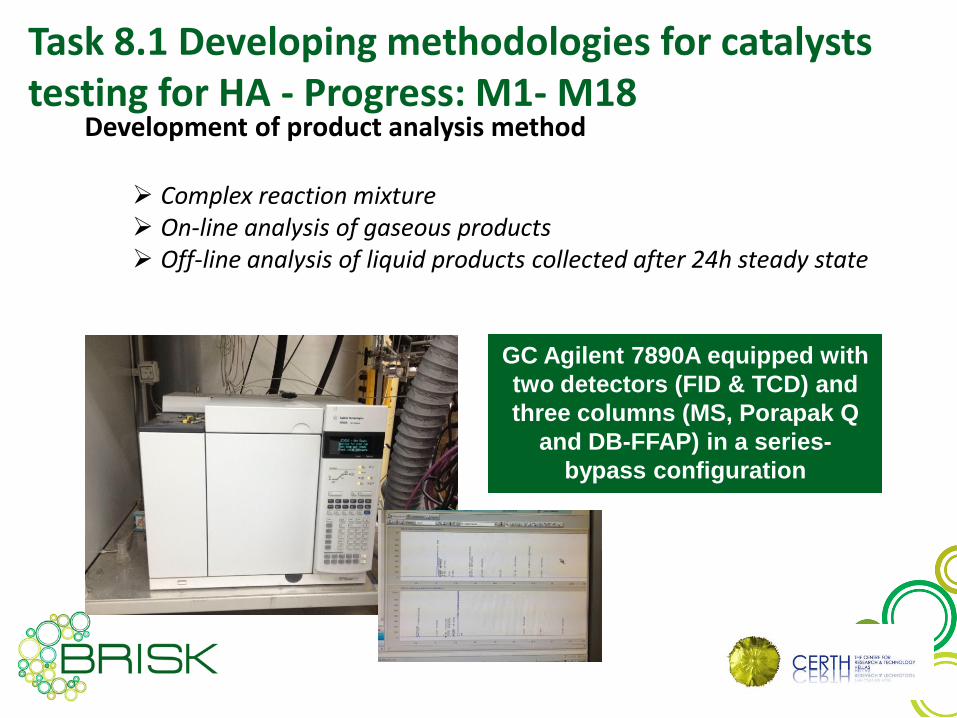
Development of product analysis method
Complex reaction mixture On-line analysis of gaseous products Off-line analysis of liquid products collected after 24h steady state
GC Agilent 7890A equipped with
two detectors (FID & TCD) and
three columns (MS, Porapak Q
and DB-FFAP) in a series-
bypass configuration

Development of product analysis method Gaseous products Liquid products
CARBON DIOXIDE ETHYLENE ETHANE PENTANE DME HEXANE HEPTANE OCTANE HYDROGEN METHANE CARBON MONOXIDE 2-METHYL-2-PROPANOL METHANOL 2-PROPANOL ETHANOL 2-BUTANOL 1-PROPANOL PROPYLENE
PROPANE 2-METHYL-1-PROPANOL 1-BUTANOL DODECANE 2/3-METHYL-1-BUTANOL 1-PENTANOL BUTANE 1-HEXANOL ISOPENTANE TETRADECANE HEPTADECANE ICOSANE UNIDENTIFIED
PENTANE HEXANE HEPTANE OCTANE 2-METHYL-2-PROPANOL METHANOL 2-PROPANOL ETHANOL 2-BUTANOL 1-PROPANOL 2-METHYL-1-PROPANOL 1-BUTANOL 2/3-METHYL-1-BUTANOL 1-PENTANOL 1-HEXANOL
Task 8.1 Developing methodologies for catalysts testing for HA - Progress: M1- M18

Synthesis of standard HAS catalyst
0.5K-Cu45Zn45Al10 Cu(NO3)2.2.5 H2O
Zn(NO3)2.6 H2O
Al(NO3)3.9 H2O
Na2CO3 70°C
pH=6-7
Calcination
350°C/air/4h
K2CO3
Cu45Zn45Al10
catalyst
Calcination
350°C/air/4h
0.5K-Cu45Zn45Al10
catalyst
Drying
120°C/24h Co-precipitation
K-promotion
Developing methodologies for catalysts testing for HA

Pre-reaction catalyst characterization
Catalyst
Nominal composition,
wt% ICP composition, wt% Surface
area,
m2/g
CuO particle
size* (nm) Cu Zn Al K Cu Zn Al K
K-Cu45/Zn45/Al10 37 38 4 0.5 39 44 3 0.5 33 8.3
Physicochemical characteristics
*Calculated from the XRD patterns using the Scherrer equation.
5 10 15 20 25 30 35 40 45 50 55 60 65 70 75 80
Inte
nsit
y, a
.u.
2θ, °
K-CuZnAl CuO
ZnO
XRD
Developing methodologies for catalysts testing for HA
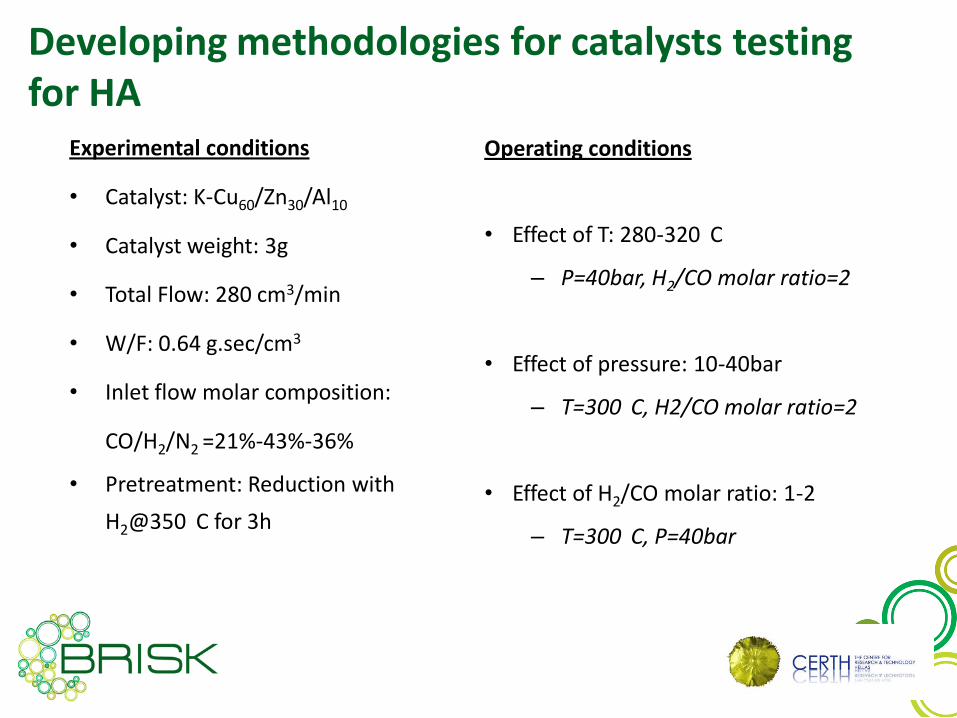
Experimental conditions
• Catalyst: K-Cu60/Zn30/Al10
• Catalyst weight: 3g
• Total Flow: 280 cm3/min
• W/F: 0.64 g.sec/cm3
• Inlet flow molar composition:
CO/H2/N2 =21%-43%-36%
• Pretreatment: Reduction with
H2@350 C for 3h
Operating conditions
• Effect of T: 280-320 C
– P=40bar, H2/CO molar ratio=2
• Effect of pressure: 10-40bar
– T=300 C, H2/CO molar ratio=2
• Effect of H2/CO molar ratio: 1-2
– T=300 C, P=40bar
Developing methodologies for catalysts testing for HA

• Synthesis of an activated carbon supported catalyst – 35%wt K0.05Mo1Ni1 /AC
• Pre-reaction catalyst characterization – ΒΕΤ, XRD, ICP, H2-TPR, NH3-TPD
• Catalyst testing under the standard predefined conditions determined during M1-M12
CO conv=25%
CO conv=7.9%
Reaction conditions (P=60bar, W/F=0.63g.s/cm3, H2/CO=2)
NH3-TPD
H2-TPR

• Effect of NH3 impurity in syngas for CO hydrogenation to higher alcohols
• Post-catalyst characterization
Alcohols mixture

Effect of NH3 impurity in syngas for CO hydrogenation to higher alcohols
• Catalyst: 35%wt K0.05Mo1Ni1 supported on AC
• Run for 55h under pure syngas • Inject 85ppm NH3
• Run for 250h in total • No major influence of CO
Conversion and Products selectivity noticed with NH3 presence
Reaction conditions (T=280°C, P=60bar, W/F=0.63g s/cm3, H2/CO=2)
35%KNiMo/AC
85ppm NH3

Post-catalyst characterization (XRD, BET, ICP)
• Catalyst: 35%KMoNi/AC • Post experiment XRD results show
carbon formation and reduction of the of Ni quantity
• SiC2 identified by the XRD derives from the silica used to dilute the catalyst in the reactor
• BET results show an extreme decrease of surface post experiment
• ICP composition of Ni and Mo are reduced post experiment, mainly due to carbon deposition
Catalyst ICP composition, wt% Surface
area, m2/g
Ni Mo K
Fresh
35%KNiMo/AC 13.3 21.6 0.4 425
Used
35%KNiMo/AC 5.1 16.5 0.5 7.8

Effect of Benzene impurity in syngas for CO hydrogenation to higher alcohols
• Catalyst: 35%wt K0.05Mo1Ni1 supported on AC
• Run for 12h under pure syngas • Inject 130 ppm benzene
• Run for 134 h in total • No major influence of CO
Conversion and Products selectivity noticed with benzene presence
Reaction conditions (T=280°C, P=60bar, W/F=0.64g s/cm3, H2/CO=2)

Post-catalyst characterization (XRD, BET, ICP)
• Catalyst: 35%KMoNi/AC • Post experiment XRD results show
carbon formation and reduction of the of Ni quantity
• SiC2 identified by the XRD derives from the silica used to dilute the catalyst in the reactor
• BET results show an decrease of surface pore volume
• ICP composition of Ni and Mo are reduced post experiment, mainly due to carbon deposition
Catalyst ICP composition, wt%
Pore Volume,
cm3/g
Ni Mo K
Fresh
35%KNiMo/AC 13.1 21.4 0.4 0.29
Used
35%KNiMo/AC 5.9 14.8 0.4 0.068

Catalyst work at ECN connected to 500 h bio-SNG test:
Wood gasification => producer gas
producer gas cleaning (dust & tar removal)
Catalytic producer gas cleaning (organic S conversion & S removal)
Producer gas conversion to CH4 (+ H2O + CO2 + trace H2)
>500 hrs realised within ~600 hrs real time

500 hrs SNG production test
0:00 3:00 6:00 9:00 12:00 15:00 18:00 21:00 0:00 3:00 6:00 9:00 12:00 15:00 18:00 21:00 0:00 3:00 6:00 9:00 12:00 15:00 18:00 21:00 0:00 3:00 6:00 9:00 #### #### #### ####
MILENA
OLGA
HDS ACTIVATION N2/H2
R11, R12 DRUK TEST SPOELEN START COMPRESSORR13 START STEAMstop
R14
R15
START 500-H TEST
0:00 3:00 6:00 9:00 12:00 15:00 18:00 21:00 0:00 3:00 6:00 9:00 12:00 15:00 18:00 21:00 0:00 3:00 6:00 9:00 12:00 15:00 18:00 21:00 0:00 3:00 6:00 9:00 #### #### #### ####
MILENA
OLGA
HDS
R11, R12
R13
R14
R15
0:00 3:00 6:00 9:00 12:00 15:00 18:00 21:00 0:00 3:00 6:00 9:00 12:00 15:00 18:00 21:00 0:00 3:00 6:00 9:00 12:00 15:00 18:00 21:00 0:00 3:00 6:00 9:00 #### #### #### ####
MILENA
OLGA
HDS
R11, R12
R13
R14
R15
151 h
29-sep 30-sep 1-okt 2-okt
3-okt 4-okt 5-okt 6-okt
7-okt 8-okt 9-okt 10-okt
N E
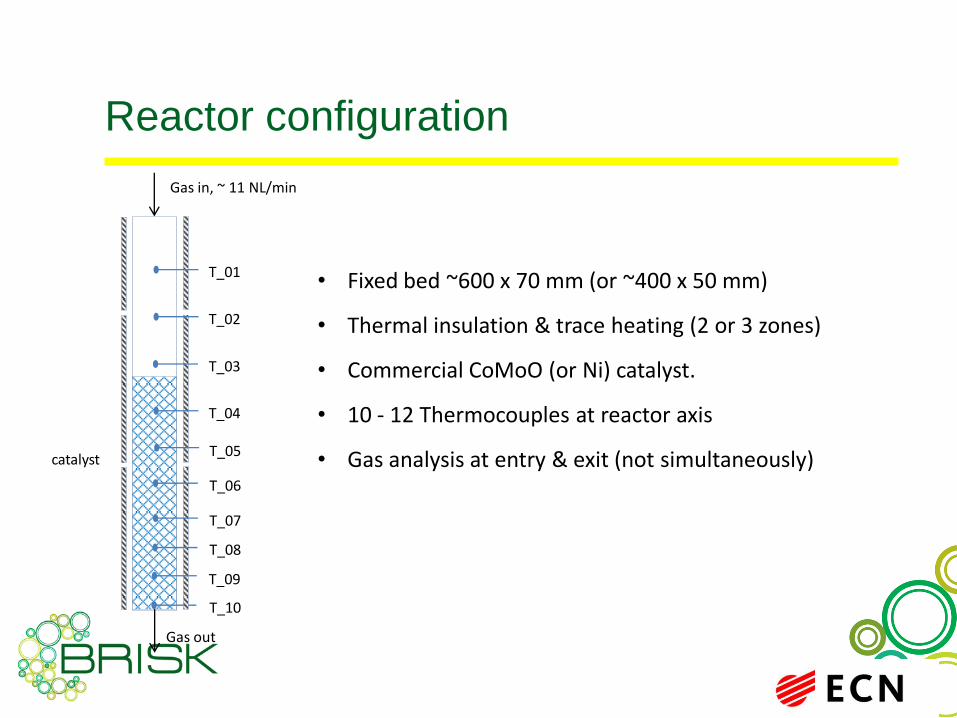
Reactor configuration
T_01
T_02
T_03
T_04
T_05
T_06
T_07
Gas in, ~ 11 NL/min
Gas out
catalyst
T_08
T_10
T_09
• Fixed bed ~600 x 70 mm (or ~400 x 50 mm)
• Thermal insulation & trace heating (2 or 3 zones)
• Commercial CoMoO (or Ni) catalyst.
• 10 - 12 Thermocouples at reactor axis
• Gas analysis at entry & exit (not simultaneously)
27
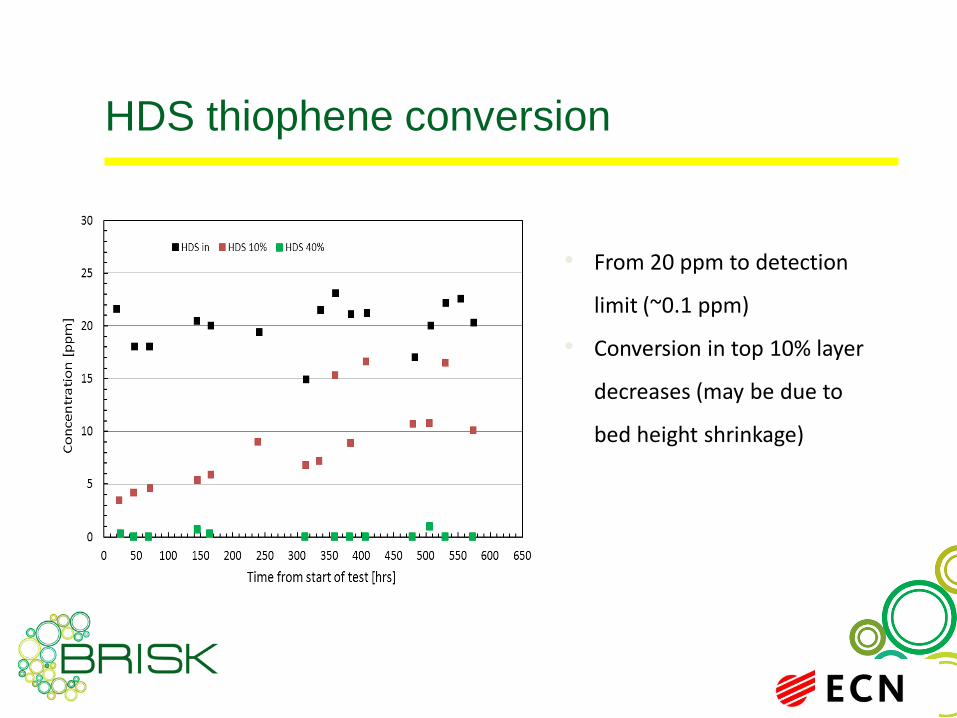
HDS thiophene conversion
28
• From 20 ppm to detection
limit (~0.1 ppm)
• Conversion in top 10% layer
decreases (may be due to
bed height shrinkage)
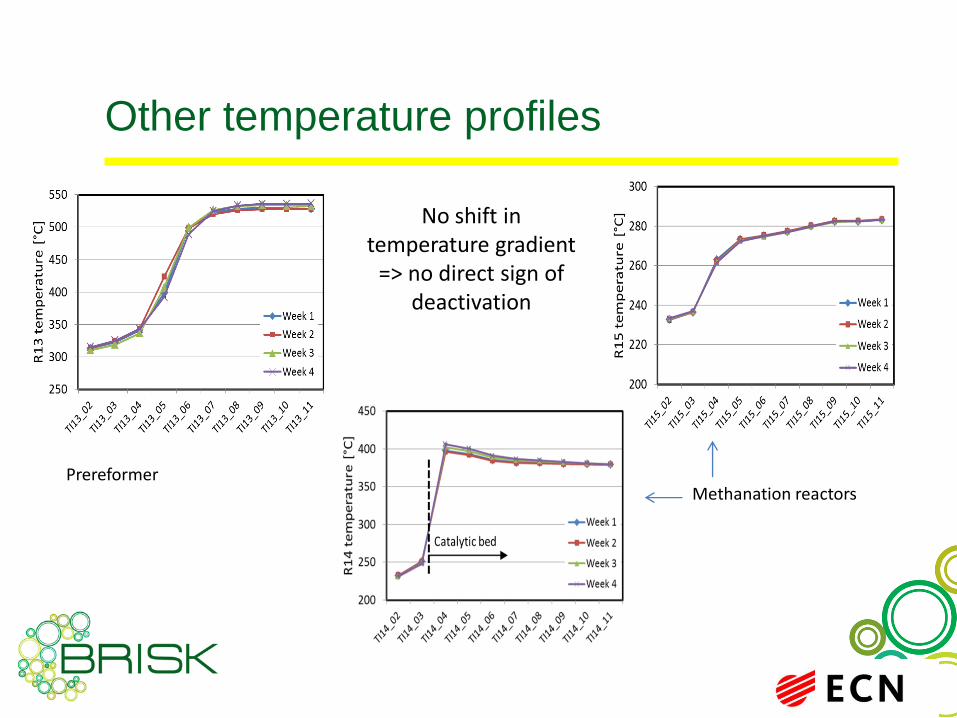
Other temperature profiles
29
No shift in temperature gradient
=> no direct sign of deactivation
Prereformer Methanation reactors

Page 30
Option for measuring C2H4 kinetics during
methanation

Page 31
BFB reactor: Improvements of test rig 2013/2014
Switching valves
Displaceable
sampling device
Surfboard
optimisation Optimised
cooling air
system
Isothermal BFB methanation for kinetic measurements: C2H4 + H2 C2H6
December 2013 December 2014
Highly dynamic
heating/cooling system
Optimised gas
inlet tempering
Improved gas sampling

Page 32
Improvements of the heat management in details
Highly dynamic
heating/cooling
system
Gas inlet
tempering/
preheating

Page 33
Typical results generated with the consolidated setup

Page 34
R&D on H2-rich methanation (Power-to-Gas: PtG)
• Lab experiments proof:
Fluidised bed catalyst is suited
for CO2-methanation
0
10
20
30
40
50
60
70
80
90
100
250 275 300 325 350
Car
bo
n f
ract
ion
[%
]
Temperature [°C]
CH4
CO2
CO
Experimental outlook:
• Reactor modelling ongoing & experiments
in pilot scale for model validation in prep.
• Dynamic variation of part load operation
and H2-addition for all PtG-cases (CO2,
biogas, gasification producer gas) pilot plant
(160 kWSNG)

Page 35
Biomass-to-SNG test rig @ TUM
TUM/LES 35
Allothermal gasifier
Gas cleaning and methanation

Page 36
Process scheme with sampling points
Raw gas (E) (after hot gas filter)
Clean gas (IV) (before methanation)
Ultra clean gas (ε) (after methanation/condensation)

TUM/LES 37
Installed gas analysis @ TUM
Permanent gases H2, CO, CO2, CH4
Hydrocarbons C2 – C5
H2S analysis
SPA sampling (direct) Tars
Steam content

Gas analysis – by components
• Steam: – Raw gas: Hygrophil H4230 P025 from BARTEC (psychrometric principle, condensation ΔT measurement)
– Clean gas: EE31-D Sensor from E+E Elektronik (capacitive measurement)
• Permanent gases: – Raw gas and clean gas:
• Measurement cabinet (Sick-Maihak S700)
• O2 (leakage): online paramagnetic measurement
• CO, CO2, CH4, H2: online infrared and heat conductivity measurement
• Tars and H2S: • SPA method
• Monocolor for H2S measurement

Page 39
Permanent gas analysis Infrared Analyzer
Online measurement of product gas
components
CO2, CO and CH4 are directly measured by
non-dispersive infrared analyzer (NDIR)
The content of H2 is measured via
heat conductivity (TCD)

Page 40
H2S analysis (lower ppm-range)
Monocolor (colorimetric technique) for selective H2S measurements.
H2S
[mg/
Nm
3 ]

HP6890A:
Gas analysis: H2, O2, N2, CO2, CO Higher hydrocarbons (C2-C5) Two columns: HP-PLOT-Q, HP-PLOT-5A,
Carrier: Helium Thermal conductivity detector (TCD)
HP7890A:
Tar analysis: (H2, O2, N2, CO2, CO, H2O, CH4,) tars
Four columns: HP-PLOT-Q, HP-PLOT-5A, HP-5, Gaspro, Carrier: Helium
Thermal conductivity detector (TCD), Flame ionisation detector (FID)
Tars and higher hydrocarbons
LPG
Oxidant (O2/N2)
Inert (N2)
Cooling water
Quench water outlet
FI
TC
TC
TC
TC
TC
Gas analyses (FTIR/MicroGC)
Particulate sampling
Cam
Lock
hopper 1
Lock
hopper 2
Fuel feeder
Reactor
Quench
Pressure
regulator
Flare
Pilot flare
Quench spray registers
Syngas flow meter
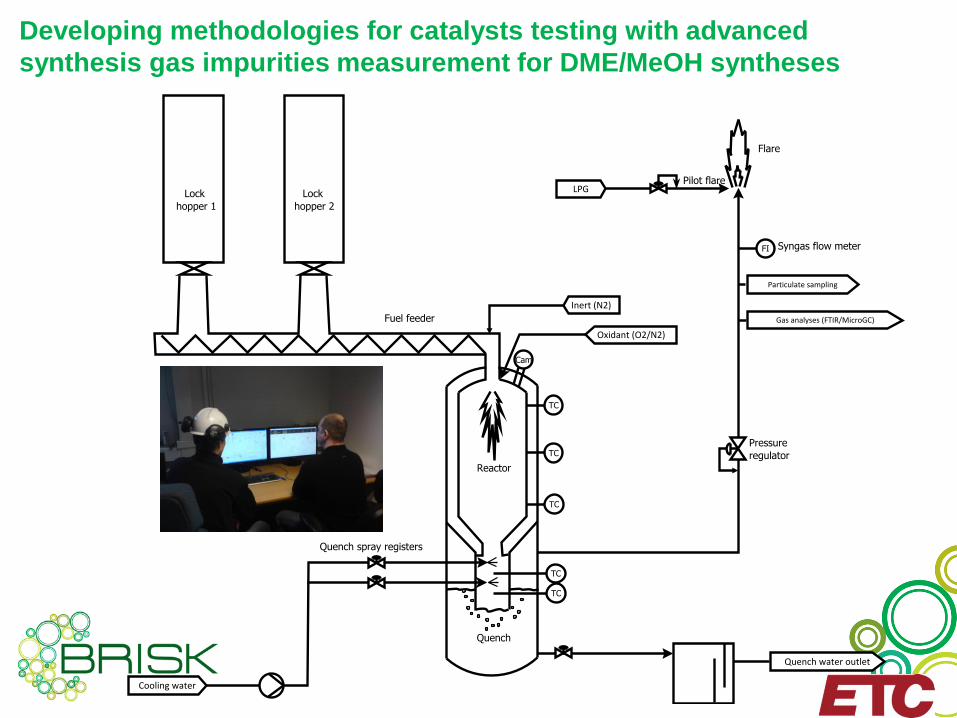
Developing methodologies for catalysts testing with advanced
synthesis gas impurities measurement for DME/MeOH syntheses
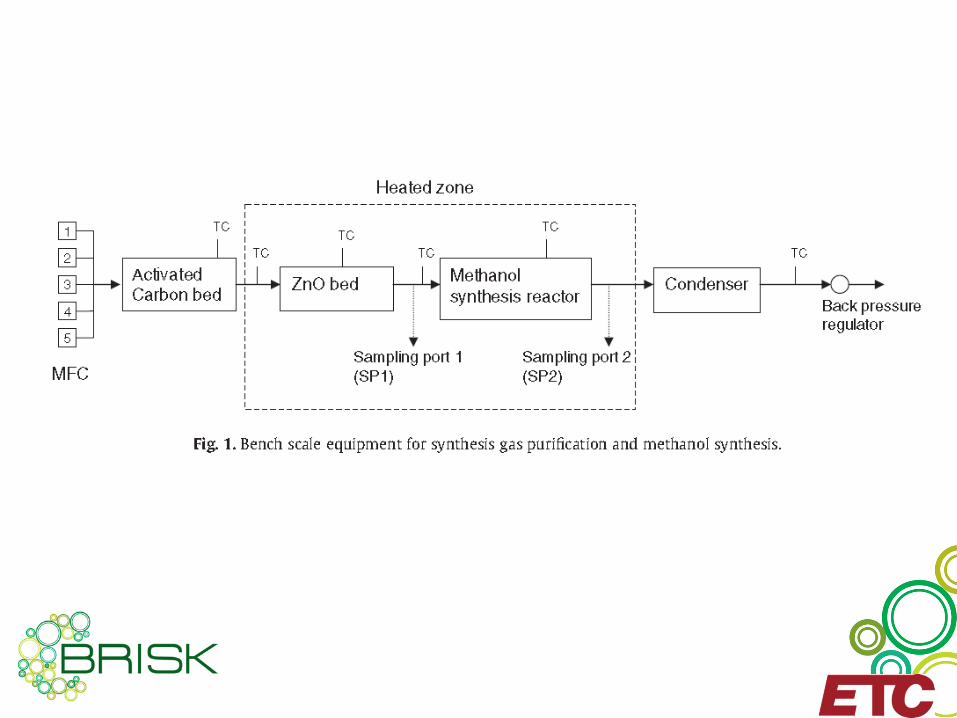

Conversion of syngas to methanol
Activated
carbon H2S removal
by ZnO Methanol
synthesis
Methanol removal
from test rig
Häggström, C., Öhrman, O., Rownaghi, A., Hedlund, J. and Gebart, R.
Catalytic methanol synthesis via black liquor gasification.
Fuel Processing Technology 94 (2012) 10-15.
Häggström, C., Öhrman, O., Gebart, R., Hedlund, J.,
Catalytic synthesis of methanol from black liquor derived synthesis gas.
4th International DME Conference, Stockholm, 6-9 Sep. 2010.
45
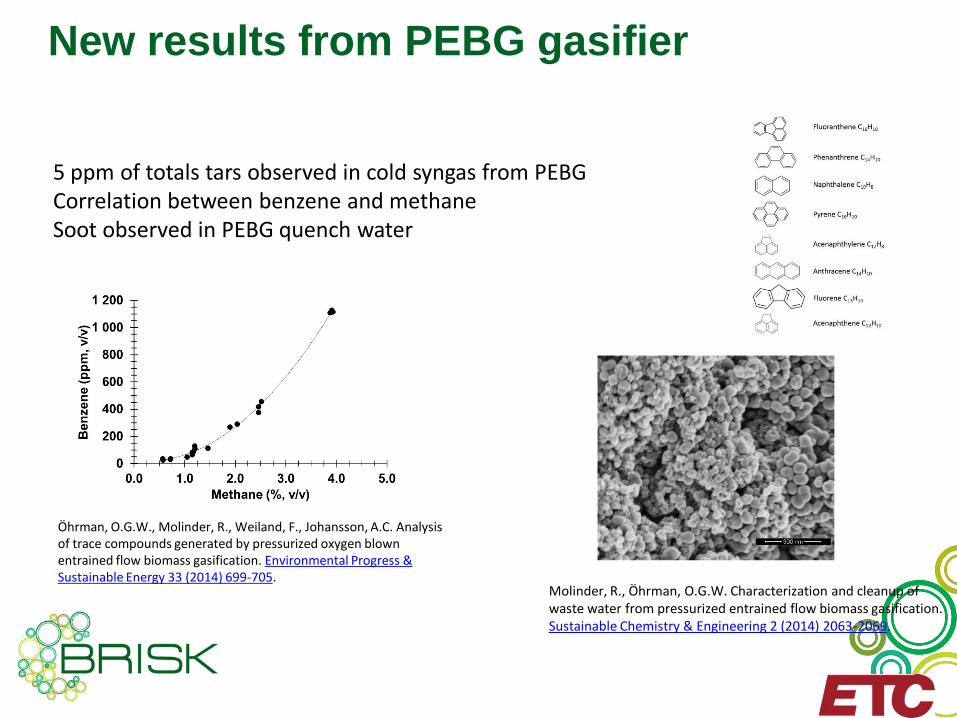
New results from PEBG gasifier
Öhrman, O.G.W., Molinder, R., Weiland, F., Johansson, A.C. Analysis of trace compounds generated by pressurized oxygen blown entrained flow biomass gasification. Environmental Progress & Sustainable Energy 33 (2014) 699-705.
5 ppm of totals tars observed in cold syngas from PEBG Correlation between benzene and methane Soot observed in PEBG quench water
Molinder, R., Öhrman, O.G.W. Characterization and cleanup of waste water from pressurized entrained flow biomass gasification. Sustainable Chemistry & Engineering 2 (2014) 2063-2069.

Gaseous impurities from PEBG
46
ER = oxygen equivalence ratio

Thank you for your attention !
contributions by : CERTH, TUBITAK, PSI, ECN, TUM, ETC