Embed Size (px)
Citation preview

1
GLOBAL VIEWS 2010
U.S. PUBLIC TOPLINE REPORT General Population
/revised/
September 22, 2010
GLOBAL VIEWS 2010 TOPLINE DATA FROM U.S. PUBLIC SURVEY
Survey Findings (Question Ordering and Page Numbering)
Question Topic General Population
Survey Question Number Topline Report Page Number
Follow news Q1 2 Active Part in World Affairs Q3 2 Threats to Vital Interests in Next 10 Years Q5 2 Foreign Policy Goals Q7 10 Globalization and the U.S. Q10 18 Future of Next Generation of Americans Q15 19 U.S. Leadership in World Affairs Q20 19 America’s Place in the World Q22 19 Federal Government Programs Q25 20 Defense budget Q26 24 Justification for Use of U.S. Troops Q30 25 Number of U.S. bases overseas Q35 28 Long-term U.S. Military Bases in Countries Q40 28 Thermometer of Countries and People Q45 31 Influence of Countries Now Q50 41 Influence of Countries in 10 Years Q55 44 Addressing Domestic Problems or Challenges From Abroad More Important to U.S.
Q60 47
Global Financial Regulator Q65 48 Position on Lowering Trade Barriers Q70 48 Meaning of Foreign Trade Q72 48 Globalization Good or Bad for Segments of Economy Q75 49 Countries Practicing Fair or Unfair Trade Q80 51 Important Factors in U.S. Remaining Competitive in Global Economy
Q85 53
Fairness of Recent Income Distribution in U.S. Q95 56 Importance of Globalization and Trade in Fairness of Income Distribution
Q100 57
Free Trade Agreements to Lower Tariffs Q105 57 U.S. Promotion of Globalization Q115 58 Impact of Certain Groups on Foreign Policy Q120 59 Impact Certain Groups Should have on Foreign Policy Q125 62 Role of Government Q128 65 Trust in Washington Q130 65 Ability of the U.S. to Achieve FP Goals Q135 66 Treaties and Agreements Q140 66 Creation of New Institutions to Deal with Problems Q142 67 U.S. to go Along with UN Decisions Q145 69 Steps to strengthen the UN Q150 69 Compliance with WTO Rules Q155 71 Importance of Countries to the U.S. Q160 71 Engaging in Trade with Specific Countries Q165 76 U.S. power in 50 Years Q170 76 Rising Countries like Turkey and Brazil Conducting More Independent Foreign Policy
Q172 77
Pressure on Middle East Countries to Democratize Q173 77

GLOBAL VIEWS 2010 TOPLINE DATA FROM U.S. PUBLIC SURVEY
Support for Democracy if Islamic Fundamentalist Leader Likely to be Elected
Q174 77
U.S. Leaders Talking With Leaders of Unfriendly Countries
Q175 78
U.S. as a World Superpower Q180 79 Relations With Countries Improving or Worsening Q185 80 Relations With Countries Good or Bad Q190 82 Diplomatic Relations With Countries Q192 83 UNSC Veto Rules Q197 84 U.S. Commitment to NATO Q200 84 Foreign Aid Q205 85 Economic Aid to Countries Q210 86 U.S. as a World Leader Q215 87 U.S. World Policeman More Than it Should Be Q217 88 Strengthening International Institutions Q220 88 Violent Conflict Between Christians and Muslims Q225 90 U.S. Taking Sides in Middle East Conflict Q230 90 U.S. Role in Israeli-Palestinian Conflict Q231 91 Israeli Settlements in West Bank Q232 91 UNSC Action if Iran Continues Enrichment Q240 91 U.S. Action if Iran Continues Enrichment Q240A 92 Iran Production of Nuclear Fuel if it Allows in UN Inspectors
Q245 92
Possible Outcomes of U.S. Military Strike Against Iran Q250 93 U.S. Military Strike Against Iran Nuclear Facilities Q255 93 Containing Nuclear Iran Q260 93 U.S. Role in a Possible Israel and Iran War Q265 94 U.S. Action with Respect to Troops in Afghanistan Q270 94 NATO Forces in Afghanistan Q271 94 Fighting Terrorist Threats in Afghanistan Q272 95 U.S. Military Effort in Afghanistan Q273 95 Terrorist Ability to Launch Attack on U.S. Q274 95 U.S. Action Against Terrorist Groups in Pakistan Without Government Permission
Q275 96
Measures to Combat Terrorism Q276 96 U.S. Selling Military Equipment Q280 99 Position on Use of Nuclear Weapons Q285 99 UNSC Responsibility to Prevent Genocide Q290 100 Action Regarding Climate Change Q295 100 Aid for Limiting of Emissions by Developing Countries Q300 101 Government Action on Climate Change Q310 101 Approaches to Address U.S. Dependence on Foreign Energy Sources
Q320 101
Approaches to Address Climate Change Q321 102 Environmental Protection vs. Economic Growth Q323 102 Support for Off-Shore Drilling Q325 102 China’s Economic and Political System Q330 103 China’s Economy as Large as the U.S. Economy Q335 103 Opinion if China Grows as Large as U.S. Q340 103 U.S. - China Loans of Money Q345 104 Dealing with the Rise of China Q350 104 Asia or Europe More Important to U.S. Q355 105 Japan or China More Important to U.S. Q357 105 China as Military Threat Q359 105

GLOBAL VIEWS 2010 TOPLINE DATA FROM U.S. PUBLIC SURVEY
Issues in U.S.-China Relations Q360 106 Level of U.S. Troops in Japan Q361 106 Level of U.S. Troops in South Korea Q363 106 U.S. Troops if Korea Reunifies Q364 107 UN Action if North Korea Attacks South Korea Q365 107 U.S. and South Korea to Work Together to Limit Rise of Chinese Power
Q366 108
South Korea’s Relationship with China and U.S. Q367 108 U.S. Shares Values with South Korea Q375 108 South Korea as a Democracy Q368 108 North Korea Attack of South Korea Ship Q369 109 U.S. Policy Toward North Korea Q371 109 South Korea as U.S. Trading Partner Q373 109 U.S. Foreign Policy in Asia Q376 110 KORUS FTA Q377 110 Religion in South Korea Q379 111 Torture Q380 111 Determinants of Country’s Overall Power Q385 111 Level of Legal Immigration Into U.S. Q390 112 Immigration Good/Bad Q395 112 Immigration Reform Q400 114 Immigrants and Jobs Q405 114 Demographics 115

GLOBAL VIEWS 2010 TOPLINE DATA FROM U.S. PUBLIC SURVEY
1
Introduction Knowledge Networks, a polling, social science, and market research firm in Menlo Park, California conducted this study of American public opinion and foreign policy attitudes for The Chicago Council on Global Affairs in June 2010. The survey was fielded on June 11th, 2010 to a total of 4,135 panel members age eighteen years of age or older who represented a general population sample. An additional oversample of 500 Midwest panel members (states: Ohio, Michigan, Indiana, Illinois, Wisconsin, Minnesota) were fielded as well in order to collect 300 additional completes from those states. The interview completion goal for the national sample was to collect a minimum of 2,400 completed interviews. An email reminder was sent to non-responders after three days and one week to improve response. The Chicago Council provided Knowledge Networks with the survey instrument. In conjunction with the Council, Knowledge Networks revised the instrument for online administration. A pretest survey was conducted to determine the survey length and verify all survey functionality worked correctly. Table 1 below displays the field period and completion rate of the survey. Table 1. Survey Completion Rate Sample Field Start Date Field End Date Cases Fielded Completes Completion Rate
National 6/11/10 6/22/10 4,135 2717* 66% Midwest 6/11/10 6/22/10 500 339* 68% *2,976 cases were included for final analysis; 71 cases were excluded from the national sample due to completing the survey in 10 minutes or less and an additional 49 cases were excluded for failing to reply to at least half of the questions in the questionnaire. The final total number respondents, after the application of demographic weights, is 2,596. The margin of sampling error for the national survey is +/-1.9 percentage points1. Additionally, some respondents showed a tendency to skip entire batteries. If this behavior was exhibited by the same respondent for two or more batteries, the Council team opted for casewise deletion, thus deleting the responses only for the battery in question of those respondents who skipped a particular battery and at least one whole other battery. This resulted in the following number of deletions from responses to the following list of batteries: Q40 = 25 extra cases excluded Q45 = 71 extra cases excluded Q120 = 47 extra cases excluded Q125 = 45 extra cases excluded Q142 = 18 extra cases excluded Q150 = 26 extra cases excluded Q160 = 70 extra cases excluded Q276 = 40 extra cases excluded Q395 = 40 extra cases excluded
1 The major of error for questions that were asked of the full sample was +/-1.9%. Note that the margin of error is larger for questions that were asked of only one-half or one-third of the sample, specifically +/-2.72 and +/-3.33 percentage points, respectively.

GLOBAL VIEWS 2010 TOPLINE DATA FROM U.S. PUBLIC SURVEY
1
Detailed Findings Note: Numbers may not add to 100% due to rounding∗ Question 1 Question 1: When you follow the news these days, how interested are you in news about the relations of the United States with other countries ?
1. Follow News (N=2596)
Very
interested Somewhat interested
Hardly interested
Don’t follow the news
Not sure/Decline Total
(%) (%) (%) (%) (%) (%)
Year
1974 50 34 13 3 -- 100
1978 44 36 15 4 1 100
1982 45 36 13 4 2 100
1986 49 34 11 5 1 100
1990 53 33 9 5 -- 100
1994 50 38 10 1 1 100
1998 45 38 14 1 2 100
2002 (telephone) 62 30 7 0 1 100
2004 (telephone) 53 34 7 7 0 100
2004 (internet) 34 49 10 7 0 100
2006 (internet) 38 46 10 6 0 100
2008 (internet) 31 47 14 8 0 100
2010 (internet) 32 49 13 6 0 100
Change in % points 2008-2010 +1 +2 -1 -2 0 0
Question 3 Question 3: Do you think it will be best for the future of the country if we take an active part in world affairs or if we stay out of world affairs?c
∗ Knowledge Networks calculated numbers to 2 decimal places before final rounding on all questions. c Trend data from 1947 through 1973 come from the following national surveys conducted by NORC in Chicago: Study T-49, 151, 156, 169, 295, 332, 348, 355, 370, 399 and the 1973 General Social Survey. The 1974 survey was conducted by Louis Harris and Associates, Inc.

GLOBAL VIEWS 2010 TOPLINE DATA FROM U.S. PUBLIC SURVEY
2
3. U.S. active in World Affairs
(N=2596)
Active part Stay out Not sure/ Decline Total
(%) (%) (%) (%)
Year
1947 68 25 7 100
1948 70 24 6 100
1949 68 25 7 100
1950 66 25 9 100
1952 68 23 9 100
1953 71 21 8 100
1954 69 25 6 100
1955 72 21 7 100
1956 71 25 4 100
1973 66 31 3 100
1974 66 24 10 100
1978 59 29 12 100
1982 54 35 11 100
1986 64 27 9 100
1990 62 28 10 100
1994 65 29 6 100
1998 61 28 11 100
2002 (telephone) 71 25 4 100
2004 (internet) 67 30 4 100
2006 (internet) 69 28 3 100 2008 (internet) 63 36 1 100
2010 (internet) 67 31 2 100
Change in % points 2008-2010 +4 -5 +1 0
Question 5 (1-17) Question 5 (1-17): Below is a list of possible threats to the vital interest of the United States in the next 10 years. For each one, please select whether you see this as a critical threat, an important but not critical threat, or not an important threat at all.
5/1. Drug related violence and instability in Mexico (new)
(N=2596)
Critical Important but
not critical Not important Not sure/ Decline Total
(%) (%) (%) (%) (%)

GLOBAL VIEWS 2010 TOPLINE DATA FROM U.S. PUBLIC SURVEY
3
2010 (internet) 45 46 8 1 100
5/2. U.S. Debt to China (new)
(N=2596)
Critical Important but
not critical Not important Not sure/ Decline Total
(%) (%) (%) (%) (%)
2010 (internet) 51 41 7 1 100
5/3. The development of China as a world power
(N=2596)
Critical Important but
not critical Not important Not sure/ Decline Total
(%) (%) (%) (%) (%)
Year
1990 40 43 9 8 100
1994 57 32 5 6 100
1998 57 32 6 5 100
2002 (telephone) 56 34 8 2 100
2004 (telephone) 40 39 16 5 100
2004 (internet) 33 54 10 2 100 2006 (internet) 36 54 8 2 100 2008 (internet) 40 51 8 1 100 2010 (internet) 43 48 8 1 100 Change in % points 2008-2010 +3 -3 0 0 0
5/4. Islamic fundamentalism
(N=2596)
Critical Important but
not critical Not important Not sure/ Decline Total
(%) (%) (%) (%) (%)
Year
1990 n/a n/a n/a n/a n/a
1994 33 36 14 17 100
1998 38 33 16 13 100
2002 (telephone) 61 24 8 7 100
2004 (telephone) 38 34 17 11 100
2004 (internet) 38 43 16 3 100
GLOBAL VIEWS 2010 TOPLINE DATA FROM U.S. PUBLIC SURVEY
4
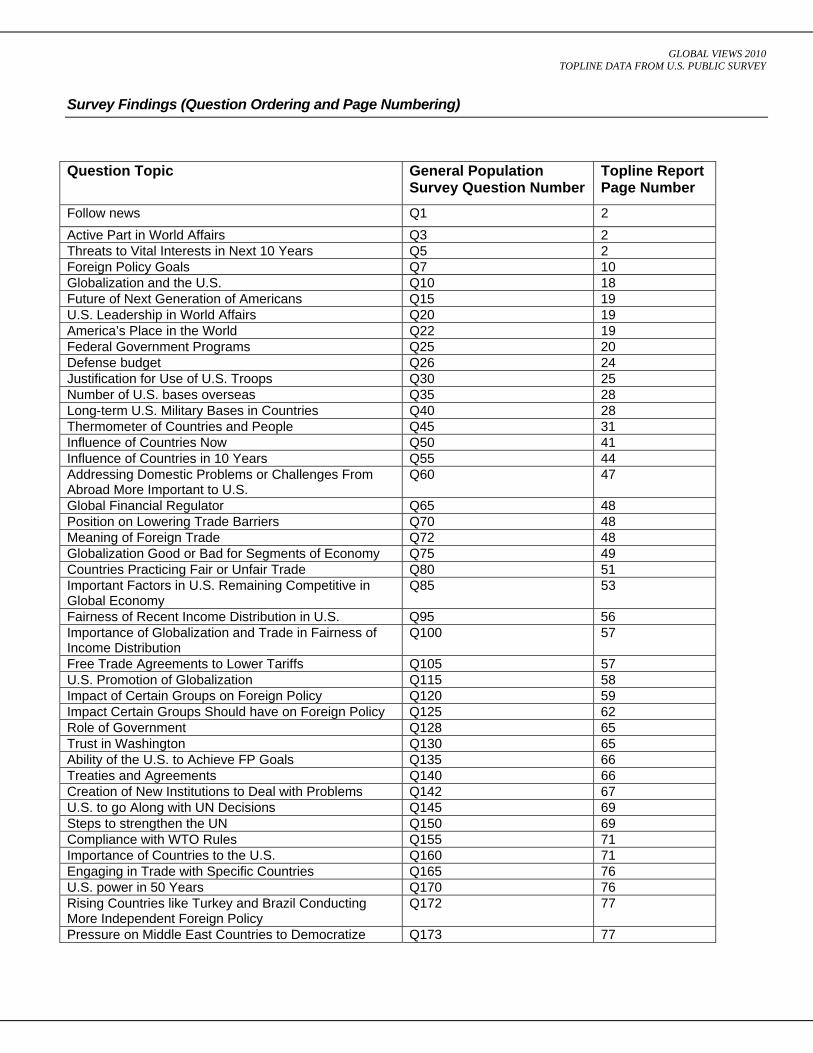
2006 (internet) 43 41 12 3 100 2008 (internet) 42 43 13 2 100 2010 (internet) 43 44 11 2 100 Change in % points 2008-2010 +1 +1 -2 0 0
5/5. The possibility of unfriendly countries becoming nuclear powers
(N=2596)
Critical Important but
not critical Not important Not sure/ Decline Total
(%) (%) (%) (%) (%)
Year
1990 n/a n/a n/a n/a n/a
1994 72 21 3 4 100
1998 75 18 3 4 100
2002 (telephone) 85 12 2 1 100
2004 (telephone) 66 26 5 3 100
2004 (internet) 64 31 3 2 100 2006 (internet) 69 27 3 1 100 2008 (internet) 67 30 3 0 100 2008 (Sept.) (60) (37) (3) (1) 100 2010 (internet) 69 27 3 1 100 Change in % points 2008-2010 +2 -3 0 +1
0
5/6. Large numbers of immigrants and refugees coming into the U.S.
(N=2596)
Critical Important but
not critical Not important Not sure/ Decline Total
(%) (%) (%) (%) (%)
Year
1990 n/a n/a n/a n/a n/a
1994 72 23 3 2 100
1998 55 35 7 3 100
2002 (telephone) 60 31 8 1 100
2004 (telephone) 51 33 15 2 100
2004 (internet) 52 37 9 1 100 2006 (internet) 51 40 9 1 100 2008 (internet) 51 35 13 1 100 2010 (internet) 51 37 12 1 100

GLOBAL VIEWS 2010 TOPLINE DATA FROM U.S. PUBLIC SURVEY
5
Change in % points 2008-2010 0 +2 -1 0 0
5/7. Economic competition from low-wage countries
(N=2596)
Critical Important but
not critical Not important Not sure/ Decline Total
(%) (%) (%) (%) (%)
Year
1990 n/a n/a n/a n/a n/a
1994 n/a n/a n/a n/a n/a
1998 40 44 12 4 100
2002 (telephone) 31 44 24 1 100
2004 (telephone) 35 40 21 4 100
2004 (internet) 35 48 14 2 100 2006 (internet) 32 55 11 1 100 2008 (internet) 38 49 12 1 100
2008 (Sept) (38) (51) (11) (1) 100 2010 (internet) 32 51 16 1 100 Change in % points 2008-2010 -6 +2 +4 0 0
5/8. Climate Change
(N=2596)
Critical Important but
not critical Not important Not sure/ Decline Total
(%) (%) (%) (%) (%)
Year
2008 (internet) 39 40 20 1 100 2010 (internet) 34 41 23 2 100 Change in % points 2008-2010 -5 +1 +3 +1 0

GLOBAL VIEWS 2010 TOPLINE DATA FROM U.S. PUBLIC SURVEY
6
5/9. Disruption in energy supply (N=2596)
Critical Important but
not critical Not important Not sure/ Decline Total
Year
(%) (%) (%) (%) (%)
2006 (internet) 59 37 3 1 100 2008 (internet) 72 25 3 1 100
2008 (Sept) (62) (35) (3) (1 ) 100 2010 (internet) 54 41 4 1 100 Change in % points 2008-2010 -18 +16 +1 0 0
5/10. International terrorism
(N=2596)
Critical Important but
not critical Not important Not sure/ Decline Total
(%) (%) (%) (%) (%)
Year
1990 n/a n/a n/a n/a n/a
1994 69 25 3 3 100
1998 84 13 1 2 100
2002 (telephone) 91 7 2 -- 100
2004 (telephone) 81 16 1 2
2004 (internet) 75 22 1 2 100 2006 (internet) 74 23 2 1 100 2008 (internet) 70 26 3 1 100 2008 (Sept) (64) (32) (4) (1) 100 2010 (internet) 73 24 2 1 100 Change in % points 2008-2010 +3 -2 -1 0 0
5/11. A confrontation between mainland China and Taiwan
(N=2596)
Critical Important but
not critical Not important Not sure/ Decline Total
(%) (%) (%) (%) (%)
Year 2006 (internet) 18 64 16 2 100 2008 (internet) 19 60 20 1 100 2010 (internet) 20 58 19 2 100
GLOBAL VIEWS 2010 TOPLINE DATA FROM U.S. PUBLIC SURVEY
7
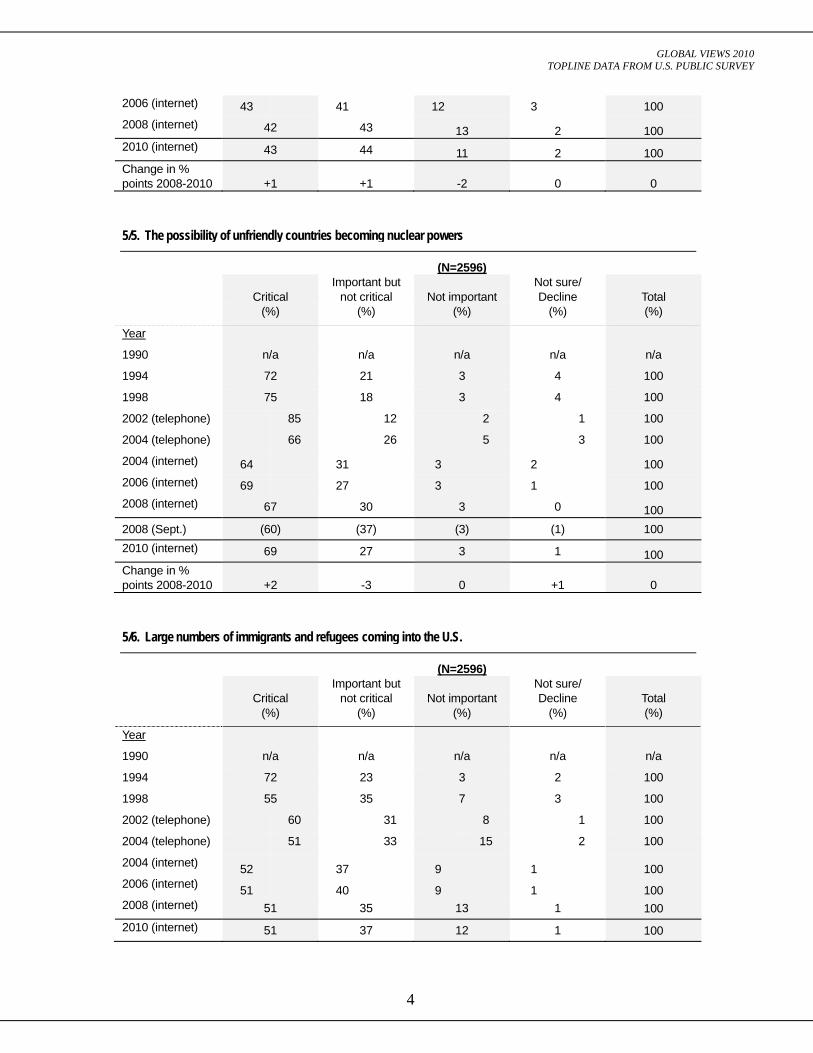
Change in % points 2008-2010 +1 -2 -1 +1 0
5/12. Violent Islamist groups in Pakistan and Afghanistan (N=2596)
Critical Important but
not critical Not important Not sure/ Decline Total
(%) (%) (%) (%) (%)
Year 2008 (internet)
55 38 6 1 100
2010 (internet) 55 38 5 2 100 Change in % points 2008-2010 0 0 -1 +1 0
5/13. AIDS, avian flu, and other potential epidemics*
(N=2596)
Critical Important but
not critical Not important Not sure/ Decline Total
(%) (%) (%) (%) (%)
Year
1998 72 24 2 2 100
2002 (telephone) 68 29 3 -- 100
2004 (telephone) 55 34 9 2 100
2004 (internet) 58 37 4 1 100 2006 (internet) 49 45 5 1 100 2010 (internet) 35 52 12 1 100 Change in % points 2006-2010 -14 +7 +7 0 0
5/14. Military conflict between Israel and its Arab neighbors
(N=2596)
Critical Important but
not critical Not important Not sure/ Decline Total
(%) (%) (%) (%) (%)
Year
2002 (telephone) 67 27 5 1 100
2004 (telephone) 43 39 14 4
2004 (internet) 39 48 12 2 100 2010 (internet) 45 45 9 2 100 Change in % points 2004-2010 +6 -3 -3 0 0

GLOBAL VIEWS 2010 TOPLINE DATA FROM U.S. PUBLIC SURVEY
8
5/15. Iran’s nuclear program (new)
(N=2596)
Critical Important but
not critical Not important Not sure/ Decline Total
(%) (%) (%) (%) (%)
Year 2010 (internet) 68 27 4 1 100
5/16. Cyber attacks on U.S. computer networks (new)
(N=2596)
Critical Important but
not critical Not important Not sure/ Decline Total
(%) (%) (%) (%) (%)
Year
2010 (internet) 53 40 5 2 100
5/17. U.S. dependence on foreign oil (new)
(N=2596)
Critical Important but
not critical Not important Not sure/ Decline Total
(%) (%) (%) (%) (%)
Year
2010 (internet) 62 34 3 1 100
Summary of 5: Threats to U.S. Vital Interests - 2010 data only
5. Ranking of threats to the vital interests of the United States (by critical)
(N=2596)
Critical Important but
not critical Not
important Not sure/ Decline Total
(%) (%) (%) (%) (%)
5/10. International terrorism 73 24 2 1 100 5/5. The possibility of unfriendly countries becoming nuclear powers 69 27 3 1
100
5/15. Iran’s nuclear program (new) 68 27 4 1 100 5/17. U.S. dependence on foreign oil (new)
62 34 3 1 100
5/12. Violent Islamist groups in Pakistan and Afghanistan 55 38 5 2 100

GLOBAL VIEWS 2010 TOPLINE DATA FROM U.S. PUBLIC SURVEY
9
5/9. Disruption in energy supply 54 41 4 1 100 5/16. Cyber attacks on U.S. computer networks (new)
53 40 5 2 100
5/2. U.S. debt to China (new) 51 41 7 1 100 5/ 6. Large numbers of immigrants and refugees coming into the U.S. 51 37 12 1 100
5/1. Drug related violence and instability in Mexico (new)
45 46 8 1 100
5/14. Military conflict between Israel and its Arab neighbors 45 45 9 2 100
5/4. Islamic fundamentalism 43 44 11 2 100 5/3. The development of China as a world power 43 48 8 1 100
5/13. AIDS, avian flu, and other potential epidemics* 35 52 12 1 100
5/8. Climate Change 34 41 23 2 100 5/7. Economic competition from low-wage countries 32 51 16 1 100
5/11. A confrontation between mainland China and Taiwan 20 58 19 2 100
Comparison of 2008 and 2010 rankings of threats to the vital interests of the United States (by critical)
2008 2010 (%) (%)
5/10. International terrorism 2 1
5/5. The possibility of unfriendly countries becoming nuclear powers 3 2
5/15. Iran’s nuclear program (new) - 3
5/17. U.S. dependence on foreign oil (new) - 4
5/12. Violent Islamist groups in Pakistan and Afghanistan 5 5
5/9. Disruption in energy supply 1 6
5/16. Cyber attacks on U.S. computer networks (new) - 7
5/2. U.S. debt to China (new) - 8
5/ 6. Large numbers of immigrants and refugees coming into the U.S. 6 9
5/1. Drug related violence and instability in Mexico (new) - 10
5/14. Military conflict between Israel and its Arab neighbors 6 (2004) 11
5/4. Islamic fundamentalism 8 12
5/3. The development of China as a world power 9 13
5/13. AIDS, avian flu, and other potential epidemics* 5 (2006) 14
5/8. Climate Change 10 15
5/7. Economic competition from low-wage countries 11 16
5/11. A confrontation between mainland China and Taiwan 13 17

GLOBAL VIEWS 2010 TOPLINE DATA FROM U.S. PUBLIC SURVEY
10
Question 7 (1-19) Question 7 (1-19): Below is a list of possible foreign policy goals that the United States might have. For each one please select whether you think that it should be a very important foreign policy goal of the United States, a somewhat important foreign policy goal, or not an important goal at all?
Note: All percentages for the 1990 goals question are newly corrected to reflect an error made in 1990 when data from the two different questionnaire forms were combined
7/1. Protecting weaker nations against foreign aggression
(N=2596)
Very
important Somewhat important
Not important
Not sure/ Decline Total
(%) (%) (%) (%) (%)
Year
1974 28 53 11 8 100
1978 34 47 10 9 100
1982 34 50 9 7 100
1986 32 54 8 6 100
1990 32 54 10 5 100
1994 24 60 11 5 100
1998 32 56 7 5 100
2002 (telephone) 41 50 7 2 100
2002 (internet) 35 58 8 0 100
2004 (internet) 18 67 13 2 100 2006 (internet) 22 65 11 2 100 2008 (internet) 24 63 12 1 100 2010 (internet) 24 62 13 1 100 Change in % points 2008-2010 0 -1 +1 0 0
7/2. Strengthening the United Nations
(N=2596)
Very
important Somewhat important
Not important
Not sure/ Decline Total
(%) (%) (%) (%) (%)
Year
1974 46 32 14 8 100
1978 47 32 13 8 100
1982 48 32 13 7 100
1986 46 33 16 5 100
1990 52 36 8 4 100

GLOBAL VIEWS 2010 TOPLINE DATA FROM U.S. PUBLIC SURVEY
11
1994 51 33 12 4 100
1998 45 39 11 5 100
2002(telephone) 57 28 13 2 100
2002 (internet) 55 33 12 1 100
2004 (internet) 38 43 17 2 100 2006 (internet) 40 39 19 2 100 2008 (internet) 39 40 21 1 100 2010 (internet) 37 42 21 1 100 Change in % points 2008-2010 -2 +2 0 0 0
7/3. Combating international terrorism
(N=2596)
Very
important Somewhat important
Not important
Not sure/ Decline Total
(%) (%) (%) (%) (%)
Year
1998 79 17 2 2 100
2002 (telephone) 91 7 1 1 100
2002 (internet) 83 15 2 1 100
2004 (internet) 71 25 2 2 100 2006 (internet) 72 25 2 1 100 2008 (internet) 67 29 4 1 100 2008 (Sept.) (65) (29) (4) (2) 100 2010 (internet) 69 27 3 1 100 Change in % points 2008-2010 +2 -2 -1 0 0
7/4. Maintaining superior military power worldwide
(N=2596)
Very
important Somewhat important
Not important
Not sure/ Decline Total
(%) (%) (%) (%) (%)
Year
1994 50 39 9 2 100
1998 59 31 6 4 100
2002 (telephone) 68 26 4 2 100
2002 (internet) 67 28 5 0
2004 (internet) 50 41 7 2 100 2006 (internet) 55 36 7 2 100 2008 (internet) 57 36 7 1 100

GLOBAL VIEWS 2010 TOPLINE DATA FROM U.S. PUBLIC SURVEY
12
2010 (internet) 56 36 7 1 100 Change in % points 2008-2010 -1 0 0 0 0
7/5. Protecting the jobs of American workers
(N=2596)
Very
important Somewhat important
Not important
Not sure/ Decline Total
(%) (%) (%) (%) (%)
Year
1974 74 17 5 4 100
1978 78 15 3 4 100
1982 77 17 3 3 100
1986 77 18 3 2 100
1990 84 13 1 2 100
1994 83 14 2 1 100
1998 80 15 2 3 100
2002 (telephone) 85 13 2 -- 100
2002 (internet) 81 17 2 0 100
2004 (internet) 78 19 2 2 100 2006 (internet) 76 20 3 2 100 2008 (internet) 80 17 3 1 100 2008 (Sept.) (78) (18) (3) (2) 100 2010 (internet) 79 18 2 1 100 Change in % points 2008-2010 -1 +1 -1 0
7/6. Helping to bring a democratic form of government to other nations
(N=2596)
Very
important Somewhat important
Not important
Not sure/ Decline Total
(%) (%) (%) (%) (%)
Year
1974 28 42 22 8 100
1978 26 44 21 9 100
1982 29 47 17 7 100
1986 30 48 17 5 100
1990 28 52 17 4 100
1994 25 48 22 5 100
1998 29 50 16 5 100

GLOBAL VIEWS 2010 TOPLINE DATA FROM U.S. PUBLIC SURVEY
13
2002 (telephone) 34 49 15 2 100
2002 (internet) 24 59 16 1 100
2004 (internet) 14 58 27 2 100 2006 (internet) 17 57 24 2 100 2008 (internet) 17 59 23 1 100 2010 (internet) 19 55 26 1 100 Change in % points 2008-2010 +2 -4 +3 0
7/7. Securing adequate supplies of energy
(N=2596)
Very
important Somewhat important
Not important
Not sure/ Decline Total
(%) (%) (%) (%) (%)
Year
1974 75 18 2 5 100
1978 78 15 2 5 100
1982 70 23 3 4 100
1986 69 25 3 3 100
1990 61 20 1 3 100
1994 62 30 5 3 100
1998 64 30 2 4 100
2002 (telephone) 75 21 2 2 100
2002 (internet) 70 27 3 1 100
2004 (internet) 69 27 2 2 100 2006 (internet) 72 25 2 2 100 2008 (internet) 80 18 2 1 100 2008 (Sept.) (77) (20) (1) (2) 100 2010 (internet) 68 29 2 1 100 Change in % points 2008-2010 -12 +11 0 0
7/8. Controlling and reducing illegal immigration
(N=2596)
Very
important Somewhat important
Not important
Not sure/ Decline Total
(%) (%) (%) (%) (%)
Year
1994 72 22 4 2 100
1998 55 34 6 5 100
2002 (telephone) 70 23 6 1 100

GLOBAL VIEWS 2010 TOPLINE DATA FROM U.S. PUBLIC SURVEY
14
2002 (internet) 69 28 3 0 100
2004 (internet) 59 33 6 2 100 2006 (internet) 58 34 7 1 100 2008 (internet) 61 31 8 1 100 2010 (internet) 59 33 7 1 100 Change in % points 2008-2010 -2 +2 -1 0
7/9. Limiting climate change
(N=2596)
Very
important Somewhat important
Not important
Not sure/ Decline Total
(%) (%) (%) (%) (%)
Year
2008 (internet) 42 40 18 1 100
2010 (internet) 35 42 22 1 100 Change in % points 2008-2010 -7 +2 +4 0
7/10. Preventing the spread of nuclear weapons
(N=2596)
Very
important Somewhat important
Not important
Not sure/ Decline Total
(%) (%) (%) (%) (%)
Year
1990 84 12 2 2 100
1994 82 14 2 2 100
1998 82 14 1 3 100
2002 (telephone) 90 8 1 1 100
2002 (internet) 86 12 2 1 100
2004 (internet) 73 23 2 2 100 2006 (internet) 74 22 2 2 2008 (internet) 73 25 2 1 100 2008 (Sept.) (66) (29) (3) (3) 100 2010 (internet) 73 24 2 1 100 Change in % points 2008-2010 0 -1 0 0
7/11. Promoting and defending human rights in other countries
(N=2596)
Very
important Somewhat important
Not important
Not sure/ Decline Total

GLOBAL VIEWS 2010 TOPLINE DATA FROM U.S. PUBLIC SURVEY
15
(%) (%) (%) (%) (%)
Year
2006 (internet) 28 58 13 1 100
2008 (internet) 31 57 12 0 100
2010 (internet) 30 56 14 1 100
Change in % points 2008-2010 -1 -1 +2 +1
7/12. Combating world hunger (N=2596)
Very
important Somewhat important
Not important
Not sure/ Decline Total
(%) (%) (%) (%) (%)
Year
1974 61 31 5 3 100
1978 59 31 5 5 100
1982 58 33 5 4 100
1986 63 31 4 2 100
1994 56 36 6 2 100
1998 62 32 4 2 100
2002(telephone) 61 35 4 -- 100
2002(internet) 54 40 6 0 100
2004(internet) 43 47 9 2 100 2006 (internet) 48 43 8 1 100 2008 (internet) 46 45 8 1 100 2010 (internet) 42 47 10 1 100 Change in % points 2008-2010 -4 +2 +2 0
7/13. Promoting international trade
(N=2596)
Very
important Somewhat important
Not important
Not sure/ Decline Total
(%) (%) (%) (%) (%)
Year
2008 (internet) 34 57 9 0 100
2010 (internet) 33 58 8 1 100
Change in % points 2008-2010 -1 +1 -1 +1
7/14. Improving America’s standing in the world
(N=2596)

GLOBAL VIEWS 2010 TOPLINE DATA FROM U.S. PUBLIC SURVEY
16
Very
important Somewhat important
Not important
Not sure/ Decline Total
(%) (%) (%) (%) (%)
Year
2008 (internet) 83 15 2 1 100
2008 (Sept.) (51) (38) (10) (2) 100 2010 (internet) 53 39 8 1 100 Change in % points 2008-2010 -30 +24 +6 0
7/15. Stopping the flow of illegal drugs into the United States
(N=2596)
Very
important Somewhat important
Not important
Not sure/ Decline Total
(%) (%) (%) (%) (%)
Year
1994 85 11 3 1 100
1998 81 14 2 3 100
2002 (telephone) 81 14 5 -- 100
2002 (internet) 72 22 6 0 100
2004 (internet) 63 27 8 2 100 2010 (internet) 63 30 6 1 100 Change in % points 2004-2010 0 +3 -2 -1
7/16. Reducing our trade deficit with foreign countries
(N=2596) Very
important Somewhat important
Not important
Not sure/ Decline
Total
(%) (%) (%) (%) (%)
Year
1986 62 26 5 7 100
1990 70 24 2 4 100
1994 59 32 5 4 100
1998 50 40 4 6 100
2002 51 41 6 2 100
2010 (internet) 55 40 5 1 100
Change in % points 2002-2010 +4 -1 -1 -1
7/17. Safeguarding against global financial instability
(N=2596)

GLOBAL VIEWS 2010 TOPLINE DATA FROM U.S. PUBLIC SURVEY
17
Very important
Somewhat important
Not important
Not sure/ Decline
Total
(%) (%) (%) (%) (%)
Year
2002 54 37 6 3 100
2010 (internet) 52 42 5 1 100
Change in % points 2002-2010 -2 +5 -1 -2
7/18. Reducing U.S. dependence on foreign oil (new)
(N=2596)
Very
important Somewhat important
Not important
Not sure/ Decline Total
(%) (%) (%) (%) (%)
Year
2010(internet) 74 24 2 1 100
7/19. Making sure China does not dominate the Korean Peninsula (new)
(N=851)
Very
important Somewhat important
Not important
Not sure/ Decline Total
(%) (%) (%) (%) (%)
Year
2010(internet) 27 58 14 2 100
Summary of 7: U.S. Foreign Policy Goals - 2010 data only
Raking of U.S. Foreign Policy Goals (by Very Important)
(N=2646)
Very
important Somewhat important
Not important
Not sure/ Decline Total
Goal (%) (%) (%) (%) (%)
7/5. Protecting the jobs of American workers 79 18 2 1 100 7/18. Reducing U.S. dependence on foreign oil (new) 74 24 2 1 100 7/10. Preventing the spread of nuclear weapons 73 24 2 1 100 7/3. Combating international terrorism 69 27 3 1 100 7/7. Securing adequate supplies of energy 68 29 2 1 100 7/15. Stopping the flow of illegal drugs into the United States 63 30 6 1 100 7/8. Controlling and reducing illegal immigration 59 33 7 1 100

GLOBAL VIEWS 2010 TOPLINE DATA FROM U.S. PUBLIC SURVEY
18
7/4. Maintaining superior military power worldwide 56 36 7 1 100 7/16. Reducing our trade deficit with foreign countries
55 40 5 1 100
7/14. Improving America’s standing in the world 53 39 8 1 100 7/17. Safeguarding against global financial instability
52 42 5 1 100
7/12. Combating world hunger 42 47 10 1 100 7/2. Strengthening the United Nations 37 42 21 1 100
7/9. Limiting climate change 35 42 22 1 100 7/13. Promoting international trade 33 58 8 1
100
7/11. Promoting and defending human rights in other countries 30 56 14 1
100
7/19. Making sure China does not dominate the Korean Peninsula (new n=865) 27 58 14 2 100 7/1. Protecting weaker nations against foreign aggression 24 62 13 1 100 7/6. Helping to bring a democratic form of government to other nations 19 55 26 1 100
Question 10 Question 10: Turning to something else, do you believe that globalization, especially the increasing connections of our economy with others around the world, is mostly good or mostly bad for the United States?
10. Globalization and the U.S. (N=2596)
Mostly good Mostly bad
Neutral/ equally good
and bad Not sure/ Decline Total
(%) (%) (%) (%) (%)
Year
1998 54 20 15 11 100
2002(telephone) 56 27 8 9 100
2002 (internet) 61 32 n/a 7 100
2004 (internet) 64 31 n/a 5 100
2006 (internet) 60 35 n/a 5 100
2008 (internet) 58 39 n/a 4 100
2008 (Sept.) (56) (42) n/a (2) 100 2010 (internet) 56 41 n/a 3 100 Change in % points 2008-2010 -2 +2 0 -1

GLOBAL VIEWS 2010 TOPLINE DATA FROM U.S. PUBLIC SURVEY
19
Question 15 Question 15: Thinking about the next generation of Americans who are children today, the way things are going, do you think economically they will be better off, worse off, or about the same as the generation of adults who are working today?
15. Future of next generation of Americans (N=2596) Better off About the same Worse off Not sure/ Decline Total
(%) (%) (%) (%) (%)
Year
2008 (internet) 9 30 60 1 100
2008 (Sept.) (10) (27) (62) (1) 100 2010 (internet) 8 32 59 1 100 Change in % points 2008-2010 -1 +2 -1 0
Question 20 Question 20: From your point of view, how desirable is it that the U.S. exert strong leadership in world affairs? Very desirable, somewhat desirable, somewhat undesirable, or very undesirable?
20. U.S. Leadership in World Affairs
(N=2646) Very
desirable Somewhat desirable
Somewhat undesirable
Very undesirable
Neither or both equally
Not sure/ Decline
Total
(%) (%) (%) (%) (%) (%) (%)
Year
2002 41 42 9 5 1 2 100
2010 (internet) 35 49 12 4 n/a 1 100
Change in % points 2002-2010
-6 +7 +3 -1 0 -1
Question 22 Question 22: Now a question about America’s place in the world. Please tell me whether you agree or disagree with the following statement: The U.S. should mind its own business internationally and let other countries get along the best they can on their own.
22. America’s place in the world (new)
(N=1309) Agree Disagree Not sure/ Decline Total
(%) (%) (%) (%)
Year
1964 Gallup 18 70 12 100 1968 Gallup 27 66 7 100

GLOBAL VIEWS 2010 TOPLINE DATA FROM U.S. PUBLIC SURVEY
20
1972 Gallup 35 56 9 100 1976 Gallup 41 49 10 100 1980 Gallup 30 61 9 100 1985 Gallup 34 59 7 100 1991 Gallup 33 60 7 100 04/1993 Pew 37 58 5 100 06/1995 Pew 41 51 8 100 09/1997 Pew 39 54 7 100 03/1999 Pew 35 57 8 100 09/2001 Pew 37 55 8 100 12/2002 Pew 30 65 5 100 08/2004 Pew 34 59 7 100 10/2005 Pew 42 51 7 100 12/2006 Pew 42 53 5 100 11/2009 Pew 49 44 7 100 2010 (internet) 49 49 2 100
Question 25 (1-9) Question 25 (1-9): Below is a list of present federal government programs. For each, please select whether you feel it should be expanded, cut back or kept about the same.
25/1. Aid to Education (N=1290)
Expand Cut Back Keep Same Not Sure Total
(%) (%) (%) (%) (%)
Year
1974 58 8 30 4 100
1978 55 8 32 5 100
1982 59 7 31 3 100
1986 69 4 25 2 100
1990 74 3 21 2 100
1994 75 4 18 3 100
1998 79 3 16 2 100
2002 (telephone) 75 4 21 0 100
2004 (telephone) 75 4 20 1 100
2004 (internet) 69 5 25 1 100
2008 (internet) 61 10 28 0 100 2010 (internet) 59 10 30 1 100
Change in % points 2008-2010 -2 0 +2 +1

GLOBAL VIEWS 2010 TOPLINE DATA FROM U.S. PUBLIC SURVEY
21
25/2. Defense Spending (N=1290)
Expand Cut Back Keep Same Not Sure Total
(%) (%) (%) (%) (%)
Year
1974 14 42 38 6 100
1978 34 24 34 8 100
1982 24 34 36 6 100
1986 22 34 39 5 100
1990 14 43 39 4 100
1994 21 34 41 4 100
1998 30 28 38 4 100
2002 (telephone) 44 15 38 3 100
2004 (telephone) 37 13 46 4 100
2004 (internet) 29 25 44 1 100
2008 (internet) 31 28 40 1 100 2010 (internet) 30 27 43 1 100
Change in % points 2008-2010 -1 -1 +3 0
25/3. Social Security (N=1290)
Expand Cut Back Keep Same Not Sure Total
(%) (%) (%) (%) (%)
Year
1982 49 6 40 5 100
1986 60 4 32 4 100
1990 56 4 36 4 100
1994 49 7 39 5 100
1998 66 3 27 4 100
2002 (telephone) 64 3 30 3 100
2004 (telephone) 63 3 32 2 100
2004 (internet) 65 4 30 1 100
2008 (internet) 60 11 29 1 100 2010 (internet) 55 10 35 1 100
Change in % points 2008-2010 -5 -1 +6 0 0

GLOBAL VIEWS 2010 TOPLINE DATA FROM U.S. PUBLIC SURVEY
22
25/4. Military Aid to Other Nations
(N=1290)
Expand Cut Back Keep Same Not Sure Total
(%) (%) (%) (%) (%)
Year
1974 3 70 20 7 100
1978 5 64 21 10 100
1982 5 65 22 8 100
1986 4 62 27 7 100
1990 5 73 17 5 100
1994 4 68 21 7 100
1998 8 56 32 4 100
2002 (telephone) 10 46 39 5 100
2004 (internet) 5 65 28 1 100 2008 (internet) 9 59 32 0 100 2010 (internet) 6 60 34 1 100
Change in % points 2008-2010 -3 +1 +2 +1
25/5. Economic Aid to Other Nations
(N=1290)
Expand Cut Back Keep Same Not Sure Total
(%) (%) (%) (%) (%)
Year
1974 10 55 28 7 100
1978 11 50 31 8 100
1982 8 54 31 7 100
1986 11 48 35 6 100
1990 7 61 27 5 100
1994 9 58 28 5 100
1998 13 48 36 3 100
2002 (telephone) 14 48 35 3 100
2004 (telephone) 10 49 38 3 100
2004 (internet) 8 64 26 2 100 2008 (internet) 8 55 36 0 100 2010 (internet) 7 60 33 0 100
Change in % points 2008-2010 -1 +5 -3 0

GLOBAL VIEWS 2010 TOPLINE DATA FROM U.S. PUBLIC SURVEY
23
25/6. Health Care
(N=1290)
Expand Cut Back Keep Same Not Sure Total
(%) (%) (%) (%) (%)
Year
1994 71 7 18 4 100
1998 78 4 16 2 100
2002 (telephone) 77 4 19 -- 100
2004 (internet) 79 3 17 1 100 2008 (internet) 70 9 20 1 100 2010 (internet) 58 15 26 1 100
Change in % points 2008-2010 -12 +6 +6 0
25/7. Gathering Intelligence Information about Other Countries
(N=1290)
Expand Cut Back Keep Same Not Sure Total
(%) (%) (%) (%) (%)
Year
1994 18 29 44 9 100
1998 27 22 43 8 100
2002 (telephone) 66 6 25 3 100
2004 (telephone) 56 6 34 4 100
2004 (internet) 43 11 44 2 100 2008 (internet) 41 17 43 0 100 2010 (internet) 39 15 46 1 100
Change in % points 2008-2010 -2 -2 +3 +1
25/8. Homeland Security
(N=1290)
Expand Cut Back Keep Same Not Sure Total
(%) (%) (%) (%) (%)
Year
2002 (telephone) 65 5 27 3 100
2004 (telephone) 60 6 31 4 100
2004 (internet) 51 11 37 2 100 2008 (internet) 52 14 34 0 100

GLOBAL VIEWS 2010 TOPLINE DATA FROM U.S. PUBLIC SURVEY
24
2010 (internet) 51 11 36 1 100 Change in % points 2008-2010 -1 -3 +2 +1
25/9. Improving public infrastructure such as highways, bridges and airports
(N=1290)
Expand Cut Back Keep Same Not Sure Total
(%) (%) (%) (%) (%)
Year
2008 (internet) 56 7 36 1 100 2010 (internet) 52 9 39 1 100
Change in % points 2008-2010 -4 +2 +3 0
Summary of 25: Federal Government Programs - 2010 data only
Raking of Federal Government Programs (by Expand)
(N=1313)
Expand Cut Back Keep Same
Not sure/ Decline Total
Program (%) (%) (%) (%) (%)
25/1. Aid to Education 59 10 30 1 100
25/6. Health Care 58 15 26 1 100
25/3. Social Security 55 10 35 1 100 25/9. Improving public infrastructure 52 9 39 1 100
25/8. Homeland Security 51 11 36 1 100 25/7. Gathering Intelligence Information 39 15 46 1 100
25/2. Defense Spending 30 27 43 1 100
25/5. Economic Aid 7 60 33 0 100
25/4. Military Aid 6 60 34 1 100
Question 26 Question 26: There has been some discussion about whether, in the effort to address the federal budget deficit the defense budget should be cut along with other programs. Do you think the defense budget:
26. Defense budget cuts (new)
(N=1292)
Should not be
cut
Should be cut, but less than other
programs
Should be cut about the same percentage
as other programs
Should be cut a greater percentage
than other programs Not Sure Total (%) (%) (%) (%) (%) (%)

GLOBAL VIEWS 2010 TOPLINE DATA FROM U.S. PUBLIC SURVEY
25
Year
2010 (internet) 41 29 20 9 0 100
Question 30 (1-8) Question 30 (1-8): There has been some discussion about the circumstances that might justify using U.S. troops in other parts of the world. Please give your opinion about some situations. Would you favor or oppose the use of U.S. troops: Note: All percentages for the 1990 troop use question are newly corrected to reflect an error made in 1990 when data from the two different questionnaire forms were combined
30/1. If North Korea invaded South Korea
(N=1283) Favor Oppose Not sure/ Decline Total
(%) (%) (%) (%)
Year
1990 26 61 13 100
1994 39 48 13 100
1998 30 58 12 100
2002 (telephone) 36 56 8 100
2004 (internet) 43 51 6 100 2006 (internet) 45 49 6 100 2008 (internet) 41 56 3 100 2010 (internet) 40 56 4 100
Change in % points 2008-2010 -1 0 +1
30/2. If China invaded Taiwan
(N=1283) Favor Oppose Not sure/ Decline Total
(%) (%) (%) (%)
Year
1998 27 58 15 100
2002 (telephone) 32 58 10 100
2004 (internet) 33 61 7 100 2006 (internet) 32 61 6 100 2008 (internet) 32 65 3 100 2010 (internet) 25 71 4 100
Change in % points 2008-2010 -7 +6 +1

GLOBAL VIEWS 2010 TOPLINE DATA FROM U.S. PUBLIC SURVEY
26
30/3. To be part of an international peacekeeping force to enforce a peace agreement between Israel and the Palestinians
(N=1283) Favor Oppose Not sure/ Decline Total
(%) (%) (%) (%)
Year
2002 (telephone) 65 30 5 100
2004 (internet) 52 43 5 100 2006 (internet) 51 44 6 100 2008 (internet) 52 47 2 100 2010 (internet) 49 49 2 100
Change in % points 2008-2010 -3 +2 0
30/4. To stop a government from committing genocide and killing large numbers of its own people
(N=1283) Favor Oppose Not sure/ Decline Total
(%) (%) (%) (%)
Year
2002 (telephone) 77 19 4 100
2004 (internet) 75 22 4 100 2006 (internet) 71 24 5 100 2008 (internet) 69 28 3 100 2010 (internet) 72 26 2 100
Change in % points 2008-2010 +3 -2 -1
30/5. To ensure the oil supply*
(N=1283) Favor Oppose Not sure/ Decline Total
(%) (%) (%) (%)
Year
2002 (telephone) 65 30 5 100 2004 (internet) 54 42 5 100 2006 (internet) 45 49 6 100 2008 (internet) 59 38 3 100 2010 (internet) 55 42 3 100
Change in % points 2008-2010 -4 +4 0 *this option read “to ensure the supply of oil” in the 2002 survey

GLOBAL VIEWS 2010 TOPLINE DATA FROM U.S. PUBLIC SURVEY
27
30/6. To be a part of an international peacekeeping force to stop the killing in Darfur
(N=1283) Favor Oppose Not sure/ Decline Total
(%) (%) (%) (%)
Year
2006 (internet) 65 28 7 100 2008 (internet) 62 35 4 100 2010 (internet) 56 40 4 100
Change in % points 2008-2010 -6 +5 0
30/7. To deal with humanitarian crises
(N=1283) Favor Oppose Not sure/ Decline Total
(%) (%) (%) (%)
Year
2004 72 25 3 100 2006 (internet) 66 28 5 100 2010 (internet) 69 28 3 100
Change in % points 2006-2010 +3 0 -2
30/8. If Israel were attacked by its neighbors (new)
(N=1283) Favor Oppose Not sure/ Decline Total
(%) (%) (%) (%)
Year
2010 (internet) 47 50 4 100
Summary of 30: Justify Troops - 2010 data only
Rating of Situations Justifying Troops (by Favor)
(N=1283) Favor Oppose Not sure/ Decline Total (%) (%) (%) (%)
Circumstances
30/4. To stop a government from committing genocide and killing large numbers of its own people 72 26 2 100 30/7. To deal with humanitarian crises 69 28 3 100 30/6. To be a part of an international peacekeeping force to stop the killing in Darfur 56 40 4 100
30/5. To ensure the oil supply 55 42 3 100

GLOBAL VIEWS 2010 TOPLINE DATA FROM U.S. PUBLIC SURVEY
28
30/3. To be part of an international peacekeeping force to enforce a peace agreement between Israel and the Palestinians 49 49 2 100 30/8. If Israel were attacked by its neighbors (new) 47 50 4 100 30/1. If North Korea invaded South Korea 40 56 4 100
30/2. If China invaded Taiwan 25 71 4 100 Question 35 Question 35: Thinking about long-term military bases the U.S. has overseas, do you think the U.S. should have more bases overseas, fewer bases overseas, or about as many as we have now?
35. Attitude toward long-term military bases
(N=1273)
More bases
Fewer bases
About as many as
now Not sure/ Decline Total
(%) (%) (%) (%) (%)
Year
2002 (telephone) 25 14 57 4 100 2004 (internet) 11 31 54 4 100 2006 (internet) 15 27 53 5 100 2008 (internet) 12 29 57 2 100 2010 (internet) 10 31 58 1 100
Change in % points 2008-2010 -2 +2 +1 -1
Question 40 (1-7) Question 40 (1-7): Do you think the United States should or should not have long-term military bases in the following places? * Answer options were "Favor"/"Oppose" in 2004
40/1. Japan
(N=1284)
Should have* Should not
have* Not sure/ Decline Total
(%) (%) (%) (%)
Year
2002 (telephone) 63 33 4 100
2004 (internet) 52 39 9 100 2006 (internet) 57 34 9 100 2008 (internet) 58 39 3 100

GLOBAL VIEWS 2010 TOPLINE DATA FROM U.S. PUBLIC SURVEY
29
2010 (internet) 50 48 2 100
Change in % points 2008-2010 -8 +9 -1
40/2. Iraq
(N=1284)
Should have* Should not
have* Not sure/ Decline Total
(%) (%) (%) (%)
Year
2004 42 50 8 100 2006 (internet) 49 43 8 100 2008 (internet) 57 40 3 100 2010 (internet) 50 48 2 100
Change in % points 2008-2010 -7 +8 -1
40/3. South Korea
(N=1284)
Should have* Should not
have* Not sure/ Decline Total
(%) (%) (%) (%)
Year
2002 (telephone) 67 27 6 100
2004 (internet) 62 30 8 100 2006 (internet) 62 29 9 100 2008 (internet) 63 34 3 100 2010 (internet) 62 36 3 100
Change in % points 2008-2010 -1 +2 0
40/4. Afghanistan
(N=1284)
Should have* Should not
have* Not sure/ Decline Total
(%) (%) (%) (%)
Year
2002 (telephone) 57 40 3 100
2004 (internet) 47 45 8 100 2006 (internet) 52 39 9 100 2008 (internet) 57 40 3 100 2010 (internet) 52 46 3 100

GLOBAL VIEWS 2010 TOPLINE DATA FROM U.S. PUBLIC SURVEY
30
Change in % points 2008-2010 -5 +6 0
40/5. Pakistan
(N=1284)
Should have* Should not
have* Not sure/ Decline Total
(%) (%) (%) (%)
Year
2002 (telephone) 52 41 7 100 2004 (internet) 39 52 9 100 2006 (internet) 43 48 10 100 2008 (internet) 49 47 4 100 2010 (internet) 45 52 3 100
Change in % points 2008-2010 -4 +5 -1
40/6. Germany
(N=1284)
Should have* Should not
have* Not sure/ Decline Total
(%) (%) (%) (%)
Year
2002 (telephone) 69 28 3 100
2004 (internet) 57 35 8 100 2006 (internet) 57 34 9 100 2008 (internet) 59 38 3 100 2010 (internet) 52 46 2 100
Change in % points 2008-2010 -7 +8 -1
40/7. Turkey
(N=1284)
Should have* Should not
have* Not sure/ Decline Total
(%) (%) (%) (%)
Year
2002 (telephone) 58 34 8 100
2004 (internet) 46 45 9 100 2006 (internet) 46 44 10 100 2008 (internet) 50 47 4 100 2010 (internet) 43 53 4 100

GLOBAL VIEWS 2010 TOPLINE DATA FROM U.S. PUBLIC SURVEY
31
Change in % points 2008-2010 -7 +6 0 Summary of 40: Long Term Military Bases In Specific Countries - 2010 data only
(Ranked by Should Have)
(N=1284)
Should have* Should not
have* Not sure/ Decline Total
(%) (%) (%) (%)
Country
40/3. South Korea 62 36 3 100
40/4. Afghanistan 52 46 3 100
40/6. Germany 52 46 2 100
40/2. Iraq 50 48 2 100
40/1. Japan 50 48 2 100
40/5. Pakistan 45 52 3 100
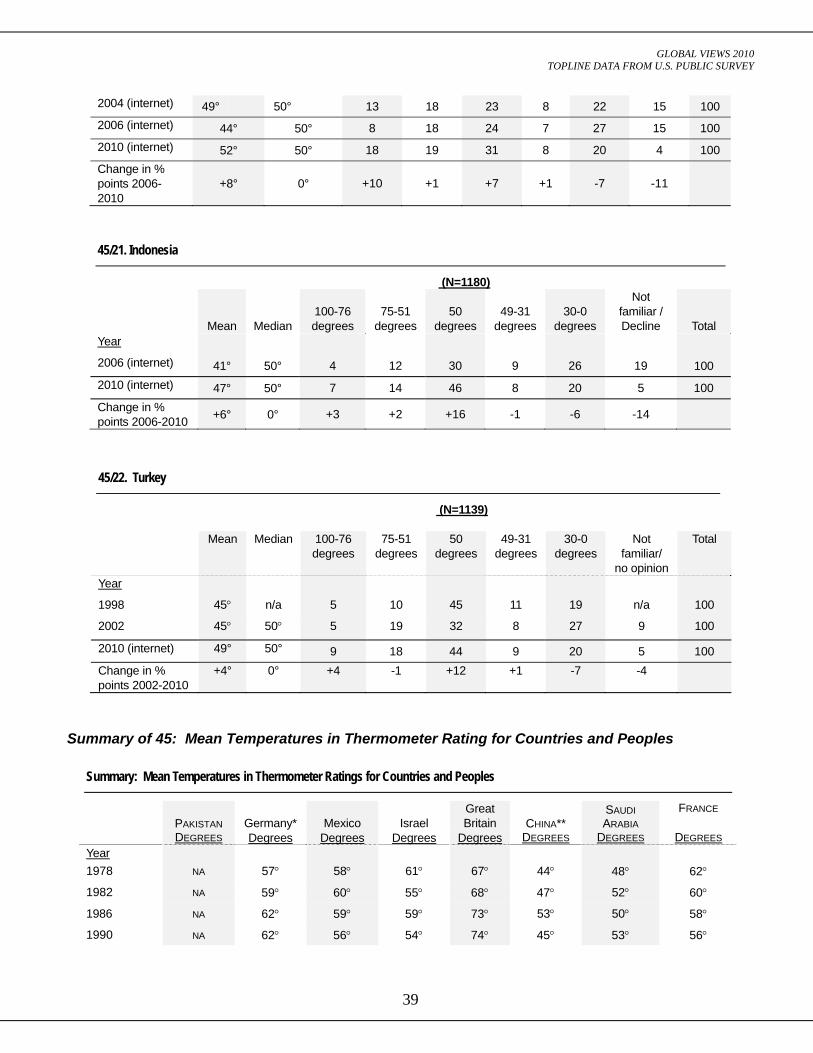
40/7. Turkey 43 53 4 100 Question 45 (1-22) Question 45 (1-22): Please rate your feelings toward some countries and peoples, with one hundred meaning a very warm, favorable feeling, zero meaning a very cold, unfavorable feeling, and fifty meaning not particularly warm or cold. You can use any number from zero to one hundred, the higher the number the more favorable your feelings are toward that country or those people.
45/1. Pakistan
(N=1150) Mean Median 100-76
degrees 75-51 degrees
50 degrees
49-31 degrees
30-0 degrees
Don’t Know/ Refused
Total
Year
1998 42° 4 8 39 13 28 8 100
2002 31° -- -- -- -- -- --
2008 (internet) 35° 58° 5 9 21 15 45 6 100 2010 (internet) 35° 40° 4 9 25 13 45 4 100
Change in % points 2008-2010
0° -18° -1 0 +4 -2 0 -2
45/2. Germany
(N=1186)
Mean Median 100-76 degrees
75-51 degrees
50 degrees
49-31 degrees
30-0 degrees
Not familiar / Decline Total
Year

GLOBAL VIEWS 2010 TOPLINE DATA FROM U.S. PUBLIC SURVEY
32
1994 57° n/a 17 31 33 6 11 2 100
1998 56° n/a 18 26 33 7 13 3 100
2002 (telephone) 61° 62° 25 32 25 5 11 2 100
2002 (internet) 56° 50°
2004 (internet) 58° 60° 24 23 20 6 15 12 100
2006 (internet) 57° 60° 20 27 21 5 15 13 100
2008 (internet) 57° 50° 21 26 27 6 15 5 100 2010 (internet) 63° 60° 30 24 30 5 8 4 100 Change in % points 2008-2010
+6° +10° +9 -2 +3 -1 -7 -1
45/3. Mexico (N=1120)
Mean Median 100-76 degrees
75-51 degrees
50 degrees
49-31 degrees
30-0 degrees
Not familiar / Decline Total
Year
1994 57° n/a 17 32 30 7 12 2 100
1998 57° n/a 18 32 30 5 14 1 100 2002 (telephone) 60° 60° 25 30 22 7 13 3 100
2002 (internet) 53° 50°
2004 (internet) 54° 50° 19 24 20 7 19 11 100
2006 (internet) 47° 50° 13 20 20 8 28 12 100
2008 (internet) 50° 50° 16 21 23 9 26 5 100 2010 (internet) 46° 50° 15 17 23 13 30 3 100 Change in % points 2008-2010
-4° 0° -1 -4 0 +4 +4 -2
45/4. Israel
(N=1177)
Mean Median 100-76 degrees
75-51 degrees
50 degrees
49-31 degrees
30-0 degrees
Not familiar / Decline Total
Year
1994 54° n/a 17 25 28 9 17 4 100
1998 55° n/a 18 24 28 9 18 3 100 2002 (telephone) 55° 52° 24 22 21 8 23 2 100
2002 (internet) 49° 50°
2004 (internet) 53° 50° 21 16 21 6 22 13 100
2006 (internet) 54° 50° 21 20 19 7 21 13 100

GLOBAL VIEWS 2010 TOPLINE DATA FROM U.S. PUBLIC SURVEY
33
2008 (internet) 58° 50° 27 18 24 7 18 6 100 2010 (internet) 57° 50° 28 17 26 8 18 4 100 Change in % points 2008-2010
-1° 0° +1 -1 +2 +1 0 -2
45/5. Great Britain
(N=2427)
Mean Median 100-76 degrees
75-51 degrees
50 degrees
49-31 degrees
30-0 degrees
Not familiar / Decline Total
Year
1994 69° n/a 37 28 24 2 5 4 100
1998 69° n/a 38 27 23 2 4 6 100 2002 (telephone) 76° 80° 55 22 11 3 5 4 100
2002 (internet) 70° 75°
2004 (internet) 70° 80° 47 17 13 3 9 11 100
2006 (internet) 71° 80° 46 20 13 2 8 12 100
2008 (internet) 70° 75° 46 21 19 2 8 4 100 2010 (internet) 73° 80° 51 20 21 2 5 4 100 Change in % points 2008-2010
+3° +5° +5 -1 +2 0 -3 0
45/6. China
(N=2513)
Mean Median 100-76 degrees
75-51 degrees
50 degrees
49-31 degrees
30-0 degrees
Not familiar / Decline Total
Year
1994 46° n/a 6 21 30 14 26 3 100
1998 47° n/a 6 20 32 14 24 4 100
2002 (telephone)
48° 50° 11 20 30 11 25 3 100
2002 (internet) 40° 45°
2004 (internet) 44° 50° 8 16 24 12 27 13 100 2006 (internet) 40° 50° 5 14 25 13 31 12 100 2008 (internet) 41° 50° 6 14 27 14 33 5 100 2010 (internet) 45° 50° 9 16 31 13 29 4 100 Change in % points 2008-2010
+4° 0° +3 +2 +4 -1 -4 -1

GLOBAL VIEWS 2010 TOPLINE DATA FROM U.S. PUBLIC SURVEY
34
45/7. Saudi Arabia
(N=1172)
Mean Median 100-76 degrees
75-51 degrees
50 degrees
49-31 degrees
30-0 degrees
Not familiar / Decline Total
Year
1994 48° n/a 11 22 27 9 27 4 100
1998 46° n/a 10 19 28 9 29 5 100
2002 33° 31° 4 11 17 13 51 4 100
2004 (internet) 37° 40° 4 12 20 12 37 15 100 2006 (internet) 34° 35° 3 11 20 11 42 14 100 2008 (internet) 39° 40° 6 14 25 13 37 5 100 2010 (internet) 39° 40° 5 12 29 13 37 4 100 Change in % points 2008-2010 0° 0° -1 -2 +4 0 0 -1
45/8. France
(N=1140)
Mean Median 100-76 degrees
75-51 degrees
50 degrees
49-31 degre
es 30-0
degrees
Not familiar / Decline Total
Year
1994 55° n/a 14 26 34 9 13 4 100
1998 55° n/a 13 27 35 7 14 4 100
2002 (telephone)
55° 52° 18 29 25 7 19 2 100
2004 (internet) 47° 50° 15 20 16 8 30 12 100 2006 (internet) 46° 50° 13 19 21 8 28 12 100 2008 (internet) 49° 50° 15 21 23 9 27 5 100 2010 (internet) 56° 50° 22 21 30 9 16 2 100 Change in % points 2008-2010
+7° 0° +7 0 +7 0 -11 -3
45/9. Brazil
(N=2513)
Mean
Median 100-76 degrees
75-51 degrees
50 degrees
49-31 degrees
30-0 degrees
Not familiar/
no opinion
Not sure/
Decline
Total
Year
1994 54° n/a 9 26 42 6 9 n/a 8 100
1998 56° n/a 12 24 46 3 9 n/a 6 100

GLOBAL VIEWS 2010 TOPLINE DATA FROM U.S. PUBLIC SURVEY
35
2002 (telephone) 55° 51° 15 23 34 7 12 5 4 100
2010 (internet) 56° 50° 18 23 39 6 11 n/a 4 100 Change in % points 2002-2010
+1° -1° +3 0 +5 -1 -1 0 0
45/10. India
(N=2513)
Mean Median 100-76 degrees
75-51 degrees
50 degrees
49-31 degrees
30-0 degrees
Not familiar / Decline Total
Year
1978 49° n/a n/a n/a n/a n/a n/a n/a n/a
1982 48° n/a n/a n/a n/a n/a n/a n/a n/a
1986 48° n/a n/a n/a n/a n/a n/a n/a n/a
1990 48° n/a 6 17 44 9 17 7 100
1994 48° n/a 5 18 41 8 19 9 100
1998 46° n/a 3 19 42 10 22 4 100
2002 (telephone)
46° 50° 7 19 32 13 23 6 100
2006 (internet) 46° 50° 9 18 25 11 25 12 100 2008 (internet) 47° 50° 9 22 33 10 21 5 100 2010 (internet) 53° 50° 14 23 35 8 15 4 100 Change in % points 2008-2010
+6° 0° +5 +1 +2 -2 -6 -1
45/11. Japan
(N=2513)
Mean Median 100-76 degrees
75-51 degrees
50 degrees
49-31 degrees
30-0 degrees
Not familiar / Decline Total
Year 1978 56° n/a n/a n/a n/a n/a n/a n/a n/a
1982 53° n/a n/a n/a n/a n/a n/a n/a n/a
1986 61° n/a n/a n/a n/a n/a n/a n/a n/a
1990 52° n/a 12 30 28 8 20 2 100
1994 53° n/a 13 28 30 7 20 2 100
1998 55° n/a 17 27 31 8 16 1 100
2002 60° 61° 23 32 24 6 12 3 100
2006 (internet) 58° 60° 23 23 22 6 14 12 100 2008 (internet) 59° 60° 27 23 23 7 15 5 100

GLOBAL VIEWS 2010 TOPLINE DATA FROM U.S. PUBLIC SURVEY
36
2010 (internet) 61° 60° 28 23 29 5 11 3 100 Change in % points 2008-2010 +2° 0° +1 0 +6 -2 -4 -2
45/12. Russia
(N=2513) Mean
Median 100-76
degrees 75-51
degrees 50
degrees 49-31
degrees 30-0
degrees Not
familiar/ Decline
Total
Year
1994 54° n/a 14 29 30 8 17 n/a 100
1998 49° n/a 9 23 33 12 21 n/a 100
2002 55° 52° 15 31 28 8 16 2 100
2002 53°
2008 (internet) 47° 50° 8 21 31 10 24 6 100 2010 (internet) 48° 50° 8 20 34 12 22 4 100 Change in % points 2008-2010
+1° 0° 0 -1 +3 +2 -2 -2
45/13. Venezuela
(N=1166) Mean
Median 100-76
degrees 75-51
degrees 50
degrees 49-31
degrees 30-0
degrees Not
familiar/ Decline
Total
Year
2008 (internet) 39° 50° 6 12 32 9 36 6 100 2010 (internet) 43° 50° 9 13 33 9 30 4 100 Change in % points 2008-2010
+4° 0° +3 +1 +1 0 -6 -2
45/14. Iran
(N=1163)
Mean Median 100-76 degrees
75-51 degrees
50 degrees
49-31 degrees
30-0 degrees
Not familiar / Decline Total
Year 1978 50° n/a n/a n/a n/a n/a n/a n/a n/a
1982 28° n/a n/a n/a n/a n/a n/a n/a n/a
1986 23° n/a n/a n/a n/a n/a n/a n/a n/a
1990 27° n/a 3 6 14 10 64 3 100
1994 28° n/a 3 6 15 10 62 4 100
1998 28° n/a 4 5 16 10 63 2 100

GLOBAL VIEWS 2010 TOPLINE DATA FROM U.S. PUBLIC SURVEY
37
2002 28° 28° 4 6 14 10 62 4 100
2006 (internet) 21° 20° 2 3 10 8 63 13 100
2008 (internet) 27° 25° 3 5 18 10 60 4 100
2010 (internet) 27° 25° 3 5 24 10 60 2 100
Change in % points 2008-2010 0° 0° 0 0 +6 0 0 -2
45/15. Cuba
(N=1156) Mean Median 100-76
degrees 75-51
degrees 50
degrees 49-31
degrees 30-0
degrees Not
familiar / Decline
Total
Year
1994 38° -- 5 16 20 11 46 2 100
1998 38° -- 6 12 22 11 44 5 100
2008 (internet) 36° 40° 4 9 27 14 41 5 100 2010 (internet) 38° 40° 6 11 28 11 41 3 100 Change in % points 2008-2010
+2° 0° +2 +2 +1 -3 0 -2
45/16. Iraq
(N=1214)
Mean Median 100-76 degrees
75-51 degrees
50 degrees
49-31 degrees
30-0 degrees
Not familiar / Decline Total
Year 1990 20° n/a 2 5 10 7 72 4 100
1994 24° n/a 2 5 12 8 69 4 100
1998 25° n/a 5 3 13 8 69 2 100
2002 23° 17° 4 5 10 8 69 4 100
2006 (internet) 27° 25° 3 9 13 9 54 13 100
2008 (internet) 34° 33° 5 12 21 10 48 5 100 2010 (internet) 34° 35° 5 9 24 12 48 2 100 Change in % points 2008-2010 0° +2° 0 -3 +3 +2 0 -3
45/17. Palestinian Authority
(N=1202) Mean
Median 100-76
degrees 75-51
degrees 50
degrees 49-31
degrees 30-0
degrees Not
familiar/ Decline
Total

GLOBAL VIEWS 2010 TOPLINE DATA FROM U.S. PUBLIC SURVEY
38
Year
2008 (internet) 32° 30° 5 6 21 12 50 6 100 2010 (internet) 32° 30° 2 6 27 12 50 4 100 Change in % points 2008-2010
0° 0° -3 0 +6 0 0 -2
45/18. South Africa
(N=1157) Mean
Median 100-76
degrees 75-51
degrees 50
degrees 49-31
degrees 30-0
degrees Not
familiar/ Decline
Total
Year
2008 (internet) 46° 50° 10 16 33 11 26 5 100 2010 (internet) 54° 50° 16 21 38 7 14 4 100 Change in % points 2008-2010
+8° 0° +6 +5 +5 -4 -12 -1
45/19. North Korea
(N=1214)
Mean Median 100-76 degrees
75-51 degrees
50 degrees
49-31 degrees
30-0 degrees
Not familiar / Decline Total
Year
1994 34° n/a 4 5 24 12 50 5 100
1998 36° n/a 2 9 26 13 46 4 100
2002 (telephone) 34° 30° 5 10 21 10 49 5 100
2002 (internet) 28° 30°
2004 (internet) 28° 20° 4 5 14 9 52 16 100
2006 (internet) 23° 20° 2 4 14 9 58 15 100 2010 (internet) 27° 25° 3 4 20 10 59 5 100 Change in % points 2006-2010 +4° +5° +1 0 +6 +1 +1 -10
45/20. South Korea
(N=2513)
Mean Median 100-76 degrees
75-51 degrees
50 degrees
49-31 degre
es 30-0
degrees
Not familiar / Decline Total
Year
1994 48° n/a 4 26 34 10 22 4 100
1998 50° n/a 10 18 38 12 15 7 100
2002 (telephone)
46° 50° 21 32 7 26 6 100
GLOBAL VIEWS 2010 TOPLINE DATA FROM U.S. PUBLIC SURVEY
39
2004 (internet) 49° 50° 13 18 23 8 22 15 100 2006 (internet) 44° 50° 8 18 24 7 27 15 100 2010 (internet) 52° 50° 18 19 31 8 20 4 100 Change in % points 2006-2010
+8° 0° +10 +1 +7 +1 -7 -11
45/21. Indonesia
(N=1180)
Mean Median 100-76 degrees
75-51 degrees
50 degrees
49-31 degrees
30-0 degrees
Not familiar / Decline Total
Year
2006 (internet) 41° 50° 4 12 30 9 26 19 100 2010 (internet) 47° 50° 7 14 46 8 20 5 100 Change in % points 2006-2010 +6° 0° +3 +2 +16 -1 -6 -14
45/22. Turkey
(N=1139)
Mean
Median 100-76 degrees
75-51 degrees
50 degrees
49-31 degrees
30-0 degrees
Not familiar/
no opinion
Total
Year
1998 45° n/a 5 10 45 11 19 n/a 100
2002 45° 50° 5 19 32 8 27 9 100
2010 (internet) 49° 50° 9 18 44 9 20 5 100 Change in % points 2002-2010
+4° 0° +4 -1 +12 +1 -7 -4
Summary of 45: Mean Temperatures in Thermometer Rating for Countries and Peoples
Summary: Mean Temperatures in Thermometer Ratings for Countries and Peoples
PAKISTAN Germany* Mexico Israel Great Britain CHINA**
SAUDI ARABIA
FRANCE
DEGREES Degrees Degrees Degrees Degrees DEGREES DEGREES DEGREES Year 1978 NA 57° 58° 61° 67° 44° 48° 62°
1982 NA 59° 60° 55° 68° 47° 52° 60°
1986 NA 62° 59° 59° 73° 53° 50° 58°
1990 NA 62° 56° 54° 74° 45° 53° 56°

GLOBAL VIEWS 2010 TOPLINE DATA FROM U.S. PUBLIC SURVEY
40
1994 NA 57° 57° 54° 69° 46° 48° 55°
1998 42° 56° 57° 55° 69° 47° 46° 55°
2002 31° 61° 60° 55°/49° 76°/70° 48°/40° 33° 55°/47°
2004 NA 58° 54° 53° 70° 44° 37° 47°
2006 NA 57° 47° 54° 71° 40° 34° 46°
2008 35° 57° 50° 58° 70° 41° 39° 49°
2010 35° 63° 46° 57° 73° 45° 39° 56°
*In surveys prior to 1990, this was asked as “West Germany”
**In surveys prior to 2004, this was asked as “People’s Republic of China”
BRAZIL INDIA JAPAN RUSSIA VENEZUELA IRAN Cuba Iraq PA DEGREES DEGREES DEGREES DEGREES DEGREES DEGREES DEGREES DEGREES DEGREES Year 1978 n/a 49° 56° n/a n/a 50° n/a n/a n/a
1982 n/a 48° 53° n/a n/a 28° n/a n/a n/a
1986 n/a 48° 61° n/a n/a 23° n/a n/a n/a
1990 n/a 48° 52° n/a n/a 27° n/a 20° n/a
1994 54° 48° 53° 54° n/a 28° 38° 24° n/a
1998 56° 46° 55° 49° n/a 28° 38° 25° n/a
2002 55° 46 60° 55°/53° n/a 28° n/a 23° n/a
2004 n/a n/a n/a n/a n/a n/a n/a n/a n/a
2006 n/a 46° 58° n/a n/a 21° n/a 27° n/a
2008 n/a 47° 59° 47° 39° 27° 36° 34° 32° 2010 56° 53° 61° 48° 43° 27° 38° 34° 32°
SOUTH AFRICA
North Korea
South Korea Indonesia Turkey
Degrees Degrees Degrees Degrees Degrees Year 1978 n/a n/a n/a n/a n/a
1982 n/a n/a n/a n/a n/a
1986 n/a n/a n/a n/a n/a
1990 n/a n/a n/a n/a n/a
1994 n/a 34° 48° n/a n/a
1998 n/a 36° 50° n/a 45°
2002 n/a 28° 46° n/a 45°
2004 n/a 28° 49° n/a n/a 2006 n/a 23° 44° 41° n/a 2008 46° n/a n/a n/a n/a 2010 54° 27° 52° 47° 49°

GLOBAL VIEWS 2010 TOPLINE DATA FROM U.S. PUBLIC SURVEY
41
(Ranked by Highest Mean Temperature)
2008 Mean (Rank) 2010 Mean (Rank) Country
Great Britain 70 (1) 73 (1)
Germany 57 (4) 63 (2)
Japan 59 (2) 61 (3)
Israel 58 (3) 57 (4)
France 49 (6) 56 (5)
Brazil - 56 (5)
South Africa 46 (9) 54 (7)
India 47 (7) 53 (8)
South Korea - 52 (9)
Turkey - 49 (10)
Russia 47 (7) 48 (11)
Indonesia - 47 (12)
Mexico 50 (5) 46 (13)
China 41 (10) 45 (14)
Venezuela 39 (11) 43 (15)
Saudi Arabia 39 (11) 39 (16)
Cuba 36 (13) 38 (17)
Pakistan 35 (14) 35 (18)
Iraq 34 (15) 34 (19)
PA 32 (16) 32 (20)
North Korea - 27 (21)
Iran 27 (17) 27 (21) Question 50 (1-9) Question 50 (1-9): I would like to know how much influence you think each of the following countries has in the world. Please answer on a 0 to 10 scale; with 0 meaning they are not at all influential and 10 meaning they are extremely influential.
50/1. The U.S.
(N=1307)
Year Mean Median 0
(%) 1
(%) 2
(%) 3
(%) 4
(%) 5
(%) 6
(%) 7
(%) 8
(%) 9
(%) 10
(%)
Not familiar / Decline
(%) Total (%)
2002 (telephone) 9.1 10 * * * * * 3 1 5 13 21 55 2 100
2006 (internet) 8.5 9 1 0 0 0 1 6 3 7 17 21 35 9 100

GLOBAL VIEWS 2010 TOPLINE DATA FROM U.S. PUBLIC SURVEY
42
2008 (internet) 9.5 10 1 0 0 0 1 7 3 9 18 19 40 2 100 2010 (internet) 8.6 9 2 1 1 0 1 3 2 7 17 20 41 6 100 Change in % points 2008-2010 -0.9 -1 +1 +1 +1 0 0 -4 -1 -2 -1 +1 +1 +4
50/2. Russia
(N=1307)
Mean Median 0
(%) 1
(%) 2
(%) 3
(%) 4
(%) 5
(%) 6
(%) 7
(%) 8
(%) 9
(%) 10
(%)
Not familiar / Decline
(%)
Total
(%) Year 2002 (telephone) 6.5 7 3 1 2 3 8 17 11 20 18 9 8 -- 100
2006 (internet) 5.6 6 4 1 4 4 10 21 13 14 10 4 4 11 100
2008 (internet) 7.1 7 3 1 2 4 7 22 16 20 11 5 8 2 100 2010 (internet) 6.2 6 5 1 3 4 6 18 12 14 14 8 9 8 100 Change in % points 2008-2010 -0.9 -1 +2 0 +1 0 -1 -4 -4 -6 +3 +3 +1 +6
50/3. Japan
(N=1307)
Mean Median 0
(%) 1
(%) 2
(%) 3
(%) 4
(%) 5
(%) 6
(%) 7
(%) 8
(%) 9
(%) 10
(%)
Not familiar / Decline
(%) Total (%)
Year 2002 (telephone) 6.6 7 2 * 1 4 8 17 13 16 20 8 11 -- 100
2006 (internet) 6.4 7 3 1 2 2 5 18 12 16 15 8 7 10 100
2008 (internet) 7.5 8 3 1 1 3 5 17 16 19 15 9 10 2 100 2010 (internet) 6.4 7 4 1 2 3 4 17 12 16 18 7 9 7 100 Change in % points 2008-2010 -1.1 -1 +1 0 +1 0 -1 0 -4 -3 +3 -2 -1 +5
50/4. Brazil
(N=1307)
Mean Median 0
(%) 1
(%) 2
(%) 3
(%) 4
(%) 5
(%) 6
(%) 7
(%) 8
(%) 9
(%) 10
(%)
Not familiar / Decline
(%)
Total
(%) Year 2008 (internet) 5.5 6 5 3 6 12 15 32 11 8 4 1 1 2 100 2010 (internet) 4.2 4 8 4 9 12 13 25 7 7 4 1 3 7 100

GLOBAL VIEWS 2010 TOPLINE DATA FROM U.S. PUBLIC SURVEY
43
Change in % points 2008-2010 -1.3 -2 +3 +1 +3 0 -2 -7 -4 -1 0 0 +2 +5
50/5. China
(N=1307)
Mean Median 0
(%) 1
(%) 2
(%) 3
(%) 4
(%) 5
(%) 6
(%) 7
(%) 8
(%) 9
(%) 10
(%)
Not familiar / Decline
(%) Total (%)
Year 2002 (telephone) 6.8 7 2 * 3 3 7 11 13 16 21 13 10 1 100
2006 (internet) 6.4 7 3 1 2 3 5 18 11 15 16 0 9 7 100
2008 (internet) 7.9 8 3 1 1 3 4 15 10 18 18 11 14 2 100 2010 (internet) 7.5 8 3 0 1 3 2 8 6 13 22 13 22 7 100 Change in % points 2008-2010 -0.4 0 0 -1 0 0 -2 -7 -4 -5 +4 +2 +8 +5
50/6. India
(N=1307)
Mean Median 0
(%) 1
(%) 2
(%) 3
(%) 4
(%) 5
(%) 6
(%) 7
(%) 8
(%) 9
(%) 10
(%)
Not familiar / Decline
(%) Total (%)
Year 2002 (telephone) 4.7 5 4 2 10 12 18 22 12 9 5 1 3 2 100 2006 (internet) 4.8 5 5 3 7 9 11 23 12 8 6 2 3 11 100
2008 (internet) 6.2 6 6 1 5 8 12 26 17 11 7 4 3 2 100 2010 (internet) 5.0 5 6 2 6 9 11 22 13 11 6 3 4 7 100 Change in % points 2008-2010 -1.2 -1 0 +1 +1 +1 -1 -4 -4 0 -1 -1 +1 +5
50/7. European Union as a whole2
(N=1307)
Mean Median 0
(%) 1
(%) 2
(%) 3
(%) 4
(%) 5
(%) 6
(%) 7
(%) 8
(%) 9
(%) 10
(%)
Not familiar
/ Decline
(%) Total (%)
Year 2002 (telephone) 6.7 7 4 1 2 4 4 13 8 15 20 11 10 8 100 2006 (internet) 6.0 6 4 1 2 3 7 20 11 13 14 7 6 12 100
2008 (internet) 7.8 8 4 0 1 3 4 17 10 16 19 11 13 2 100
2 In 2002 and 2006 the question was asked as “European Union”

GLOBAL VIEWS 2010 TOPLINE DATA FROM U.S. PUBLIC SURVEY
44
2010 (internet) 7.2 8 3 0 2 1 1 15 7 15 19 12 17 7 100 Change in % points 2008-2010 -0.6 0 -1 0 +1 -2 -3 -2 -3 -1 0 +1 +4 +5
50/8. South Korea (new)
(N=1307)
Mean Median 0
(%) 1
(%) 2
(%) 3
(%) 4
(%) 5
(%) 6
(%) 7
(%) 8
(%) 9
(%) 10 (%)
Not familiar / Decline
(%)
Total
(%) Year 2010 (internet) 4.7 5 7 3 8 11 12 21 10 10 5 2 4 8 100
50/9. Turkey (new)
(N=1307)
Mean Median 0
(%) 1
(%) 2
(%) 3
(%) 4
(%) 5
(%) 6
(%) 7
(%) 8
(%) 9
(%) 10
(%)
Not familiar / Decline
(%) Total (%)
Year
2010 (internet) 3.9 4 9 4 12 14 12 23 8 4 3 2 2 7 100
Summary of 50: Influence of Countries in the World Now
(Ranked by Highest Mean Influence Score)
2008 Mean (Rank) 2010 Mean (Rank) Country
United States 9.5 (1) 8.6 (1)
China 7.9 (2) 7.5 (2)
The European Union as a While 7.8 (3) 7.2 (3)
Japan 7.5 (5) 6.4 (4)
Russia 7.1 (6) 6.2 (5)
India 6.2 (8) 5.0 (6)
South Korea - 4.7 (7)
Brazil 5.5 (9) 4.2 (8)
Turkey - 3.9 (9) Question 55 (1-9) Question 55 (1-9): Using the same 10 point scale, please say how much influence you think each of the following countries will have in the world 10 years from now.

GLOBAL VIEWS 2010 TOPLINE DATA FROM U.S. PUBLIC SURVEY
45
55/1. The U.S.
(N=1307)
Year Mean Median 0
(%) 1
(%) 2
(%) 3
(%) 4
(%) 5
(%) 6
(%) 7
(%) 8
(%) 9
(%) 10
(%)
Not familiar / Decline
(%) Total (%)
2006 (internet) 8.0 9 2 1 0 1 1 8 4 9 14 18 30 11 100 2010 (internet) 8.0 9 3 1 1 1 1 7 4 9 18 17 31 9 100 Change in % points 2006-2010 0 0 +1 0 +1 0 0 -1 0 0 +4 -1 +1 -2
55/2. Russia
(N=1307)
Mean Median 0
(%) 1
(%) 2
(%) 3
(%) 4
(%) 5
(%) 6
(%) 7
(%) 8
(%) 9
(%) 10
(%)
Not familiar / Decline
(%)
Total
(%) Year 2006 (internet) 5.6 6 5 2 4 5 9 21 11 14 12 3 5 12 100 2010 (internet) 6.2 6 4 1 3 4 6 19 10 14 15 6 10 9 100 Change in % points 2006-2010 +0.6 0 -1 -1 -1 -1 -3 -2 -1 0 +3 +3 +5 -3
55/3. Japan
(N=1307)
Mean Median 0
(%) 1
(%) 2
(%) 3
(%) 4
(%) 5
(%) 6
(%) 7
(%) 8
(%) 9
(%) 10
(%)
Not familiar / Decline
(%) Total (%)
Year 2006 (internet) 6.6 7 3 1 2 3 4 16 10 15 18 8 9 12 100 2010 (internet) 6.5 7 4 1 2 3 5 17 10 13 18 9 11 9 100 Change in % points 2006-2010 -0.1 0 +1 0 0 0 +1 +1 0 -2 0 +1 +2 -3
55/4. Brazil (new)
(N=1307)
Mean Median 0
(%) 1
(%) 2
(%) 3
(%) 4
(%) 5
(%) 6
(%) 7
(%) 8
(%) 9
(%) 10 (%)
Not familiar / Decline
(%)
Total
(%) Year 2010 (internet) 4.8 5 6 4 7 9 10 22 12 9 7 2 3 9 100

GLOBAL VIEWS 2010 TOPLINE DATA FROM U.S. PUBLIC SURVEY
46
55/5. China
(N=1307)
Mean Median 0
(%) 1
(%) 2
(%) 3
(%) 4
(%) 5
(%) 6
(%) 7
(%) 8
(%) 9
(%) 10
(%)
Not familiar / Decline
(%) Total (%)
Year 2006 (internet) 6.8 7 4 0 2 2 3 14 9 13 18 12 11 12 100 2010 (internet) 7.8 8 3 1 1 1 3 8 4 8 18 17 28 9 100 Change in % points 2006-2010 +1.0 +1 -1 +1 -1 -1 0 -6 -5 -5 0 +5 +17 -3
55/6. India
(N=1307)
Mean Median 0
(%) 1
(%) 2
(%) 3
(%) 4
(%) 5
(%) 6
(%) 7
(%) 8
(%) 9
(%) 10
(%)
Not familiar / Decline
(%) Total (%)
Year 2006 (internet) 5.4 5 5 1 5 5 8 22 11 12 11 3 4 13 100 2010 (internet) 5.6 6 5 2 5 6 8 19 12 12 10 6 6 9 100 Change in % points 2006-2010 +0.2 +1 0 +1 0 +1 0 -3 +1 0 -1 +3 +2 -4
55/7. European Union as a whole3
(N=1307)
Mean Median 0
(%) 1
(%) 2
(%) 3
(%) 4
(%) 5
(%) 6
(%) 7
(%) 8
(%) 9
(%) 10
(%)
Not familiar
/ Decline
(%) Total (%)
Year 2006 (internet) 6.0 6 4 1 2 3 7 20 11 13 14 7 6 12 100 2010 (internet) 6.9 7 4 1 2 3 3 13 7 14 17 12 15 9 100 Change in % points 2006-2010 +0.9 +1 0 0 0 0 -4 -7 -4 +1 +3 +5 +9 -3
55/8. South Korea (new)
(N=1307)
Mean Median 0
(%) 1
(%) 2
(%) 3
(%) 4
(%) 5
(%) 6
(%) 7
(%) 8
(%) 9
(%) 10 (%)
Not familiar / Decline
(%)
Total
(%) Year
3 In 2006 the question was asked as “European Union”

GLOBAL VIEWS 2010 TOPLINE DATA FROM U.S. PUBLIC SURVEY
47
2010 (internet) 4.9 5 6 3 8 8 10 21 10 9 7 3 5 9 100
55/9. Turkey (new)
(N=1307)
Mean Median 0
(%) 1
(%) 2
(%) 3
(%) 4
(%) 5
(%) 6
(%) 7
(%) 8
(%) 9
(%) 10
(%)
Not familiar / Decline
(%) Total (%)
Year
2010 (internet) 4.4 5 7 5 9 11 12 22 10 7 4 2 2 9 100
Summary of 55: Influence of Countries in the World in 10 Years
(Ranked by Highest Mean Influence Score)
2006 Mean (Rank) 2010 Mean (Rank) Country
United States 8.0 (1) 8.0 (1)
China 6.8 (2) 7.8 (2)
The European Union as a Whole 6.0 (5) 6.9 (3)
Japan 6.6 (3) 6.5 (4)
Russia 5.6 (7) 6.2 (5)
India 5.4 (8) 5.6 (6)
South Korea - 4.9 (7)
Brazil - 4.8 (8)
Turkey - 4.4 (9) Question 60 Question 60: At this time, what do you think is more important to the future of the United States? 60. Addressing domestic problems or challenges from abroad more important to U.S.
(N=1302)
Fixing pressing
problems at home Addressing challenges to the U.S. from abroad
Both equally important (vol.)
Not sure/Decline Total
(%) (%) (%) (%) (%)
Year
2008 (internet) 82 17 0 1 100 2010 (internet) 91 9 0 1 100 Change in % points 2008-2010 +9 -8 0 0

GLOBAL VIEWS 2010 TOPLINE DATA FROM U.S. PUBLIC SURVEY
48
Question 65 Question 65: Which of these two positions is closer to yours? 65. Global financial regulating body (new)
(N=1343)
To prevent international economic instability, there should be a global body that regulates big financial institutions to make sure they
follow international standards
A global financial regulating body is a bad idea because it would
interfere in our economy and could make it less productive
Not sure/Decline Total
(%) (%) (%) (%)
Year
2010 (internet) 44 53 3 100
Question 70 Question 70: Which of the following three positions comes closest to your point of view about lowering trade barriers such as tariffs?
70. Position on lowering trade barriers
(N=1283)
I favor agreements to lower trade barriers
provided the government has programs to help
workers who lose their jobs
I favor agreements to lower trade barriers, but I
oppose government programs to help workers
who lose their jobs
I oppose agreements to
lower trade barriers
Not sure/ Decline Total
(%) (%) (%) (%) (%)
Year
2004 48 10 34 8 100 2006 (internet) 43 15 36 5 100 2008 (internet) 49 13 34 5 100 2010 (internet) 43 14 36 7 100 Change in % points 2008-2010 -6 +1 +2 +2
Question 72 Question 72: What do you think foreign trade means for America? Do you see foreign trade more as: 72. Meaning of foreign trade (new)
(N=1264)
An opportunity for economic growth
through increased U.S. exports A threat to the economy from
foreign imports Not
sure/Decline Total (%) (%) (%) (%)

GLOBAL VIEWS 2010 TOPLINE DATA FROM U.S. PUBLIC SURVEY
49
Year
2010 (internet) 55 43 2 100
*Gallup has asked this question since 1992; however, two additional volunteered response options were accepted in phone surveys Question 75 (1-8) Question 75 (1-8): Overall, do you think globalization is good or bad for:
75/1. The U.S. economy
(N=1299) Good Bad Not sure/ Decline Total
(%) (%) (%) (%)
Year
2008 (internet) 46 51 4 100 2010 (internet) 46 50 4 100 Change in % points 2008-2010 0 -1 0
75/2. American companies
(N=1299) Good Bad Not sure/ Decline Total
(%) (%) (%) (%)
Year
2008 (internet) 52 44 4 100 2010 (internet) 49 46 4 100 Change in % points 2008-2010 -3 +2 0
75/3. Consumers like you
(N=1299) Good Bad Not sure/ Decline Total
(%) (%) (%) (%)
Year
2008 (internet) 56 40 4 100 2010 (internet) 59 37 4 100 Change in % points 2008-2010 +3 -3 0
75/4. Creating jobs in the U.S.
(N=1299) Good Bad Not sure/ Decline Total

GLOBAL VIEWS 2010 TOPLINE DATA FROM U.S. PUBLIC SURVEY
50
(%) (%) (%) (%)
Year
2008 (internet) 38 58 4 100 2010 (internet) 36 60 4 100 Change in % points 2008-2010 -2 +2 0
75/5. The environment
(N=1299) Good Bad Not sure/ Decline Total
(%) (%) (%) (%)
Year
2008 (internet) 44 52 4 100 2010 (internet) 40 55 5 100 Change in % points 2008-2010 -4 +3 +1
75/6. Job security for American workers
(N=1299) Good Bad Not sure/ Decline Total
(%) (%) (%) (%)
Year
2008 (internet) 32 65 4 100 2010 (internet) 30 65 4 100 Change in % points 2008-2010 -2 0 0
75/7. Your own standard of living
(N=1299) Good Bad Not sure/ Decline Total
(%) (%) (%) (%)
Year
2008 (internet) 51 46 4 100 2010 (internet) 51 44 5 100 Change in % points 2008-2010 0 -2 +1
75/8. The next generation of Americans
(N=1299) Good Bad Not sure/ Decline Total
(%) (%) (%) (%)

GLOBAL VIEWS 2010 TOPLINE DATA FROM U.S. PUBLIC SURVEY
51
Year
2008 (internet) 48 49 4 100 2010 (internet) 45 51 5 100 Change in % points 2008-2010 -3 +2 +1
Question 80 (1-7) Question 80 (1-7) In general, do you think that the following countries practice fair trade or unfair trade with the United States?
80/1. The countries of the European Union
(N=1316)
Practice fair
trade Practice
unfair trade Not sure/ Decline Total
(%) (%) (%) (%)
Year
1990 31 40 29 100
1994 32 35 33 100
1998 54 24 22 100
2002 (telephone) 60 20 20 100
2004 (internet) 60 26 14 100 2006 (internet) 63 25 13 100 2008 (internet) 64 28 7 100 2010 (internet) 68 23 9 100 Change in % points 2008-2010 +4 -5 +2
80/2. China
(N=1316)
Practice fair
trade Practice
unfair trade Not sure/ Decline Total
(%) (%) (%) (%)
Year
2002 (telephone) 32 53 15 100
2004 (internet) 36 51 13 100 2006 (internet) 31 58 12 100 2008 (internet) 26 67 7 100 2010 (internet) 29 63 8 100 Change in % points 2008-2010 +3 -4 +1

GLOBAL VIEWS 2010 TOPLINE DATA FROM U.S. PUBLIC SURVEY
52
80/3. Mexico
(N=1316)
Practice fair
trade Practice
unfair trade Not sure/ Decline Total
(%) (%) (%) (%)
Year
2002 (telephone) 50 36 14 100
2004 (internet) 50 38 13 100 2006 (internet) 41 49 11 100 2008 (internet) 48 45 8 100 2010 (internet) 41 50 10 100 Change in % points 2008-2010 -7 +5 +2
80/4. Canada
(N=1316)
Practice fair
trade Practice
unfair trade Not sure/ Decline Total
(%) (%) (%) (%)
Year
2002 (telephone) 79 10 11 100
2004 (internet) 74 15 11 100 2006 (internet) 77 12 11 100 2008 (internet) 81 12 7 100 2010 (internet) 81 11 8 100 Change in % points 2008-2010 0 -1 +1
80/5. Japan
(N=1316)
Practice fair
trade Practice
unfair trade Not sure/ Decline Total
(%) (%) (%) (%)
Year
1990 17 71 12 100
1994 17 71 12 100
1998 31 55 14 100
2002 (telephone) 47 41 12 100
2004 (internet) 52 35 13 100 2006 (internet) 54 35 11 100 2008 (internet) 57 36 7 100

GLOBAL VIEWS 2010 TOPLINE DATA FROM U.S. PUBLIC SURVEY
53
2010 (internet) 58 34 9 100 Change in % points 2008-2010 +1 -2 +2
80/6. India
(N=1316)
Practice fair
trade Practice
unfair trade Not sure/ Decline Total
(%) (%) (%) (%)
Year
2006 (internet) 39 47 14 100 2008 (internet) 46 45 9 100 2010 (internet) 49 41 10 100 Change in % points 2008-2010 +3 -4 +1
80/7. South Korea
(N=1316)
Practice fair
trade Practice
unfair trade Not sure/ Decline Total
(%) (%) (%) (%)
Year
2004 (internet) 49 35 15 100 2010 (internet) 48 42 10 100 Change in % points 2004-2010 -1 +7 -5
Question 85 (1-9) Question 85 (1-9): Please indicate how important the following factors are to the United States remaining competitive with other countries in the global economy?
85/1. Supporting open trade around the world
(N=1362)
Very important Somewhat important
Not very important
Not important at all
Not sure/Decline Total
(%) (%) (%) (%) (%) (%)
Year 2008 (internet) 32 49 13 5 3 100
2008 (Sept.) (24) (54) (15) (5) (2) 100 2010 (internet) 23 54 16 4 3 100 Change in % points 2008-2010 -9 +5 +3 -1 0

GLOBAL VIEWS 2010 TOPLINE DATA FROM U.S. PUBLIC SURVEY
54
85/2. Improving public education
(N=1362)
Very important Somewhat important
Not very important
Not important at all
Not sure/Decline Total
(%) (%) (%) (%) (%) (%)
Year 2008 (internet) 71 22 3 2 2 100
2008 (Sept.) (65) (29) (3) (1) (2) 100 2010 (internet) 65 27 5 2 2 100 Change in % points 2008-2010 -6 +5 +2 0 0
85/3. Providing universal health care
(N=1362)
Very important Somewhat important
Not very important
Not important at all
Not sure/Decline Total
(%) (%) (%) (%) (%) (%)
Year 2008 (internet) 47 26 13 10 3 100
2008 (Sept.) (43) (31) (13) (11) (2) 100 2010 (internet) 40 26 17 17 2 100 Change in % points 2008-2010 -7 0 +4 +7 -1
85/4. Reducing federal budget deficits
(N=1362)
Very important Somewhat important
Not very important
Not important at all
Not sure/Decline Total
(%) (%) (%) (%) (%) (%)
Year 2008 (internet) 68 26 3 2 2 100
2008 (Sept.) (65) (29) (2) (1) (2) 100 2010 (internet) 66 27 4 1 2 100 Change in % points 2008-2010 -2 +1 +1 -1 0
85/5. Continuing high levels of legal immigration
(N=1362)
Very important Somewhat important
Not very important
Not important at all
Not sure/Decline Total
(%) (%) (%) (%) (%) (%)
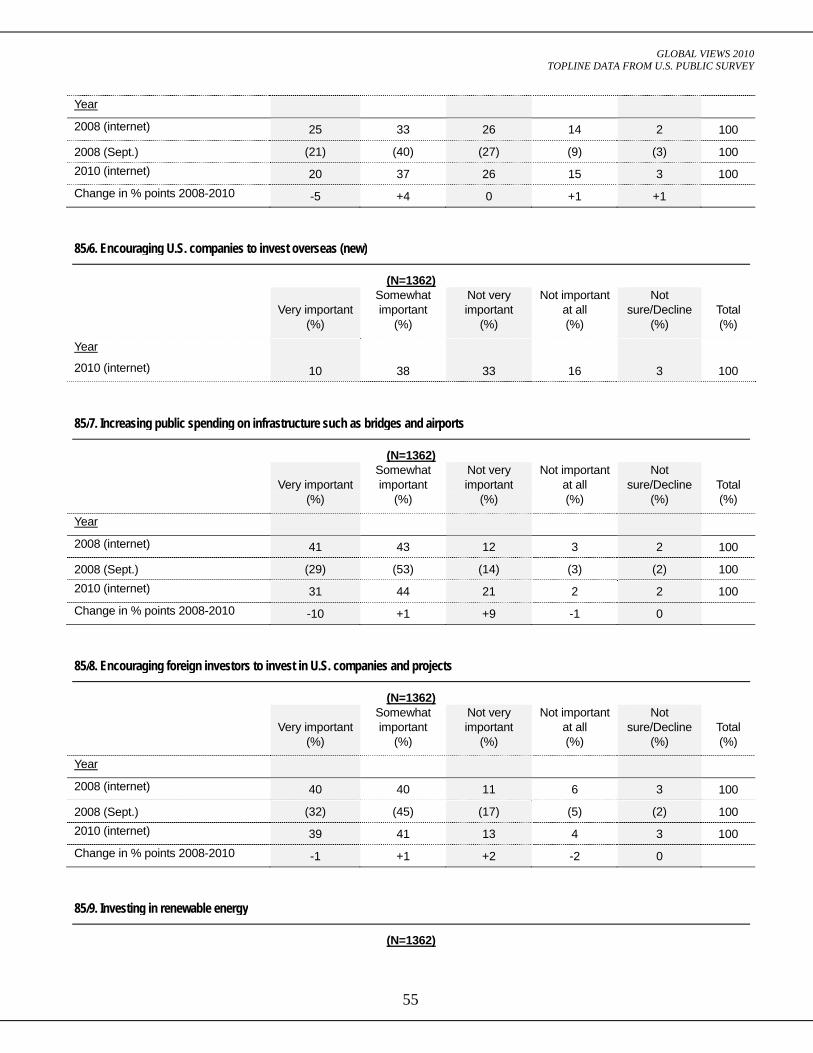
GLOBAL VIEWS 2010 TOPLINE DATA FROM U.S. PUBLIC SURVEY
55
Year 2008 (internet) 25 33 26 14 2 100
2008 (Sept.) (21) (40) (27) (9) (3) 100 2010 (internet) 20 37 26 15 3 100 Change in % points 2008-2010 -5 +4 0 +1 +1
85/6. Encouraging U.S. companies to invest overseas (new)
(N=1362)
Very important Somewhat important
Not very important
Not important at all
Not sure/Decline Total
(%) (%) (%) (%) (%) (%)
Year 2010 (internet) 10 38 33 16 3 100
85/7. Increasing public spending on infrastructure such as bridges and airports
(N=1362)
Very important Somewhat important
Not very important
Not important at all
Not sure/Decline Total
(%) (%) (%) (%) (%) (%)
Year 2008 (internet) 41 43 12 3 2 100
2008 (Sept.) (29) (53) (14) (3) (2) 100 2010 (internet) 31 44 21 2 2 100 Change in % points 2008-2010 -10 +1 +9 -1 0
85/8. Encouraging foreign investors to invest in U.S. companies and projects
(N=1362)
Very important Somewhat important
Not very important
Not important at all
Not sure/Decline Total
(%) (%) (%) (%) (%) (%)
Year 2008 (internet) 40 40 11 6 3 100
2008 (Sept.) (32) (45) (17) (5) (2) 100 2010 (internet) 39 41 13 4 3 100 Change in % points 2008-2010 -1 +1 +2 -2 0
85/9. Investing in renewable energy
(N=1362)

GLOBAL VIEWS 2010 TOPLINE DATA FROM U.S. PUBLIC SURVEY
56
Very important Somewhat important
Not very important
Not important at all
Not sure/Decline Total
(%) (%) (%) (%) (%) (%)
Year 2008 (internet) 74 19 4 2 2 100
2008 (Sept.) (71) (22) (4) (1) (2) 100 2010 (internet) 62 29 6 2 2 100 Change in % points 2008-2010 -12 +10 +2 0 0
Question 95 Question 95: Do you think that the distribution of income and wealth in the U.S. has recently become more fair, less fair, or stayed about the same?
95. Fairness of recent income distribution in U.S.
(N=1316) More fair Less fair Stayed about the same Not sure/Decline Total
(%) (%) (%) (%) (%)
Year
2008 (internet) 5 64 30 2 100 2010 (internet) 4 62 33 1 100
Summary of 85: Important factors in U.S. remaining competitive - 2010 data only 85. Important factors in U.S. remaining competitive in global economy (by very important)
(N=1362)
Very
important Somewhat important
Not very important
Not important at all
Not sure/ Decline Total
(%) (%) (%) (%) (%) (%)
85/4. Reducing federal budget deficits 66 27 4 1 2 100
85/2. Improving public education 65 27 5 2 2 100
85/9. Investing in renewable energy 62 29 6 2 2 100
85/3. Providing universal health care 40 26 17 17 2 100 85/8. Encouraging foreign investors to invest in U.S. companies and projects 39 41 13 4 3 100 85/7. Increasing public spending on infrastructure such as bridges and airports 31 44 21 2 2
100
85/1. Supporting open trade around the world 23 54 16 4 3 100
85/5. Continuing high levels of legal immigration 20 37 26 15 3 100
85/6. Encouraging U.S. companies to invest overseas (new) 10 38 33 16 3 100
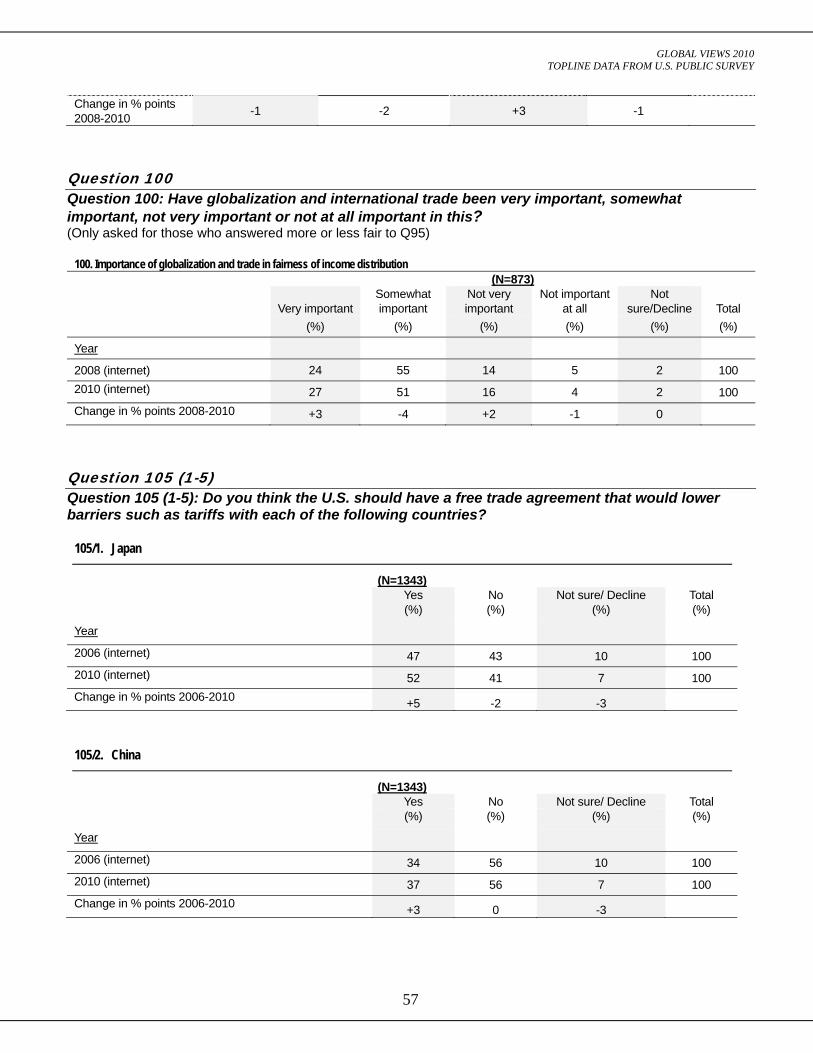
GLOBAL VIEWS 2010 TOPLINE DATA FROM U.S. PUBLIC SURVEY
57
Change in % points 2008-2010 -1 -2 +3 -1
Question 100 Question 100: Have globalization and international trade been very important, somewhat important, not very important or not at all important in this? (Only asked for those who answered more or less fair to Q95)
100. Importance of globalization and trade in fairness of income distribution (N=873)
Very important Somewhat important
Not very important
Not important at all
Not sure/Decline Total
(%) (%) (%) (%) (%) (%)
Year
2008 (internet) 24 55 14 5 2 100 2010 (internet) 27 51 16 4 2 100 Change in % points 2008-2010 +3 -4 +2 -1 0
Question 105 (1-5) Question 105 (1-5): Do you think the U.S. should have a free trade agreement that would lower barriers such as tariffs with each of the following countries?
105/1. Japan
(N=1343) Yes No Not sure/ Decline Total
(%) (%) (%) (%)
Year
2006 (internet) 47 43 10 100 2010 (internet) 52 41 7 100 Change in % points 2006-2010 +5 -2 -3
105/2. China
(N=1343) Yes No Not sure/ Decline Total
(%) (%) (%) (%)
Year
2006 (internet) 34 56 10 100 2010 (internet) 37 56 7 100 Change in % points 2006-2010 +3 0 -3

GLOBAL VIEWS 2010 TOPLINE DATA FROM U.S. PUBLIC SURVEY
58
105/3. India
(N=1343) Yes No Not sure/ Decline Total
(%) (%) (%) (%)
Year
2006 (internet) 36 54 10 100 2010 (internet) 45 48 8 100 Change in % points 2006-2010 +9 -6 -2
105/4. South Korea
(N=1343) Yes No Not sure/ Decline Total
(%) (%) (%) (%)
Year
2006 (internet) 39 50 11 100 2010 (internet) 42 51 7 100 Change in % points 2006-2010 +3 +1 -4
105/5. Colombia (new)
(N=1343) Yes No Not sure/ Decline Total
(%) (%) (%) (%)
Year
2010 (internet) 35 58 8 100 Question 115 Question 115: Overall, with regard to further globalization, do you think that it should be a goal of the U.S. to try to actively promote it, simply allow it to continue, try to slow it down, or try to stop or reverse it?
115. Globalization
(N=1235) Actively
promote it Allow it to continue
Try to slow it down
Try to reverse it
Not sure/ Decline
Total
(%) (%) (%) (%) (%) (%)
Year
2002 14 35 24 15 12 100
2010 (internet) 8 39 33 17 4 100
Change in % points 2002-2010 -6 +4 +9 +2 -8

GLOBAL VIEWS 2010 TOPLINE DATA FROM U.S. PUBLIC SURVEY
59
Question 120 (1-7) Question 120 (1-7): Now please consider how much influence you think some people and groups have on U.S. foreign policy. Please answer on a scale of 0 to 10, with 0 meaning they are not at all influential and 10 meaning they are extremely influential
120/1. The American Public
(N=1233)
Mean Median
Not at all influential
0 1 2 3 4 5 6 7 8 9
Extremely Influential
10
Not sure/
Decline Total (%) (%
) (%) (%) (%) (%) (%) (%) (%) (%) (%) (%) (%)
Year
2002 (telephone)
4.5 5 10 5 10 10 11 23 7 9 7 2 6 -- 100
2004 (internet)
5.1 5 5 4 8 8 11 21 12 11 8 4 6 4 100
2010 (internet)
5.1 5 10 3 7 8 9 21 10 9 9 3 10 1 100
Change in % points 2004-2010
0 0 +5 -1 -1 0 -2 0 -2 -2 +1 -1 +4 -3
120/2. Congress
(N=1233)
Mean Media
n
Not at all influential
0 1 2 3 4 5 6 7 8 9
Extremely Influential
10
Not sure/
Decline Total (%) (%) (%) (%) (%) (%) (%) (%) (%) (%) (%) (%) (%)
Year
2002 (telephone)
6.9 7 1 1 1 3 4 18 10 18 19 9 13 3 100
2004 (internet)
6.8 7 2 1 1 2 6 17 11 16 16 10 13 4 100
2010 (internet)
7.1 8 4 1 2 2 4 14 9 13 19 12 19 2 100
Change in % points 2004-2010
+0.3 +1 +2 0 +1 0 -2 -3 -2 -3 +3 +2 +6 -2
120/3. The President
(N=1233)

GLOBAL VIEWS 2010 TOPLINE DATA FROM U.S. PUBLIC SURVEY
60
Mean Median
Not at all influential
0 1 2 3 4 5 6 7 8 9
Extremely Influential
10
Not sure/
Decline Total (%) (%
) (%) (%) (%) (%) (%) (%) (%) (%) (%) (%) (%)
Year
2002 (telephone)
7.7 8 2 -- 1 3 2 8 6 12 19 18 27 2 100
2004 (internet)
7.5 8 2 1 1 1 3 12 7 11 16 14 27 4 100
2010 (internet)
7.3 8 4 1 2 2 4 11 8 11 17 14 25 2 100
Change in % points 2004-2010
-0.2 0 +2 0 +1 +1 +1 -1 +1 0 +1 0 -2 -2
120/4. U.S. interest groups
(N=1233)
Mean Median
Not at all influential
0 1 2 3 4 5 6 7 8 9
Extremely Influential
10
Not sure/
Decline Total (%) (%
) (%) (%) (%) (%) (%) (%) (%) (%) (%) (%) (%)
Year
2002 (telephone)
5.7 5 4 2 7 5 10 23 8 12 12 5 8 4 100
2004 (internet)
6.0 6 4 1 3 5 9 22 12 14 11 6 9 5 100
2010 (internet)
6.4 7 4 1 2 4 5 18 11 15 17 7 13 2 100
Change in % points 2004-2010
+0.4 +1 0 0 -1 -1 -4 -4 -1 +1 +6 +1 +4 -3
120/5. The opinion of the majority of all people around the world
(N=1233)
Mean Median
Not at all influential
0 1 2 3 4 5 6 7 8 9
Extremely Influential
10
Not sure/
Decline Total (%) (%
) (%) (%) (%) (%) (%) (%) (%) (%) (%) (%) (%)
Year
2004 (internet)
4.2 4 9 7 10 12 10 21 9 6 4 3 4 5 100
2010 (internet)
4.7 5 10 4 10 9 11 23 8 8 7 3 7 2 100

GLOBAL VIEWS 2010 TOPLINE DATA FROM U.S. PUBLIC SURVEY
61
Change in % points 2004-2010
+0.5 +1 +1 -3 0 -3 +1 +2 -1 +2 +3 0 +3 -3
120/6. The opinion of the majority of governments around the world
(N=1233)
Mean Median
Not at all influential
0 1 2 3 4 5 6 7 8 9
Extremely Influential
10
Not sure/
Decline Total (%) (%
) (%) (%) (%) (%) (%) (%) (%) (%) (%) (%) (%)
Year
2004 (internet)
5.7 6 3 2 3 7 8 24 14 12 12 5 5 5 100
2010 (internet)
6.0 6 5 2 4 4 5 22 15 13 12 6 10 2 100
Change in % points 2004-2010
+0.3 0 +2 0 +1 -3 -3 -2 +1 +1 0 +1 +5 -3
120/7. Large corporations (new)
(N=1233)
Mean Median
Not at all influential
0 1 2 3 4 5 6 7 8 9
Extremely Influential
10
Not sure/
Decline Total (%) (%
) (%) (%) (%) (%) (%) (%) (%) (%) (%) (%) (%)
Year
2010 (internet)
7.2 8 3 1 1 3 4 13 8 13 17 13 23 2 100
Summary of 120: Impact on Foreign Policy - 2010 data only
(Ranked on Mean Score)
(N=1233)
Mean
Median
Not at all
influential 0 1 2 3 4 5 6 7 8 9
Extremely Influential
10
Not sure/
Decline Total (%) (%) (%) (%) (%) (%) (%) (%) (%) (%) (%) (%) (%)
120/3. The President 7.3 8 4 1 2 2 4 11 8 11 17 14 25 2 100

GLOBAL VIEWS 2010 TOPLINE DATA FROM U.S. PUBLIC SURVEY
62
120/7. Large corporations (new) 7.2 8 3 1 1 3 4 13 8 13 17 13 23 2 100
120/2. Congress 7.1 8 4 1 2 2 4 14 9 13 19 12 19 2 100 120/4. U.S. interest groups 6.4 7 4 1 2 4 5 18 11 15 17 7 13 2 100 120/6. The opinion of the majority of governments around the world 6.0 6
5 2 4 4 5 22 15 13 12 6 10 2
100 120/1. The American Public 5.1 5 10 3 7 8 9 21 10 9 9 3 10 1 100
120/5. The opinion of the majority of all people around the world 4.7 5
10 4 10 9 11 23 8 8 7 3 7 2
100 Question 125 (1-7) Question 125 (1-7): How much influence do you think the following SHOULD have on U.S. foreign policy. 0 means they should not be at all influential and 10 means they should be extremely influential.
125/1. The American Public
(N=1238)
Mean Media
n
Not at all influential
0 1 2 3 4 5 6 7 8 9
Extremely Influential
10
Not sure/
Decline Total (%) (%) (%) (%) (%) (%) (%) (%) (%) (%) (%) (%) (%)
Year 2002 (telephone)
7.4 8 1 1 1 3 3 14 8 13 19 8 28 1 100
2004 (internet)
7.3 8 1 1 1 2 5 16 8 14 16 10 22 4 100
2010 (internet)
8.1 9 3 0 1 1 2 8 5 11 16 12 41 2 100
Change in % points 2004-2010
+0.8 +1 +2 -1 0 -1 -3 -8 -3 -3 0 +2 +19 -2
125/2. Congress
(N=1238)
Mean Media
n
Not at all influential
0 1 2 3 4 5 6 7 8 9
Extremely Influential
10
Not sure/
Decline Total (%) (%) (%) (%) (%) (%) (%) (%) (%) (%) (%) (%) (%)
Year
2002 (telephone)
7.2 8 1 1 1 2 3 16 10 13 22 12 18 1 100

GLOBAL VIEWS 2010 TOPLINE DATA FROM U.S. PUBLIC SURVEY
63
2004 (internet)
7.2 8 1 1 2 2 4 16 8 13 16 13 20 4 100
2010 (internet)
6.6 7 5 1 2 3 4 19 8 12 18 10 16 2 100
Change in % points 2004-2010
-0.6 -1 +4 0 0 +1 0 +3 0 -1 +2 -3 -4 -2
125/3. The President
(N=1238)
Mean Media
n
Not at all influential
0 1 2 3 4 5 6 7 8 9
Extremely Influential
10
Not sure/
Decline Total (%) (%) (%) (%) (%) (%) (%) (%) (%) (%) (%) (%) (%)
Year
2002 (telephone)
8.2 9 1 -- 1 1 2 10 5 9 17 14 40 -- 100
2004 (internet)
7.2 8 3 1 2 1 4 16 8 14 14 13 21 4 100
2010 (internet)
7.2 8 4 2 2 2 3 14 7 10 17 12 25 1 100
Change in % points 2004-2010
0 0 +1 +1 0 +1 -1 -2 -1 -4 +3 -1 +4 -3
125/4. U.S. interest groups
(N=1238)
Mean Media
n
Not at all influential
0 1 2 3 4 5 6 7 8 9
Extremely Influential
10
Not sure/
Decline Total (%) (%) (%) (%) (%) (%) (%) (%) (%) (%) (%) (%) (%)
Year
2002 (telephone)
4.4 5 14 6 10 8 10 22 7 5 7 3 8 -- 100
2004 (internet)
4.5 5 11 5 7 9 10 23 9 8 6 3 4 5 100
2010 (internet)
4.5 5 13 3 9 7 10 22 10 8 6 2 7 2 100
Change in % points 2004-2010
0 0 +2 -2 +2 -2 0 -1 +1 0 0 -1 +3 -3
125/5. The opinion of the majority of all people around the world
(N=1238)

GLOBAL VIEWS 2010 TOPLINE DATA FROM U.S. PUBLIC SURVEY
64
Mean Media
n
Not at all influential
0 1 2 3 4 5 6 7 8 9
Extremely Influential
10
Not sure/
Decline Total (%) (%) (%) (%) (%) (%) (%) (%) (%) (%) (%) (%) (%)
Year
2004 (internet)
5.7 5 5 3 4 6 7 25 11 10 9 5 10 4 100
2010 (internet)
5.2 5 14 3 6 5 8 19 9 8 8 5 13 2 100
Change in % points 2004-2010
-0.5 0 +9 0 +2 -1 +1 -6 -2 -2 -1 0 +3 -2
125/6. The opinion of the majority of governments around the world
(N=1238)
Mean Media
n
Not at all influential
0 1 2 3 4 5 6 7 8 9
Extremely Influential
10
Not sure/
Decline Total (%) (%) (%) (%) (%) (%) (%) (%) (%) (%) (%) (%) (%)
Year
2004 (internet)
6.1 6 4 1 3 5 7 20 12 17 12 7 9 4 100
2010 (internet)
4.9 5 15 2 7 5 9 22 10 8 9 4 8 2 100
Change in % points 2004-2010
-1.2 -1 +11 +1 +4 0 +2 +2 -2 -9 -3 -3 -1 -2
125/7. Large corporations (new)
(N=1238)
Mean Media
n
Not at all influential
0 1 2 3 4 5 6 7 8 9
Extremely Influential
10
Not sure/
Decline Total (%) (%) (%) (%) (%) (%) (%) (%) (%) (%) (%) (%) (%)
Year
2010 (internet)
4.1 4 17 4 11 8 11 22 7 7 5 2 6 2 100
Summary of 125: Impact on Foreign Policy - 2010 data only
(Ranked on Mean Score)
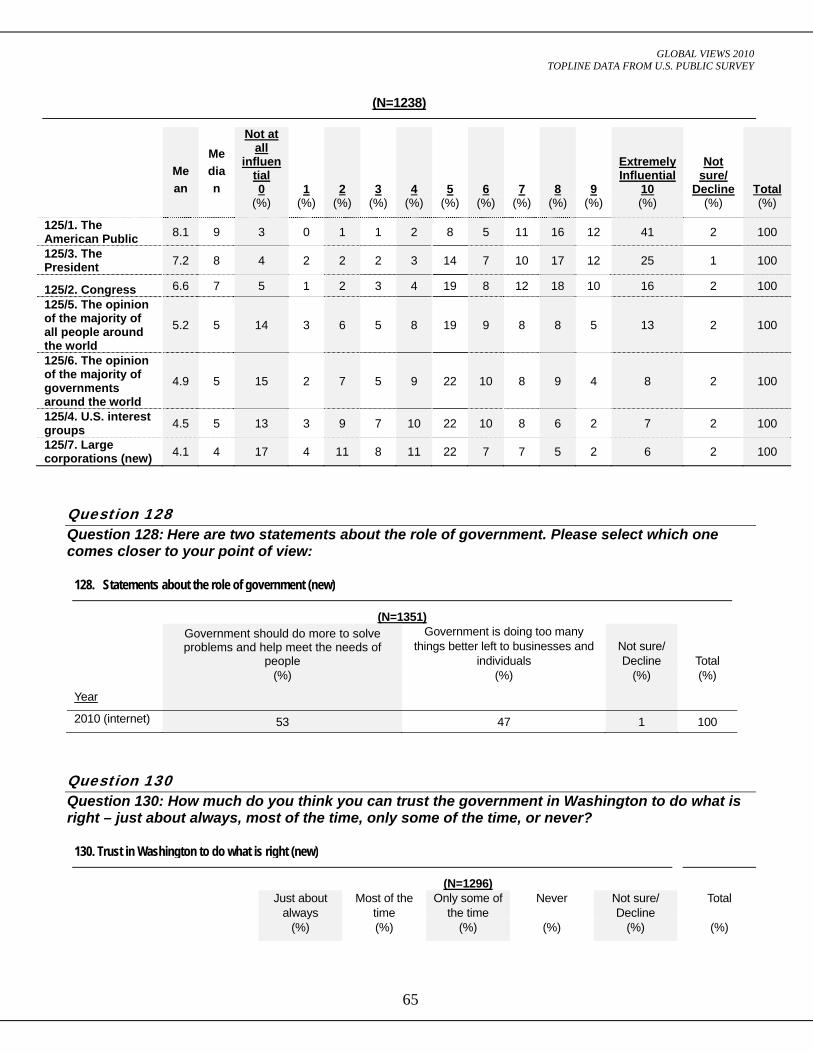
GLOBAL VIEWS 2010 TOPLINE DATA FROM U.S. PUBLIC SURVEY
65
(N=1238)
Mean
Median
Not at all
influential 0 1 2 3 4 5 6 7 8 9
Extremely Influential
10
Not sure/
Decline Total (%) (%) (%) (%) (%) (%) (%) (%) (%) (%) (%) (%) (%)
125/1. The American Public 8.1 9 3 0 1 1 2 8 5 11 16 12 41 2 100
125/3. The President 7.2 8 4 2 2 2 3 14 7 10 17 12 25 1 100
125/2. Congress 6.6 7 5 1 2 3 4 19 8 12 18 10 16 2 100 125/5. The opinion of the majority of all people around the world
5.2 5 14 3 6 5 8 19 9 8 8 5 13 2 100
125/6. The opinion of the majority of governments around the world
4.9 5 15 2 7 5 9 22 10 8 9 4 8 2 100
125/4. U.S. interest groups 4.5 5 13 3 9 7 10 22 10 8 6 2 7 2 100
125/7. Large corporations (new) 4.1 4 17 4 11 8 11 22 7 7 5 2 6 2 100
Question 128 Question 128: Here are two statements about the role of government. Please select which one comes closer to your point of view:
128. Statements about the role of government (new)
(N=1351)
Government should do more to solve problems and help meet the needs of
people
Government is doing too many things better left to businesses and
individuals Not sure/ Decline Total
(%) (%) (%) (%)
Year
2010 (internet) 53 47 1 100
Question 130 Question 130: How much do you think you can trust the government in Washington to do what is right – just about always, most of the time, only some of the time, or never?
130. Trust in Washington to do what is right (new)
(N=1296) Just about
always Most of the
time Only some of
the time Never Not sure/
Decline Total
(%) (%) (%) (%) (%) (%)

GLOBAL VIEWS 2010 TOPLINE DATA FROM U.S. PUBLIC SURVEY
66
Year
2010 (internet) 2 23 59 15 1 100
Question 135 Question 135: Over the last few years do you think the ability of the U.S. to achieve its foreign policy goals has increased, decreased, or remained about the same? 135. U.S. ability to achieve FP goals
(N=1335)
Increased (%)
Decreased (%)
Remained about
the same (%)
Not sure/ Decline
(%)
Total (%)
Year
2008 (internet) 10 53 36 1 100 2010 (internet) 13 51 35 1 100
Change in % points 2008-2010 +3 -2 -1 0
Question 140 (1-4) Question 140 (1-4): Based on what you know, do you think the U.S. should or should not participate in the following treaties and agreements?
140/1. The treaty that would prohibit nuclear weapon test explosions worldwide
(N=1269)
Should
participate Should not participate
Not sure/ Decline Total
(%) (%) (%) (%)
Year
2002 (telephone) 81 14 5 100
2002 (internet) 84 13 3 100
2004 (internet) 87 9 3 100 2006 (internet) 86 10 4 100 2008 (internet) 88 11 1 100 2010 (internet) 82 15 3 100 Change in % points 2008-2010 -6 +4 +2
140/2. The agreement on the International Criminal Court that can try individuals for war crimes, genocide, or crimes against humanity if their own country won’t try them4
4 Answer option changed slightly from 2002 to reflect the existence of the ICC. Previous question read, “The agreement to establish an International Criminal Court that would try individuals for war crimes, genocide, or crimes against humanity if their own country won’t try them”.

GLOBAL VIEWS 2010 TOPLINE DATA FROM U.S. PUBLIC SURVEY
67
(N=1269)
Should
participate Should not participate
Not sure/ Decline Total
(%) (%) (%) (%)
Year
2002 (telephone) 71 22 7 100
2002 (internet) 77 20 4 100
2004 (internet) 76 19 5 100 2006 (internet) 71 25 5 100 2008 (internet) 68 30 2 100 2010 (internet) 70 26 4 100 Change in % points 2008-2010 +2 -4 +2 0
140/3. A new international treaty to address climate change by reducing green house gas emissions
(N=1269)
Should
participate Should not participate
Not sure/ Decline Total
(%) (%) (%) (%)
Year
2008 (internet) 76 23 2 100 2010 (internet) 67 30 3 100 Change in % points 2008-2010 -9 +7 +1
140/4. An agreement under the treaty banning biological weapons that would allow international inspectors to examine biological research laboratories to ensure that countries are not producing biological weapons
(N=1269)
Should
participate Should not participate
Not sure/ Decline Total
(%) (%) (%) (%)
Year
2006 (internet) 89 8 3 100
2010 (internet) 85 12 3 100
Change in % points 2006-2010 -4 +4 0 0
Question 142 (1-4) Question 142 (1-4): Some people say that the world is facing some new problems that require some new international institutions or agencies to deal with them. Do you think that there should or should not be new international institutions to:

GLOBAL VIEWS 2010 TOPLINE DATA FROM U.S. PUBLIC SURVEY
68
142/1. Monitor whether countries are meeting their treaty obligations to limit their greenhouse gas emissions that contribute to climate change
(N=1274)
Should be Should not
be Not sure/ Decline Total
(%) (%) (%) (%)
Year
2008 (internet) 68 30 2 100 2010 (internet) 62 37 2 100
Change in % points 2008-2010 -6 +7 0
142/2. Monitor financial markets worldwide and report on potential crises
(N=1274)
Should be Should not
be Not sure/ Decline Total
(%) (%) (%) (%)
Year
2008 (internet) 59 38 2 100 2010 (internet) 66 32 2 100
Change in % points 2008-2010 +7 -6 0
142/3. Monitor the worldwide energy market and predict potential shortages
(N=1274)
Should be Should not
be Not sure/ Decline Total
(%) (%) (%) (%)
Year
2008 (internet) 69 30 2 100 2010 (internet) 64 35 1 100
Change in % points 2008-2010 -5 +5 -1
142/4. Provide information and assistance to countries dealing with problems resulting from large scale migration of people across borders
(N=1274)
Should be Should not
be Not sure/ Decline Total
(%) (%) (%) (%)
Year
2008 (internet) 57 42 1 100 2010 (internet) 53 45 2 100
Change in % points 2008-2010 -4 +3 +1

GLOBAL VIEWS 2010 TOPLINE DATA FROM U.S. PUBLIC SURVEY
69
Question 145 Question 145: Please select whether you agree or disagree with the following statement: When dealing with international problems, the U.S. should be more willing to make decisions within the United Nations even if this means that the United States will sometimes have to go along with a policy that is not its first choice.
145. US-UN joint decision making
(N=1288)
Agree Disagree Not sure/ Decline Total
(%) (%) (%) (%)
Year
2004 66 29 4 100 2006 (internet) 60 36 4 100 2008 (internet) 52 46 2 100 2010 (internet) 50 48 2 100 Change in % points 2008-2010 -2 +2 0
Question 150 (1-6) Question 150 (1-6): Thinking about specific steps that could be taken to strengthen the UN (United Nations), here are some options that have been proposed. For each one, select if you would favor or oppose this step.
150/1. Giving the UN the power to regulate the international arms trade (N=1296)
Favor Oppose Not sure/ Decline Total (%) (%) (%) (%)
Year
2004 57 36 7 100
2006 (internet) 60 34 6 100
2008 (internet) 57 41 2 100 2010 (internet) 55 44 1 100 Change in % points 2008-2010 -2 +3 -1
150/2. Having a standing UN peacekeeping force selected, trained and commanded by the United Nations (N=1296)
Favor Oppose Not sure/ Decline Total (%) (%) (%) (%)
Year
2004 74 20 6 100
2006 (internet) 72 24 5 100

GLOBAL VIEWS 2010 TOPLINE DATA FROM U.S. PUBLIC SURVEY
70
2008 (internet) 70 29 1 100 2010 (internet) 64 35 1 100 Change in % points 2008-2010 -6 +6 0
150/3. Giving the UN the power to fund its activities by imposing a small tax on such things as the international sale of arms or oil (N=1296)
Favor Oppose Not sure/ Decline Total (%) (%) (%) (%)
Year
2002 (telephone) 51 42 7 100
2004 (internet) 49 45 6 100
2006 (internet) 45 50 5 100
2008 (internet) 46 51 3 100 2010 (internet) 44 54 2 100 Change in % points 2008-2010 -2 +3 -1
150/4. Giving the UN the authority to go into countries in order to investigate violations of human rights
(N=1296) Favor Oppose Not sure/ Decline Total
(%) (%) (%) (%)
Year
2006 (internet) 75 22 3 100
2008 (internet) 73 26 1 100 2010 (internet) 72 26 1 100 Change in % points 2008-2010 -1 0 0
150/5. Creating an international marshals service that could arrest leaders responsible for genocide
(N=1296) Favor Oppose Not sure/ Decline Total
(%) (%) (%) (%)
Year
2006 (internet) 75 21 4 100
2008 (internet) 71 27 2 100 2010 (internet) 73 26 1 100 Change in % points 2008-2010 +2 -1 -1
150/6. Having a UN agency control access to all nuclear fuel in the world to ensure that none is used for weapons production
(N=1296) Favor Oppose Not sure/ Decline Total
(%) (%) (%) (%)
Year
2008 (internet) 63 35 2 100

GLOBAL VIEWS 2010 TOPLINE DATA FROM U.S. PUBLIC SURVEY
71
2010 (internet) 64 35 2 100 Change in % points 2008-2010 +1 0 0
Question 155 Question 155: The World Trade Organization was established to rule on disputes over trade treaties. If another country files a complaint with the World Trade Organization and it rules against the U.S., as a general rule, should the U.S. comply with that decision or not?
155. World Trade Organization Disputes (N=1373)
Should comply
Should not comply
Depends (vol.)
Not sure/ Decline Total
(%) (%) (%) (%) (%)
Year
2002 (telephone) 64 24 3 9 100
2004 (internet) 69 24 n/a 6 100
2006 (internet) 73 22 3 1 100
2008 (internet) 72 25 n/a 3 100 2010 (internet) 72 26 n/a 3 100 Change in % points 2008-2010 0 +1 0 0
Question 160 (1-18) Question 160 (1-18): Here is a list of countries. Thinking about the role each of these countries plays in the world, how important is each country to the United States? 160/1. Iraq (new) (N=1345)
Very important Somewhat important
Not very important
Not at all important
Not sure/ Decline
Total
Year (%) (%) (%) (%) (%) (%)
2010 (internet) 26 37 26 8 2 100
160/2. Germany (N=1377)
Very important Somewhat important
Not very important
Not at all important
Not sure/ Decline
Total
Year (%) (%) (%) (%) (%) (%)
2008 (internet) 29 47 17 4 3 100
2010 (internet) 27 50 18 4 2 100 Change in % points 2008-2010 -2 +3 +1 0 -1

GLOBAL VIEWS 2010 TOPLINE DATA FROM U.S. PUBLIC SURVEY
72
160/3. Japan (N=2511)
Very important Somewhat important
Not very important
Not at all important
Not sure/ Decline
Total
Year (%) (%) (%) (%) (%) (%)
2008 (internet) 45 40 9 4 3 100
2010 (internet) 40 46 9 3 2 100 Change in % points 2008-2010 -5 +6 0 -1 -1
160/4. Mexico (N=1399)
Very important Somewhat important
Not very important
Not at all important
Not sure/ Decline
Total
Year (%) (%) (%) (%) (%) (%)
2008 (internet) 37 39 15 6 2 100
2010 (internet) 31 41 19 8 2 100 Change in % points 2008-2010 -6 +2 +4 +2 0
160/5. Israel (N=1327)
Very important Somewhat important
Not very important
Not at all important
Not sure/ Decline
Total
Year (%) (%) (%) (%) (%) (%)
2008 (internet) 40 37 16 5 3 100
2010 (internet) 33 41 17 7 2 100 Change in % points 2008-2010 -7 +4 +1 +2 -1
160/6. Canada (N=1388)
Very important Somewhat important
Not very important
Not at all important
Not sure/ Decline
Total
Year (%) (%) (%) (%) (%) (%)
2008 (internet) 53 29 12 3 2 100
2010 (internet) 50 34 11 4 1 100 Change in % points 2008-2010 -3 +5 -1 +1 -1
160/7. Brazil (N=2511)
Very important Somewhat important
Not very important
Not at all important
Not sure/ Decline
Total

GLOBAL VIEWS 2010 TOPLINE DATA FROM U.S. PUBLIC SURVEY
73
Year (%) (%) (%) (%) (%) (%)
2008 (internet) 14 45 30 7 3 100
2010 (internet) 10 44 35 9 2 100 Change in % points 2008-2010 -4 -1 +5 +2 -1
160/8. Russia (N=2511)
Very important Somewhat important
Not very important
Not at all important
Not sure/ Decline
Total
Year (%) (%) (%) (%) (%) (%)
2008 (internet) 34 42 17 4 3 100
2010 (internet) 26 48 19 5 2 100 Change in % points 2008-2010 -8 +6 +2 +1 -1
160/9. Afghanistan (N=1428)
Very important Somewhat important
Not very important
Not at all important
Not sure/ Decline
Total
Year (%) (%) (%) (%) (%) (%)
2008 (internet) 25 42 22 9 3 100
2010 (internet) 21 39 27 12 1 100 Change in % points 2008-2010 -4 -3 +5 +3 -2
160/10. Great Britain (N=2511)
Very important Somewhat important
Not very important
Not at all important
Not sure/ Decline
Total
Year (%) (%) (%) (%) (%) (%)
2008 (internet) 60 26 8 4 3 100
2010 (internet) 52 34 10 3 2 100 Change in % points 2008-2010 -8 +8 +2 -1 -1
160/11. Saudi Arabia (N=1366)
Very important Somewhat important
Not very important
Not at all important
Not sure/ Decline
Total
Year (%) (%) (%) (%) (%) (%)
2008 (internet) 44 37 12 5 3 100
2010 (internet) 30 44 18 6 3 100

GLOBAL VIEWS 2010 TOPLINE DATA FROM U.S. PUBLIC SURVEY
74
Change in % points 2008-2010 -14 +7 +6 +1 0
160/12. China (N=2511)
Very important Somewhat important
Not very important
Not at all important
Not sure/ Decline
Total
Year (%) (%) (%) (%) (%) (%)
2008 (internet) 52 33 8 4 3 100
2010 (internet) 54 33 7 4 2 100 Change in % points 2008-2010 +2 0 -1 0 -1
160/13. India (N=2511)
Very important Somewhat important
Not very important
Not at all important
Not sure/ Decline
Total
Year (%) (%) (%) (%) (%) (%)
2008 (internet) 25 45 21 6 4 100
2010 (internet) 18 50 25 6 2 100 Change in % points 2008-2010 -7 +5 +4 0 -2
160/14. Iran (N=1379)
Very important Somewhat important
Not very important
Not at all important
Not sure/ Decline
Total
Year (%) (%) (%) (%) (%) (%)
2008 (internet) 32 39 20 7 3 100
2010 (internet) 25 34 26 12 2 100 Change in % points 2008-2010 -7 -5 +6 +5 -1
160/15. Pakistan (N=1393)
Very important Somewhat important
Not very important
Not at all important
Not sure/ Decline
Total
Year (%) (%) (%) (%) (%) (%)
2008 (internet) 30 41 22 5 3 100
2010 (internet) 19 40 29 10 2 100 Change in % points 2008-2010 -11 -1 +7 +5 -1

GLOBAL VIEWS 2010 TOPLINE DATA FROM U.S. PUBLIC SURVEY
75
160/16. Nigeria (new) (N=1330)
Very important Somewhat important
Not very important
Not at all important
Not sure/ Decline
Total
Year (%) (%) (%) (%) (%) (%)
2010 (internet) 6 29 45 17 3 100
160/17. Turkey (new) (N=1334)
Very important Somewhat important
Not very important
Not at all important
Not sure/ Decline
Total
Year (%) (%) (%) (%) (%) (%)
2010 (internet) 10 42 36 10 3 100
160/18. South Korea (new) (N=2511)
Very important Somewhat important
Not very important
Not at all important
Not sure/ Decline
Total
Year (%) (%) (%) (%) (%) (%)
2010 (internet) 21 46 24 7 2 100
Summary of 160: Importance of countries to the U.S. - 2010 data only Ranked by very important
Very important
Somewhat important
Not very important
Not at all important
Not sure/ Decline
Total
(%) (%) (%) (%) (%) (%)
160/12. China 54 33 7 4 2 100
160/10. Great Britain 52 34 10 3 2 100
160/6. Canada 50 34 11 4 1 100
160/3. Japan 40 46 9 3 2 100
160/5. Israel 33 41 17 7 2 100
160/4. Mexico 31 41 19 8 2 100
160/11. Saudi Arabia 30 44 18 6 3 100
160/2. Germany 27 50 18 4 2 100
160/1. Iraq 26 37 26 8 2 100
160/8. Russia 26 48 19 5 2 100
160/14. Iran 25 34 26 12 2 100
160/9. Afghanistan 21 39 27 12 1 100
160/18. South Korea 21 46 24 7 2 100
160/15. Pakistan 19 40 29 10 2 100

GLOBAL VIEWS 2010 TOPLINE DATA FROM U.S. PUBLIC SURVEY
76
160/13. India 18 50 25 6 2 100
160/7. Brazil 10 44 35 9 2 100
160/17. Turkey 10 42 36 10 3 100
160/16. Nigeria 6 29 45 17 3 100 Question 165 (1-3) Question 165 (1-3) Do you favor or oppose engaging in trade with the following countries?
165/1. Cuba (N=1302) Year Favor Oppose Not sure/ Decline Total (%) (%) (%) (%)
2008 (internet) 44 53 2 100
2010 (internet) 43 54 3 100
Change in % points 2008-2010 -1 +1 +1
165/2. Iran (N=1302) Year Favor Oppose Not sure/ Decline Total (%) (%) (%) (%)
2008 (internet) 21 75 4 100
2010 (internet) 20 77 3 100
Change in % points 2008-2010 -1 +2 -1
165/3. North Korea (N=1302) Year Favor Oppose Not sure/ Decline Total (%) (%) (%) (%)
2008 (internet) 25 72 3 100
2010 (internet) 22 75 3 100
Change in % points 2008-2010 -3 +3 0
Question 170 Question 170: Thinking about what will happen in the next 50 years, do you believe that:
170. U.S. power in 50 years
(N=1319)
The United States will continue to be the
world’s leading power
Another nation will become as powerful as
the United States
The United States will be surpassed in power
by another nation Not sure/ Decline Total

GLOBAL VIEWS 2010 TOPLINE DATA FROM U.S. PUBLIC SURVEY
77
(%) (%) (%) (%) (%)
Year
2006 (internet) 40 39 16 5 100 2008 (internet) 35 43 22 1 100 2010 (internet) 33 40 26 1 100 Change in % points 2008-2010 -2 -3 +4 0
Question 172 Question 172: As rising countries like Turkey and Brazil become more independent from the U.S. in the conduct of their foreign policy, do you think this is:
172. Rising countries like Turkey and Brazil conducting more independent foreign policy (new)
(N=1315)
Mostly good because then they do not rely
on the U.S. so much
Mostly bad because then they are more likely to do things the U.S.
does not supportNot sure/ Decline Total
(%) (%) (%) (%)
Year
2010 (internet) 69 28 3 100
Question 173 Question 173: Do you think the U.S. should or should not put greater pressure on countries in the Middle East, like Saudi Arabia and Egypt, to become more democratic?
173. Democratization in the Middle East
(N=1340)
Should Should not Not sure/ Decline Total
(%) (%) (%) (%)
Year
2003* 41 53 6 100
2004 35 57 8 100 2010 (internet) 38 59 4 100 Change in % points 2004-2010 +3 +2 -4
* Data is from a PIPA/Knowledge Networks survey asked in November 2003 Question 174 Question 174: Suppose there is a Muslim country that is not democratic and if it were democratic, the people would probably elect an Islamic fundamentalist leader. Do you think the U.S. should:

GLOBAL VIEWS 2010 TOPLINE DATA FROM U.S. PUBLIC SURVEY
78
174. U.S. position if a Muslim country likely to elect Islamic fundamentalist leader (new)
(N=1258)
Encourage democracy Discourage democracy Not take a position
either way Not sure/ Decline Total
(%) (%) (%) (%) (%)
Year
2010(internet) 25 5 68 3 100
Question 175 (1-7) Question 175 (1-7): As you may know there is currently a debate about whether U.S. government leaders should be ready to meet and talk with leaders of countries and groups with whom the U.S. has hostile or unfriendly relations. Do you think U.S. leaders should or should not be ready to meet and talk with leaders of:
175/1. The Taliban (new) (N=1311) Should be Should not be Not sure/Decline Total
Year (%) (%) (%) (%)
2010(internet) 48 47 5 100
175/2. Iran (N=1311) Should be Should not be Not sure/Decline Total
Year (%) (%) (%) (%)
2008 (internet) 65 30 5 100
2010(internet) 62 33 5 100
Change in % points 2008-2010 -3 +3 0
175/3. Hamas (N=1311) Should be Should not be Not sure/Decline Total
Year (%) (%) (%) (%)
2008 (internet) 53 41 6 100
2010(internet) 48 46 6 100
Change in % points 2008-2010 -5 +5 0
175/4. North Korea (N=1311) Should be Should not be Not sure/Decline Total
Year (%) (%) (%) (%)
2008 (internet) 68 28 5 100
2010(internet) 62 32 6 100

GLOBAL VIEWS 2010 TOPLINE DATA FROM U.S. PUBLIC SURVEY
79
Change in % points 2008-2010 -6 +4 +1
175/5. Cuba (N=1311) Should be Should not be Not sure/Decline Total
Year (%) (%) (%) (%)
2008 (internet) 70 25 5 100
2010(internet) 70 26 5 100
Change in % points 2008-2010 0 +1 0
175/6. Burma (N=1311) Should be Should not be Not sure/Decline Total
Year (%) (%) (%) (%)
2008 (internet) 63 30 7 100
2010(internet) 58 36 7 100
Change in % points 2008-2010 -5 +6 0
175/7. Hezbollah (N=1331) Should be Should not be Not sure/Decline Total
Year (%) (%) (%) (%)
2008 (internet) 51 43 6 100
2010(internet) 47 47 6 100
Change in % points 2008-2010 -4 +4 0
Question 180 Question 180: Which statement comes closest to your position?
180. U.S. as a World Superpower
(N=1334)
As the sole remaining superpower, the U.S. should
continue to be the preeminent world leader in
solving international problems.
The U.S. should do its share in efforts to solve international problems together
with other countries.
The U.S. should withdraw from most
efforts to solve international problems.
Not sure/ Decline Total
Year (%) (%) (%) (%) (%)
2002(telephone) 17 71 9 3 100
2002 (internet) 7 79 14 1 100
2004 (internet) 8 78 10 4 100
2006 (internet) 10 75 12 3 100

GLOBAL VIEWS 2010 TOPLINE DATA FROM U.S. PUBLIC SURVEY
80
2010(internet) 8 71 19 1 100 Change in % points 2006-2010 -2 -4 +7 -2
Question 185 (1-9) Question 185 (1-9): In your opinion, are relations of the U.S. with the following countries improving, worsening or staying about the same?
185/1. China
(N=1250)
Improving Worsening Staying about the
same Not sure/ Decline Total
Year (%) (%) (%) (%) (%)
2006 (internet) 30 17 47 6 100
2010 (internet) 19 29 47 6 100
Change in % points 2006-2010 -11 +12 0 0
185/2. India
(N=1250)
Improving Worsening Staying about the
same Not sure/ Decline Total
Year (%) (%) (%) (%) (%)
2006 (internet) 30 16 48 6 100
2010 (internet) 18 13 63 6 100
Change in % points 2006-2010 -12 -3 +15 0
185/3. Japan
(N=1250)
Improving Worsening Staying about the
same Not sure/ Decline Total
Year (%) (%) (%) (%) (%)
2006 (internet) 30 9 55 6 100
2010 (internet) 18 13 62 6 100
Change in % points 2006-2010 -12 +4 +7 0
185/4. Mexico
(N=1250)
Improving Worsening Staying about the
same Not sure/ Decline Total
Year (%) (%) (%) (%) (%)

GLOBAL VIEWS 2010 TOPLINE DATA FROM U.S. PUBLIC SURVEY
81
2006 (internet) 17 39 38 5 100
2010 (internet) 10 47 38 6 100
Change in % points 2006-2010 -7 +8 0 +1
185/5. South Korea
(N=1250)
Improving Worsening Staying about the
same Not sure/ Decline Total
Year (%) (%) (%) (%) (%)
2006 (internet) 15 25 53 7 100
2010 (internet) 13 23 57 6 100
Change in % points 2006-2010 -2 -2 +4 -1 0
185/6. The European Union as a whole
(N=1250)
Improving Worsening Staying about the
same Not sure/ Decline Total
Year (%) (%) (%) (%) (%)
2006 (internet) 15 25 53 7 100
2010 (internet) 20 18 56 6 100
Change in % points 2006-2010 +5 -7 +3 -1
185/7. Israel (new)
(N=1250)
Improving Worsening Staying about the
same Not sure/ Decline Total
Year (%) (%) (%) (%) (%)
2010 (internet) 12 38 44 6 100
185/8. Russia (new)
(N=1250)
Improving Worsening Staying about the
same Not sure/ Decline Total
Year (%) (%) (%) (%) (%)
2010 (internet) 17 20 57 6 100
185/9. Brazil (new)
(N=1250)

GLOBAL VIEWS 2010 TOPLINE DATA FROM U.S. PUBLIC SURVEY
82
Improving Worsening
Staying about the same
Not sure/ Decline Total
Year (%) (%) (%) (%) (%)
2010 (internet) 15 15 64 7 100
Summary of 185: Relations of U.S. with other countries (Ranked by % worsening)
Summary of 185: Relations of U.S. with Other Countries (Ranked by % worsening)
Worsening Country (%)
Mexico 47
Israel 38
China 29
South Korea 23
Russia 20
The European Union as a Whole 18
Brazil 15
Japan 13
India 13
Question 190 (1-4) Question 190 (1-4): At present, are relations of the U.S. with the following countries: 190/1. India (new) (N=1255)
Very good Pretty good Neutral Pretty bad Very bad
Not sure/
Decline
Total
Year (%) (%) (%) (%) (%) (%) (%)
2010 (internet) 7 40 43 3 2 5 100
190/2. China (new) (N=1255)
Very good Pretty good Neutral Pretty bad Very bad
Not sure/
Decline
Total
Year (%) (%) (%) (%) (%) (%) (%)
2010 (internet) 3 34 42 13 2 5 100
190/3. Russia (new)

GLOBAL VIEWS 2010 TOPLINE DATA FROM U.S. PUBLIC SURVEY
83
(N=1255)
Very good Pretty good Neutral Pretty bad Very bad
Not sure/
Decline
Total
Year (%) (%) (%) (%) (%) (%) (%)
2010 (internet) 3 33 50 7 2 6 100
190/4. Japan (new) (N=1255)
Very good Pretty good Neutral Pretty bad Very bad
Not sure/
Decline
Total
Year (%) (%) (%) (%) (%) (%) (%)
2010 (internet) 15 45 30 3 1 5 100
Summary of 190: Relations of U.S. with other countries (Ranked by % good)
Summary of 190: State of Relations of U.S. with Other Countries (Ranked by % good)
Good (very and pretty good) Country (%)
Japan 60
India 47
China 37
Russia 36
Question 192 (1-2) Question 192 (1-2): Do you favor or oppose having diplomatic relations with the following countries?
192/1. Iran
(N=1253) Yes, favor relations No, oppose relations Not sure/ Decline Total Year (%) (%) (%) (%)
2002 58 38 4 100
2010 (internet) 42 54 4 100
Change in % points 2002-2010 -16 +16 0
192/2. Cuba
(N=1253) Yes, favor relations No, oppose relations Not sure/ Decline Total Year (%) (%) (%) (%)

GLOBAL VIEWS 2010 TOPLINE DATA FROM U.S. PUBLIC SURVEY
84
2002 65 31 4 100
2010 (internet) 57 39 4 100
Change in % points 2002-2010 -8 +8 0
Question 197 Question 197: As you may know, there are five permanent members of the UN Security Council and any one of them can veto any resolution. Some people have proposed that this should be changed so that if a decision was supported by all the other members, no member, not even the United States, could veto the decision. Would you favor or oppose this change?
197. Veto Power UN Security Council
(N=1305)
Strongly Favor
Somewhat Favor
Somewhat Oppose
Strongly Oppose
Not sure/ Decline Total
(%) (%) (%) (%) (%) (%)
Year
2004 15 44 23 13 6 100 2010 (internet) 13 46 22 15 4 100 Change in % points 2004-2010 -2 +2 -1 +2 -2
Question 200 Question 200: Next, we have a question about NATO, the military organization of Europe and the United States. Do you feel we should increase our commitment to NATO, keep our commitment what it is now, decrease our commitment but still remain in NATO, or withdraw from NATO entirely?
200. Commitment to NATO
(N=1331)
Increase
commitment
Keep commitment
same Decrease
commitment Withdraw entirely
Not sure/ Decline Total
(%) (%) (%) (%) (%) (%)
Year
1974 4 50 13 7 26 100
1978 9 58 9 4 20 100
1982 9 58 11 4 18 100
1986 8 62 11 5 14 100
1990 4 56 22 5 13 100
1994 5 56 20 6 13 100
1998 9 59 16 5 11 100
2002 (telephone) 11 65 11 6 7 100

GLOBAL VIEWS 2010 TOPLINE DATA FROM U.S. PUBLIC SURVEY
85
2002 (internet) 16 68 8 3 4 100
2004 (internet) 14 58 14 6 8 100 2010 (internet) 10 66 13 8 4 100 Change in % points 2004-2010 -4 +8 -1 +2 -4
Question 205 (1-4) Question 205 (1-4): Here are some types of foreign aid. Please select whether you favor or oppose them:
205/1. Food and medical assistance to people in needy countries
(N=1292)
Favor Oppose Not sure/ Decline Total
Year (%) (%) (%) (%)
2002(telephone) 84 12 4 100
2002 (internet) 87 13 1 100
2004 (internet) 82 13 4 100 2010 (internet) 74 23 3 100 Change in % points 2004-20010 -8 +10 -1
205/2. Aid that helps needy countries develop their economies
(N=1292)
Favor Oppose Not sure/ Decline Total
Year (%) (%) (%) (%)
2002(telephone) 74 21 5 100
2002 (internet) 74 24 2 100
2004 (internet) 70 25 5 100
2010 (internet) 62 35 3 100
Change in % points 2004-2010 -8 +10 -2
205/3. Aid to help farmers in needy countries become more productive (new) (N=1292)
Favor Oppose Not sure/ Decline Total
Year (%) (%) (%) (%)
2010 (internet) 74 25 2 100
205/4. Aid to increase U.S. influence over counties that are important to U.S. interests (new) (N=1292)

GLOBAL VIEWS 2010 TOPLINE DATA FROM U.S. PUBLIC SURVEY
86
Favor Oppose Not sure/ Decline Total
Year (%) (%) (%) (%)
2010 (internet) 58 39 2 100
Question 210 (1-5) Question 210 (1-5): Do you think economic aid to the following people or nations should be increased, decreased, kept about the same, or stopped altogether?
210/1. Egypt
(N=1275) Increased Decreased Kept the
Same Stopped
Altogether Not sure/ Decline
Total
(%) (%) (%) (%) (%) (%)
Year
1990 5 22 41 18 13 100
1994 3 21 36 23 17 100
1998 5 24 42 17 12 100
2002 7 23 46 15 9 100
2010 (internet) 5 21 53 18 4 100
Change in % points 2002-2010
-2 -2 +7 +3 -5
210/2. Israel
(N=1275) Increased Decreased Kept the
Same Stopped
Altogether Not sure/ Decline
Total
(%) (%) (%) (%) (%) (%)
Year
1990 8 27 38 18 9 100
1994 9 24 38 20 9 100
1998 10 23 42 16 9 100
2002 18 26 37 15 4 100
2010 (internet) 14 19 48 15 3 100
Change in % points 2002-2010
-4 -7 +11 0 -1
210/3. African Countries
(N=1275) Increased Decreased Kept the
Same Stopped
Altogether Not sure/ Decline
Total

GLOBAL VIEWS 2010 TOPLINE DATA FROM U.S. PUBLIC SURVEY
87
(%) (%) (%) (%) (%) (%)
Year
1994 24 17 33 17 9 100
1998 24 16 38 13 9 100
2002 35 13 37 9 6 100
2010 (internet) 24 13 46 14 3 100
Change in % points 2002-2010
-11 0 +9 +5 -3
210/4. Afghanistan
(N=1275) Increased Decreased Kept the
Same Stopped
Altogether Not sure/ Decline
Total
(%) (%) (%) (%) (%) (%)
Year
2002 22 22 29 23 4 100
2010 (internet) 10 22 41 23 4 100
Change in % points 2002-2010
-12 0 +12 0 0
210/5. Pakistan
(N=1275) Increased Decreased Kept the
Same Stopped
Altogether Not sure/ Decline
Total
(%) (%) (%) (%) (%) (%)
Year
2002 12 28 32 23 5 100
2010 (internet) 7 24 42 24 4 100
Change in % points 2002-2010
-5 -4 +10 +1 -1
Question 215 Question 215: Do you think the United States plays a more important and powerful role as a world leader today compared to 10 years ago, a less important role, or about as important a role as a world leader as it did 10 years ago?
215. U.S. Role as world leader
(N=1303) More
important Less
important As
important Not sure/ Decline
Total
(%) (%) (%) (%) (%)

GLOBAL VIEWS 2010 TOPLINE DATA FROM U.S. PUBLIC SURVEY
88
Year
1974 28 38 27 7 100
1978 29 41 24 6 100
1982 27 44 24 5 100
1986 41 26 29 4 100
1990 37 35 24 4 100
1994 47 26 24 3 100
1998 50 19 27 4 100
2002 55 17 25 3 100
2010 (internet) 24 38 37 1 100
Change in % points 2002-2010 -31 +21 +12 -2
Question 217 Question 217: Please select if you agree or disagree with the following statement: The U.S. is playing the role of world policeman more than it should be.
217. U.S. World Policeman more than it should be
(N=1263) Agree Disagree Not sure/ Decline Total (%) (%) (%) (%)
Year
2002 (telephone) 65 34 1 100
2004 (internet) 80 18 3 100
2006 (internet) 76 21 3 100
2008 (internet) 77 23 0 100 2010 (internet) 79 20 1 100 Change in % points 2008-2010 +2 -3 +1
Question 220 (1-7) Question 220 (1-7): Some say that because of the increasing interaction between countries, we need to strengthen international institutions to deal with shared problems. Others say that this would only create bigger, unwieldy bureaucracies. Here are some international institutions. For each one, please tell me if it needs to be strengthened or not.
220/1. The World Trade Organization (or WTO)
(N=1293) Yes, needs to
be strengthened
No, doesn’t need to be
strengthened
Not sure/ Decline
Total
Year (%) (%) (%) (%)

GLOBAL VIEWS 2010 TOPLINE DATA FROM U.S. PUBLIC SURVEY
89
2002 (telephone) 63 30 7 100
2010 (internet) 44 48 8 100
Change in % points 2002-2010 -19 +18 +1
220/2. The International Criminal Court (ICC) (new)
(N=1293) Yes, needs to
be strengthened
No, doesn’t need to be
strengthened
Not sure/ Decline
Total
Year (%) (%) (%) (%)
2010 (internet) 50 42 8 100
220/3. The World Health Organization (WHO)
(N=1293) Yes, needs to
be strengthened
No, doesn’t need to be
strengthened
Not sure/ Decline
Total
Year (%) (%) (%) (%)
2002 (telephone) 80 15 5 100
2010 (internet) 58 35 8 100
Change in % points 2002-2010 -22 +20 +3
220/4. The International Monetary Fund (IMF)
(N=1293) Yes, needs to
be strengthened
No, doesn’t need to be
strengthened
Not sure/ Decline
Total
Year (%) (%) (%) (%)
2002 (telephone) 42 38 20 100
2010 (internet) 34 57 10 100
Change in % points 2002-2010 -8 +19 -10
220/5. The World Bank
(N=1293) Yes, needs to
be strengthened
No, doesn’t need to be
strengthened
Not sure/ Decline
Total
Year (%) (%) (%) (%)
2002 (telephone) 49 39 12 100

GLOBAL VIEWS 2010 TOPLINE DATA FROM U.S. PUBLIC SURVEY
90
2010 (internet) 38 53 9 100
Change in % points 2002-2010 -11 +14 -3
220/6. The International Atomic Energy Agency (IAEA) (new)
(N=1293) Yes, needs to
be strengthened
No, doesn’t need to be
strengthened
Not sure/ Decline
Total
Year (%) (%) (%) (%)
2010 (internet) 51 40 8 100
220/7. The United Nations (UN)
(N=1293) Yes, needs to
be strengthened
No, doesn’t need to be
strengthened
Not sure/ Decline
Total
Year (%) (%) (%) (%)
2002 (telephone) 77 21 2 100
2010 (internet) 54 39 7 100
Change in % points 2002-2010 -23 +18 +5
Question 225 Question 225: Please tell me which of the following statements is closer to your own view:
225. Attitudes Toward the Muslim People
(N=1300) Because Muslim religious, social
and political traditions are incompatible with Western ways, violent conflict between the two
civilizations is inevitable.
Because most Muslims are like people everywhere, we can find
common ground and violent conflict between the civilizations is
not inevitable.
Not sure/ Decline
Total
(%) (%) (%) (%)
Year
2002 27 66 7 100
2010 (internet) 45 51 3 100
Change in % points 2002-2010
+18 -15 -4
Question 230 Question 230: In the Middle East conflict, do you think the United States should:

GLOBAL VIEWS 2010 TOPLINE DATA FROM U.S. PUBLIC SURVEY
91
230. Sides in Middle East Conflict
(N=1288)
Take Israel’s
side
Take the Palestinian’s
side Not take
either side Not sure/ Decline Total
(%) (%) (%) (%) (%)
Year
2002(telephone) 25 1 71 3 100
2002 (internet) 24 3 70 4 100
2004 (internet) 17 3 74 6 100 2010 (internet) 28 3 66 4 100 Change in % points 2004-2010 +11 0 -8 -2 0
Question 231 Question 231: To resolve the Israeli-Palestinian conflict do you think the U.S.:
230. Role of U.S. in resolving Israeli-Palestinian conflict (new)
(N=1289)
Should make greater efforts than it has been
making
Has been doing more than it should
beIs doing about the right
amount Not sure/ Decline Total
(%) (%) (%) (%) (%)
Year
2010 (internet) 20 40 36 5 100
Question 232 Question 232: A highly controversial issue is that Israel has built villages for Israelis, called settlements, in the Palestinian territories in the West Bank. Do you think it is all right for Israel to build settlements in the Palestinian Territories, or do you think it should not?
232. Israel building settlements in the Palestinian territories (new)
(N=1246) All right to build Should not build Not sure/ Decline Total Year (%) (%) (%) (%)
2010 (internet) 31 62 7 100
Question 240 Question 240: The UN Security Council has asked Iran to stop enriching uranium. If Iran continues to enrich uranium do you think the UN Security Council should:

GLOBAL VIEWS 2010 TOPLINE DATA FROM U.S. PUBLIC SURVEY
92
240. UN Security Council action if Iran continues to enrich uranium
(N=1296)
Not pressure Iran to stop enriching uranium
Continue diplomatic efforts to get Iran to stop enriching uranium
Impose economic
sanctions on Iran
Authorize a military strike against Iran’s nuclear
energy facilities Not sure/ Decline Total
(%) (%) (%) (%) (%) (%)
Year
2006 (internet) 3 35 41 18 3 100
2008 (internet) 3 27 48 20 2 100
2010 (internet) 4 26 45 21 4 100 Change in % points 2008-2010 +1 -1 -3 +1 +2
Question 240A Question 240A: The UN Security Council has asked Iran to stop enriching uranium. If Iran continues to enrich uranium do you think the United States, acting on its own, should:
240A. UN Security Council action if Iran continues to enrich uranium (new)
(N=1300)
Not pressure Iran to stop enriching uranium
Continue diplomatic efforts to get Iran to stop enriching uranium
Impose economic
sanctions on Iran
Carry out a military strike against Iran’s nuclear
energy facilities Not sure/ Decline Total
(%) (%) (%) (%) (%) (%)
Year
2010 (internet) 4 33 41 18 4 100
Question 245 Question 245: If Iran were to allow UN inspectors permanent and full access throughout Iran, to make sure it is not developing nuclear weapons, do you think Iran should or should not be allowed to produce nuclear fuel for producing electricity?
245. Iran production of nuclear fuel if it allows in UN inspectors
(N=1300) Should be allowed Should not be allowed Not sure/ Decline Total
(%) (%) (%) (%)
Year
2008 (internet) 56 41 3 100
2010 (internet) 52 45 3 100
Change in % points 2008-2010 -4 +4 0

GLOBAL VIEWS 2010 TOPLINE DATA FROM U.S. PUBLIC SURVEY
93
Question 250 (1-9) Question 250 (1-9): If the U.S. were to conduct a military strike against Iran’s nuclear program, please select how likely each of the following outcomes would be:
250/1-9. Outcomes of U.S. military strike against Iran’s nuclear program (new) (N=1310)
Very likely Somewhat
likely Not very
likely Not at all
likely Not sure/ Decline Total
(%) (%) (%) (%) (%) (%)
250/1. Iran would give up trying to have a nuclear program 8 13 48 28 4 100
250/2. Iran’s nuclear program would be slowed down, but not stopped
28 52 11 5 4 100
250/3. The current Iranian government would lose popular support in Iran 11 31 42 10 6 100
250/4. The Iranian people would rally around their government 34 40 18 4 5 100
250/5. U.S. allies would publicly support the U.S. action 17 42 31 6 4 100
250/6. Muslim people worldwide would become more hostile toward the U.S. 44 38 11 3 5 100
250/7. Iran would retaliate against U.S. targets in neighboring states 40 42 10 4 5 100
250/8. There would be retaliatory terrorist attacks in the U.S. itself 40 41 11 3 5 100
250/9. Other countries in the region would be deterred from developing nuclear weapons 14 38 35 9 5 100
Question 255 Question 255: If diplomatic efforts and economic sanctions fail to stop or slow down Iran’s nuclear program, would you favor or oppose a U.S. military strike against Iran’s nuclear program, taking into account the possible benefits and costs.
255. U.S. military strike if it fails to stop Iran’s nuclear program (new; only asked of those receiving Q250)
(N=1310) Favor a U.S. military strike Oppose a U.S. military strike Not sure/ Decline Total
(%) (%) (%) (%)
Year
2010 (internet) 47 49 5 100
Question 260 Question 260: In your view, if Iran acquires a nuclear weapon can the United States contain it in much the same way that it contained the Soviet Union?
260. U.S. containing Iran if it acquires a nuclear weapon (new)

GLOBAL VIEWS 2010 TOPLINE DATA FROM U.S. PUBLIC SURVEY
94
(N=1322)
Yes, a nuclear Iran can be contained
No, a nuclear Iran cannot be contained Not sure/ Decline Total
(%) (%) (%) (%)
Year
2010 (internet) 45 49 6 100
Question 265 Question 265: Suppose Israel were to bomb Iran’s nuclear facilities, Iran were to retaliate against Israel and the two were to go to war. Do you think the U.S. should or should not bring its military forces into the war on the side of Israel and against Iran?
265. U.S. military role in a possible war between Israel and Iran (new)
(N=1257) Yes, it should No, it shouldn’t Not sure/ Decline Total
(%) (%) (%) (%)
Year
2010 (internet) 38 56 6 100
Question 270 Question 270: In your opinion, should the United States withdraw most of its combat troops from Afghanistan right away, should the U.S. bring most of its troops home within the next two years, or should it leave combat troops in Afghanistan for as long as it takes to establish a more stable and secure Afghanistan?
270. U.S. action with respect to combat troops in Afghanistan (new)
(N=1304)
Should withdraw most of its combat troops right
away
Should withdraw most of its combat troops within
the next two years
Should leave combat troops in Afghanistan for as long as it
takes to establish a more stable and secure Afghanistan
Not sure/
Decline Total (%) (%) (%) (%) (%)
Year
2010 (internet) 23 44 31 3 100
Question 271 Question 271: Do you think that most people in Afghanistan want NATO forces to remain for now, or do you think most want the NATO forces to leave now?
271. Do people in Afghanistan want NATO forces to stay or leave (new)
(N=1269)

GLOBAL VIEWS 2010 TOPLINE DATA FROM U.S. PUBLIC SURVEY
95
Most people in Afghanistan want NATO forces to remain for now
Most people in Afghanistan want NATO forces to leave now Not sure/ Decline Total
(%) (%) (%) (%)
Year
2010 (internet) 47 47 6 100
Question 272 Question 272: Do you think eliminating the threat from terrorists operating from Afghanistan is a worthwhile goal for American troops to fight and possibly die for or not?
272. Is eliminating terrorist threats from Afghanistan a worthwhile goal for U.S. troops (new)
(N=1277) It is a worthwhile goal It is not a worthwhile goal Not sure/ Decline Total
(%) (%) (%) (%)
Year
2010 (internet) 59 37 4 100
Question 273 Question 273: How well is the U.S. military effort in Afghanistan going?
273. State of U.S. military effort in Afghanistan (new)
(N=1273)
Very well Fairly well Not too well Not at all
well Not sure/ Decline Total
Year (%) (%) (%) (%) (%) (%)
2010 (internet) 6 37 43 10 4 100
Question 274 Question 274: Overall, do you think the ability of terrorists to launch another major attack on the U.S. is greater, the same, or less than it was at the time of the September 11th terrorist attacks?
274. Ability of terrorists to launch another major attach on the U.S. (new)
(N=1293) Greater The same Less Not sure/ Decline Total
(%) (%) (%) (%) (%)
Year
2010 (internet) 26 50 23 1 100

GLOBAL VIEWS 2010 TOPLINE DATA FROM U.S. PUBLIC SURVEY
96
Question 275 Question 275: Suppose the U.S. locates high-ranking members of terrorist groups operating in Pakistan that threaten the U.S. Do you think the U.S. should or should not take military action to capture or kill these terrorists even if the government of Pakistan does not give the U.S. permission to do so?
275. U.S. action against terrorist groups in Pakistan without government permission (N=1334)
Should Should not Not sure/ Decline Total (%) (%) (%) (%)
Year
2008 (internet) 68 29 3 100
2010 (internet) 71 25 5 100
Change in % points 2008-2010 +3 -4 +2 0
Question 276 (1-8) Question 276 (1-8): In order to combat international terrorism, please say whether you favor or oppose each of the following measures:
276/1. U.S. air strikes against terrorist training camps and other facilities (N=1287) Favor Oppose Not sure/ Decline Total (%) (%) (%) (%)
Year
1998 74 19 7 100
2002 (telephone) 87 10 3 100
2002 (internet) 90 7 2 100
2004 (internet) 83 13 4 100
2008 (internet) 79 19 2 100
2010 (internet) 81 18 2 100 Change in % points 2008-2010 +2 -1 0 0
276/2. Attacks by U.S. ground troops against terrorist training camps and other facilities (N=1287) Favor Oppose Not sure/ Decline Total (%) (%) (%) (%)
Year
1998 57 34 9 100
2002 (telephone) 84 11 5 100
2002 (internet) 82 15 3 100
2004 (internet) 76 20 4 100
2008 (internet) 72 26 2 100

GLOBAL VIEWS 2010 TOPLINE DATA FROM U.S. PUBLIC SURVEY
97
2010 (internet) 73 25 1 100 Change in % points 2008-2010 +1 -1 -1 0
276/3. Assassination of individual terrorist leaders (N=1287) Favor Oppose Not sure/ Decline Total (%) (%) (%) (%)
Year
1998 54 35 11 100
2002 (telephone) 66 26 8 100
2002 (internet) 77 21 3
2004 (internet) 68 27 5 100
2008 (internet) 68 29 2 100
2010 (internet) 73 25 2 100 Change in % points 2008-2010 +5 -4 0 0
276/4. Trial of suspected terrorists in the International Criminal Court (N=1287) Favor Oppose Not sure/ Decline Total (%) (%) (%) (%)
Year
1998 84 10 6 100
2002 (telephone) 83 14 3 100
2002 (internet) 82 15 2 100
2004 (internet) 82 13 4 100
2008 (internet) 79 19 2 100
2010 (internet) 78 21 2 100 Change in % points 2008-2010 -1 +2 0 0
276/5. Helping poor countries develop their economies (N=1287) Favor Oppose Not sure/ Decline Total (%) (%) (%) (%)
Year
2002 (telephone) 78 19 3 100
2004 (internet) 64 32 4 100
2008 (internet) 69 30 2 100
2010 (internet) 69 29 2 100 Change in % points 2008-2010 0 -1 0 0

GLOBAL VIEWS 2010 TOPLINE DATA FROM U.S. PUBLIC SURVEY
98
276/6. Working through the UN to strengthen international laws against terrorism and to make sure UN members enforce them (N=1287) Favor Oppose Not sure/ Decline Total (%) (%) (%) (%)
Year
2002 (telephone) 88 10 2 100
2004 (internet) 87 9 4 100
2008 (internet) 84 15 1 100
2010 (internet) 82 16 2 100 Change in % points 2008-2010 -2 +1 +1 0
276/7. Making a major effort to resolve the Israeli-Palestinian conflict (new) (N=1287) Favor Oppose Not sure/ Decline Total (%) (%) (%) (%)
Year
2010 (internet) 58 39 2 100
276/8. Using torture to extract information from suspected terrorists (N=1287) Favor Oppose Not sure/ Decline Total (%) (%) (%) (%)
Year
2004 29 66 5 100
2008 (internet) 36 61 3 100
2010 (internet) 42 56 3 100 Change in % points 2008-2010 +6 -5 0 0
Summary of 276: Measures to Fight Terrorism (Ranked by % Favor)
276: Measures to Fight Terrorism (2010 Data Only) (N=1287) Favor Oppose Not sure/
Decline Total
Measure (%) (%) (%) (%) 276/6. Working through the UN to strengthen international laws against terrorism 82 16 2 100
276/1. U.S. air strikes against terrorist training camps and other facilities 81 18 2 100
276/4. Trial of suspected terrorists in the ICC 78 21 2 100

GLOBAL VIEWS 2010 TOPLINE DATA FROM U.S. PUBLIC SURVEY
99
276/2. Attacks by U.S. ground troops against terrorist training camps and other facilities 73 25 1 100
276/3. Assassination of individual terrorist leaders 73 25 2 100
276/5. Helping poor countries develop their economies 69 29 2 100 276/7. Making a major effort to resolve the Israeli-Palestinian conflict (new) 58 39 2 100
276/8. Using torture to extract information from suspected terrorists 42 56 3 100
Question 280 Question 280: On the whole, do you favor or oppose our government selling military equipment to other nations?
280. Attitude Toward Selling Military Equipment
(N=1258) Favor Oppose Not sure/ Decline Total (%) (%) (%) (%)
Year
1974 35 53 12 100
1978 33 54 13 100
1982 39 53 8 100
1986 37 53 10 100
1990 32 59 9 100
1994 15 78 7 100
1998 14 79 7 100
2002 18 77 5 100
2010 (internet) 22 76 2 100
Change in % points 2002-2010 +4 -1 -3 0
Question 285 Question 285: Here are some positions about the possible use of nuclear weapons by the United States. Which one comes closest to yours?
285. U.S. Use of Nuclear Weapons
(N=1256) The U.S. should
never use nuclear weapons under any
circumstances.
The U.S. should only use nuclear weapons
in response to a nuclear attack.
In certain circumstances, the U.S. should use nuclear
weapons even if it has not suffered a nuclear attack.
Not sure/ Decline Total
(%) (%) (%) (%) (%)
Year
2002 (telephone) 22 55 21 2 100

GLOBAL VIEWS 2010 TOPLINE DATA FROM U.S. PUBLIC SURVEY
100
2004 (internet) 22 57 19 3 100 2006 (internet) 20 58 20 2 100 2008 (internet) 17 57 24 2 100
2010 (internet) 20 57 20 3 100 Change in % points 2008-2010 +3 0 -4 +1 0
Question 290 Question 290: Some people say that the UN Security Council has the responsibility to authorize the use of military force to protect people from severe human rights violations such as genocide, even against the will of their own government. Others say that the UN Security Council does not have such a responsibility. Do you think that the UN Security Council does or does not have this responsibility?
290. UN Security Council responsibility to authorize use of military force to prevent genocide
(N=1294) Has this responsibility Does not have responsibility Not sure/ Decline Total
(%) (%) (%) (%)
Year
2006 (internet) 72 22 4 100
2008 (internet) 67 30 4 100
2010 (internet) 66 28 6 100
Change in % points 2008-2010 -1 -2 +2 0
Question 295 Question 295: There is a controversy over what the countries of the world, including the U.S., should do about the problem of climate change. Here are three statements. Please tell me which statement comes closest to your own point of view.
295. Steps regarding climate change (new)*
(N=1275)
Until we are sure that climate change is really a problem, we should not take any steps that would have economic
costs
The problem of climate change should be
addressed, but its effects will be gradual, so we can
deal with the problem gradually by taking steps
that are low in cost
Climate change is a serious and pressing problem. We should
begin taking steps now even if this involves
significant costs Not sure/ Decline Total
(%) (%) (%) (%) (%)
Year
2006 (internet) “global warming” 17 37 43 3 100
2010 (internet) 26 42 29 3 100

GLOBAL VIEWS 2010 TOPLINE DATA FROM U.S. PUBLIC SURVEY
101
*The “global warming” vs. climate change wording was tested in 2008 in the threats battery. Those seeing global warming as a
critical threat were 5% higher (at 44%) than those seeing climate change as a critical threat (at 39%)
Question 300 Question 300: If the less-developed countries make a commitment to limit their greenhouse gas emissions, do you think the developed countries should provide substantial aid to help them?
300. Less-developed countries commitment to limiting greenhouse gas emissions
(N=1317)
Yes, should help less-developed countries
(%)
No, should not provide aid (%)
Not sure/ Decline
(%) Total (%)
Year
2006 (internet) 64 32 4 100
2010 (internet) 56 39 4 100 Change in % points 2006-2010 -8 +7 0 0
Question 310 Question 310: To deal with the problem of climate change, do you think your government is doing:
310. Government action on climate change (new)
(N=1317) Too much Not enough About the right amount Not sure/ Decline Total
(%) (%) (%) (%) (%)
Year
2010 (internet) 20 48 30 2 100
Question 320 (1-4) Question 320 (1-4): Thinking about how to address America’s dependence on foreign energy sources, please indicate whether you favor or oppose each of the following:
320/1-4. Addressing America’s dependence on foreign energy sources (new)
(N=1270) Strongly
favor Somewhat
favor Somewhat
oppose Strongly oppose
Not sure/ Decline Total
(%) (%) (%) (%) (%) (%)
320/1. Creating tax incentives to encourage the development and use of alternative energy sources, such as solar or wind power
47 33 11 6 3 100
320/2. Requiring auto-makers to increase fuel efficiency, even if this means the price of cars would go up
31 34 21 10 4 100

GLOBAL VIEWS 2010 TOPLINE DATA FROM U.S. PUBLIC SURVEY
102
320/3. Building new nuclear power plants to reduce reliance on oil and coal 31 38 19 8 4 100
320/4. Raising taxes on fuels such as coal and oil to encourage individuals and businesses to use less 10 23 34 30 3 100
Question 321 (1-4) Question 321 (1-4): Thinking about how to address climate change, please indicate whether you favor or oppose each of the following:
321/1-4. Addressing climate change (new)
(N=1326) Strongly
favor Somewhat
favor Somewhat
oppose Strongly oppose
Not sure/ Decline Total
(%) (%) (%) (%) (%) (%)
321/1. Creating tax incentives to encourage the development and use of alternative energy sources, such as solar or wind power
47 33 9 8 3 100
321/2. Requiring auto-makers to increase fuel efficiency, even if this means the price of cars would go up
28 39 18 12 3 100
321/3. Building new nuclear power plants to reduce reliance on oil and coal 25 40 22 10 3 100
321/4. Raising taxes on fuels such as coal and oil to encourage individuals and businesses to use less 12 23 32 31 3 100
Question 323 Question 323: With which one of these statements about the environment and the economy do you most agree:
323. Protection of the environment vs. economic growth (new)
(N=1240)
Protection of the environment should be given priority, even at
the risk of curbing economic growth
Economic growth should be given priority, even if the
environment suffers to some extent Not sure/ Decline Total
(%) (%) (%) (%)
Year
2010 (internet) 56 38 5 100
Question 325 Question 325: How much do you support or oppose expanding offshore drilling for oil and natural gas off the U.S. coast
325. Support for offshore drilling off the U.S. coast (new)
(N=1337) Strongly
favor Somewhat
favor Somewhat
oppose Strongly oppose
Not sure/ Decline Total

GLOBAL VIEWS 2010 TOPLINE DATA FROM U.S. PUBLIC SURVEY
103
Year (%) (%) (%) (%) (%) (%)
2010 (internet) 22 36 22 18 2 100
Question 330 Question 330: When it comes to economic development do you think the way that the Chinese government manages its economy and its political system is more of an advantage or more of a disadvantage for China?
330. Chinese political and economic governance
(N=1379)
More of an advantage
(%)
More of a disadvantage
(%)
No impact either way
(%)
Not sure/ Decline
(%) Total (%)
Year
2006 (internet) 49 41 5 4 100
2010 (internet) 32 25 34 9 100
Change in % points 2006-2010 -17 -16 +29 +5
Question 335 Question 335: Do you think that it is more likely that someday China’s economy will grow to be as large as the U.S. economy or that the U.S. economy will always stay larger than China’s?
335. China’s economy to grow as large as U.S. economy
(N=1285)
China's economy will grow as large as the
U.S. economy
The U.S. economy will always stay
larger than China's Not sure/ Decline Total
(%) (%) (%) (%)
Year
2006 (internet) 60 35 4 100 2008 (internet) 76 23 2 100
2010 (internet) 75 22 3 100
Change in % points 2008-2010 -1 -1 +1
Question 340 Question 340: If China’s economy were to grow to be as large as the U.S. economy, do you think that would be mostly positive, mostly negative, or equally positive and negative?
340. Effect of China’s economic growth
(N=1345)

GLOBAL VIEWS 2010 TOPLINE DATA FROM U.S. PUBLIC SURVEY
104
Mostly positive Mostly negative Equally positive
and negative Not sure/ Decline Total
(%) (%) (%) (%) (%)
Year
2006 (internet) 9 33 54 4 100 2008 (internet) 6 42 51 1 100
2010 (internet) 8 38 50 4 100
Change in % points 2008-2010 +2 -4 -1 +3
Question 345 Question 345: Do you think the U.S. loans more money to China or that China loans more money to the U.S.?
345. U.S.-China loans of money
(N=1280)
U.S. loans
more to China China loans more to U.S.
They loan each other about the same amount of
money Not sure/ Decline Total
(%) (%) (%) (%) (%)
Year
2006 (internet) 42 24 25 10 100 2008 (internet) 34 40 20 6 100
2010 (internet) 13 67 15 6 100
Change in % points 2008-2010 -21 +27 -5 0
Question 350 Question 350: In dealing with the rise of China’s power, do you think the U.S. should:
350. U.S. dealing with China’s power
(N=1302)
Undertake friendly cooperation and engagement with China
Actively work to limit the growth of China’s power Not sure/Decline Total
(%) (%) (%) (%)
Year
2006 (internet) 65 29 7 100 2008 (internet) 64 33 3 100
2010 (internet) 68 28 4 100
Change in % points 2008-2010 +4 -5 +1
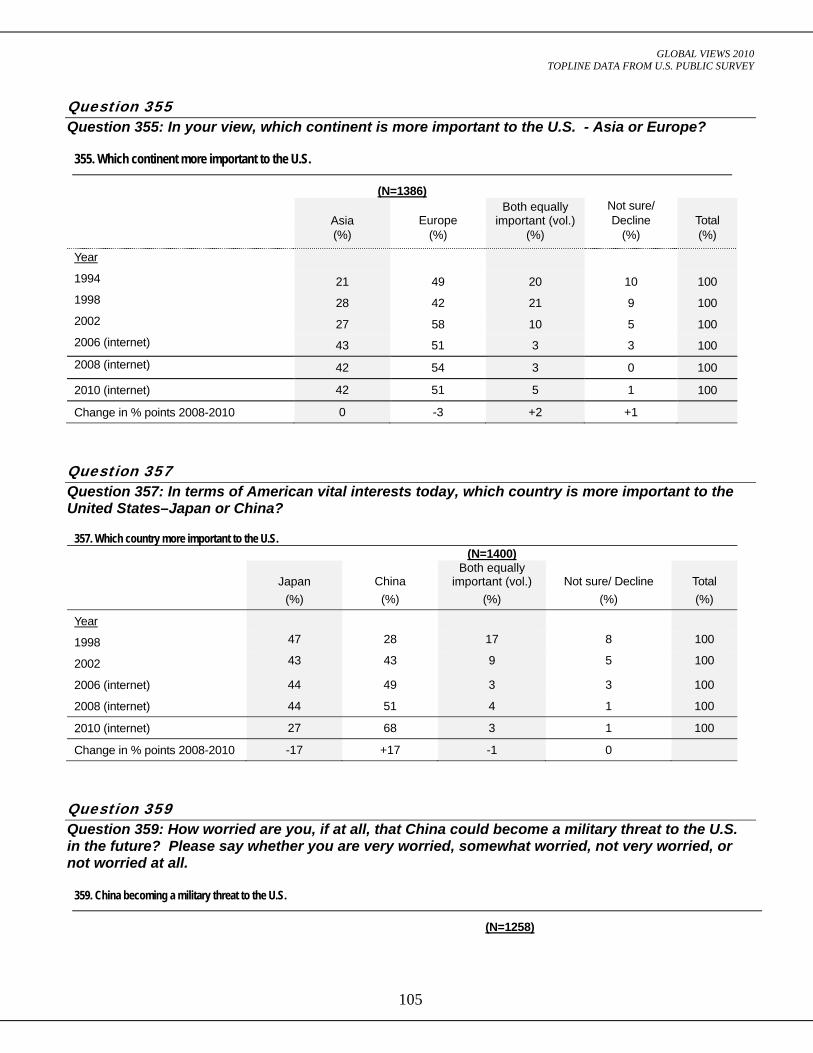
GLOBAL VIEWS 2010 TOPLINE DATA FROM U.S. PUBLIC SURVEY
105
Question 355 Question 355: In your view, which continent is more important to the U.S. - Asia or Europe?
355. Which continent more important to the U.S.
(N=1386)
Asia Europe Both equally
important (vol.) Not sure/ Decline Total
(%) (%) (%) (%) (%)
Year
1994 21 49 20 10 100 1998 28 42 21 9 100 2002 27 58 10 5 100 2006 (internet) 43 51 3 3 100 2008 (internet) 42 54 3 0 100
2010 (internet) 42 51 5 1 100
Change in % points 2008-2010 0 -3 +2 +1
Question 357 Question 357: In terms of American vital interests today, which country is more important to the United States–Japan or China?
357. Which country more important to the U.S. (N=1400)
Japan China Both equally
important (vol.) Not sure/ Decline Total (%) (%) (%) (%) (%)
Year
1998 47 28 17 8 100
2002 43 43 9 5 100
2006 (internet) 44 49 3 3 100
2008 (internet) 44 51 4 1 100
2010 (internet) 27 68 3 1 100
Change in % points 2008-2010 -17 +17 -1 0
Question 359 Question 359: How worried are you, if at all, that China could become a military threat to the U.S. in the future? Please say whether you are very worried, somewhat worried, not very worried, or not worried at all.
359. China becoming a military threat to the U.S.
(N=1258)

GLOBAL VIEWS 2010 TOPLINE DATA FROM U.S. PUBLIC SURVEY
106
Very worried
Somewhat worried
Not very worried
Not worried at all
Not sure/ Decline Total
Year (%) (%) (%) (%) (%) (%)
2008 (internet) 25 46 26 4 0 100
2010 (internet) 17 48 27 6 2 100
Change in % points 2008-2010 -8 +2 +1 +2 +2
Question 360 (1-6) Question 360 (1-6): How concerned are you about the following issues in U.S.-China relations:
360/1-6. Issues in U.S.-China relations (new)
(N=1230) Very
concerned Somewhat concerned
Not very concerned
Not at all concerned
Not sure/ Decline Total
(%) (%) (%) (%) (%) (%)
360/1. China’s unwillingness to commit to limit its greenhouse gas emissions 28 40 17 10 6 100
360/2. Chinese government limiting its people’s access to the Internet
22 36 27 10 5 100
360/3. China’s keeping its currency cheap to make its exports more competitive 23 48 17 6 6 100
360/4. China’s repression of pro-democracy dissidents 24 42 20 7 7 100
360/5. China’s treatment of Tibet 21 42 23 8 6 100 360/6. U.S. weapons sales to Taiwan, despite China’s objections 17 41 26 10 6 100
Question 361 Question 361: The United States currently has about 33,000 troops in Japan, including Okinawa. In your view, is that too many, too few, or about right?
361. Level of troops in Japan
(N=1317) Too many Too few About Right Not sure/ Decline Total
(%) (%) (%) (%) (%)
Year
2008 (internet) 55 4 39 2 100
2010 (internet) 44 5 47 4 100
Change in % points 2008-2010 -11 +1 +8 +2
Question 363 Question 363: The United States currently has about 30,000 troops in South Korea. In your view, is that:

GLOBAL VIEWS 2010 TOPLINE DATA FROM U.S. PUBLIC SURVEY
107
*Data for 2004 reflects opinions about 37,000 U.S. troops in South Korea at the time
363. U.S. troop levels in South Korea
(N=1307) Too Many Too Few About Right Not sure/ Decline Total (%) (%) (%) (%) (%)
Year
2004* 52 7 34 6 100 2006 (internet) 42 10 42 6 100
2010 (internet) 34 12 50 4 100
Change in % points 2006-2010 -8 +2 +8 -2
Question 364 Question 364: If North and South Korea were to reunify as a single nation, should the United States:
364. Maintain or withdraw U.S. troops if North Korea and South Korea reunify (new)
(N=1307)
Maintain its alliance with Korea and keep
its ground troops there, so as to
counterbalance China
Maintain its alliance with Korea but
remove its ground troops
End its alliance with Korea and remove its ground troops
Not sure/ Decline Total
(%) (%) (%) (%) (%)
Year
2010 (internet) 43 37 14 6 100
Question 365 Question 365: If North Korea were to attack South Korea, would you favor or oppose the U.S. contributing military forces, together with other countries, to a UN sponsored effort to reverse the aggression?
365. Use of U.S. troops if North Korea attacks South Korea
(N=1322) Favor Oppose Not sure/ Decline Total (%) (%) (%) (%)
Year
2002 (telephone) 57 35 8 100
2004 (internet) 64 31 5 100 2006 (internet) 65 30 5 100 2010 (internet) 61 34 6 100

GLOBAL VIEWS 2010 TOPLINE DATA FROM U.S. PUBLIC SURVEY
108
Change in % points 2006-2010 -4 +4 +1
Question 366 Question 366: Do you think the United States and South Korea should or should not work together to limit the rise of Chinese power in the years ahead?
366. U.S. and South Korea to work together to limit rise of Chinese power (new) (N=1310) Yes, they should No, they shouldn’t Not sure/Decline Total
(%) (%) (%) (%)
Year
2010 (internet) 55 38 7 100
Question 367 Question 367: Is it your impression that South Korea has a closer relationship with China, with the United States, or equally close with both:
367. South Korea’s relationship with China and the U.S. (new)
(N=1246)
With China With the United
States Equally close with
both Not sure/ Decline Total
(%) (%) (%) (%) (%)
Year
2010 (internet) 18 42 34 7 100
Question 375 Question 375: To what extent do you think U.S. shares similar values and a way of life with South Korea?
375. U.S. shares similar values with South Korea
(N=1317) To a great
extent To some extent To a little
extent To no extent Not sure/ Decline Total
Year (%) (%) (%) (%) (%) (%)
2008 (SPinternet) 4 31 38 23 3 100
2010 (internet) 7 41 35 10 7 100 Change in % points 2008-2010 +3 +10 -3 -13 +4
Question 368 Question 368: Do you think of South Korea as a democracy?

GLOBAL VIEWS 2010 TOPLINE DATA FROM U.S. PUBLIC SURVEY
109
368. South Korea as a democracy (new)
(N=1312) Yes No Not sure/ Decline Total
(%) (%) (%) (%)
Year
2010 (internet) 51 40 10 100
Question 369 Question 369: As you may have heard, North Korea recently torpedoed a South Korean naval ship, killing 46 sailors. Which view is closer to your own:
369. North Korea torpedoing of South Korean naval ship (new) (N=1334)
This was an act of unprovoked aggression and the U.S. should join South Korea in punishing North
Korea
The U.S. should strongly criticize North Korea for its attack, but
should view it as one in a series of incidents in the North Korea-South Korea conflict over disputed waters
Not sure/Decline Total
(%) (%) (%) (%)
Year
2010 (internet) 27 67 6 100
Question 371 Question 371: U.S. policy toward North Korea has to pursue a number of sometimes conflicting objectives. Which of the following approaches do you think would be best?
371. U.S. policy towards North Korea (new)
(N=1219)
Work to maintain stability on the Korean
Peninsula even if it means accepting North Korea’s current regime and nuclear capability
Work to bring about regime change in
North Korea, even if it may bring instability
on the Korean Peninsula and further nuclear proliferation
Work to negotiate an end to North Korea’s
nuclear capability, even if it means
accepting the North Korean regime and
continuing division of the Peninsula
Not sure/ Decline Total
(%) (%) (%) (%) (%)
Year
2010 (internet) 18 19 50 12 100
Question 373 Question 373: When it comes to trade between South Korea and the United States, do you think that:

GLOBAL VIEWS 2010 TOPLINE DATA FROM U.S. PUBLIC SURVEY
110
373. Trade between South Korea and the United States (new)
(N=1276)
South Korea is one of America’s top ten trading partners
South Korea is one of America’s top twenty trading
partners, but not in the top ten
South Korea is not in the top twenty of America’s trading
partners Not sure/ Decline Total
(%) (%) (%) (%) (%)
Year
2010 (internet) 20 46 25 10
Q375 was moved before Q368 Question 376 Question 376: Now thinking about U.S. foreign policy in Asia, do you think the U.S. should put a higher priority on:
376. U.S. to emphasize relationships with traditional allies or China (new) (N=1368)
Building up our strong relations with traditional allies like South Korea and Japan, even if this might diminish our relations
with China
Building a new partnership with China, even if this might diminish our relations with our traditional
allies Not
sure/Decline Total (%) (%) (%) (%)
Year
2010 (internet) 58 31 11 100
Question 377 Question 377: In 2007 the United States and South Korea negotiated a free trade agreement. Supporters of the agreement argue that the billions of dollars in bilateral trade will create new jobs in the United States, and strengthen our relationship with an important strategic and trading partner. Opponents argue that the agreement would not provide enough access to South Korean markets for American companies, would result in lost jobs for American workers, and unfairly benefits South Korea. When the free trade agreement comes up for approval before the U.S. Senate, do you think that:
377. US- Korea Free Trade Agreement ( (new) (N=1302)
The U.S. Senate should approve this free trade
agreement
The U.S. Senate should not approve this free trade
agreement Not
sure/Decline Total (%) (%) (%) (%)
Year
2010 (internet) 44 47 9 100

GLOBAL VIEWS 2010 TOPLINE DATA FROM U.S. PUBLIC SURVEY
111
Question 379 Question 379: Which religion in South Korea do you think has the most followers?
379. Religion in South Korea (new)
(N=1264)
Christianity Hinduism Buddhism Islam Not sure/ Decline Total
(%) (%) (%) (%) (%) (%)
2010 (internet) 19 13 50 6 13 100
Question 380 Question 380: Most countries have agreed to rules that prohibit torturing prisoners to extract information. Which comes closer to your point of view?
380. Torturing prisoners
(N=1294)
Terrorists pose such an extreme threat that governments should
now be allowed to use torture if it may gain information that saves
innocent lives
Rules against torture should be maintained because torture is morally wrong and weakening
these rules may lead to the torture of U.S. soldiers who are
held prisoner abroad Not sure/ Decline Total
(%) (%) (%) (%)
Year
2004 27 70 3 100 2006 (internet) 30 67 3 100 2010 (internet) 38 58 4 100 Change in % points 2006-2010 +8 -9 +1
Question 385 Question 385: Which of the following do you think is more important in determining a country’s overall power and influence in the world – a country’s economic strength, or its military strength?
385. Determinants of Country’s Overall Power
(N=1308) Economic strength Military Strength Not sure/ Decline Total (%) (%) (%) (%)
Year
1998 63 28 9 100
2002 66 27 7 100
2010 (internet) 72 23 4 100

GLOBAL VIEWS 2010 TOPLINE DATA FROM U.S. PUBLIC SURVEY
112
Change in % points 2002-2010 +6 -4 -3 0
Question 390 Question 390: Should legal immigration into the United States be kept at its present level, increased or decreased?
390. Level of legal immigration into the U.S.
(N=1295) Kept at present level Increased Decreased Not sure/ Decline Total
(%) (%) (%) (%) (%)
Year
2002 (telephone) 27 15 55 3 100
2002 (internet) 30 7 61 1 100
2004 (internet) 31 11 54 4 100
2006 (internet) 39 13 46 2 100
2008 (internet) 39 15 46 1 100 2010 (internet) 40 15 42 3 100 Change in % points 2008-2010 +1 0 -4 +2 0
Question 395 (1-7) Question 395 (1-7): Overall, do you think immigration at current levels is good or bad for:
395/1.The country (N=1249) Good Bad Not sure/Decline Total
Year (%) (%) (%) (%)
2008 (internet) 37 60 3 100 2010 (internet) 34 62 4 100 Change in % points 2008-2010 -3 +2 +1 0
395/2. The U.S. economy (N=1249) Good Bad Not sure/Decline Total
Year (%) (%) (%) (%)
2008 (internet) 37 61 3 100 2010 (internet) 34 63 4 100 Change in % points 2008-2010 -3 +2 +1 0
395/3. American companies

GLOBAL VIEWS 2010 TOPLINE DATA FROM U.S. PUBLIC SURVEY
113
(N=1249) Good Bad Not sure/Decline Total
Year (%) (%) (%) (%)
2008 (internet) 49 48 3 100 2010 (internet) 45 52 4 100 Change in % points 2008-2010 -4 +4 +1 0
395/4. Creating jobs in the U.S. (N=1249) Good Bad Not sure/Decline Total
Year (%) (%) (%) (%)
2008 (internet) 30 67 3 100 2010 (internet) 26 71 4 100 Change in % points 2008-2010 -4 +4 +1 0
395/5. Job security for American workers (N=1249) Good Bad Not sure/Decline Total
Year (%) (%) (%) (%)
2008 (internet) 21 76 2 100 2010 (internet) 23 74 3 100 Change in % points 2008-2010 +2 -2 +1 0
395/6. Your own standard of living (N=1249) Good Bad Not sure/Decline Total
Year (%) (%) (%) (%)
2008 (internet) 39 57 4 100 2010 (internet) 37 58 5 100 Change in % points 2008-2010 -2 +1 +1 0
395/7. Your community (N=1249) Good Bad Not sure/Decline Total
Year (%) (%) (%) (%)
2008 (internet) 38 59 3 100 2010 (internet) 37 58 5 100 Change in % points 2008-2010 -1 -1 +2 0

GLOBAL VIEWS 2010 TOPLINE DATA FROM U.S. PUBLIC SURVEY
114
Question 400 Question 400: One version of immigration reform that people have discussed would do the following: Greater efforts would be made to secure the border, to identify illegal immigrants, and to penalize employers who hire them. Illegal immigrants would be required either to leave the country or to enter a program toward citizenship that would require them to pay back taxes and to learn English. Do you favor or oppose this version of immigration reform?
400. Immigration reform (new)
(N=1328)
Strongly Favor
Somewhat Favor
Somewhat Oppose
Strongly Oppose
Not sure/ Decline Total
(%) (%) (%) (%) (%) (%)
Year
2010 (internet) 46 37 9 5 3 100
Question 405 Question 405: Do you think illegal immigrants mostly take jobs that nobody wants or do they mostly take jobs away from Americans who need them?
405. Kinds of jobs taken by illegal immigrants (new)
(N=1290) Mostly take jobs that
nobody wants Mostly take jobs from
Americans who need them Not sure/ Decline Total
(%) (%) (%) (%)
Year
2010 (internet) 48 49 3 100

GLOBAL VIEWS 2010 TOPLINE DATA FROM U.S. PUBLIC SURVEY
115
DEMOGRAPHICS Question 1005 Question 1005: In general, do you think of yourself as:
1005. Party ideology
(N=2596)
Extremely
liberal Liberal Slightly liberal
Moderate/Middle of the road
Slightly conservati
ve Conserva
tive
Extremely conservativ
e
Not sure/
Decline Total (%) (%) (%) (%) (%) (%) (%) (%) (%)
Year 2010 (internet) 3 12 9 37 12 20 4 2 100
Question 1010 Question 1010: Generally speaking, do you usually think of yourself as a Republican, a Democrat, an independent, or what?
1010. Party ID
(N=2596)
Republican Democrat Independent Other Not sure/ Decline Total
(%) (%) (%) (%) (%) (%)
Year
2010 (internet) 29 32 29 9 2 100
Question 1015 Question 1015: Would you call yourself a strong Republican or a not very strong Republican?
1015. Type of Republican
(N=744) Strong Republican Not very strong Republican Not sure/ Decline Total
(%) (%) (%) (%)
Year

GLOBAL VIEWS 2010 TOPLINE DATA FROM U.S. PUBLIC SURVEY
116
2010 (internet) 52 47 1 100
Question 1020 Question 1020: Would you call yourself a strong Democrat or a not very strong Democrat?
1020. Type of Democrat
(N=840) Strong Democrat Not very strong Democrat Not sure/ Decline Total
(%)
(%) (%) (%)
Year
2010 (internet) 47 53 1 100
Question 1025 Question 1025: Do you think of yourself as closer to the Republican Party or to the Democratic Party?
1025. Proximity to Republican or Democratic party
(N=745) Republican party Democratic party Neither Not sure/ Decline Total
(%) (%) (%) (%) (%)
Year
2010 (internet) 28 30 42 0 100
Party 7 Party 7: Do you generally think of yourself as:
Party 7: Party ID
(N=2596)
Strong
Republican Not Strong Republican
Leans Republican
Undecided /Independent
/Other Leans
Democrat
Not strong
Democrat Strong
Democrat Not sure/ Decline Total
(%) (%) (%) (%) (%) (%) (%) (%) (%)
Year
2010 (internet) 15 14 8 22 9 17 15 0 100

GLOBAL VIEWS 2010 TOPLINE DATA FROM U.S. PUBLIC SURVEY
117
Party 3 Party 3: Do you generally think of yourself as:
Party 3: Party ID
(N=2596)
Republican Other Democrat Not sure/ Decline Total
(%) (%) (%) (%) (%)
Year
2010 (internet) 37 22 41 0 100
Question 1040 Question 1040: What is your religious preference?
1040. Religious preference
(N=2596)
Protestant Catholic Other
Christian Jewish Muslim Other No
religion
Not sure/
Decline Total (%) (%) (%) (%) (%) (%) (%) (%) (%)
Year
2010 (internet) 28 19 24 1 0 9 17 2 100
Question 1042 Question 1042: Which one of these words best describes your kind of Christianity - fundamentalist, evangelical, charismatic, Pentecostal, or moderate to liberal?
1042. Kind of Christianity
(N=1845)
Fundamental, evangelical, charismatic or Pentecostal Moderate to liberal
Not sure/ Decline Total
(%)
(%) (%) (%)
Year
2010 (internet) 36 59 6 100
Question 1050 Question 1050: How old are you? Note: Answers divided in 7 categories

GLOBAL VIEWS 2010 TOPLINE DATA FROM U.S. PUBLIC SURVEY
118
1050. Age
(N=2596)
18-24 25-34 35-44 45-54 55-64 65-74 75+ Under
18
Not sure/
Decline Total (%) (%) (%) (%) (%) (%) (%) (%) (%) (%) Year
2010 (internet) 10 17 20 18 18 11 5 0 0 100 Question 1055 Question 1055: What is the highest degree or level of education that you have completed?
1055. Level of education (categorical)
(N=2596)
Less than high
school High school Some college Bachelor’s
degree or higher Not sure/ Decline Total
(%) (%) (%) (%) (%) (%) Year
2010 (internet) 13 31 28 28 0 100 Question 1060 Question 1060: What is your race?
1060. Race
(N=2596)
White, Non-
Hispanic Black, Non-
Hispanic Other, Non-
Hispanic Hispanic 2+ races, Non-
Hispanic Not sure/ Decline Total
(%) (%) (%) (%) (%) (%) (%) Year
2010 (internet) 69 11 6 13 1 0 100
Question 1065 Question 1065: Gender of respondent? (not asked of respondent)
1065. Gender
(N=2596) Female Male Total
(%)
(%) (%)

GLOBAL VIEWS 2010 TOPLINE DATA FROM U.S. PUBLIC SURVEY
119
Year
2010 (internet) 52 48 100
Question 1070 Question 1070: Which statement best describes your current employment status? Are you:
1070. Employment status
(N=2596)
I work as a paid
employee I am self-employed
I am unemployed,
temporarily laid off, but looking
for work I am retired I am
disabled Other Not sure/ Decline Total
(%) (%) (%) (%) (%) (%) (%) (%)
Year
2010 (internet) 48 7 13 15 10 8 0 100