Embed Size (px)
Citation preview
achievement of adolescent women in Peru l
. ~N· A ( (-f - 1-0 /Impact of iron deficiency anemia on cognitive and affective variables and school t \<::J
I '.... (,' 11/V ~J I "~':!J'
Santiago Cueto, Monica Echeandia and Nelly Zavaleta 2/
ABSTRACT
An experimental study is presented on the differences between iron deficient anemic,
iron deficient non-anemic and iron replete non-anemic adolescent women. The
dependent variables were related to cognitive abilities, school achievement,
socialization, self-esteem, and anxiety. Contrary to expectations, baseline measurements
showed no differences between these groups. Within each group, subjects were
randomly assigned to a placebo or experimental group (300 mgs of iron sulfate given
five days a week or twice-a-week for 16 weeks). Post-test measurements were taken
controlling for baseline scores. No consistent statistically significant findings emerged
as a result of treatment in any of the tests or in the percent of students promoted. These,
,'j
results would need to be replicated with a larger sample.
Supported by grants from Mothercare: # 5024-28 and # 5024-93.
Santiago Cueto works at GRADE (Group of Analysis for Development) in Lima; Monica Echeandiaand Nelly Zavaleta are with the Investigacion Nutricional in Lima, Peru.
. Address reprint requests should be sent to Nelly Zavaleta at Instituto de Investigacion Nutricional,Av.La Universidad sIn, La Molina, Lima, Peru. E-mail: [email protected]
/

Introduction
Anemia is widely considered a public health problem worldwide, with up to
30% of the population affected (1). In Peru, the 1996 Demographic Health Survey
results found 35.7% of women between the ages of 15 and 49, and 56.8% of children
ages 6 to 59 months to be anemic (2). It is generally considered that iron deficiency is
the most important cause of anemia, mostly because of low intake, poor absorption or
iron losses (3).
Iron deficiency anemia has been found to be associated with developmental
delays among children that are both anemic and iron deficient (4). Subjects presenting
both these conditions usually score lower than comparable subjects non-anemic but iron
deficient or non-anemic and non-iron deficient. Several studies have found poorer
performance of infants (5), preschoolers (6) or children with iron deficiency anemia in
primary school (7) on tests of motor a,nd psychological development and school
achievement, as compared to non-anemic iron deficient children and non-anemic iron
replete children. There have been a few studies that included adolescents in the sample,
and these show similar results (8). A recent study with iron-deficient non-anemic girls
in Baltimore found no differences in baseline measures of attention, memory and
language learning. Still, the experimental group (treated with iron sulfate) showed
improvements in memory and language learning after repletion of iron stores (9). The
study in Baltimore did not include iron-deficient anemic girls.
There is not a perfect consistency among the findings, but most experimental
studies found beneficial effects of iron supplementation on cognitive and motor
variables. This is particularly true among studies with preschool and school age
children. Other studies show that iron deficiency anemia affects physical capacity and
productivity (l0). A serious limitation of previous studies is the selective attention given
to mental or cognitive development. With very few exceptions the emotional or
affective domain has been almost totally disregarded. This is surprising because clinical
and research data suggest that iron deficiency anemia does affect emotional regulation.
Among the areas of development that have not been measured are those of the affective
domain of development or development of personality in a broad sense. For example a
study found that infants with iron-deficiency anemia show "functional isolation" (11).
The study included 52, 12 - to 23-month old infants observed during free play. The
anemic infants showed less pleasure, maintained closer contact with caregivers, were
more wary and easily tired, and were less playful. This functional isolation could well
be present in adolescent anemic women. We know of no studies that have adressed this
Issue.
The purpose of this paper is to present data on the impact of iron deficiency on
adolescent women. This age group is particularly at risk once they start their menarchy.
The hypotheses are:
i) At baseline. iron-deficient anemic girls will score lower on cognitive variables, school
achievement and several dimensions ojthe affective domain than non-anemic iron-
defiCient girls, who will in turn score lower than iron-replete non-anemic girls.
ii) Iron deficient anemic girls will improve on cognitive variables. school achievement
and several dimensions ofthe affective domain after iron treatment more than the other... .
two groups: smaller increments are expectedfrom the iron deficient non-anemic girls:
no increments are expected in the iron-replete non-anemic girls, This hypothesis will be
tested by comparing pre- and post-test scores for treatment and control groups within
the iron-deficient anemic, iron-deficient non-anemic and iron replete non-anemic girls.
This study was an additional component to a study carried out to test the efficacy
of two iron schedules to school adolescent girls (12).
Methods
Design
This is a randomized clinical trial with assessment before and after an iron
intervention among 12 to 18 year old female adolescents selected from a low income
urban population in Lima, Peru.
Iron deficiency anemia (IDA) was defined as hemoglobin <120 giL, serum ferritin <12
mglL, free erythrocyte protoporphyrin> 80 mg/dl; Iron deficiency without anemia (ID)
was defined as hemoglobin ~ 120 giL, serum ferritin < 12 mglL and free erythrocyte
protoporphyrin> 80 mg/dl; finally, Iron replete (IR) was defined as hemoglobin ~ 120
giL serum ferritin ~ 12 mglL and free erythrocyte protoporphyrin < 80 mgldl. All
students with Hb < 80 gl L were excluded from the study (n=2) and given treatment
immediately.
Iron intervention: There were two schedules of treatment: 1) 300 mg of iron
sulfate (60 mg iron) daily from Monday to Friday 2) 300 mg of iron sulfate twice a
week (intermitent dose, the remaining days they received placebo). Originally these two
groups were to be kept separate. However, due to the small size of the IDA group, and
given that both had beneficial effects on iron status (12), these were collapsed into one
treatment group.
2) Control: received a placebo five days a week (starch). All tablets have the same color
and shape and were produced by a local pharmaceutical company (Instituto
Quimioterapico S.A Lima Peru). The supplements were given for 17 weeks during the
third and fourth school quarter (each quarter period of two months) of 1996.
Treatment or placebo was administered daily at school, between meals and with
a sweetened flavored drink without ascorbic acid and under close supervision of a field·
worker who also recorded acceptability and side effects. Data related to several other
outcomes were also collected (nutritional status, morbidity and compliance) and will be
reported elsewhere.
Location and Subjects
All subjects were adolescent girls from one public high school in Villa El
Salvador, an impoverished district south of Lima. Criteria for including adolescent girls
in the groups were: ages 12-18 years old; post menarchy (this was included as a criteria
because these girls are more likely to suffer from iron deficiency anemia); attending the
selected high school at the time of the study; healthy (no chronical diseases present at
the time of the study). The IDA group was smaller than expected, in spite of previous
screening tests performed by the research team. This had limitations on the power ofthe
statistical tests. Table 1 shows the number of subjects per cell.
Insert Table 1 here
There were no significant differences between the groups in the grades they were
enrolled at the time of the study. There were differences though in the mean age: IDA:
15.8 years (SE=0.26), NID: 16.1 years (SE=0.19), and NIR: 14.9 years (SE=O.I1). The
age of the NIR group was significantly below the other two (p<0.05). There were no
significant differences between the groups in fathers' education (median for the three
groups=3.7 years) or mothers' education (median for the three groups=3.1 years).
According to the last peruvian Census (1993), the median number of years of education
for the urban population 15 years of age or older of Peru is 9.6 for men and 8.5 for
women (13).
Dependent Variables and Measurements
- Cognitive Development: The California Test of Mental Development was used (14).
This test includes the following sub-tests: spatial (which includes tasks that assess
knowledge of laterality and tasks that measure comparison of rotated figure), logical
reasoning (given a series of letters arranged following a logical sequence, the subject
had to answer with the next letter in the sequence; other tasks referred to the ability of
the subjects to make deductions given a short statetment), mathematics (arithmetic) and
verbal (vocabulary). Besides a score for each subtest a global score was calculated
adding the scores from the subscales. We used raw scores (1 point for each right
answer) given that there are no reliable norms for Peru.
- Socialization: The Battery of Socialization (15) was used. This battery includes the
following sub-tests: respect for others (included items such as "I help other people when
they are in trouble"), self-control in social relations (e.g. "I challenge older people when
they tell me I'm wrong"), social withdrawal (e.g. "I usually do not volunteer to be part
of a group of people"), social anxiety/shyness (e.g. 1am scared of things that do not
scare other people"), and leadership (e.g. "1 take the initiative when a new task arises").
The answer that reflects the construct measured is given a point; raw scores were used.
Also a sincerity scale was administered and all those scoring above pre-determined
levels were excluded from the study. The sincerity scale measures contradictions in the
responses (students with a high number of contradictions in their responses are assumed
to not have taken seriously the test and thus discarded).
- Self-esteem: The Self Esteem Inventory (SEI) was administered (16). This inventory
includes the following areas: self, peers, home-parents and school. One point was
awarded for each answer reflecting high self-esteem. Raw scores were used. In this case
tests were also checked for sincerity.
- Anxiety: From the State and Trait Anxiety Inventory for Children (STAIC), the trait
scale was used. This scale measures anxiety as a more or less permanent characteristic
ofthe individual (17). This variable must not be confused with anxiety in the
socialization scale. The STAIC measures anxiety as a trait, while the socialization scale
measures anxiety in relation to other people. In this study the STAIC and anxiety sub
test from the socialization scale only shared 17% of the variance (r).
The above tests were selected given their strong psychometric properties in previous
studies in Peru, although given the novelty of the research questions they have not been
used to study iron deficient anemics.
- Grades in spanish and mathematics: These were used to test for differences in school
achievement. The grades were recorded by quarter (four total) from official school
records (in Peru the grades go from 0 to 20, with lithe minimum passing grade). For
baseline, the grades for the first and second quarters were averaged (treatment started in
the third quarter). For the post-test, the grades for the third and fourth quarter were
included.
- Final outcome for the grade: This was recorded in three categories: I) promoted to the
next grade without failures in any of the courses, 2) promoted with up to three classes
failed, and 3) repeated the grade (i.e. four or more classes were failed). The students
promoted with up to three classes failed had to enroll in summer classes. This
information was taken also from official school records.
- Parents education: This information is reported in number of grades completed. The
information was obtained by personally interviewing one of the parents.
Procedures
If the subjects matched the criteria specified above they were invited to
participate in the study and a consent form was signed by the subjects and their parents
or tutors. All procedures related to the study were approved by the ethics committee of
the lnstituto de Investigaci6n Nutricional in Lima.
A blood sample of 4 ml was obtained by venipuncture m the cubital vein (4 ml),
hemoglobin was analysed by the cYanp1ethemoglobin method, serum ferritin by Elyssa
and erythrocyte protoporphyrin by an hematofluorometer (Helena).
Within the groups (IDA, NID and NIR), subjects were randomly assigned to the
experimental (iron) and control (placebo) groups. All field personnel and subjects were
blind to the treatment (iron sulfate or placebo). Within the IDA group that received
treatment, all students that did not improve in at least 5 grs/L in Hb from the pre to the
post-test were excluded from the study (n=5). This was done to make sure that students
in the IDA group were in fact suffering from iron-deficiency anemia at the time the
study began.
All psychological tests were objective, paper and pencil, and were group-
administered by psychologists who were previously standardized in all procedures. The
pre- and post-tests were administered in one session that lasted around 60 minutes.
J

Some subjects were lost at post-test because they could not be located within the two-
week period of final evaluation (attrition was between 0 and 10% for any comparison).
As explained before, some other scores had to be dismissed because of inconsistencies
in the answers.
Results
To analyze the results for hemoglobin, a comparison was made first between the
results of the placebo and treatment group for the IDA, NID and NIR separately. Given
the small number of subjects in the IDA groups, a non-parametric test was used
(Wilcoxon Rank Sum Test). For the other two groups an Analysis of Variance was used.
In the post test we used the same statistical tools, but the dependent variable for the IDA
groups were the difference of the post-test minus the pre-test (for simplicity in the
presentation, the mean values in the post-test and not the differences are presented in
Table 2). For the NID and NIR groups we used and analysis of covariance adjusting for
baseline scores. Table 2 shows the results:
Insert Table 2 here
As expected, girls in the iron deficient anemic group who received treatment
improved their hemoglobin levels the most from baseline to the post-test. Before
analyzing the results for the dependent variables. the tests were checked for reliability.
The procedure used was a test-retest correlation only with the girls in the placebo group.
Those tests correlating above r=0.60 were used. Three sub-tests from the California Test
of Mental Development were excluded on the basis of poor reliability: Logical
reasoning, mathematics and verbal. Only the spatial sub-test and the global score ofthe
California showed acceptable reliability. For the Self Esteem Inventory, the sub-tests
showed acceptable reliability, but provided no unique information either at the pre- or
post-test. Thus for this test only the global score is reported.
Regarding the analysis, an analysis of covariance was used adjusting for age of
the subjects. We explored specifically the following contrasts: IDA<NID<NIR for all
tests. None of the contrasts was significant.
Insert Table 3 here
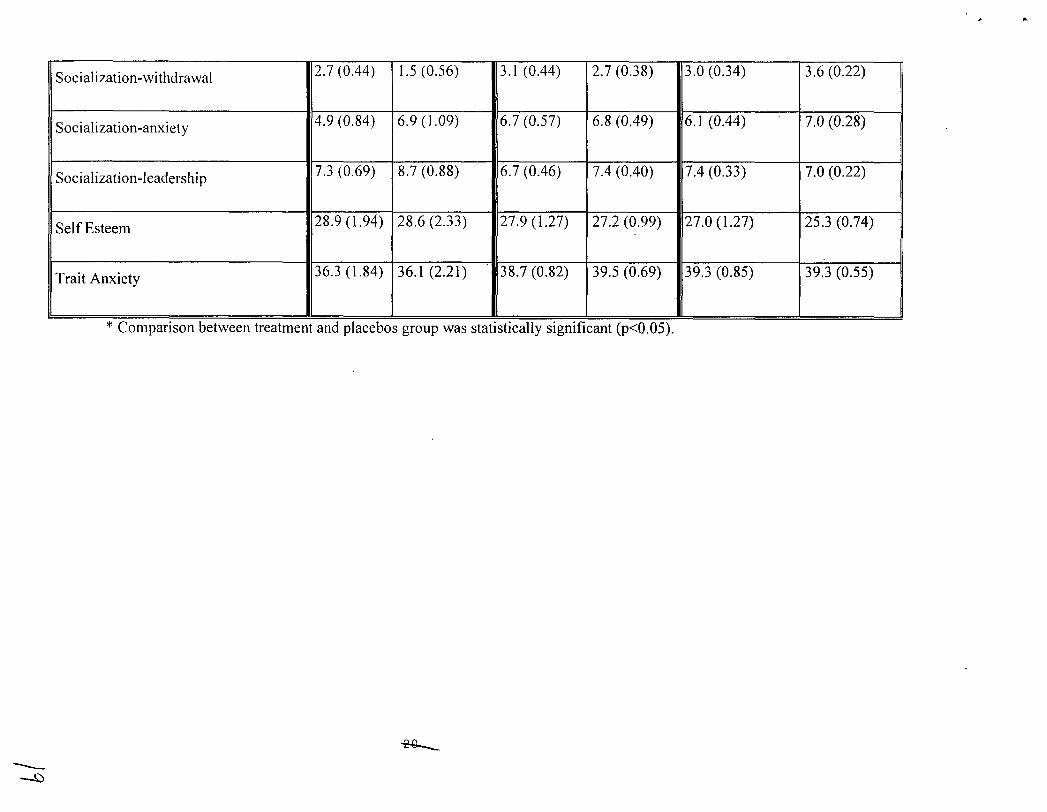
Regarding the results for the post-test, again, we contrasted the treatment and
placebo groups separately for the IDA NID and NIR groups. For the IDA contrasts we
used the Wilcoxon test, with the post-test minus the pre-test as the dependent variable
(for ease of presentation the simple mean of the post-test is presented in Table 4). For
the NID and NIR groups an analysis of covariance was performed using the post-test as
the dependent variable and adjusting for the baseline score. Table 4 shows the results:
Insert Table 4
The two significant results were for verbal grades (treatment group in the NID
scored significantly higher than the control group) and socialization-relationships (the
placebo group scored above the treament group). These results could be explained as
Type I errors.
Finally. the outcomes for achievement at the end ofthe school year are presented
on Table 5:
Insert Table 5 here
Chi-square was non significant for any of the comparisons between treatment
and control groups.
1/\V
Discussion
The results in this study do not confirm hypothesis i. No differences were found"
between the experimental and control IDA, NID, and NIR groups in the pre-test, in the
cognitive tests, measures of achievement in school or tests of anxiety, self-esteem and
socialization. These results contradict most ofthe studies reviewed in the introduction.
The explanation for the lack of significant differences between the groups in the
pretest could be that the iron deficient anemic girls might not have a long history of
anemia, but have become anemic recently, probably after menarchy (this would also
explain why there were no socio-economic differences between anemic and"non-anemic
girls favoring the latter). We have no data on the history of anemia for every girl, but if
the anemia is recent its effects could be felt only if they girls remain anemic for an
extended period of time. The results in the pre-test could be also due to the fact that
effects of iron deficiency anemia on adolescents are different from the effects on
younger children that have been reported. We believe that the impact of iron deficiency
anemia on adolescent development needs further study to confirm if the effects are
similar to those observed in children.
Regarding the hypothesis ii, there is also no data in thus study to support it.
Hypothesis ii stated that IDA girls with iron treatment would increase their scores
significantly more than their controls. In fact hypothesis ii initially assumed that
hypothesis i would be confirmed (which. as seen above, did not occur). Still, we decided
to carry out the analysis of post-test scores based on the idea that, although the groups
were similar at baseline, iron-deficiency anemia could still be hindering the
development of the girls that suffered it. Yet. there are no consistent findings to support
the idea that the IDA or NID treament groups improved significantly more than their
II
controls.
One explanation for the lack of significant results in this study is the small
number of girls in the IDA groups. For instance the results for the cognitive
development global test would have been significant had we included at least 30
subjects in each of the IDA groups4 (cognitive development-spatial would become
significant with 32 subjects per each IDA group). On the other hand, with similar
increases in the sample size the variables would become significant for the placebo
group in socialization-withdrawal and socialization-anxiety, suggesting an effect that is
opposite to the one suggested in hypothesis ii. In any event, the results found in this
study seem to give little support to the hypothesis that iron deficiency anemia affects
negatively adolescent girls in an impoverished area of Lima in cognitive and affective
tests and school achievement.
Perhaps the affective characteristics of anemic adolescent women should first be
studied following a procedure similar to that used by Lozoff and colleagues working
with infants (11): observing them interact in their natural environment. Perhaps the tests
selected for this study were not sensible enough to detect differences between anemic
and non-anemic iron deficient women.
Acknowledgments
The authors would like to thank the adolescent girls from school Francisco
Bolognesi in YES, Lima, Peru for their participation in the study. We also are very
grateful to their parents, teachers and school authorities. We also would like to thank
Frida Samchez and Amelia Rodriguez for their dedication to this study.
4 For these calculations we have used formulas provided by Kirk (18). The probability of a Type I errorwas set to p<O.05 and the power to 0.80. The differences between the means and standard errors wereassumed to be the same for larger samples.
References
1. De Maeyer, E., Adiels-Tegman, M. The prevalence of anemia in the world. World
Health Stat Q 1985; 38: 302-16.
2. INEIlInstituto Nacional de Estadistica e Informatica (1997). Encuesta Demografica y
de Salud Familiar ENDES, 1996. Republica del Peru. Macro International Inc.
3. MacPhail, P., Bothwell, T. H. The prevalence and causes of nutritionaliron deficiency
anemia. In Fomon, S., Zlotkin, S. (Eds). Nutritional Anemias, Vol. 30 Nestle Nutrition
Workshop Series. New York: Nestec Ltd. / Ravevn Press Ltd., 1992.
4. Pollitt, E. Malnutrition and infection in the classroom. Paris: UNESCO, 1990.
5. Walter, T. Infancy: mental and motor development. Am J Clin Nutr 1989; 50:655-66.
6. Soewondo, S. Husaini, M., Pollitt, E. Effects of iron deficiency on attention and
learning processes in preschool children: Bandung, Indonesia. Am J Clin Nutr 1989; 50
(supplemental): 667-73.
7. Pollitt, E., Hathirat, P. Kotchabhakdi, N. Missell, L. Valsayevi, A. Iron deficiency
and educational achievement in Thailand. Am J Clin Nutr 1989; 50(supplemental): 687-
96.
8. Sheshadri, S., Gopaldas, T. Impact of iron supplementation on cognitive functions In
preschool and school aged children: The indian experience. Am J Clin Nutr 1989;
50(supplemental): 675-84.
9. Bruner, A., Joffe, A., Duggan, A., Casella, 1. & Brandt, J. Randomised study of
cognitive effects of iron supplementation in non-anemic iron-deficient adolescent girls.
The Lancet, 1997:348:992-996.
10. Edgerton VR, Gardner G, Ohira Y, Gunawardena KA, Senewiratne. Iron deficiency
anemia and its effect on worker productivity and activity patterns. Br Med 1.
,-I
/2
1979:2:1546-1549.
11. Lozoff, B., Klein, N., Nelson, E., McClish, D., Manuel, M. & Chacon, M. E.
Behavior of infants with iron-deficiency anemia. Child Development 1998:69:24-36.
12. Zavaleta, N., Respicio, G & Garcia, T. Efficacy and Acceptability of Two Iron
Supplementation Schedulres in Adolescent School Girls in Lima, Peru. J Nutr (in press
2000)
13. !NEI. Comprendio de Estadisticas Sociales 1994-1995, Lima Penl.
14. Sullivan, E. T., Willis, W. W. & Tiegs, E. W. Manual de la Prueba de Madurez
Mental de California, 1950. No publisher.
15. Silva, F., Martorell, M. C. Bateria de Socializacion BAS-3, 1995. Madrid: TEA
Ediciones.
16. Coopersmith, S. Self Esteem Inventories, 1981. California: Consulting
Psychologists Press.
17. Spielberger, C. D. Cuestionario de Autoevaluacion Ansiedad Estado/Rasgo en
Ninos, 1990. Madrid: TEA Ediciones.
18. Kirk, R. Experimental Design (2nd ed), 1982. Belmont, California: Brooks/Cole.
d
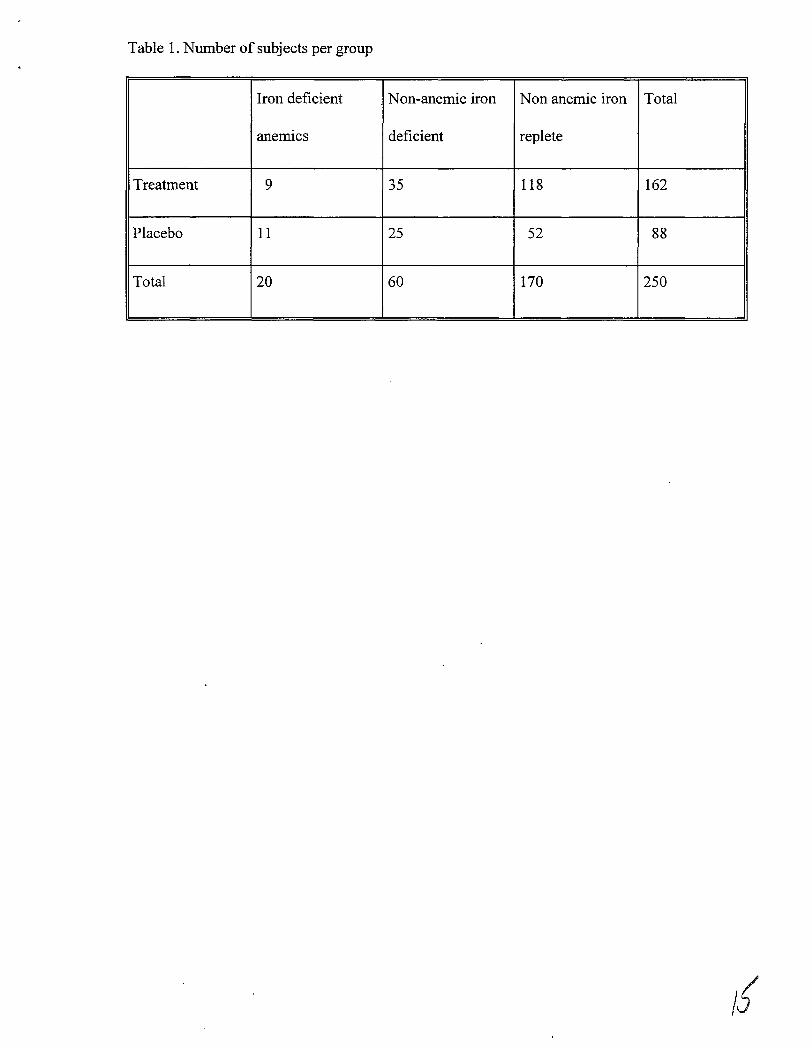
Table 1. Number of subjects per group
Iron deficient Non-anemic iron Non anemic iron Total
anemics deficient replete
Treatment 9 35 118 162
Placebo 11 25 52 88
Total 20 60 170 250
/IJ
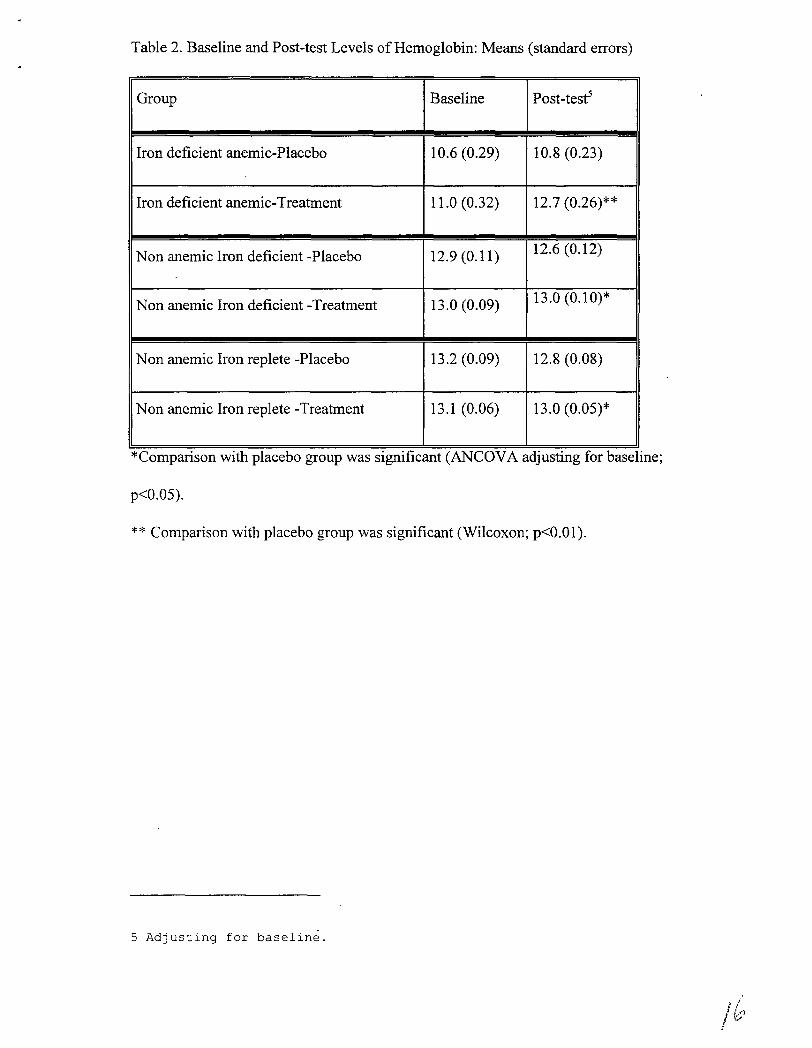
Table 2. Baseline and Post-test Levels ofHemoglobin: Means (standard errors)
Group Baseline Post-testS
Iron deficient anemic-Placebo 10.6 (0.29) 10.8 (0.23)
Iron deficient anemic-Treatment 11.0 (0.32) 12.7 (0.26)**
Non anemic Iron deficient -Placebo 12.9 (0.11) 12.6 (0.12)
Non anemic Iron deficient -Treatment 13.0 (0.09) 13.0 (0.10)*
Non anemic Iron replete -Placebo 13.2 (0.09) 12.8 (0.08)
Non anemic Iron replete -Treatment 13.1 (0.06) 13.0 (0.05)*
*Comparlson WIth placebo group was slgmficant (ANCDVA ad]ustmg for baselme;
p<0.05).
** Comparison with placebo group was significant (Wilcoxon; p<O.OI).
5 Adjusting for baseline.
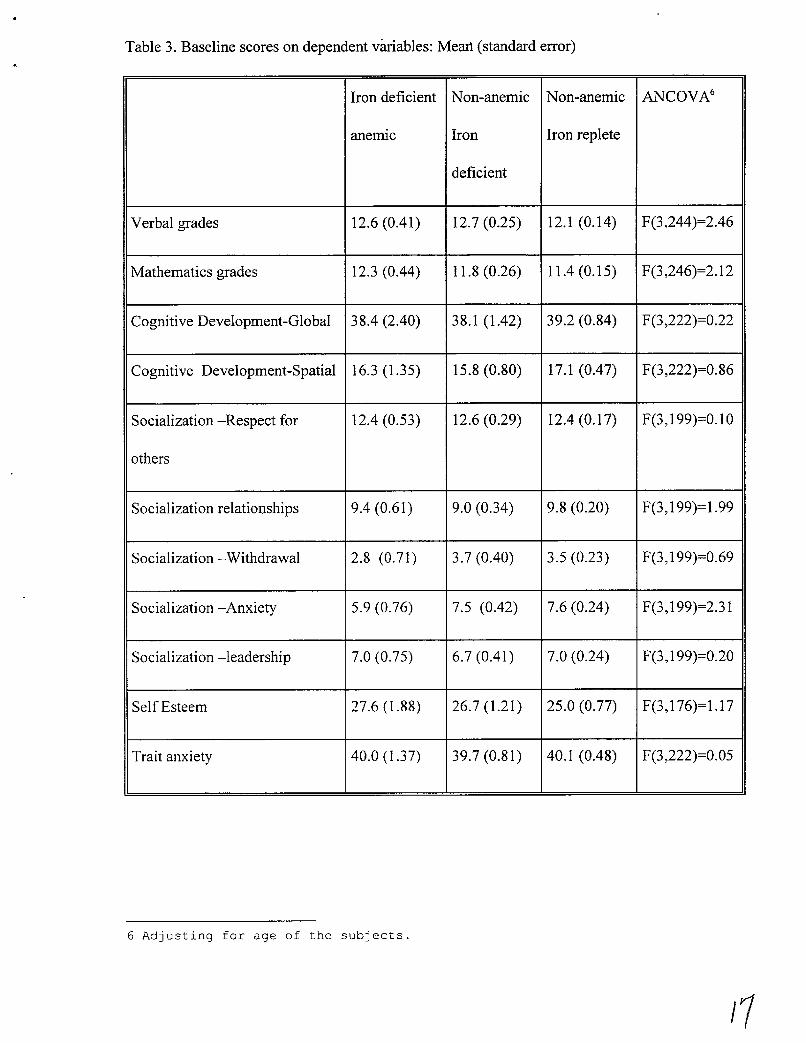
Table 3. Baseline scores on dependent variables: Meart (standard error)
Iron deficient Non-anemic Non-anemic ANCOVA6
anemiC Iron Iron replete
deficient
Verbal grades 12.6 (0.41) 12.7 (0.25) 12.1 (0.14) F(3,244)=2.46
Mathematics grades 12.3 (0.44) 11.8 (0.26) 11.4 (0.15) F(3,246)=2.12
Cognitive Development-Global 38.4 (2.40) 38.1 (1.42) 39.2 (0.84) F(3,222)=0.22
Cognitive Development-Spatial 16.3 (1.35) 15.8 (0.80) 17.1 (0.47) F(3,222)=0.86
Socialization -Respect for 12.4 (0.53) 12.6 (0.29) 12.4(0.17) F(3,199)=0.10
others
Socialization relationships 9.4 (0.61) 9.0 (0.34) 9.8 (0.20) F(3,199)=1.99
Socialization -Withdrawal 2.8 (0.71) 3.7 (0.40) 3.5 (0.23) F(3,199)=0.69
Socialization -Anxiety 5.9 (0.76) 7.5 (0.42) 7.6 (0.24) F(3,199)=2.31
Socialization -leadership 7.0 (0.75) 6.7 (0.41) 7.0 (0.24) F(3,199)=0.20
Self Esteem 27.6 (1.88) 26.7 (1.21) 25.0 (0.77) F(3,176)=1.17
Trait anxiety 40.0 (1.37) 39.7 (0.81) 40.1 (0.48) F(3,222)=0.05
6 Adjusting for age of the subjects.
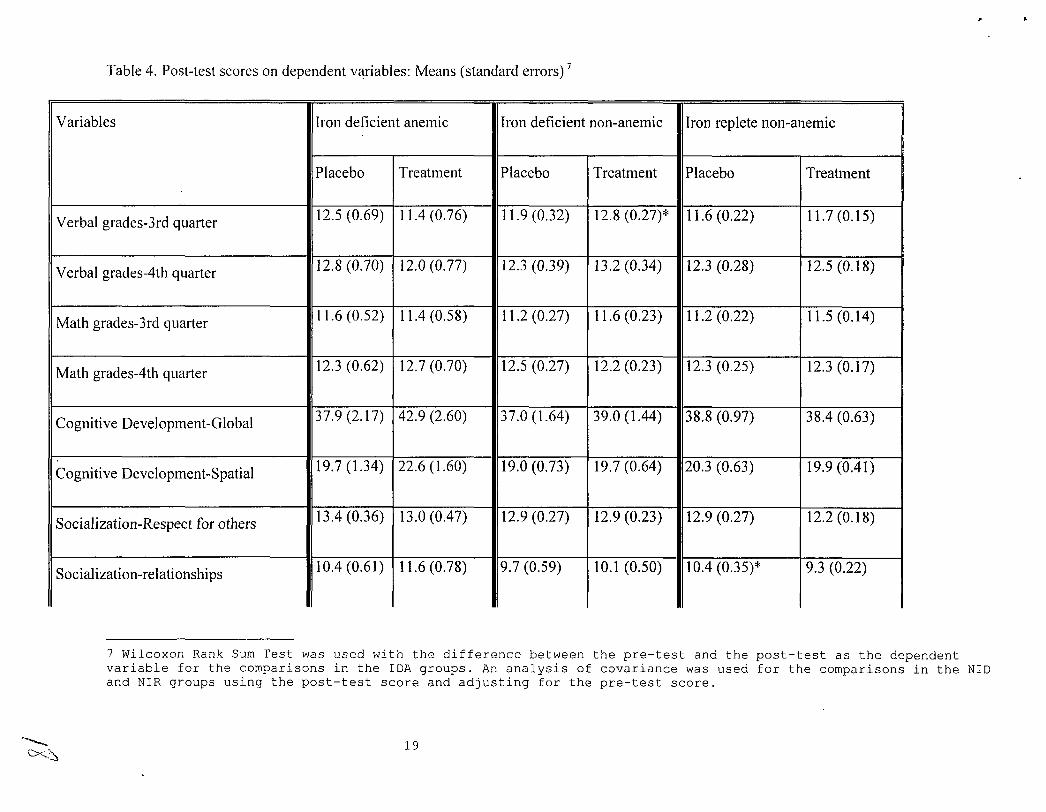
Table 4. Post-test scores on dependent variables: Means (standard errors) 7
Variables Iron deficient anemic Iron deficient non-anemic Iron replete non-anemic
Placebo Treatment Placebo Treatment Placebo Treatment
Verbal grades-3rd quarter 12.5 (0.69) 11.4 (0.76) 11.9 (0.32) 12.8 (0.27)* 11.6 (0.22) 11.7 (0.15)
Verbal grades-4th quarter 12.8 (0.70) 12.0 (0.77) 12.3 (0.39) 13.2 (0.34) 12.3 (0.28) 12.5 (0.18)
Math grades-3rd quarter 11.6 (0.52) 11.4 (0.58) 11.2 (0.27) 11.6 (0.23) 11.2 (0.22) 11.5(0.14)
Math grades-4th quarter 12.3 (0.62) 12.7 (0.70) 12.5 (0.27) 12.2 (0.23) 12.3 (0.25) 12.3 (0.17)
Cognitive Development-Global 37.9 (2.17) 42.9 (2.60) 37.0 (1.64) 39.0 (1.44) 38.8 (0.97) 38.4 (0.63)
Cognitive Development-Spatial 19.7 (1.34) 22.6 (1.60) 19.0 (0.73) 19.7 (0.64) 20.3 (0.63) 19.9 (0.41)
Socialization-Respect for others 13.4 (0.36) 13.0 (0.47) 12.9 (0.27) 12.9 (0.23) 12.9 (0.27) 12.2(0.18)
Socialization-relationships 10.4 (0.61) 11.6 (0.78) 9.7 (0.59) 10.1 (0.50) 10.4 (0.35)* 9.3 (0.22)
7 Wilcoxon Rank Sum Test was used with the difference between the pre-test and the post-test as the dependentvariable for the comparisons in the IDA groups. An analysis of covariance was used for the comparisons in the NIDand NIR groups using the post-test score and adjusting for the pre-test score .
.............C><:.~
19
--~
Socialization-withdrawal 2.7 (0.44) 1.5 (0.56) 3.1 (0.44) 2.7 (0.38) 3.0 (0.34) 3.6 (0.22)
Socialization-anxiety 4.9 (0.84) 6.9 (1.09) 6.7 (0.57) 6.8 (0.49) 6.1 (0.44) 7.0 (0.28)
Socialization-leadership 7.3 (0.69) 8.7 (0.88) 6.7 (0.46) 7.4 (0.40) 7.4 (0.33) 7.0 (0.22)
Self Esteem 28.9 (1.94) 28.6 (2.33) 27.9 (1.27) 27.2 (0.99) 27.0 (1.27) 25.3 (0.74)
Trait Anxiety 36.3 (1.84) 36.1 (2.21) 38.7 (0.82) 39.5 (0.69) 39.3 (0.85) 39.3 (0.55)
Comparison between treatment and placebos group was statistically significant (p<0.05).
~
..
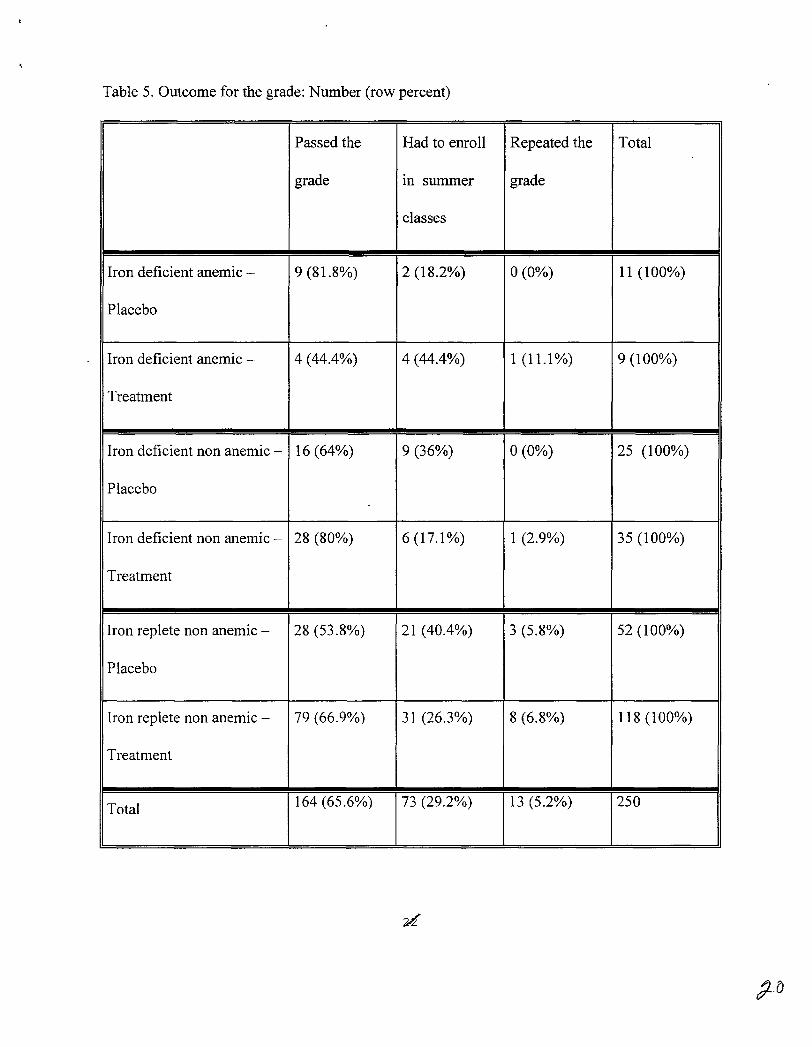
Table 5. Outcome for the grade: Number (row percent)
Passed the Had to enroll Repeated the Total
grade In summer grade
classes
Iron deficient anemic - 9 (81.8%) 2 (18.2%) 0(0%) 11 (100%)
Placebo
Iron deficient anemic - 4 (44.4%) 4 (44.4%) 1(11.1%) 9 (100%)
Treatment
Iron deficient non anemic - 16 (64%) 9 (36%) 0(0%) 25 (100%)
Placebo
Iron deficient non anemic - 28 (80%) 6(17.1%) 1 (2.9%) 35 (100%)
Treatment
Iron replete non anemic - 28 (53.8%) 21 (40.4%) 3 (5.8%) 52 (100%)
Placebo
Iron replete non anemic - 79 (66.9%) 31 (26.3%) 8 (6.8%) 118 (100%)
Treatment
Total 164 (65.6%) 73 (29.2%) 13 (5.2%) 250