Embed Size (px)
Citation preview

WAUSAU EAST HS
Culturally Responsive Early Warning System Use in a Multi-
Level System of Support
• Christine Budnik, Assistant Principal• Kelly Rohr, RtI Coordinator• Manee Vongphakdy, School Counselor and EWS Coordinator• Jill Koenitzer, WI RtI Center Technical Assistance Coordinator
Agenda
Rationale for Implementation of RtI – A and RtI – B
Specific Steps to Implementation Culturally Responsive Early Warning
System (CR-EWS) Evaluation data from Wausau East

Wausau East High School
Wausau, WI; population: 39,106 Number of Students at East: 1050 Demographics:
2.5% American Indian 4% Hispanic 5%African American 18% Asian 71% White
International Baccalaureate School
The Beginning…
High performing students and system which met student needs
Evolving student population System not meeting changing needs Teachers struggling to meet needs of all
students Budget restraints Frustrations began to build Needed to do something…but what? Began exploring options

What We Had
East HS Common Intellectual Mission:21st Century College and Career Ready
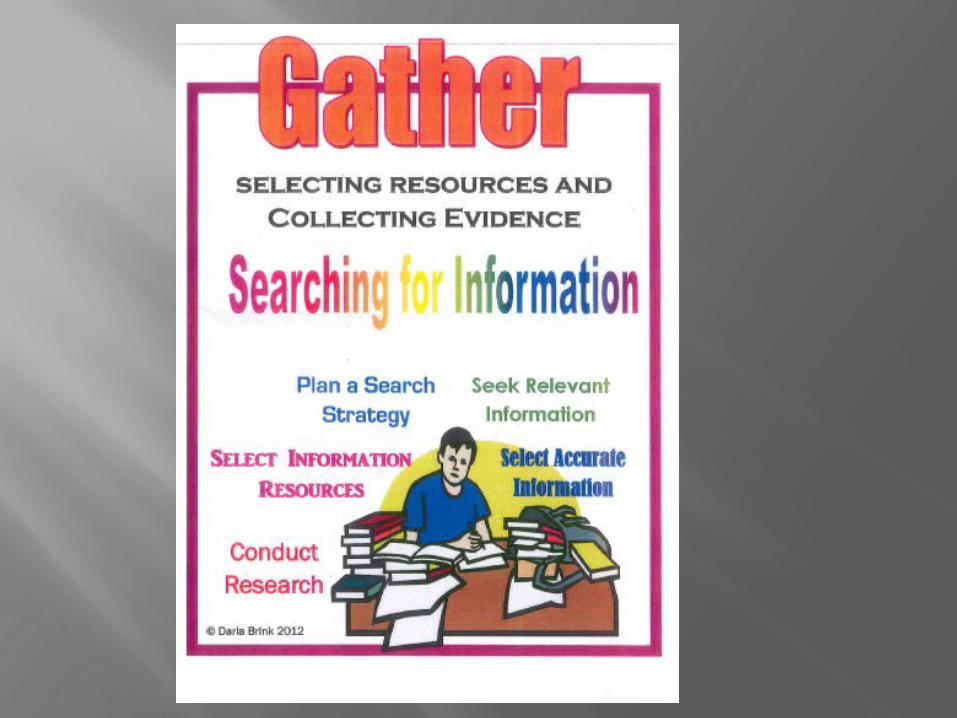
Gather Analyze Synthesize Understand Create
Focus of year-long, staff training and collaboration


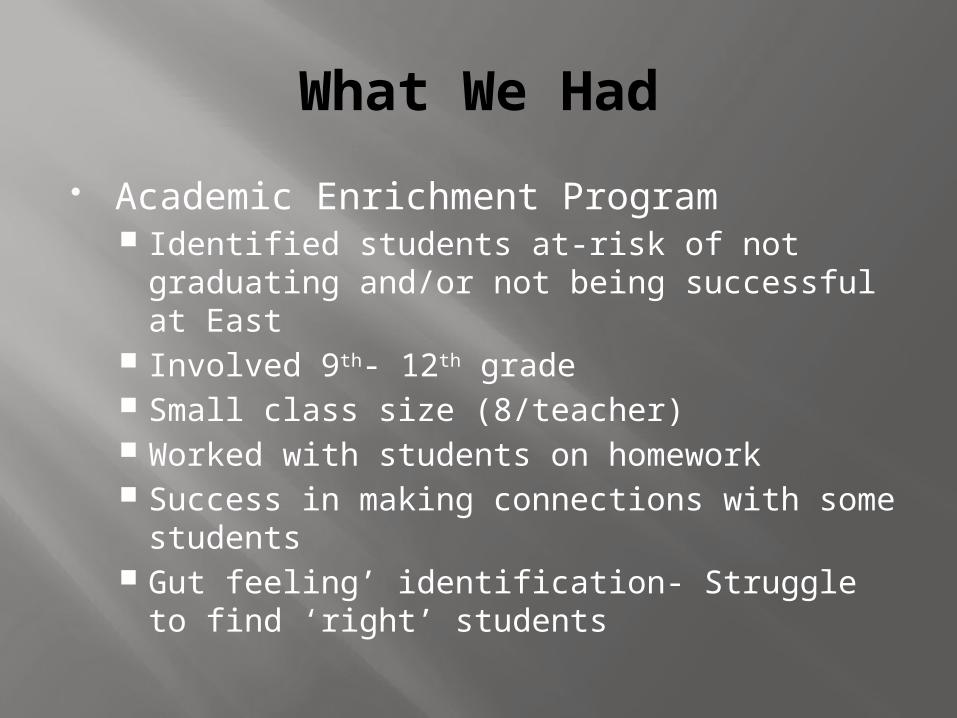
What We Had
Academic Enrichment Program Identified students at-risk of not graduating
and/or not being successful at East Involved 9th- 12th grade Small class size (8/teacher) Worked with students on homework Success in making connections with some
students Gut feeling’ identification- Struggle to find
‘right’ students

What We Had
Supportive building administration Research and Design Committee
Teachers, administrators, counselors- ‘problem solving’ committee
Caring staff Realization that things needed to
change

What We Needed
Stronger impact on ALL students Efficient use of existing data Effective System to identify at-risk
students earlier Time, money, resources…..
Began to research what was out there

Our Search
Other schools Staff Development Books Conferences Online Resources
Needed a plan to pull everything together…

Turning Point
Team from East attended workshop: WI RTI Framework: A Systems Approach to RTI Regular Education Teachers (English, Science,
Math, Social Studies), SPED, School Counselor & Psychologist, Assistant Principal
Met helpful WI RtI staff (Jill Koenitzer) Introduced to the Early Warning System Began to identify biggest struggles Began to develop a plan

Starting Out
LOTS of questions! Where do we begin? Could be identify what was/was not
working? Could we get people to change? Who was going to be involved? Where would we find the time? How could we use the information from the
conference effectively?
More questions than answers…

Developing Our Plan
Created East RTI Committee Involved in Early Warning System
(EWS) Academic Enrichment program changes Resource Center changes Stronger communication between all
parties Hard and honest look at data-

East RTI Committee
Participants: Kelly Rohr(English), Hope Cameron(Social Studies), Julia McMahon(Math), Darlene Beattie(Science), Lou Livingston(SPED), Manee Vongpakte(Counselor), Joe Svitak(AP), Chris Budnik(AP), Rich Ament(School Psych), Sara Boetcher(District RTI Coordinator)
Meeting Time: 2X/Month (Collab Time) Administrative Support: VITAL Staff Buy-In: Communication was crucial Early Warning System: Putting it in place
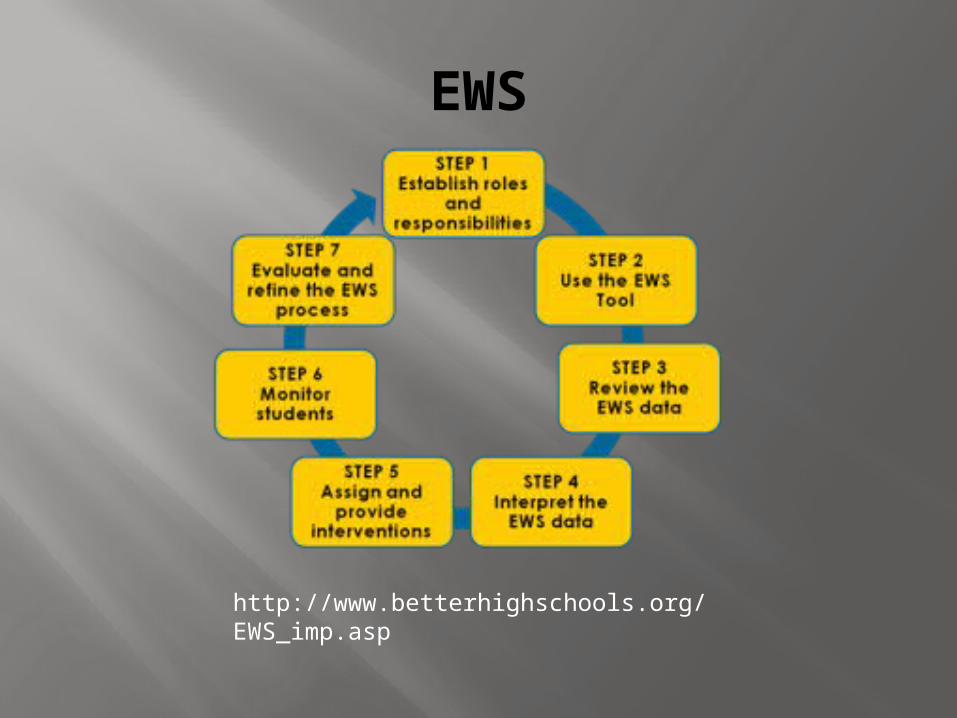
EWS
http://www.betterhighschools.org/EWS_imp.asp
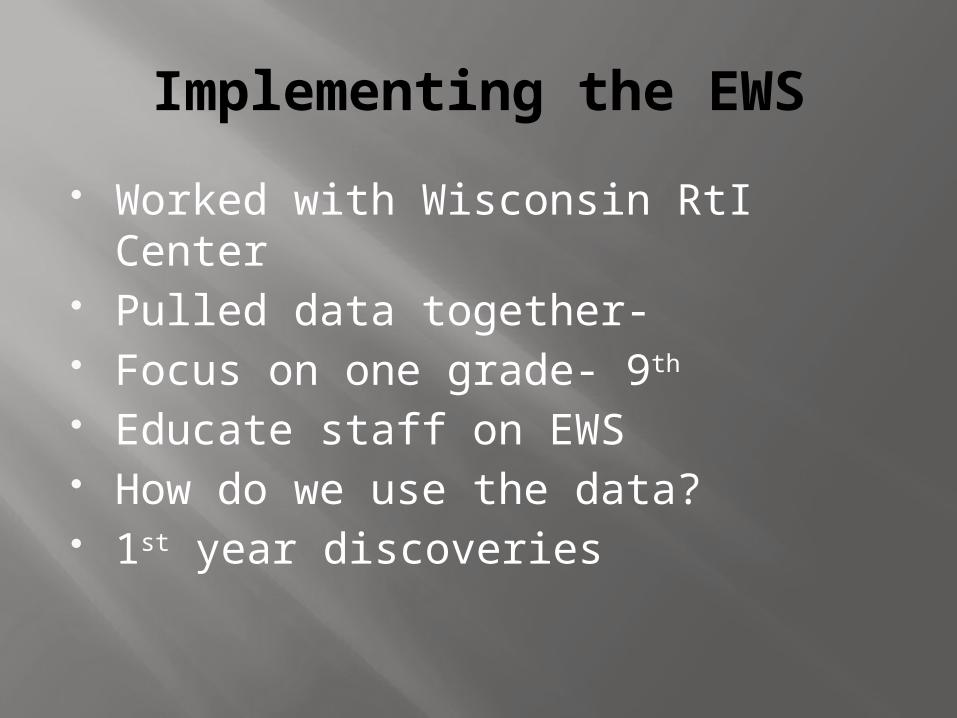
Implementing the EWS
Worked with Wisconsin RtI Center Pulled data together- Focus on one grade- 9th Educate staff on EWS How do we use the data? 1st year discoveries

Year 1 Evaluation
Resource Centers- Use of commons, LMC RC assignments
Academic Enrichment- Use of Data- Coordinator- Staff Buy-In VITAL
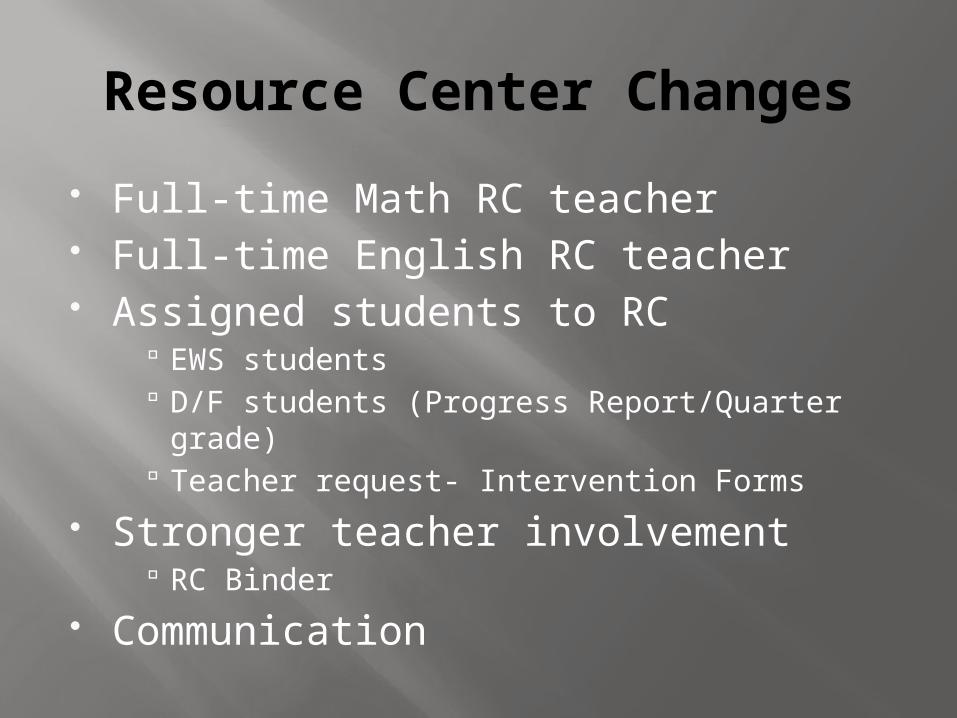
Resource Center Changes
Full-time Math RC teacher Full-time English RC teacher Assigned students to RC
EWS students D/F students (Progress Report/Quarter grade) Teacher request- Intervention Forms
Stronger teacher involvement RC Binder
Communication
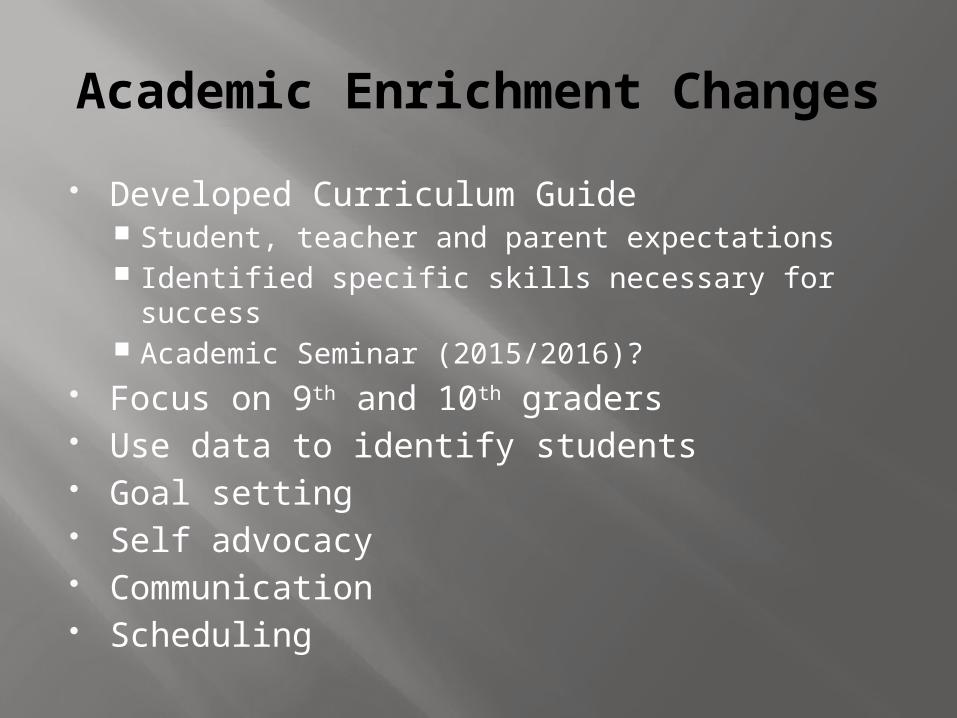
Academic Enrichment Changes
Developed Curriculum Guide Student, teacher and parent expectations Identified specific skills necessary for success Academic Seminar (2015/2016)?
Focus on 9th and 10th graders Use data to identify students Goal setting Self advocacy Communication Scheduling

Use of Data
EWS At-risk identification Quarterly results Semester results Results drive meetings
Lexile Testing School SLO All freshmen tested (Fall, Winter, Spring) Teacher use of scores

RtI Coordinator
Planned for .8 position (.2 AE) Scheduled in English RC AE connection Monitor EWS students Coordinate RCs Staff Development Schedule EWS students And…and…and…

Staff Buy-In
VITAL! Tier 1 Instruction and Support (Collab time)
Disciplinary Literacy Formative Assessments Academic Vocabulary Lexile Use Differentiation RC Expectations Student Motivation
Patience Results

Communication
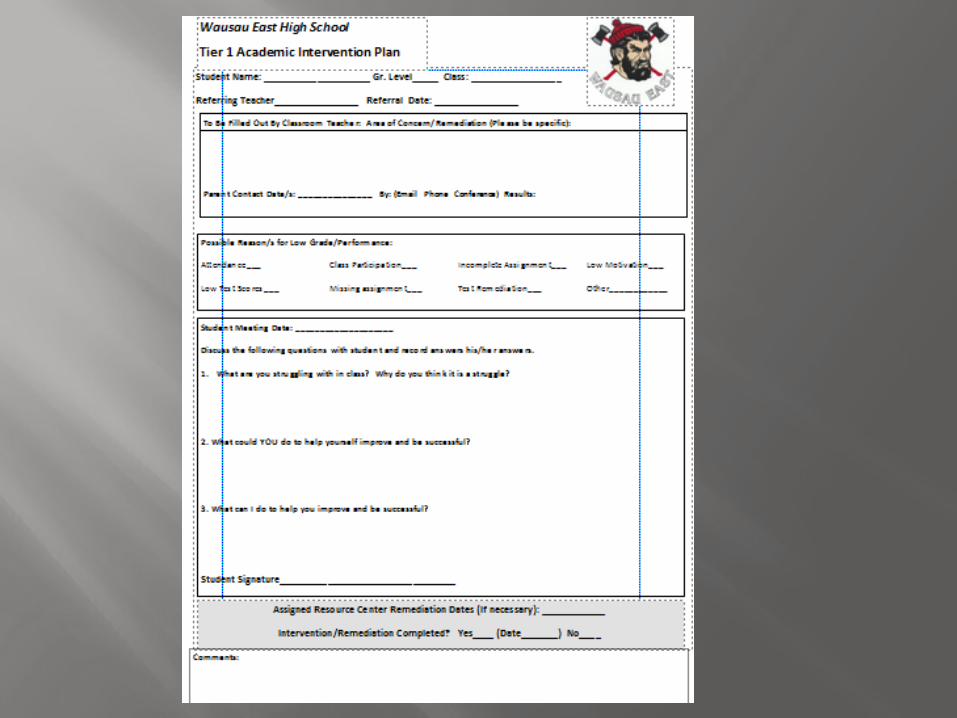
Tier 1 Intervention Form Tier 2 Academic Intervention Plan RTI Background Form Tier 2 Teacher Response Form Articles Training Opportunities


Year 2 Reflections
Staff Buy-in Administrative Support System Change- TIME Data Retreat Literacy Coach Additional Training

Next Steps
Hand-scheduling students with EWS flags Freshman homerooms LINK crew Connections Survey Check In/Check Out Academic Seminar pilot

CULTURALLY RESPONSIVE EARLY WARNING SYSTEMS
(CR-EWS)Identifying disproportionality

Key Early Warning Indicators
Discipline
ODRs
Suspension/ Expulsion
Attendance
Early Absences
Chronic Absence
CoursePerformance
Grades
GPA

Getting Started
• Identify disproportionate data at the school level
• Decision rules: How do we determine when action is needed?• Use multiple metrics
Adapted from: “Hope is Necessary but not Sufficient: Using Data to Address Disproportionality,” Therese Sandomierski & Christopher Vatland, Florida’s Positive Behavior Support Project, Thursday, March 12th 2015, APBS International Conference

Know What You’re Dealing With
• With small groups, a few students can have a big impact• May change how you intervene
• Be familiar with school-level demographics

Common Metrics – See Handout
• Risk (“Risk Index”)• % of students in a racial/ethnic group who have at least
one referral• Risk Ratio
• Risk of one group vs. risk of another group• Best single measure to summarize a group’s risk• Not as effective with N < 15
• Composition• % of students who received referrals who belong to a
specific racial/ethnic group• Flag Composition/Comparison
• % of referrals generated by a specific racial/ethnic group• Impacted by students who receive multiple referrals
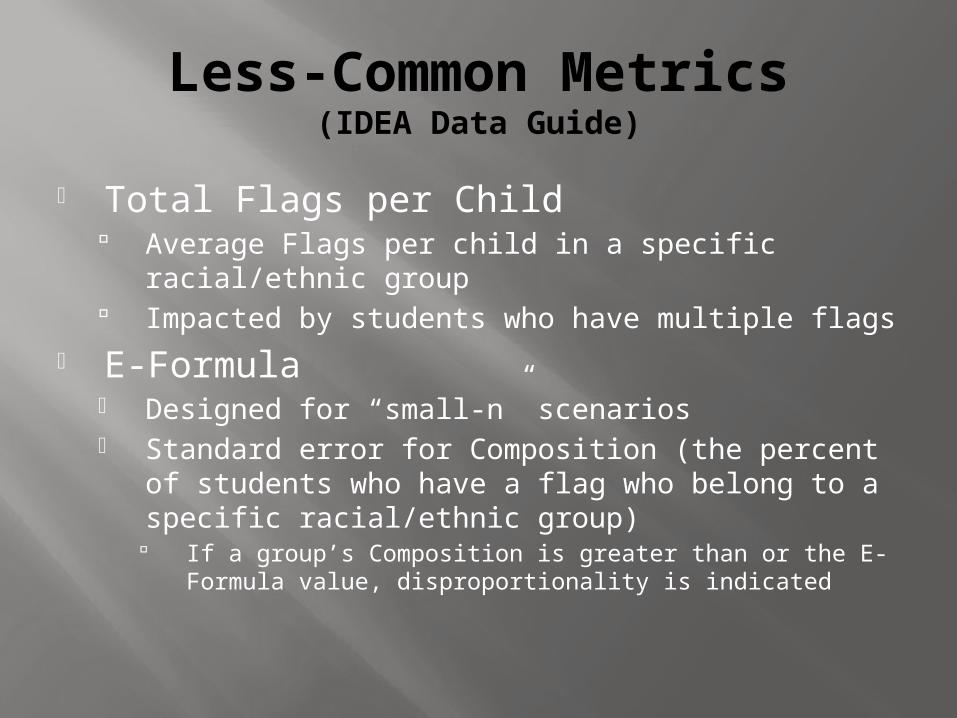
Less-Common Metrics(IDEA Data Guide)
• Total Flags per Child Average Flags per child in a specific racial/ethnic
group Impacted by students who have multiple flags
• E-Formula• Designed for “small-n” scenarios• Standard error for Composition (the percent of
students who have a flag who belong to a specific racial/ethnic group) If a group’s Composition is greater than or the E-Formula
value, disproportionality is indicated

Help is Available: Excel Template

School Data Template: Complete 3 Fields


2014 – 15 EWS Data
NOT cohort data 9th grade: Quarter 1, 2, 3 10th grade: Quarter 1, 2, 3

Students with Disabilities
9: Q1 9: Q2 9: Q3 10: Q1 10: Q2 10: Q30
20
40
60
80
100
120
RiskLinear (Risk)

Students With Disabilities
9: Q1 9: Q2 9: Q3 10: Q1 10: Q2 10: Q30
0.5
1
1.5
2
2.5
3
3.5
4
Flags per childFPC RatioRisk RatioLinear (Risk Ratio)

African American
9: Q1 9: Q2 9: Q3 10: Q1 10: Q2 10: Q30
20
40
60
80
100
120
Risk
RiskLinear (Risk)
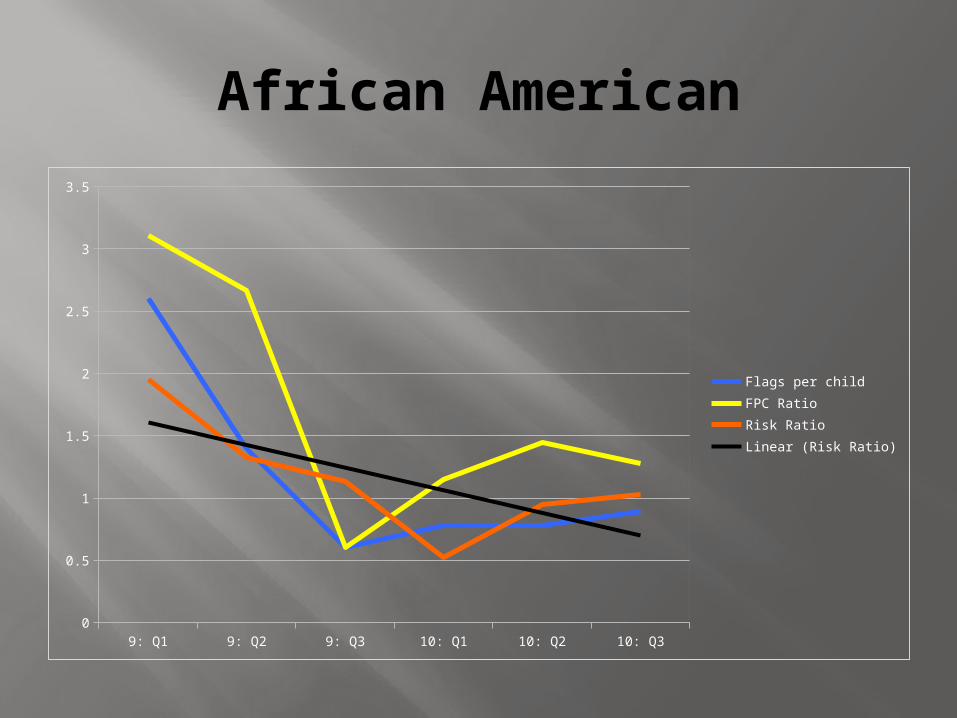
African American
9: Q1 9: Q2 9: Q3 10: Q1 10: Q2 10: Q30
0.5
1
1.5
2
2.5
3
3.5
Flags per childFPC RatioRisk RatioLinear (Risk Ratio)

African American
9: Q1 9: Q2 9: Q3 10: Q1 10: Q2 10: Q30
1
2
3
4
5
6
7
CompositionLinear (Composition)Flag Comparison

Asian
9: Q1 9: Q2 9: Q3 10: Q1 10: Q2 10: Q30
10
20
30
40
50
60
Asian
RiskLinear (Risk)

Asian
9: Q1 9: Q2 9: Q3 10: Q1 10: Q2 10: Q30
0.2
0.4
0.6
0.8
1
1.2
Flags per childFPC RatioRisk RatioLinear (Risk Ratio)

Questions?

Contact Information
Kelly RohrChris Budnik
Manee VongphakdyJill Koenitzer
[email protected]@wausauschools.org
[email protected]@wisconsinrticenter.org


![EWS [Compatibility Mode]](https://img.dokumen.tips/doc/110x75/54673170af795974338b5529/ews-compatibility-mode.jpg)