Embed Size (px)
Citation preview

> Erste BankLeading the way in Central Europe
> UBS Global Banking Conference
> New York, 9-11 May 2005
> Andreas Treichl, CEO

2
UBS Global Banking ConferenceNew York, 9-11 May, 2005
> Disclaimer
THE INFORMATION CONTAINED IN THIS DOCUMENT HAS NOT BEEN INDEPENDENTLY VERIFIED AND NOREPRESENTATION OR WARRANTY EXPRESSED OR IMPLIED IS MADE AS TO, AND NO RELIANCE SHOULDBE PLACED ON, THE FAIRNESS, ACCURACY, COMPLETENESS OR CORRECTNESS OF THS INFORMATIONOR OPINIONS CONTAINED HEREIN
CERTAIN OF THE STATEMENTS CONTAINED IN THIS DOCUMENT MAY BE STATEMENTS OF FUTUREEXPECTATIONS AND OTHER FORWARD-LOOKING STATEMENTS THAT ARE BASED ON MANAGEMENT’SCURRENT VIEWS AND ASSUMPTIONS AND INVOLVE KNOWN AND UNKNOWN RSIKS AND UNCERTAINTIESTHAT COULD CAUSE ACTUAL RESULTS, PERFORMANCE OR EVENTS TO DIFFER MATERIALLY FROM THOSEEXPRESSED OR IMPLIED IN SUCH STATEMENTS.
NONE OF ERSTE BANK OR ANY OF ITS AFFILIATES, ADVISORS OR REPRESENTATIVES SHALL HAVE ANYLIABILITY WHATSOEVER (IN NEGLIGENCE OR OTHERWISE) FOR ANY LOSS HOWSOEVER ARISING FROMANY USE OF THIS DOCUMENT OR ITS CONTENT OR OTHERWISE ARISING IN CONNECTION WITH THISDOCUMENT
THIS DOCUMENT DOES NOT CONSTITUTE AN OFFER OR INVITATION TO PURCHASE OR SUBSCRIBE FORANY SHARES AND NEITHER IT NOR ANY PART OF IT SHALL FORM THE BASIS OF OR BE RELIED UPON INCONNECTION WITH ANY CONTRACT OR COMMITMENT WHATSOEVER
Cautionary note regarding forward-looking statements
NB From 1 January 2005 the revised IASB standards IAS 32 (Financial Instruments: Disclosure and Presentation) andIAS 39 (Financial Instruments: Recognition and Measurement) are binding. These principally affect how the securitiesbusiness is presented and how loans are valued. In accordance with the transitional provisions, the values published forthe previous year have been restated. It is these restated 2004 figures that are used throughout this presentation.Details of the changeover to the revised IFRS standards were explained in a news release dated 3 May 2005, whichcan be downloaded from the Erste Bank website at www.erstebank.com

3
UBS Global Banking ConferenceNew York, 9-11 May, 2005
> Presentation topics
1. Where we are now
2. Growth drivers
3. Outlook and targets
4. Appendix

4
UBS Global Banking ConferenceNew York, 9-11 May, 2005
> The Erste Bank model – strength in depth
A leading retail franchise with 11.8 million customers
Clients: 5.4m; #1Retail deposits: 26%Branches: 647 Clients: 2.5m; #1
Retail deposits: 34%Branches: 333
Clients: 0.9m; #2Retail deposits: 8%Branches: 142
Clients: 0.6m; #3Retail deposits: 9.5%Branches: 120
Branches of:
Clients: 1.6mBranches: 733
Clients: 0.8m; # 2Retail deposits: 20%Branches:
- „Own“ :144 :- Subsidiaries: 145 A
CZ
SL
SK
HU
CR
D PL
IT
BH
CH
UA
BY
RO
SRBG

5
UBS Global Banking ConferenceNew York, 9-11 May, 2005
> The changing face of Erste Bank
Since 1997 our group has followed a sustainable growth path
Assets (EUR bn)
20
139
Net profit (EUR m)
48
545
Clients (m)
0.6
11.8
Operating profit (EUR m)
163
1,495
+595% +1,035% +1,867%+953%
Employees
4,929
35,862
Branches
316
2,264
Return on Equity
6.1%
18.0%
Cost/Income Ratio
74.5%63.4%
+628% +617%
20041996

6
UBS Global Banking ConferenceNew York, 9-11 May, 2005
> Continuing to successfully execute our strategy
» Net Profit + 71.1% to EUR 160.3m
» Total Assets + 6.0% to EUR 148.2bn
» Tier 1 Ratio at 6.8%
» Cost/Income Ratio 62.4%
» ROE 18.0%
» Proposed dividend for the year 2004:EUR 0.5 per share (+33.3%)
Cash EPS
Cost-Income Ratio Cash ROE
71.8%70.1%
67.9%67.1%
67.9%
64.2%63.5%
1998 1999 2000 2001 2002 2003 2004
11.2%13.0%
14.3% 14.5% 15.3%16.6%
17.0%
1998 1999 2000 2001 2002 2003 2004
Erste Bank Group Q1 2005 financial highlights
0.28 0.33 0.38 0.40 0.39
0.67
1.23 1.311.45
1.83
2.18
Q1 vsFY00
Q1 vsFY01
Q1 vsFY02
Q1 vsFY03
Q1 vsFY04
Q1 05
62.4%
Q1 2005
18.0%
Q1 2005

7
UBS Global Banking ConferenceNew York, 9-11 May, 2005
8.3365.9396.2Operating result
12.918.0ROE (%)63.762.4Cost / Income Ratio (%)
2.5(643.1)(658.9)Operating expenses4.61,009.01,055.1Operating income
71.193.7160.3Net profit after minority interests(15.7)(75.7)(63.8)Minority interests(19.7)(85.7)(68.8)Taxes on income
14.8255.1292.9Pre-tax profit23.1(2.6)(2.0)Other operating result
(33.3)8.45.6Result from insurance business2.5(643.1)(658.9)General administrative expenses
(8.3)62.457.2Net trading result10.9280.5311.1Net commission income(6.4)(108.2)(101.3)Risk provisions for loans and advances
3.6657.7681.2Net interest income% ChangeQ1 2004Q1 2005EUR m
> Q1 05 Group Income Statement (IFRS)
Strong improvement in Austrian retail and growing CE contribution

8
UBS Global Banking ConferenceNew York, 9-11 May, 2005
> Q1 2005 Divisional Figures - Overview
(40.2)(38.1)(6.5)(5.6)0.00.0(15.6)(16.2)(18.1)(16.3)Thereof funding costs
12.9%18.0%n.a.n.a.18.1%16.7%38.7%39.0%14.3%13.1%ROE on net profit after min.
63.7%62.5%n.a.n.a.19.1%20.7%61.5%59.0%65.4%65.2%Cost/Income Ratio
2,897.93,553.731.826.4406.7470.2746.41,126.21,713.01,931.0Average attributed equity
63,470.666,812.4486.7347.46,218.36,197.811,413.714,845.845,352.045,421.5Average risk-weighted assets
93.7160.3(58.0)(32.3)18.419.772.2109.761.163.2Net profit after minority interests
(75.7)(63.8)(24.5)(13.6)0.00.0(12.0)(7.8)(39.2)(42.4)Minority interests
(85.7)(68.8)(17.6)9.3(3.8)(7.7)(26.6)(33.3)(37.9)(37.1)Taxes on income
255.1292.9(15.9)(28.0)22.227.4110.7150.9138.2142.7Pre-tax profit
(2.6)(2.0)2.0(9.5)(3.0)0.6(12.6)0.211.06.7Other operating results
8.45.60.00.00.00.02.11.86.33.7Income from insurance business
(643.1)(658.9)(11.6)(8.1)(7.8)(9.0)(212.8)(236.8)(410.8)(405.1)General admin. expenses
62.457.2(1.7)1.3(0.0)(0.0)26.725.437.430.4Net trading result
280.5311.1(2.3)(11.6)5.77.290.8112.7186.4202.8Net commission income
(108.2)(101.3)(0.0)0.4(8.1)(7.6)(9.8)(13.9)(90.4)(80.1)Risk provisions
657.7681.2(2.2)(0.5)35.336.1226.3261.3398.3384.2Net interest income
Q1 04Q1 05Q1 04Q1 05Q1 04Q1 05Q1 04Q1 05Q1 04Q1 05In EUR m
TOTAL EB GROUPCorp. CenterInt. BusinessCE SubsidiariesAustria

9
UBS Global Banking ConferenceNew York, 9-11 May, 2005
Assets –moderate seasonal growth in customer lending
> Q1 05 EB Group Balance Sheet (IFRS)
6.0139,812148,202Total assets3.25,2995,470Other assets
(1.0)1,7231,705Tangible assets1.61,8231,852Intangible assets6.221,92623,275Financial investments5.415,96716,834Investments available for sale
14.54,6285,298Trading assets2.2(2,804)(2,867)Risk provisions for loans and advances2.472,84374,585Loans and advances to customers
24.615,68419,545Loans and advances to credit institutions(8.0)2,7232,505Cash and balances with central banks
% Change31.12.200431.03.2005EUR m

10
UBS Global Banking ConferenceNew York, 9-11 May, 2005
Liabilities – tier 1 ratio strengthens to 6.8%
> Q1 05 EB Group Balance Sheet (IFRS)
10.710.2Solvency ratio (%)6.76.8Tier 1 ratio (%)
6.0139,812148,202Total Liabilities5.93,4243,626Shareholders’ equity2.13,2413,308Minority interests
(0.3)2,9942,985Subordinated capital13.56,1797,016Other liabilities3.47,5007,758Provisions5.219,71020,744Debts evidenced by certificates2.168,21369,670Amounts owed to customers
15.928,55133,095Amounts owed to credit institutions% Change31.12.200431.03.2005EUR m

11
UBS Global Banking ConferenceNew York, 9-11 May, 2005
> Presentation topics
1. Where we are now
2. Growth drivers
3. Outlook and targets
4. Appendix

12
UBS Global Banking ConferenceNew York, 9-11 May, 2005
NB: To eliminate the currency effects, Q1 2005 exchange rates have been used for all P&L and Balance Sheet data conversions
1 CS Q1 04 net profit includes proceeds of sale of non-life insurance subsidiary2 EB increased its stake in SLSP to 100% in Jan 20053 Final realignment of ownership structure in EBCR in Jan 2005,
Q1 2005 Results (IFRS) as reported by local entities
EB stake 97.97% 100.00% 99.90% 61.95%
2
3,476
1,441
51.0
27.4
15.0
Q1 04
4,737
2,435
65.1
15.3
8.6
Q1 04
6,171
5,083
58.9
17.4
18.9
Q1 04
19,422
11,639
58.5
28.7
87.6
Q1 04
(6%)3,267(4.2%)4,53710.8%6,8356.0%20,586
Balance Sheet Total(EURm)
4%1,4962.3%2,491(0.2%)5,074(0.4%)11,590Employees
49.054.857.658.2Cost / Income ratio (%)
19.927.519.622.7ROE (%)
(24.2%)11.4>100%18.325.2%23.6(12.4%)76.7Net Profit (EUR m)
+/-%Q1 05+/-%Q1 05+/-%Q1 05+/-%Q1 05
31
> Supported by strong CE profit growth …

13
UBS Global Banking ConferenceNew York, 9-11 May, 2005
> … as well as a fast growing CE asset base
Double digit loan growth leads shift of RWA to higher yielding CE» Distribution of RWA 2002 – 2005 Q1
66,812.4
14,845.8
51,966.7
Q1 2005
66,470.4
13,318.7
53,151.7
YE 2004
0.5%61,888.060,511.9Total
11.5%10,162.19,157.6Central Europe
-2.2%51,725.851,354.3Austria &Int.Business
Growth YE04 vs Q105YE 2003YE 2002EUR m
Austria, Internationaland Corp. Centre
CE Subsidiaries
85% 84%80%
84.9% 83.6% 80.0% 77.8%
15.1% 16.4%20.0% 22.2%
0
10,000
20,000
30,000
40,000
50,000
60,000
70,000
2002 2003 2004 2005 Q1
EUR
m
» CE subsidiaries contributed 68.4% to Group net profit in Q1 2005

14
UBS Global Banking ConferenceNew York, 9-11 May, 2005
> Successful focus on cost management» Target CIR < 80% in all branches by year-end
2005» Closure or sale of underperforming branches» New, performance-based salary system» Improvement in procurement efficiency» Streamlining of IT operations
Net Profit
Op. Profit
Q1 05Q1 0444.1
17.2
5.64.1
-3.5
5.32.4
11.4
1.4
6.1
2.5
55.1
19.2
22.4
8.76.2
0.0
5.9 4.6
14.5
3.06.1
3.0
-5
5
15
25
60
8.4
Total Branches SME Own SBs Mortgage Subsidiaries
> Exploiting key market opportunities» One of the richest EU countries
» GDP/capita: EUR 27.800» Large corporates – opportunistic approach
(parent/local AMs)» Asset management services
» Shift in investment attitude(demographic, societal factors)
» LT annual growth rates: ~ 10%» Mortgage-lending (underdeveloped
compared to EU)
> Improved efficiency in Austrian business
EUR
m
15
UBS Global Banking ConferenceNew York, 9-11 May, 2005
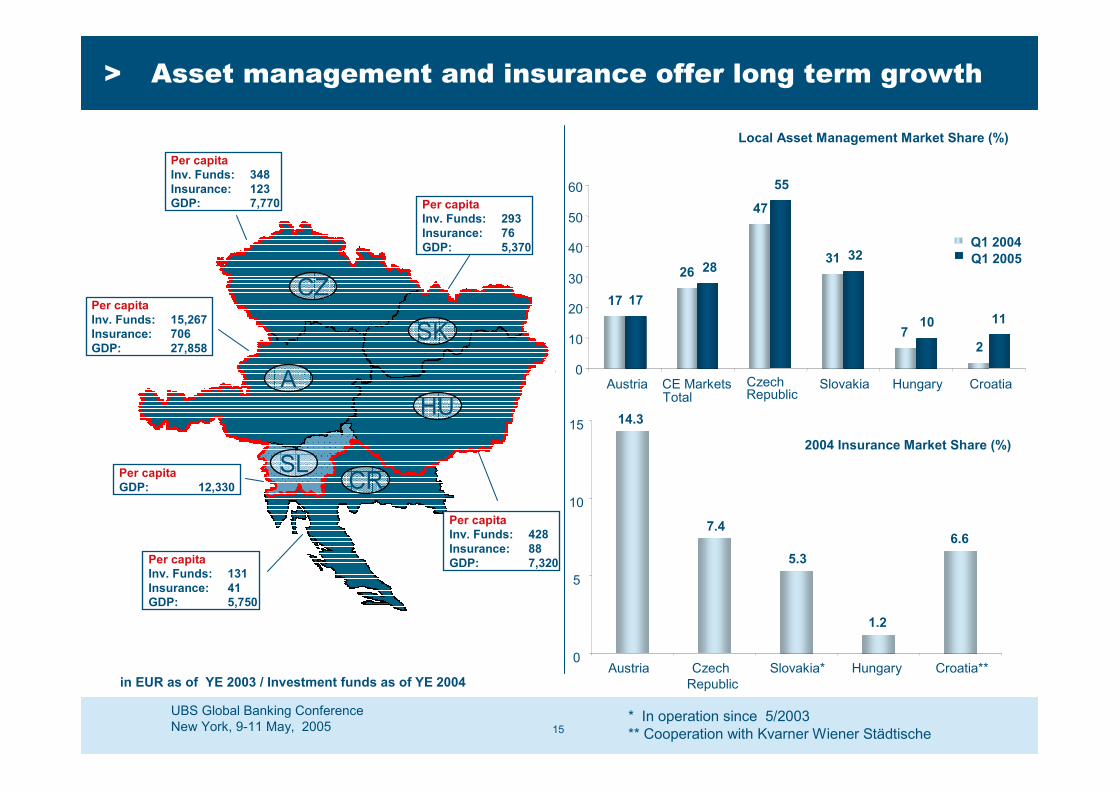
in EUR as of YE 2003 / Investment funds as of YE 2004
Per capitaInv. Funds: 348Insurance: 123GDP: 7,770
A
CZ
SL
SK
HU
CR
Per capitaInv. Funds: 293Insurance: 76GDP: 5,370
Per capitaInv. Funds: 428Insurance: 88GDP: 7,320Per capita
Inv. Funds: 131Insurance: 41GDP: 5,750
Per capitaInv. Funds: 15,267Insurance: 706GDP: 27,858
Per capitaGDP: 12,330
Local Asset Management Market Share (%)
* In operation since 5/2003** Cooperation with Kvarner Wiener Städtische
14.3
7.4
5.3
1.2
6.6
0
5
10
15
Austria CzechRepublic
Slovakia* Hungary Croatia**
2004 Insurance Market Share (%)
> Asset management and insurance offer long term growth
Q1 2004Q1 2005
17
26
47
31
72
17
28
55
32
10 11
0
10
20
30
40
50
60
Austria CE MarketsTotal
CzechRepublic
Slovakia Hungary Croatia

16
UBS Global Banking ConferenceNew York, 9-11 May, 2005
> Presentation topics
1. Where we are now
2. Growth drivers
3. Outlook and targets
4. Appendix

17
UBS Global Banking ConferenceNew York, 9-11 May, 2005
> Extending the home market
Moving from CE to CEE
Priorities» Evaluate smaller acquisitions in Hungary» Grow organically in Croatia» Target privatisation projects in Romania» Shortlisted in Novosadska banka sale in
Serbia
Criteria» Broaden the regional scope» Achieve growth in the CEE region in
markets that fit with existing network» in areas which offer real added value to
existing client base

18
UBS Global Banking ConferenceNew York, 9-11 May, 2005
> Group outlook and targets
Guidance 2005» Erste Bank is targeting net profit for the Group of EUR 660m in 2005» Guidance breakdown
» Austria: ROE – min 15%» CS: ROE – min 20%» SLSP: ROE ~ 20%» EB Hungary: ROE min 20%» EB Croatia: ROE 18% - 20%
Target 2006» Erste Bank is confident of reaching EUR 750m net profit in 2006» Resulting in a ROE of at least 18%» Based on a CIR no higher than 61%

19
UBS Global Banking ConferenceNew York, 9-11 May, 2005
> Presentation topics
1. Where we are now
2. Growth drivers
3. Outlook and targets
4. Appendix

20
UBS Global Banking ConferenceNew York, 9-11 May, 2005
Privateinvestors7.0%
> Current shareholder structure
Savings banks7.0%
32.5%
Employees1.9%
Institutional investors45.6%
Free float61.5%
By Investor TypeAustria Verein6.0%
Austria58.2%
Cont. Europe5.8%
UK & Ireland17.4%
North America17.7%
Others0.9%
By Region
Total numbers of shares: 241,442,892

21
UBS Global Banking ConferenceNew York, 9-11 May, 2005
Fax +43 (0)5 0100-13112E-mail: [email protected]: www.erstebank.com
Reuters: ERST.VI Bloomberg: EBS AVDatastream: O:ERS Securities ID: 065201
Gabriele WerzerTel: +43 (0)5 0100-11286 E-Mail: [email protected]
Thomas SommerauerTel: +43 (0)5 0100-17326 E-Mail: [email protected]
Monika PerausTel: +43 (0)5 0100-11282 E-Mail: [email protected]
> Investor relations contacts
Investor relations
Erste Bank, Graben 21, 1010 Vienna