Embed Size (px)
Citation preview

FONDATĂ1976
ISSN 1453-083X
MINISTRY OF EDUCATION, RESEARCH, YOUTH AND SPORT
2011GALATI UNIVERSITY PRESS
THE ANNALS OF“DUNAREA DE JOS” UNIVERSITY
OF GALATI
Fascicle IXMETALLURGY AND MATERIALS SCIENCE
YEAR XXIX (XXXIV),September 2011, no. 3

EDITORIAL BOARD
PRESIDENT OF HONOUR Prof. Olga MITOSERIU - ’’Dunarea de Jos’’ University of Galati, Romania
EDITOR-IN-CHIEF
Prof. Nicolae CANANAU - ’’Dunarea de Jos’’ University of Galati, Romania
EXECUTIVE EDITOR Prof. Marian BORDEI - ’’Dunarea de Jos’’ University of Galati, Romania
SCIENTIFIC ADVISORY COMMITTEE
Prof. Lidia BENEA – ’’Dunarea de Jos’’ University of Galati, Romania Acad. Prof. Ion BOSTAN - Technical University of Moldova, Moldova Republic Prof. Francisco Manuel BRAZ FERNANDES - New University of Lisbon Caparica, Portugal Acad. Prof. Valeriu CANTSER - Academy of Moldova Republic, Moldova Republic Prof. Jean Pierre CELIS - Katholieke Universiteit Leuven, Belgium Prof. Anisoara CIOCAN - ’’Dunarea de Jos’’ University of Galati, Romania Prof. Alexandru CHIRIAC - ’’Dunarea de Jos’’ University of Galati, Romania Assoc. Prof. Stela CONSTANTINESCU - ’’Dunarea de Jos’’ University of Galati, Romania Prof. Elena DRUGESCU - ’’Dunarea de Jos’’ University of Galati, Romania Prof. Valeriu DULGHERU - Technical University of Moldova, Moldova Republic Prof. Jean Bernard GUILLOT – École Centrale Paris, France Assoc. Prof. Gheorghe GURAU - ’’Dunarea de Jos’’ University of Galati, Romania Prof. Iulian IONITA – ‘‘Gheorghe Asachi’’ Technical University Iasi, Romania Prof. Philippe MARCUS - École Nationale Supérieure de Chimie de Paris, France Prof. Vasile MARINA - Technical University of Moldova, Moldova Republic Prof. Rodrigo MARTINS–NOVA University of Lisbon, Portugal Prof. Strul MOISA - Ben Gurion University of the Negev, Israel Prof. Daniel MUNTEANU - Transilvania University of Brasov, Romania Prof. Viorel MUNTEANU - ’’Dunarea de Jos’’ University of Galati, Romania Prof. Viorica MUSAT - ’’Dunarea de Jos’’ University of Galati, Romania Prof. Maria NICOLAE - Politehnica University Bucuresti, Romania Prof. Petre Stelian NITA - ’’Dunarea de Jos’’ University of Galati, Romania Prof. Pierre PONTHIAUX – École Centrale Paris, France Prof. Florentina POTECASU - ’’Dunarea de Jos’’ University of Galati, Romania Assoc. Prof. Octavian POTECASU - ’’Dunarea de Jos’’ University of Galati, Romania Prof. Cristian PREDESCU - Politehnica University Bucuresti, Romania Prof. Iulian RIPOSAN - Politehnica University Bucuresti, Romania Prof. Rami SABAN - Politehnica University Bucuresti, Romania Prof. Antonio de SAJA - University of Valladolid, Spain Prof. Wolfgang SAND - Duisburg-Essen University Duisburg Germany Prof. Ion SANDU – ’’Al. I. Cuza’’ University of Iasi Prof. Georgios SAVAIDIS - Aristotle University of Thessaloniki, Greece Prof. Ioan VIDA-SIMITI - Technical University of Cluj Napoca, Romania Prof. Mircea Horia TIEREAN - Transilvania University of Brasov, Romania Assoc. Prof. Petrica VIZUREANU – ‘‘Gheorghe Asachi’’ Technical University Iasi, Romania Prof. Maria VLAD - ’’Dunarea de Jos’’ University of Galati, Romania Prof. François WENGER – École Centrale Paris, France

FO N D ATĂ197 6
THE ANNALS OF “DUNAREA DE JOS” UNIVERSITY OF GALATI.
FASCICLE IX. METALLURGY AND MATERIALS SCIENCE N0. 3 – 2011, ISSN 1453 – 083X
Table of Content
1. Radu Comaneci, Costel Roman, Romeu Chelariu, Ioan Carcea - Finite Element Analysis of Equal Channel Angular Pressing of Al-Mg 5083 Alloy................................ 5
2. Yavor Lukarski, Sasho Popov, Nikolay Tonchev, Petia Koprinkova-Hristova, Silvia Popova - A Design of New Brands of Martenzite Steels by Artificial Neural Networks…........................................................................................................................ 10 3. Simona Boiciuc, Constantin Spânu - Determination of Friction Coefficient at Sliding Indentation of Laser Cladding with Ni – Cr – B – Fe – Al Alloy......................... 15 4. Ovidiu Dima, Nicolae Cananau, Dinel Tanase - Experimental Researches on the Lobe Deformation Process................................................................................................. 22 5. Anișoara Ciocan - Dioxins and Furans as Pollutant Emissions From Integrated Steel Works........................................................................................................................ 26 6. Constantin Bendrea, Viorel Munteanu - A Thermodynamic Contact Problem for Elastic-Viscoplastic Materials........................................................................................... 32 7. Gina Istrate, Petrica Alexandru, Olga Mitoseriu, Mihaela Marin - Morphology of Nickel Matrix Composite Coatings with Nano- Silicon Dispersion Phase................... 38 8. Rodica Wenkert, Carmen Paduraru, Lavinia Tofan, Strul Moisa - Spectrophotometric Determination of Os(VIII) with Nitroso R Salt as Chromogenic Reagent.............................................................................................................................. 42
9. Viorel Brânzoi, Florina Brânzoi, Alina Prună, Nicoleta Donisan - Electrochemical Deposition and Characterization of Doped Poly (3,4-Ethylene Dioxythiophene) for Potential Use as a Biosensor............................................................ 47
10. Mihaela Marin, Florentina Potecaşu, Elena Drugescu, Octavian Potecaşu, Petrică Alexandru - Effect of Fluidized- Bed Carburizing on Mechanical Properties and Abrasive Wear Behavior of Sintered Steels................................................................ 53 11. Vladimir Petkov, Radoslav Valov, Dimitar Teodossiev, Ina Yankova - A Possibility to Decrease the Sintering Temperature of Corundum Ceramics..................... 58 12. Luciana Rus, Marius Tintelecan, Monica Sas-Boca, Dan Noveanu, Ionut Marian - Superplastic Behavior of 2024 Aluminum Alloy Sheet Subjected to Thermomechanical Processing.......................................................................................... 61 13. Rositsa Gavrilova, Viktor Hadzhiyski - Synthesis and Spheroidization of Disperse High-Melting (Refractory) Powders in Plasma Discharge................................ 66 14. Diana Tanasa, Narcisa Vrinceanu, Claudia-Mihaela Hristodor, Eveline Popovici, Diana Coman, Florin Brinza, Ionut Lucian Bistricianu, Daniela Lucia Chicet - A Comparative Approach of Degradative Potential of Two Different Nanophotocatalysts onto a Model Textile Dye.................................................................. 71
- 3 -
FO N D ATĂ19 76
THE ANNALS OF “DUNAREA DE JOS” UNIVERSITY OF GALATI.
FASCICLE IX. METALLURGY AND MATERIALS SCIENCE N0. 3 – 2011, ISSN 1453 – 083X
FINITE ELEMENT ANALYSIS OF EQUAL CHANNEL ANGULAR PRESSING OF Al-Mg 5083 ALLOY
Radu COMANECI, Costel ROMAN,Romeu CHELARIU,
Ioan CARCEA
Technical University ”Gh. Asachi” from Iasi email: [email protected]
ABSTRACT
Bulk nanostructured materials represent the application of nanotechnology in
the engineering material area. Severe Plastic Deformation (SPD) and in particular Equal Channel Angular Pressing (ECAP) are efficient and low cost top-down methods for producing ultrafine or nanostructured bulk materials. Alluminum alloys are very popular materials used for production of ultrafine-grained and nanomaterials by SPD. Understanding both the contact phenomenon at the interface between die and the workpiece in terms of material flow and phenomena associated with strain and forming load in ECAP process becomes important. In this paper, a tridimensional Finite Element Analysis of ECAP was performed for Al-Mg 5083 alloy.
KEYWORDS: severe plastic deformation, equal channel angular pressing,
alluminum
1. Introduction Materials with ultrafine – grains (UFG) or
nanometric structures (NS) offer significant advantages in terms of large strength, hardness and ductility or high strain rate superplasticity [1]. They have great impact in biomedical, electronics, military, aerospace, and automotive. Industries and academics have shown great interest in fabrication of NS materials with high performance to weight ratio such as Al, Mg, Al-Mg etc.
Wrought non heat-treatable Al-Mg alloys are attractive for different components due to their good weldability, moderate strength, but excellent corrosion resistance. Increasing strength by SPD without any supplementary alloying is a convenient way to raise up the potential of the material while maintaining all other mechanical properties. At the same time, developing superplasticity, the material reaches ultrafine structure with reasonable thermal stability, without the presence of secondary phase due to special alloying elements. In these conditions, there is considerable interest in using Al-Mg alloys for structural applications.
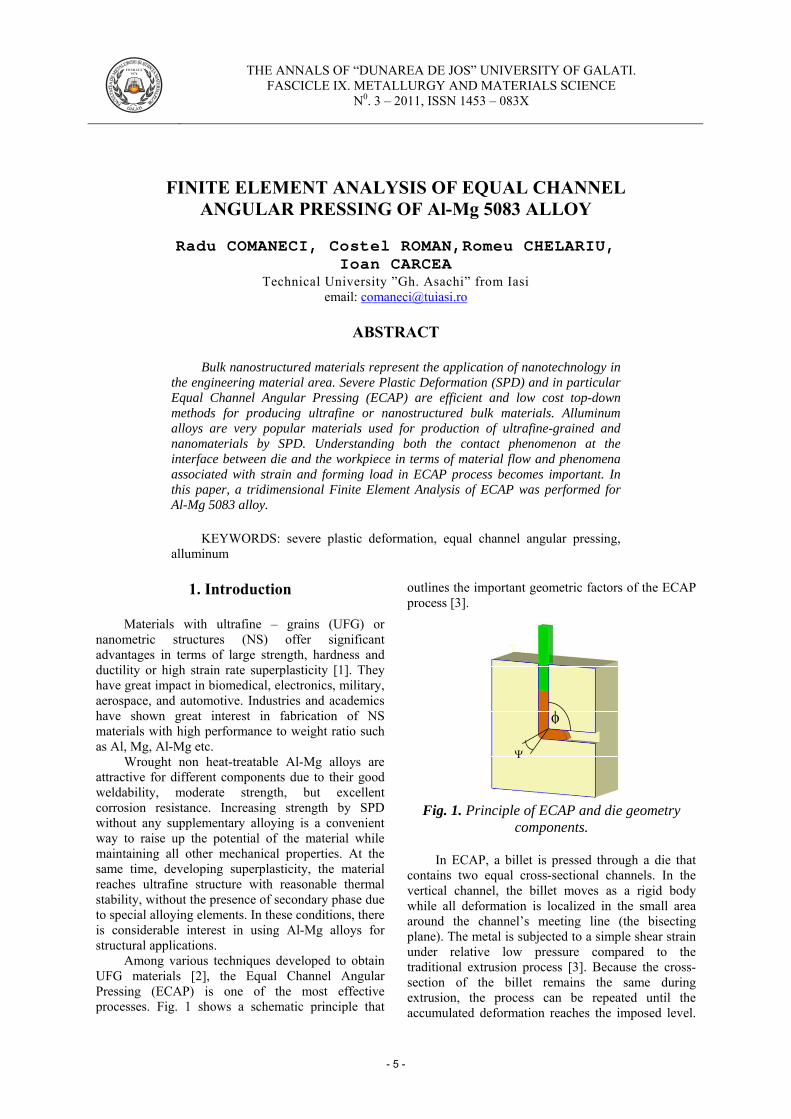
Among various techniques developed to obtain UFG materials [2], the Equal Channel Angular Pressing (ECAP) is one of the most effective processes. Fig. 1 shows a schematic principle that
outlines the important geometric factors of the ECAP process [3].
Fig. 1. Principle of ECAP and die geometry components.
In ECAP, a billet is pressed through a die that
contains two equal cross-sectional channels. In the vertical channel, the billet moves as a rigid body while all deformation is localized in the small area around the channel’s meeting line (the bisecting plane). The metal is subjected to a simple shear strain under relative low pressure compared to the traditional extrusion process [3]. Because the cross-section of the billet remains the same during extrusion, the process can be repeated until the accumulated deformation reaches the imposed level.
φ
Ψ
- 5 -

FO N D ATĂ19 76
THE ANNALS OF “DUNAREA DE JOS” UNIVERSITY OF GALATI.
FASCICLE IX. METALLURGY AND MATERIALS SCIENCE N0. 3 – 2011, ISSN 1453 – 083X
The billet removal involves a new development of ECAP procedure. The introduction of a new sample returns the ECAP process to the initial configuration which permits the next pressing cycle to follow. The new sample is inserted and pressed from the top and the previous sample moves to the right trough the horizontal channel of die.
As the microstructures and the mechanical properties of the plastic-deformed materials are directly related to the degree of plastic deformation, the understanding of the strain and stress development is very important in a successful ECAP process design. The theoretical effective strain according to the die geometry is given in Eq. (1), as formulated by Iwahashi et al. [4]:
⎥⎦
⎤⎢⎣
⎡⎟⎠⎞
⎜⎝⎛ ψ
+φ
ψ+⎟⎠⎞
⎜⎝⎛ ψ
+φ
=ε22
eccos22
ctg23
1
(1)
where the significance of terms are revealed in Fig.1. For φ = 90° and ψ = 0, an equivalent strain of 1.15 is achieved. Note that Eq. (1) was derived for ideal perfect-plastic behavior and frictionless conditions.
From the technological point of view, a successful SPD process requires to surpass two obstacles. First the load level (which directly affects the tool design) and second an adequate formability of the material so that it can withstand high degrees of repeated deformation. Unfortunately there are no criteria which ensure a guaranteed successful SPD of the material. Only a favorable stress distribution can decide the success of SPD.
Designing both processing and tools needs to take into account the deformation behavior of the billet in combination with effects of strain hardening, friction and die geometry. In this paper, a tridimensional FEA is performed to analyze the ECAP process of Al-Mg 5083 alloy. The purpose of FEA is to evaluate load level, strain and stress distribution during severe plastic deformation in order to successfully pursue the future ECAP processes.
2. Experimental approach and procedures
2.1. Finite Element Analysis
To carry out the simulation, commercial finite element code DEFORM was used. The workpiece (10x10x60mm) consisting a plastic body in whole deformation process was discretized in 8000 tetrahedral elements (this is equivalent to at least 36 elements across the width of the billet). The tolerance, positioning of the workpiece and top/bottom die, convergence criteria, re-meshing conditions, and boundary conditions were specified before the execution of the simulation process.
Adaptive meshing was used in the simulation. Poisson’s ratio 0.33 and Young’s modulus 69GPa were assumed.
The hardening behavior is considered isotropic and independent of strain rate at room temperature. The simulation was performed at room temperature for a stroke of about 50 mm under a constant speed of 8.75 mm/s.
The friction force along contact surfaces was modeled by constant shear friction law Fr = m·το where το is the yield stress in shear and m = 0.12 is the friction coefficient [5].
The die considered for analysis corresponds to high strength hardened steel with the channel angle φ = 90° and outer corner radius of 2 mm which means ψ ≈ 12°.
2.2. Processing Al-Mg 5083
A commercial available AA 5083 with a composition in wt.% of 4.5%Mg, 0.7%Mn and aluminum balance was used in this study. Specimens with dimensions of 10x10x60mm were machined from as-received alloys. A subsequent annealing at 723K for 1h was performed before ECAP. The ECAP process was conducted at room temperature (Fig. 2) with a constant speed of 8.75 mm/s, using a die with φ = 90° and ψ = 12°. All samples and inner walls of the dies channels were lubricated using zinc stearate.
Fig.2. Experimental device for ECAP.
3. Results and discussions
3.1. Working load and model validation Matching of simulates with experimental load
data is important to validate the modeling we have used. Fig.3 shows the load – displacement curve during the ECAP of AA 5083. Four stages can be distinguished on the curve (Fig.3) [5].
In Stage I, the load increases rapidly with the ram displacement, reaching a maximum. This stage begins when the head of the billet first touches the bottom wall of the die channel at the outer corner and ends when the workpiece head bends over the corner. In Stage II the load decreases until the upper surface of the billet begins to touch the upper wall of the outlet channel.
- 6 -

FO N D ATĂ19 76
THE ANNALS OF “DUNAREA DE JOS” UNIVERSITY OF GALATI.
FASCICLE IX. METALLURGY AND MATERIALS SCIENCE N0. 3 – 2011, ISSN 1453 – 083X
I II III IV
Fig.3. Experimental load – displacement curve for one pass ECAP of AA 5083.
In the next stage (Stage III), a slow increase in
load marks the period from the moment the billet head touches the upper wall (end of Stage II) to the moment when sufficient contact is established between the upper surface of the billet head and the upper wall of the outlet channel. The load increases because of the deformation in the billet head.
The load decreases gradually with the displacement in Stage IV.
Fig.4. Predicted load evolution for the first pass ECAP of AA 5083 (simulation).
When the billet is pressed from the inlet channel
to the outlet channel through the die corner, the contact area in the inlet channel decreases and in the meantime the length of the gap in the outlet channel grows until the head of the billet comes out of the outlet channel. As a result, the total contacting area between the billet and the die wall always decreases with the ram displacement, and so when we have real
friction, the response is visible in the load versus displacement curve.
Fig 4 shows the predicted load evolution for the first pass ECAP of the investigated alloy. The maximum level of working-load and the general evolution are in good agreement with experimental results, confirming the validity of the ECAP modeling.
3.2. Strain and stress distribution
Theoretically, uniform strain in the entire sample can be achieved if the deformation follows simple shear perfectly.
Fig.5. Strain distribution - ECAP of AA 5083 (longitudinal section).
As the workpiece exits from the plastic deformation zone, the strain distribution starts to stabilize and there are no further variations in the strain. It is shown that at the middle of the total deformation step, a steady state deformation behavior is found. The deformation histories are different for the head part and the tail part. It is obvious that transient regions of the head and tail ends receive smaller amounts of strain. Figure 5 shows strain distribution as a color map for the first ECAP pass of the investigated alloy. The non-uniform strain achieved in plastic deformation zone (PDZ) and the origin of inhomogeneous behavior are well-known [6]. A few equidistant tracking points (P1…P4) are defined in longitudinal section of the workpiece across the PDZ in order to estimate strain distribution after the material leaves the main deformation area
- 7 -

FO N D ATĂ19 76
THE ANNALS OF “DUNAREA DE JOS” UNIVERSITY OF GALATI.
FASCICLE IX. METALLURGY AND MATERIALS SCIENCE N0. 3 – 2011, ISSN 1453 – 083X
corresponding to the bisecting plane of the die channels (fig.6).
Naturally and according to Eq. (1), the outer corner radius determines a decrease of the effective strain. Final average strains from the steady-state region are in good agreement with those given by Eq. (1).
P1
P4
Fig.6. Strain distribution in longitudinal section for the tracking point P1-P4 of PDZ.
The effective stress distribution (Fig. 7) shows high effective stresses in PDZ and in the region prior to PDZ. This is due to the intense compressive action within the inlet channel of the die.
Note that effective stresses are always positive no matter the stress type (compression or tensile stress).
Fig.7. Effective stress distribution - ECAP of AA 5083 (longitudinal section).
But, if principal stresses are revealed as maximum positive stresses in the same area as in the effective stress distribution, it means that the region is dominated by tensile tensions which can cause cracks in the workpiece, fig.8. So, the maximum principal stress distribution becomes relevant.
Fig.8. Cracking during ECAP process. Cracks start from upper surface of the billet.
The nature of cracking on upper surfaces of the
billet can be depicted from the principal stress distribution (Fig.9). High positive maximum principal stresses occur along the top surface of the billet in the exit channel immediately after the plane of channels intersection. This fact is confirmed by other authors [7].
Fig.9. Principal stress distribution - ECAP of AA 5083 (longitudinal section).
4. Summary and conclusions
Finite Element Analysis was performed to
evaluate ECAP process of AA 5083. The analysis shows the maximum estimated load level which is found in very good agreement with experiments on severe plastic deformations of AA 5083.
At the same time, simulations suggest that the accumulation of high positive maximum stresses on
- 8 -

FO N D ATĂ19 76
THE ANNALS OF “DUNAREA DE JOS” UNIVERSITY OF GALATI.
FASCICLE IX. METALLURGY AND MATERIALS SCIENCE N0. 3 – 2011, ISSN 1453 – 083X
the upper surface of the billets is the main cause of appearance of the cracks on the mentioned area. If the stresses surpass the strength of the material, a technological solution including die geometry and/or processing temperature must be considered for a successful pursue of equal channel angular pressing.
Using the obtained results, tool and process design will become more accurate with all the benefits for research implementation.
References
[1]. B.Q. Han, E.J. Lavernia, and F.A. Mohamed - Mechanical Properties of Nanostructured Materials, Rev. Adv. Mater. Sci. 9 (2005) 1-16. [2]. A. Azushima, R. Kopp, A. Korhonen, D.Y. Yang, F. Micari, G.D. Lahoti, P. Groche, J. Yanagimoto, N. Tsuji, A.
Rosochowski, and A. Yanagida - Severe plastic deformation (SPD) processes for metals, CIRP Annals - Manufacturing Technology 57 (2008) 716–735. [3]. V.M. Segal - Materials processing by simple shear, Mater. Sci. Eng. A 197 (1995) 157–164. [4]. Y. Iwahashi, M. Furukawa, Z. Horita, M. Nemoto, and T.G. Langdon - Microstructural Characteristics of Ultrafine-Grained Aluminum Produced Using Equal-Channel Angular Pressing, Metall. Mater. Trans. 29(9) (1998) 2245-2252 [5]. S. Li, M.A.M. Bourke, I.J. Beyerlein, D.J. Alexander, and B. Clausen - Finite element analysis of the plastic deformation zone and working load in equal channel angular extrusion, Mater. Sci. Eng. A, 382 (2004) 217–236. [6]. Wei Wei, A.V. Nagasekhar, G. Chen, Yip Tick-Hon, and Kun Xia Wei - Origin of inhomogenous behavior during equal channel angular pressing, Scripta Mater., 54 (2006) 1865–1869. [7]. R.B. Figueiredo, P.R. Cetlin, and T.G. Langdon - The evolution of damage in perfect-plastic and strain hardening materials processed by equal-channel angular pressing, Mater. Sci. Eng. A 518 (2009) 124–131.
- 9 -

FO N D ATĂ197 6
THE ANNALS OF “DUNAREA DE JOS” UNIVERSITY OF GALATI.
FASCICLE IX. METALLURGY AND MATERIALS SCIENCE N0. 3 – 2011, ISSN 1453 – 083X
A DESIGN OF NEW BRANDS OF MARTENZITE STEELS BY ARTIFICIAL NEURAL NETWORKS
Yavor LUKARSKI1, Sasho POPOV1, Nikolay TONCHEV2,
Petia KOPRINKOVA-HRISTOVA3, Silvia POPOVA3 1Institute of Metal Science, Technology and Equipment “Acad. A. Balevski”,
Bulgarian Academy of Sciences, Sofia, Bulgaria 2 University of Transport “Todor Kableshkov”-Sofia, Bulgaria
3 Institute of System Engineering and Robotics, Bulgarian-Academy of Sciences, Sofia, Bulgaria
e-mails: [email protected]; [email protected]; [email protected]
ABSTRACT
The paper proposes a model-based approach for the design of martenzite
structure steels with improved mechanical and plastic characteristics using proper composition and thermal treatment. For that purpose, artificial neural models approximating the dependence of steels strength characteristics on the percentage content of alloying components were trained. These non-linear models are further used within an optimization gradient procedure based on backpropagation of utility function through neural network structure. In order to optimizing the steel characteristics via its chemical composition, several steel brands with high values of tensile strenght, yield strenght and relative elongation were designed. A steel composition having economical alloying and proper for practical application was determined comparing several obtained decisions. The usage of that steel will lead to lightening of the hardware for automobile industry.
KEYWORDS: metal materials, high strength steels, composition optimization,
neural networks
1. Introduction
Metallurgy and, in particular, steel production for motor industry have develop faster during the last decades. On the one hand, methods and technologies for characteristics optimization of known steel brands are looked for, on the other hand, a lot of research efforts are targeted to designing new steel brands with improved physical-chemical and mechanical characteristics.
Especially for the steels used in motor industry, the research aim is to decrease the weight of the final product applying high strength steels. The number of high strength steels application increase because they are able to meet at the same time the contradictive requirements for better deformability, weldability, resistance to stress, fatigue, and corrosion.
Since the motor vehicles are the biggest source of pollutants of the environment (producing harmful emissions of CO2= 0,2 kg/km), nowadays a lot of efforts are targeted to their weight decreasing. This
will lead to improvement of their combustible efficiency and as a result, to the decrease of harmful emissions decrease. In [1] several innovative approaches related to economy of fuel, the decrease of harmful emissions and recycling are described. It is demonstrated that the use of high strength steels allows decreasing car carriage weight with 25%, and it is expected to achieve even 35 % weight decrease using the new generation of high strength steels that are still under development.
While the strength of the most common application steels varies in the range of 440–590 МPа, a part of special components of steels have tensile strength about 980–1180 Мра. High strength foliate steels still have restricted application because of their restricted plasticity. In Nippon Steel Corporation, three brands of high strength steels (980 МРа) are designed and introduced into vehicle production. [2].
Moreover from the functional and economic point of view the high strength steels appear to be the best material for the mentioned application. The iron
- 10 -

FO N D ATĂ197 6
THE ANNALS OF “DUNAREA DE JOS” UNIVERSITY OF GALATI.
FASCICLE IX. METALLURGY AND MATERIALS SCIENCE N0. 3 – 2011, ISSN 1453 – 083X
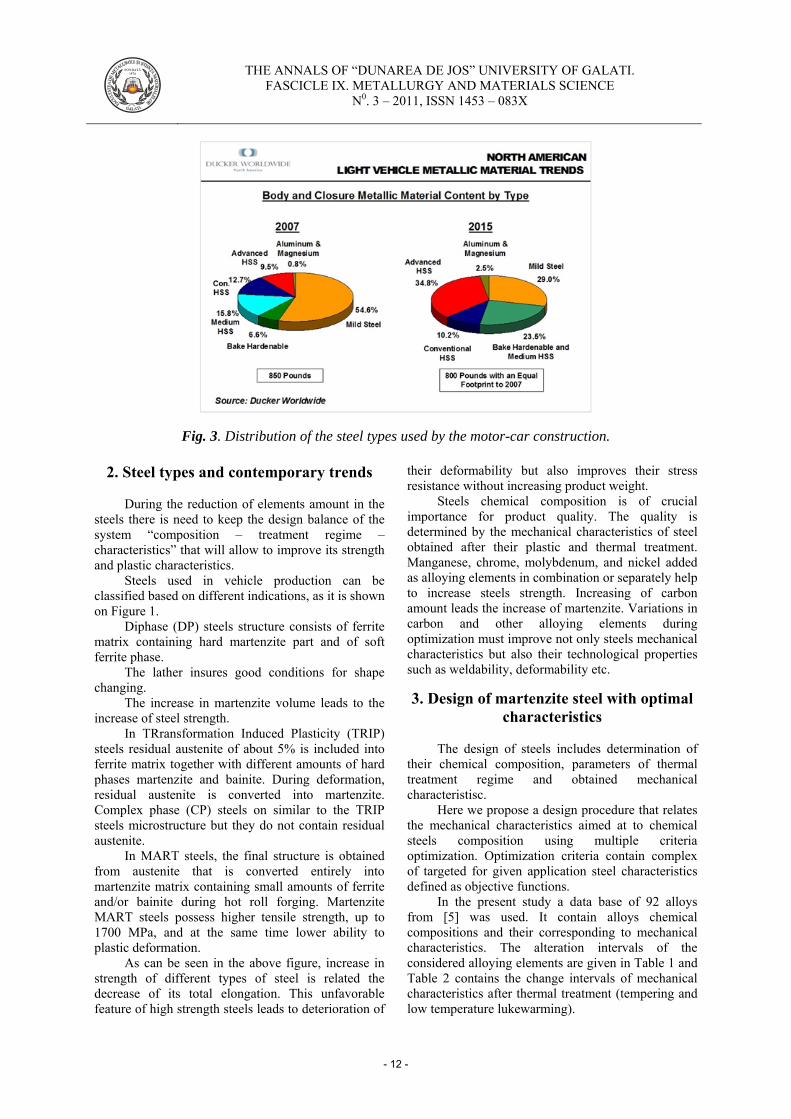
based materials ensure such a structure and properties that absorb the shock energy. The quick elaboration of the steels applied for motor-car construction leads to definition of steel classes denoted by AHSS (Advanced High Strength Steels). In 2002 a project ULSAB - AVS (Ultra _ Light Steel Autobody) started. Fig. 3 shows that the average value of the tensile strength for the developed steels increases from 413 MPa to 758 MPa [3]. Together with the increasing values of the strength there is also a tendency towards improved deformability. The ULSAB - AVS project applies the high strength steels for parts of the entire car. In an investigation of the model Audi A1, one can see that the quota of the high
strength steels is approximately two times greater than the conventional low carbon steels. Farahani [4] gives an investigation published by the International Council on Clean Transportation that represent different ways for development.
The short-term plan foresees that in 2014 the mild steel will be changed with the high strength steels. For the analysis a Toyota Venza (model from 2009) has been chosen. The aim is a reduction of the total mass with 20%.
This study presents a new contemporary method for design of optimized iron-based alloy composition using artificial neural networks (ANN) accounting for economic alloying at the same time.
Fig. 1. Areas of variance of steels quality characteristics according to the program ULSAB–AVC.
Fig. 2. Change of the average value of the materials tensile strength at different
motor-car construction projects.
- 11 -
FO N D ATĂ197 6
THE ANNALS OF “DUNAREA DE JOS” UNIVERSITY OF GALATI.
FASCICLE IX. METALLURGY AND MATERIALS SCIENCE N0. 3 – 2011, ISSN 1453 – 083X
Fig. 3. Distribution of the steel types used by the motor-car construction.
2. Steel types and contemporary trends
During the reduction of elements amount in the steels there is need to keep the design balance of the system “composition – treatment regime – characteristics” that will allow to improve its strength and plastic characteristics.
Steels used in vehicle production can be classified based on different indications, as it is shown on Figure 1.
Diphase (DP) steels structure consists of ferrite matrix containing hard martenzite part and of soft ferrite phase.
The lather insures good conditions for shape changing.
The increase in martenzite volume leads to the increase of steel strength.
In TRransformation Induced Plasticity (TRIP) steels residual austenite of about 5% is included into ferrite matrix together with different amounts of hard phases martenzite and bainite. During deformation, residual austenite is converted into martenzite. Complex phase (CP) steels on similar to the TRIP steels microstructure but they do not contain residual austenite.
In MART steels, the final structure is obtained from austenite that is converted entirely into martenzite matrix containing small amounts of ferrite and/or bainite during hot roll forging. Martenzite MART steels possess higher tensile strength, up to 1700 MPa, and at the same time lower ability to plastic deformation.
As can be seen in the above figure, increase in strength of different types of steel is related the decrease of its total elongation. This unfavorable feature of high strength steels leads to deterioration of
their deformability but also improves their stress resistance without increasing product weight.
Steels chemical composition is of crucial importance for product quality. The quality is determined by the mechanical characteristics of steel obtained after their plastic and thermal treatment. Manganese, chrome, molybdenum, and nickel added as alloying elements in combination or separately help to increase steels strength. Increasing of carbon amount leads the increase of martenzite. Variations in carbon and other alloying elements during optimization must improve not only steels mechanical characteristics but also their technological properties such as weldability, deformability etc.
3. Design of martenzite steel with optimal
characteristics
The design of steels includes determination of their chemical composition, parameters of thermal treatment regime and obtained mechanical characteristisc.
Here we propose a design procedure that relates the mechanical characteristics aimed at to chemical steels composition using multiple criteria optimization. Optimization criteria contain complex of targeted for given application steel characteristics defined as objective functions.
In the present study a data base of 92 alloys from [5] was used. It contain alloys chemical compositions and their corresponding to mechanical characteristics. The alteration intervals of the considered alloying elements are given in Table 1 and Table 2 contains the change intervals of mechanical characteristics after thermal treatment (tempering and low temperature lukewarming).
- 12 -
FO N D ATĂ197 6
THE ANNALS OF “DUNAREA DE JOS” UNIVERSITY OF GALATI.
FASCICLE IX. METALLURGY AND MATERIALS SCIENCE N0. 3 – 2011, ISSN 1453 – 083X
Table 1. Alteration intervals of investigated steels alloying elements
Element C Si Mn Ni S Р Cr Mo V min, % 0.12 0.27 0.27 0 0.025 0.025 0.15 0 0 max, % 0.5 1.4 1.6 4.22 0.035 0.35 2.5 1.5 0.15
Table 2. Alteration intervals of investigated steels mechanical characteristics
Mechanical characteristic
Rm, MPa
Re, MPa
A, %
Z, %
KCU, KJ/m2
HB*10-1, MPa
min 500 300 7 30 290 179 max 1670 1375 26 70 1830 541
For steel composition optimization purposes,
developed in [6] a methodology based on ANN was applied.
The first step is to train neural network model approximating non-linear dependence between alloying elements amounts and obtained after thermal treatment of the mechanical characteristics of the given steel. Our former investigations [6] showed that due to insufficient data it is impossible to train a single accurate NN model for predicting all investigated mechanical characteristics. Here we trained separate NN models for each of the mechanical characteristics from Table 2. Since the amounts of sulfur and phosphorus in all investigated steels are equal, they are considered as one variable. The NN structure as in [4] is 8:40:1. The number of inputs is defined by the number of alloying elements, i.e. eight. All NN models have single output neuron for the modeled one of the mechanical characteristics. The number of hidden units was determined by trail and error as in [6].
We also had to account that the database we have is relatively small and it do not contain all the possible combinations between alloying elements. Because of that we divide the available data into 18 smaller data sets used for training of 18 NN models excluding each time one of the data sets for testing. Then the best model for each of the mechanical characteristics was chosen based on smaller testing error.
Because the investigated input/output space is multidimensional and the modeling dependencies are non-linear, in order to find global optima during optimization we need to explore the entire input space. However, due to huge number of possible combinations, this is a time and resource demanding task. That is why here we apply gradient the procedure proposed in [6]starting from numerous different initial points. Finally, the obtained optimal compositions are compared and the best ones were chosen.
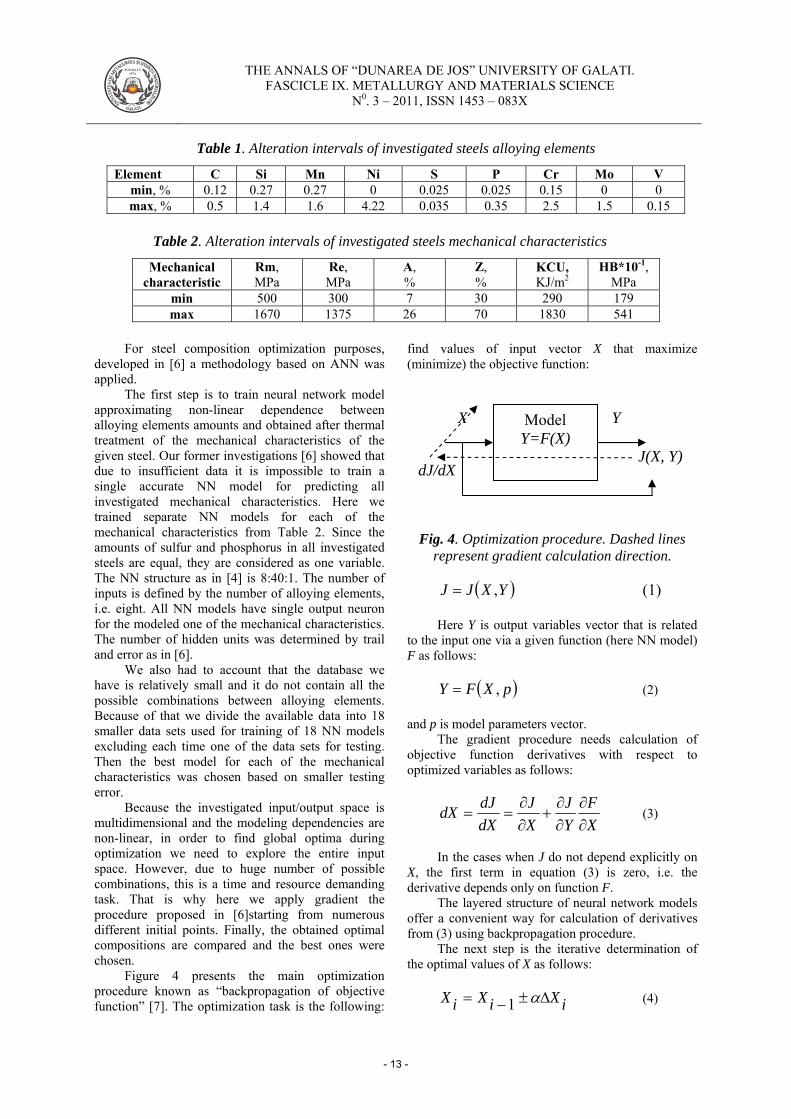
Figure 4 presents the main optimization procedure known as “backpropagation of objective function” [7]. The optimization task is the following:
find values of input vector X that maximize (minimize) the objective function:
Fig. 4. Optimization procedure. Dashed lines
represent gradient calculation direction.
( )YXJJ ,= (1) Here Y is output variables vector that is related
to the input one via a given function (here NN model) F as follows:
( )pXFY ,= (2)
and p is model parameters vector. The gradient procedure needs calculation of
objective function derivatives with respect to optimized variables as follows:
XF
YJ
XJ
dXdJdX
∂∂
∂∂
+∂∂
== (3)
In the cases when J do not depend explicitly on
X, the first term in equation (3) is zero, i.e. the derivative depends only on function F.
The layered structure of neural network models offer a convenient way for calculation of derivatives from (3) using backpropagation procedure.
The next step is the iterative determination of the optimal values of X as follows:
iXiXiX Δ±−= α1 (4)
Model Y=F(X)
X Y
J(X, Y) dJ/dX
- 13 -

FO N D ATĂ197 6
THE ANNALS OF “DUNAREA DE JOS” UNIVERSITY OF GALATI.
FASCICLE IX. METALLURGY AND MATERIALS SCIENCE N0. 3 – 2011, ISSN 1453 – 083X
Here α is a parameter called learning rate and
iXΔ is a step change of X at i-th iteration calculated
as follows:
( )idXgiX =Δ (5)
Here g is a function defining the gradient. Usually it is proportional to dXi but in some cases it
could depend also on previous values of iXΔ . Here
we used simple gradient procedure with
idXiX =Δ . The learning rate α is chosen relatively
small and stopping criteria were very small change in objective function.
In our case the input vector X consists of concentrations of 8 alloying elements and the output vector – of corresponding steel mechanical characteristics.
The following optimization tasks were solved: A.Single criteria optimization- maximization of Re:
maxRe1 →=J (6)
Table 3. Chosen optimal compositions,%
Decision Compounds/ characteristics
№1 №2 №3
C 0.27 0.3 0.26 Si 1.10 1.02 1.24 Mn 1.06 1.2 1.18 Ni 2.36 2.35 2.78 S 0.02 0.02 0.02 P 0.02 0.02 0.02 Cr 1.04 0.96 1.26 Mo 0.15 0.18 0.23 V 0.0087 0.0087 0..022 Rm, MPa 1666.9 1678. 1647.5 Re, MPa 1370.3 1355 1370.9 A, % 11.4 12.8 12.2 Z, % 51.1 52.3 54.1 HB 281.6 284.3 287.4
B.Two-criteria optimization: simul-taneous maximization of Re and of the ratio Rm/Re:
maxRe1 →=J ,
maxRe2 →=RmJ (7)
In both cases, the restriction C≤0.3 was imposed aimed at obtaining low carbon steels.
After applying the above optimization procedure, three optimal decisions were chosen. They are shown in Table 3 below. The first two of them maximize Re while the third one maximizes the ration Rm/Re.
Finally, composition № 2 is chosen because it is the most economical one.
Acknowledgment
This work was supported by the Bulgarian National Science Fund under the Project No DDVU 02/11 “Characteristic modeling and composition optimization of iron-based alloys used in machine-building industry”.
Conclusion
Here we presented an approach to design
optimal steel compositions for transport vehicles industry. The applied methodology on bases in artificial neural networks. Via optimization of mechanical characteristics on base of the chemical composition of the steel, the values of tensile strength and yield strength are kept high at total elongation of about 12%.
References [1]. Krupizer, R. A - Process of Decoupling and Developing Optimized Body Structure for Safety Performance, 10th European LS-DYNA Conference, March 18, 2004. [2]. Development of High Strength Steels for Automobiles, Nippon steel technical report No.88, July, 2003. [3]. ULSAB-AVC, Advanced Vehicle Concepts Program Results, CD March 2002, www.ulsab-avc.org [4]. Farahani A. R. Kolleck - Hot Forming and Cold Forming—Two Complementary Processes for Lightweight Auto Bodies, Proceedings from The International Conference „New Development in Sheet Metal. Forming Technology,” Stuttgart, Germany, 2004, pp. 235-244. [5]. http://www.splav.kharkov.com/choose_type.php. [6]. Koprinkova-Hristova, P., Tontchev, N., Popova, S. - Neural networks for mechanical characteristics modeling and compositions optimization of steel alloys, Int. Conf. Automatic and Informatics’10, Oct. 3-7, 2010, Sofia, Bulgaria, pp.I-49 – I-52 [7]. Werbos, P.J. - Backpropagation through Time: What It Does and How to Do It. Proceedings of the IEEE vol. 78(10), pp.1550-1560, 1990.
- 14 -

FO N D ATĂ197 6
THE ANNALS OF “DUNAREA DE JOS” UNIVERSITY OF GALATI.
FASCICLE IX. METALLURGY AND MATERIALS SCIENCE N0. 3 – 2011, ISSN 1453 – 083X
DETERMINATION OF FRICTION COEFFICIENT AT SLIDING INDENTATION OF LASER CLADDING WITH
Ni – Cr – B – Fe – Al ALLOY
Simona BOICIUC, Constantin SPÂNU ,,Dunarea de Jos” University of Galati
email: [email protected]
ABSTRACT
To increase resistance to wear of the surface layers made from 0.45% C steel, a multilayer deposit by powder injection with the chemical composition Cr 8.9%, 4.5% Fe, 5.1% B, 2, 4% Al, 0.6% Cu, and Ni was tested in a molten bath with a continuous wave of CO2 laser, coupled to a table within x-y-z coordinates. The layers were characterized by microstructural analysis, qualitative analysis of phase with the radiation difractometry X and EDX microanalysis. It was determined the friction coefficient developed during sliding indentation in dry friction conditions.
KEYWORDS: laser cladding, powder injection, sliding indentation
1. Introduction
The sliding indentation test is today widely
used, especial by the coating industry and coating development laboratories, as well as in research for evaluating the tribological properties of coatings and other hard surfaces. Different standards were elaborated in Europe and USA [1, 5].
In the sliding indentation test, an indenter (in this case a ball bearing) is pressed by a normal force on the workpiece surface, while being pushed by a force tangential to it.
Under static or quasi – static load application, maintaining the contact operating conditions requires limiting the plastic deformation in the contact area.
For the development of plastic deformation in a hertzian contact, the steps below are followed [1, 2, 3].
smoothing the contacting roughness, with the total deformation less than 0.1 μ m;
plastic deformation of surface roughness up to the formation of continuous contact surface with deformations of 0,1 to 10 μm;
plastic volume deformation when exceeding the limit of elasticity, as a result of the material flowing beneath the contact surface, the plastic deformation exceeds 10 μm, and the material moves from the contact zone without dislodging the base material;
seizing, which occurs at increasing deformation and implies adhesion, detachment and accumulation of material on the contact surfaces.
A material behaviour within an elasto-plastic range depends on: construction parameters (shape, dimensions) and operating parameters (kinematics, energy, environmental) of the contact; the surface layer parameters - microgeometry, metallurgical characteristics (chemical composition, purity, microstructure) and mechanical parameters (hardness, tension) [6].
It was found [1, 2, 3, 4, 6] that the value of the hertzian stress at which plastic deformation occurs in contact increases with the surface hardness. Also, the larger the frictional forces, the lower the plastic deformation where the seizing tendency occurs.
The choice of surface hardening processes, suitable to a certain material, is an important way to increase the bearing capacity of the contacting surface and reduce the tendency of seizing. Thus laser cladding with alloy Ni - Cr - B - Fe - Al constitutes an effective way to increase the surface hardness that directly affects their behavior to plastic deformation.
The characterization of the surface layers can be highlighted by an installation with a point contact sphere-plane which provides a sliding indentation in dry friction conditions. The evolution of the plastic deformation of the material tested when applying various normal forces led to the determination of the friction coefficients as an indicator of the seizing tendency.
According to the literature [1, 2, 3, 4, 6], the surface hardened materials transition from elastic to plastic deformation is continuous, so that the strain at the beginning of the plastic deformation (δ p = 0.1 to
- 15 -
FO N D ATĂ197 6
THE ANNALS OF “DUNAREA DE JOS” UNIVERSITY OF GALATI.
FASCICLE IX. METALLURGY AND MATERIALS SCIENCE N0. 3 – 2011, ISSN 1453 – 083X
10 μm) can be expressed with an acceptable approximation by Hertz's equations.
For the point contact sphere-plane, the features are:
- Hertzian pressure: 3/1
23
2*
max6
⎟⎟⎠
⎞⎜⎜⎝
⎛⋅⋅
=REFP
π (1)
where: F – normal force, E* - reduced elasticity module, R – indentor radius, Pmax max pressure at Hertzian contact.
2
22
1
21
*
111EEEνν −
+−
= (2)
where: ν1 , ν2 - Poisson coefficients, E1, E2 elasticity modules of the indenter and surface being tested.
There is a linear relation between the material yielding point and hardness [7, 8, 9].
Thus: for non hardened material, cσ⋅−= 3) (2,9 HV (3)
and for isotropic hardened materials, acc.to [10], cσ⋅= 2,475 HV (4)
The calculation of the friction coefficient developed during the testing was carried out using the formula:
nmed
fmedmed F
F=μ (5),
where: fmedF : the average friction force;
nmedF : the average normal force the friction forces being recorded by means of a force transducer.
This paper presents a study of the elasto – plastic behavior of some laser cladded samples with alloys of Ni - Cr - B - Fe - Al (code A and B) and the base material (code Mb) made from steel improved 1C45, SR EN 10083-1 : 2007.
The samples obtained were examined by metallographical, qualitative analysis of phase with the radiation difractometry X and EDX microanalysis. There were determined the friction coefficients developed.
2. Experimental conditions
For cladding purpose it was used the powder „Alliages Speciaux 7569 Alliajes Frittes, France” with the chemical composition: 8,9%Cr; 4,5%Fe; 5,1%B; 2,4%Al; 0,6%Cu; and Ni.
Cladding was made on samples from improved steel 1C45, SR EN 10083-1:2007.
It was used a continuous wave CO2 system, type Laser GT 1400W (Romania), with working table within x-y-z coordinate system and computer programmed working regime, provided with a powder injection laser on the melted surface.
The working regime used to form laser cladding with nickel-based alloy is presented in Table 1.
The sliding indentation rig is illustrated in Figure 1.
Table 1. Working regime used in laser cladding
NOTE: P - laser radiation power , v – scanning speed of the laser beam on the processed surface, ds – diameter of the laser beam; pav - transversal advance step, g - thickness of clad layers; mp - flow rate of added material.
The mechanical composition of the kinematic
chain and the presence of the frequency converter cause the feed speed of the horizontal column 9 to take very low values, being adjustable within the range from 0 to 0.172 mm/s. Under these speed conditions the sample strain can be considered quasi-static [9].
The measuring system consists of two identical force transducers (Fig. 1), which determine the normal force and tangential force, and a data acquisition and processing system. The force transducers are resistive full bridge type
HOTTINGER BALDWIN MESSTECHNIK GmbH, C9A with measurement range 0 ... 50 kN.
The sample 16 and indenter 22 (Fig. 1) materialize the tribo-model considered in the study of deformations [5].
The tribo-model will therefore contain a point contact between a ball and a plan. The indenter (ball – mobile tribo-element) is held firmly in a mount, solitary to the vertical column 11 (Fig. 1), the only possible movement being sliding onto the sample, at the speed of the horizontal column 9 [9].
Working regime
P v ds pav g Hardness HV5
Added material rate
[mg/s]
No. of overlapping
runs [W] [mm/s] [mm] [MPa] 105 4 1150 7.5 1.8 1.5 2.07 11450
- 16 -

FO N D ATĂ197 6
THE ANNALS OF “DUNAREA DE JOS” UNIVERSITY OF GALATI.
FASCICLE IX. METALLURGY AND MATERIALS SCIENCE N0. 3 – 2011, ISSN 1453 – 083X
Fig. 1. The components of the rig for sliding indentation tests
1-frame, 2-ABB frequency converter, 3-electric engine, 4-elastic coupling, 5, 6, 7, 8-mechanical transmission, 9-horizontal column, 10-balls guiding, 11-vertical column, 12-balls guiding, 13-force transducer, 14-elastic system, 15-loading screw, 16- specimen, 17-sustenance surface, 18- specimen
fixing device, 19-balls guiding, 20-force transducer, 21-screw for transversal movement, 22- indenter.
The fixed tribo-element consists of the samples to be analyzed (samples).
The samples have rectangular shape and the dimensions given in Table 2.
Table 2. Characteristics of the fixed tribo-element
Sample length Sample width Sample thickness
Hardness HV5 Sample code
[mm] [MPa] MB 92 16 15 3400 A 92 24 15 9270 B 92 24 15 9385
Series of traces on each specimen were made, using a fixed ball mount. For this type of testing, the mobile tribo-element (ball) is subjected to two forces: one normal on the fixed tribo-element and one tangential to its surface. Initially the normal force is applied, the ball making a plastic deformation, and then the tangential one, resulting a trace under the form of an elongated groove.
The indenter speed is 0.15 mm/s, diameter φ 12.675 mm, is made from Rul 1 (SR EN ISO 683-17:2002), hardened and annealing steel. After each test, the ball bearing has been replaced with a new one that was degreased further.
Before carrying out any test, the sample surfaces have been degreased with alcohol, to provide conditions for dry friction. The normal forces FN. used
for indentation were: F1 = 2.886 kN; F2 = 4.330 kN; F3 = 5.773 kN; F4 = 7.216 kN.
Roughness Ra, as measured by a roughness gauge Surtronic 3+, is Ra ≈0.210μm for all surfaces.
3. Experimental results and discussion The microstructure of the nickel-based alloy laser
cladded layer is presented in Figure 2, the attack being electrolytic.
According to phase qualitative analysis (Fig. 3) the columnar dendritic fine structure of the deposit contains nickel-based solid solution and eutectic colonies of borides (Ni3B, CrB), CrB being the main hardening phase.
- 17 -
FO N D ATĂ197 6
THE ANNALS OF “DUNAREA DE JOS” UNIVERSITY OF GALATI.
FASCICLE IX. METALLURGY AND MATERIALS SCIENCE N0. 3 – 2011, ISSN 1453 – 083X
a.
b.
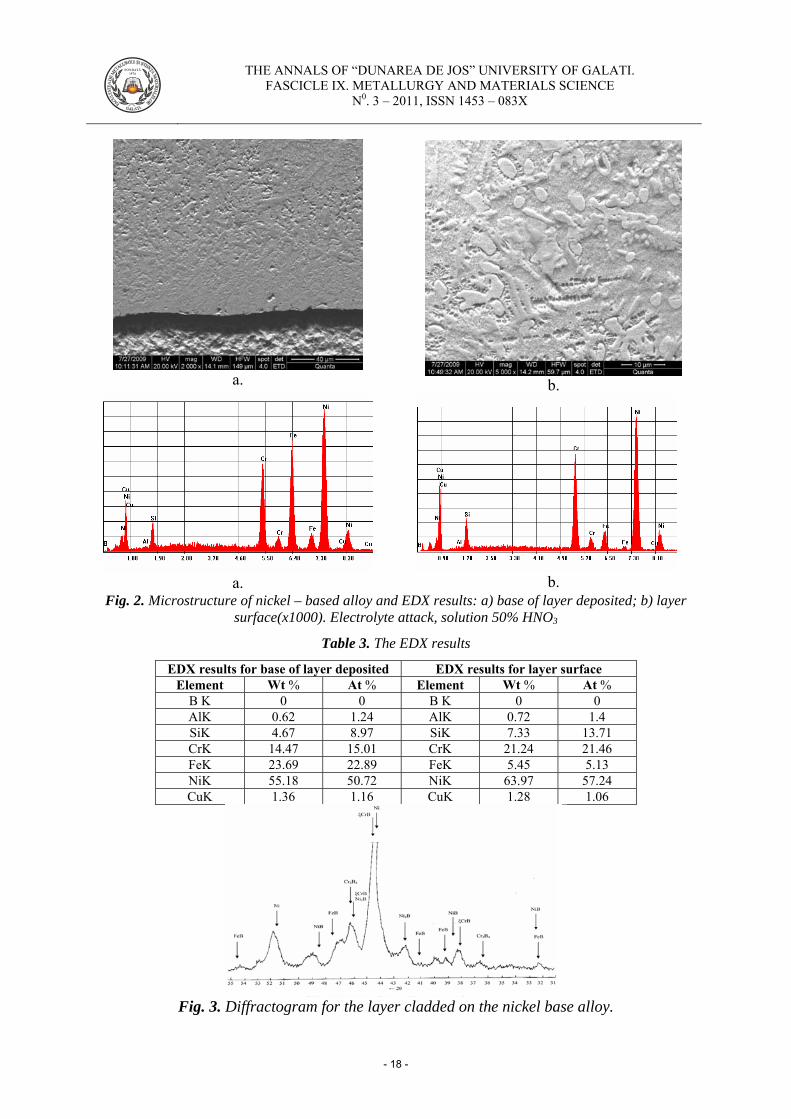
a. b. Fig. 2. Microstructure of nickel – based alloy and EDX results: a) base of layer deposited; b) layer
surface(x1000). Electrolyte attack, solution 50% HNO3
Table 3. The EDX results
EDX results for base of layer deposited EDX results for layer surface Element Wt % At % Element Wt % At %
B K 0 0 B K 0 0 AlK 0.62 1.24 AlK 0.72 1.4 SiK 4.67 8.97 SiK 7.33 13.71 CrK 14.47 15.01 CrK 21.24 21.46 FeK 23.69 22.89 FeK 5.45 5.13 NiK 55.18 50.72 NiK 63.97 57.24 CuK 1.36 1.16 CuK 1.28 1.06
Fig. 3. Diffractogram for the layer cladded on the nickel base alloy.
- 18 -

FO N D ATĂ197 6
THE ANNALS OF “DUNAREA DE JOS” UNIVERSITY OF GALATI.
FASCICLE IX. METALLURGY AND MATERIALS SCIENCE N0. 3 – 2011, ISSN 1453 – 083X
At the bottom of the layer there is a narrow area of nickel-iron dilution without eutectic carbides, which makes the transition to the material support. Good adhesion of the deposited layer to the substrate is visible. In the presence of aluminum, the nickel can form intermetallic compounds having a hardening effect: Ni3Al, Ni2Al3 [11, 12]. Table 3 shows the EDX results. If we analyze the EDX results we fiund that:
the iron concentration decreases, and the chromium, nickel, aluminium concentration increases from base to surface.
Traces obtained from sliding identation for the basic material are presented in Figure 4. Maximum pressures, obtained by relation (1), for the normal forces used are given in Table 4.
Fig. 4. Picture of specimen MB with the sliding indentation tracks.
Table 4. Maximum pressure obtained for the normal strains applied
Pmax [MPa] Normal force, FN [kN] 5773.529 2.886 6609.550 4.330 7274.611 5.773 7836.247 7.216
The variation of the friction coefficient with the
normal force for the three samples is presented in Figure 5 and Table 5. The different values can be
accounted for by the presence of intermetallic compounds (borides and carbides) which results in inhibition of adhesion.
Table 5. Friction coefficient determined
Sample code
Normal force [kN]
Friction coefficient, μmed
MB 2.886 0.068 4.330 0.079 5.773 0.082 7.216 0.093
A 2.886 0.079 4.330 0.071 5.773 0.049 7.216 0.063
B 2.886 0.153 4.330 0.055 5.773 0.039 7.216 0.040
Their amount increases from the base material
containing cementite precipitates in sample A with a larger amount of borides in particular, reaching its maximum with sample B which has the highest hardness.
From Figure 5 we can see that for the base material (sample code MB) the friction coefficient
takes the highest value, which increases with increasing normal force. This can mean a larger plastic deformation. As a result the friction surface is higher and so is the adhesion tendency.
Analyzing the behavior of sample A it can be seen an intermediate value of the friction coefficient (between those of samples MB and B). The
- 19 -

FO N D ATĂ197 6
THE ANNALS OF “DUNAREA DE JOS” UNIVERSITY OF GALATI.
FASCICLE IX. METALLURGY AND MATERIALS SCIENCE N0. 3 – 2011, ISSN 1453 – 083X
explanation is on account of lower plastic deformation, due to a higher quantity of intermetallic compounds. This leads to reduced indentor penetration and less friction surface associated with a
reduced adhesion tendency. This increase of friction coefficient occurs at a normal force greater than 5.65 kN.
0.02
0.04
0.06
0.08
0.1
0.12
0.14
0.16
2.800
3.100
3.400
3.700
4.000
4.300
4.600
4.900
5.200
5.500
5.800
6.100
6.400
6.700
7.000
7.300
F N, [kN]
μ
A B MB
Fig. 5. Variation of the friction coefficient with the normal force for the three samples MB, A, B.
Analysing the behaviour of the sample code B, it is found that high hardness due to the large amount of borides makes plastic deformation be minimal.
The indenter penetration into material penetration is the lowest of the three cases, the low-friction surface associated with minimum adhesion has led to an extensive range of strains in which the friction coefficient is minimal.
Therefore in the range of forces concerned there is no tendency of adhesion and increasing friction coefficient.
Figure 6 presents track depth variation with normal force and Figure 7 presents track width variation with normal force.
Fig. 6. Track depth variation versus normal force.
- 20 -

FO N D ATĂ197 6
THE ANNALS OF “DUNAREA DE JOS” UNIVERSITY OF GALATI.
FASCICLE IX. METALLURGY AND MATERIALS SCIENCE N0. 3 – 2011, ISSN 1453 – 083X
Fig. 7. Track width variation versus normal force
Form Figure 6, it could be noticed that for small normal forces the deformation depth of specimen code B is reduced but the zones near to the track begin to participate at the deformation process, recording a maximum width. With the increasing of the normal force, in depth deformation becomes prevalent and for the force F4 the width for specimen B get less than the width of the specimen A. Analysing the track width variation with the normal force (Fig. 7), it appears that trace depth growth occurs, due to normal force increasing and to the arising of plastic deformation, fact more visible for the substrat material.
4. Conclusions
The experimental research led to the following conclusions:
• laser cladding is an efficient way to move the elasto-plastic transition at higher contact pressures;
• with increased layer hardness and normal force, the friction coefficient decreases, and the material can be used at higher pressures;
• when increasing layer hardness, the trace depth is reduced;
• the comparisons of the geometrical characteristics of the different digital depth profiles confirm the better behaviour of the laser cladding layers.
References
[1]. Krageliskii I.V. – Trenie i iznos, MAŞGIZ, Moskova, 1962. [2]. Popinceanu N, Gafiţanu C, Diaconescu E, Creţu S, Mocanu D.R. - Fundamental problems of rolling contact, Ed. Tehnică, Bucureşti, 1985. [3]. Levcovici S. M. – Contributions to the laser surface treatment of tool steel, Doctoral thesis, Galaţi 1997. [4]. Z. Liu, J. Sun, W. Shen, Study of plowing and friction at the surfaces of plastic deformed metals, Tribology International 35 (2002) 511–522. [5]. DIN 50320 - Verschleiß. Begriffe, Systemanalyse von Verschleißvorgängen, Gliederung des Verschleißgebietes. [6]. Crudu I – Contributions to the study of the influence of normal stress on static destruction by pitting of the point contacts, Doctoral thesis, Iaşi, 1969. [7]. A.E. Tekkaya – An improved relationship between Vickers hardness and yield stress for cold formed materials and its experimental verification, Annals of the CIRP, vol. 49/1, pg. 205 – 208. [8]. D.A. Hills – Mechanics of elastic contacts, Butterworth – Heinemann, Oxford, 1993. [9]. C.Spânu – Studies and researches on tribomodels as regards surface layer plastic deformation under rolling and sliding, Doctoral thesis, Galaţi 2002. [10]. K. Komvopoulos – Three – dimensional contact analysis of elastic – plastic layered media with fractal surface topographies, Journal of Tribology, pg. 632 – 640, 2001. [11]. Boiciuc S – Research regarding laser cladding with injected powder, Doctoral thesis, Galaţi 2010. [12]. Levcovici S, Levcovici D.T., Gheorghieş C., S. Boiciuc – Laser Cladding of Ni-Cr-B-Fe-Al Alloy on a Steel Support, The International Thermal Spray Conference and Exposition (ITSC 2006) May 15th–17th, 2006, Seattle, Washington, U.S.A, Proceedings on CD, pp.1339-1344.
- 21 -
FO N D ATĂ19 76
THE ANNALS OF “DUNAREA DE JOS” UNIVERSITY OF GALATI.
FASCICLE IX. METALLURGY AND MATERIALS SCIENCE N0. 3 – 2011, ISSN 1453 – 083X
EXPERIMENTAL RESEARCHES ON THE LOBE DEFORMATION PROCESS
Ovidiu DIMA, Nicolae CANANAU,
Dinel TANASE Dunărea de Jos University of Galati
email: [email protected]
ABSTRACT
In this work are presented the physical model, experimental conditions and researches concerning the lobe process. For this purpose it was created a physical experimental system composed of the deformation die, the hydraulic press and the data acquisition system – resistive force transducer, the electronic tensometer Spider 8, and the computer. The experiments are focused on the establishing of the force variation during the deformation process.
KEYWORDS: physical model, lobe, deformation, force
1. Introduction
The force at the lobe deformation process is,
generally, calculated with the empirical mathematical expressions. One of these is shown above [1]: SpkF ⋅⋅= (1)
In this relation k is coefficient whose values are rendered in Table 1, p – the pressure applied on the material and S is the plan surface of the lobe (Table 2).
Table 1. Values of the coefficient k
Advised values of coefficient k t ≤ 1 mm t = 1 – 1.5 mm 0.7 – 0.8 1.0 – 1.6
Table 2. Values of the pressure, p
Pressure p [daN/mm2], for: Light steel Brass Aluminum
30 – 40 20 – 25 10 – 20
For evaluation of the deformation force we can consider the maximum values of the deformation degree.
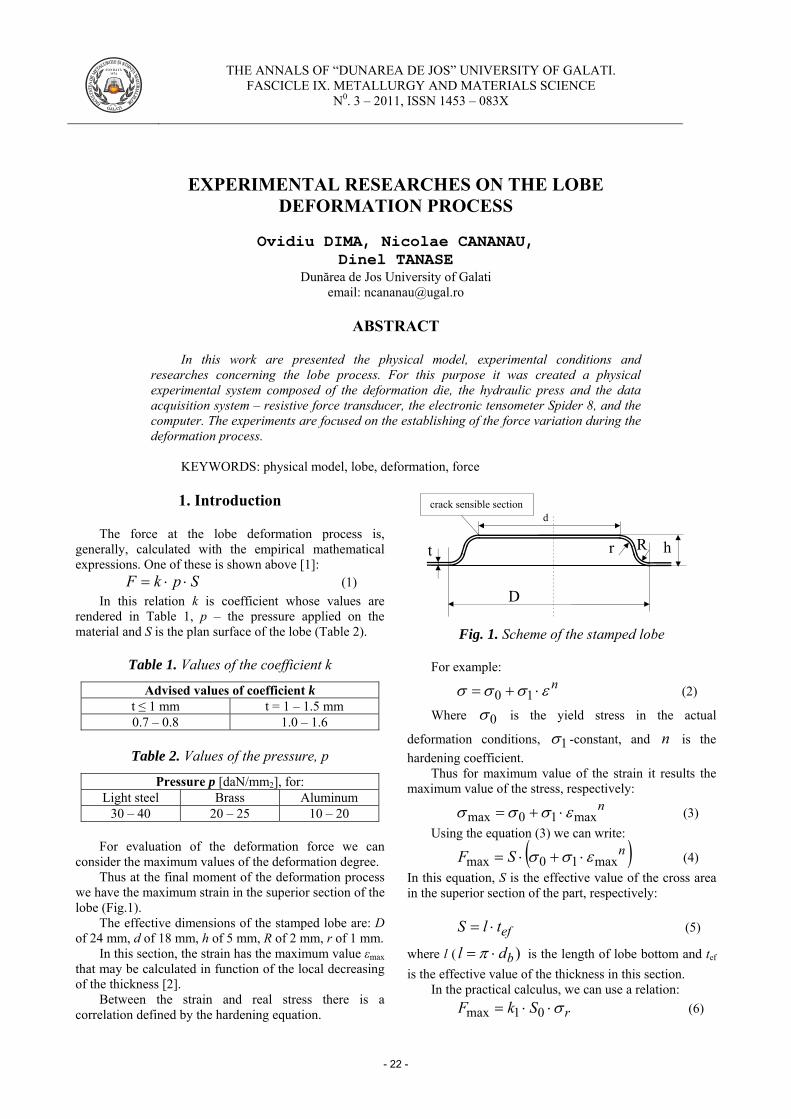
Thus at the final moment of the deformation process we have the maximum strain in the superior section of the lobe (Fig.1).
The effective dimensions of the stamped lobe are: D of 24 mm, d of 18 mm, h of 5 mm, R of 2 mm, r of 1 mm.
In this section, the strain has the maximum value εmax that may be calculated in function of the local decreasing of the thickness [2].
Between the strain and real stress there is a correlation defined by the hardening equation.
Fig. 1. Scheme of the stamped lobe For example:
nεσσσ ⋅+= 10 (2)
Where 0σ is the yield stress in the actual
deformation conditions, 1σ -constant, and n is the hardening coefficient.
Thus for maximum value of the strain it results the maximum value of the stress, respectively:
nmax10max εσσσ ⋅+= (3)
Using the equation (3) we can write:
( )nSF max10max εσσ ⋅+⋅= (4) In this equation, S is the effective value of the cross area in the superior section of the part, respectively: eftlS ⋅= (5)
where l ( )bdl ⋅= π is the length of lobe bottom and tef is the effective value of the thickness in this section.
In the practical calculus, we can use a relation: rSkF σ⋅⋅= 01max (6)
crack sensible section d
h r
D
t R
- 22 -

FO N D ATĂ19 76
THE ANNALS OF “DUNAREA DE JOS” UNIVERSITY OF GALATI.
FASCICLE IX. METALLURGY AND MATERIALS SCIENCE N0. 3 – 2011, ISSN 1453 – 083X
In this relation, S0 is the initial area of the superior section (for thickness t0), rσ is the ultimate tensile stress and k1 is a coefficient with values approach unit.
2. Experimental conditions
The aim of this work is to establish in the
experimental way the variation of the force at the lobe stamping process.
The laboratory conditions of the lobe stamping are the following:
- The samples are cut from steel strip for sever drawing deep, with 0.6 mm thickness,
- the lobe die showed in the figure 2, - force resistive transducer, - the data acquisition system,
Fig. 2. The experimental lobe die: 1-hydraulic press, 2-lobe die, 3-resistive force
transducer.
Fig. 3. General view of the experimental system.
3. Experimental results The experimental program had the following
objectives: - establishing the force variation; - visualizing the microstructure aspect; - estimation of crack sensible section.
The dimensions of samples were: the length of 80 mm and the width of 30 mm. In each sample were stamped two lobes.
For example, in the Figure 4 is shows one stamped sample.
For establishing the sensible crack section, we prepared a micrographic prove and we analyzed the variation of the thickness.
In the section A, the thickness of the sample presents a visible decreasing (Fig. 5).
A
Fig. 5. Aspect of stamped sample section (×50, Nital attack 5).
The decreasing of the thickness in the critical
section is of approximately 80%. Moreover, in this zone the structural hardening of the material has a great intensity.
In Figure 6 is shows the variation of the microstructure in the sensible crack section. Because the level of the deformation degree is great, the microstructure is strongly influenced.
3
1
2
Fig.4. Example of stamped sample.
- 23 -

FO N D ATĂ19 76
THE ANNALS OF “DUNAREA DE JOS” UNIVERSITY OF GALATI.
FASCICLE IX. METALLURGY AND MATERIALS SCIENCE N0. 3 – 2011, ISSN 1453 – 083X
The crystalline grains are much deformed. Consequently, local hardening intensity is great and the probability that cracks appear in this zone is very great.
The variation of the force during of the lobe stamping process is shown in Figure 7. Fig. 5. Variation of force during stamping process.
The force rapidly increases up to the maximum
value of 11190N, then it maintains at this value when the change of the movement sense.
The stress, in the sensible crack section, may be calculated in the function of the maximum value of the force using the above relation:
td
F⋅⋅
=π
σ max (7)
In the present conditions we have the level of the tensile strain in the critical section
=σ 329.97 N/mm2
that is 97.05 % of the conventional tensile stress σr of the material.
Considering the hardening coefficient by the plastic deformation, the real maximum stress, corresponding of the maximum deformation degree, is equal to 566.6 N/mm2.
Thus the effective maximum stress at the lobe stamping process is 58.23% from the real maximum tensile stress of the material. Consequently, in the practical data conditions cracks not will appear.
The technological coefficient of the lobe stamping process, in the given case, is calculated as the ratio between the length of the unfolded form of the deformation zone and L and the diameter D of the same zone.
DLC = (8)
We have
drRL +⎥⎦⎤
⎢⎣⎡ ++= 2)(
22 π
(9)
respectively,
DdrR
DC +⎥⎦
⎤⎢⎣⎡ ++= 2)(
22 π
(10)
In the data conditions we have C=1.309. The cumulated deformation degree may be
calculated as the logarithmic form, respectively:
269.0ln ==DLε
It results a great value of the cumulated deformation degree. The local deformation degree can be with 20-25% greater than the cumulated deformation degree.
This result confirms that the material has a good reserve for plastic deformation and the risk that cracks appear decrease.
4. Conclusions
The lobe stamping is a deformation process based on
the local elongation of the material without its traction from the neighbor zone. Consequently, the elongation, at lobe stamping, takes place in the base of the thickness. Along of the lobe profile the dimension increases and the thickness decrease. In the point where the increasing of dimension, in the length direction, is greater, the decreasing intensity of the thickness is smaller.
This fact must be known in order to forestall the crack appearance.
In this context, it may be established the critical value of the deformation degree. The level of the deformation intensity, in the practical conditions, is defined by the deformation coefficient C, or the logarithmic strain.
Force [N]
2000
4000
6000
8000
10000
12000
0 0 1 2 3 4 5 Time, [s]
Fig. 6. Aspect of crystalline grains in critical section, (×250, Nital attack 5).
- 24 -

FO N D ATĂ19 76
THE ANNALS OF “DUNAREA DE JOS” UNIVERSITY OF GALATI.
FASCICLE IX. METALLURGY AND MATERIALS SCIENCE N0. 3 – 2011, ISSN 1453 – 083X
The experiments systematized in this paper show the variation of the force during of the lobe deformation process, the variation of the thickness, specially, in the critical zone and the variation of the microstructure of the material.
In the critical section of the deformed zone the crystalline grains are deformed very much.
The experimental results and the calculated values of the maximum real stress and the maximum deformation degree show that it is unlikely that cracks should occur.
References
[1]. Teodorescu, M. a.o. – Elemente de proiectare a stantelor si matritelor, EDP, Bucuresti, 1977. [2]. Roamnovski, V.P. - Stantarea si matritarea la rece, Ed. Tehn., Bucuresti, 1970. [3]. Lazarescu, I., Stetiu G. – Proiectarea stantelor si matritelor, EDP, Bucuresti, 1973. [4]. Merchant, E.M. - Mechanics of the metal cutting process, Journal of applied physics, MC Shaw, 2004. [5]. Jaspers, S. - Material behavior in conditions similar to metal cutting: flow stress in the primary zone, Journal of Material Processing Technology, vol.122, Issues 2-3, March 2002, p.322-330. [6]. *** - ASM, Metals Handbook, vol.4, Forming, Ohio, SUA, 1969.
- 25 -

FO N D ATĂ197 6
THE ANNALS OF “DUNAREA DE JOS” UNIVERSITY OF GALATI.
FASCICLE IX. METALLURGY AND MATERIALS SCIENCE N0. 3 – 2011, ISSN 1453 – 083X
DIOXINS AND FURANS AS POLLUTANT EMISSIONS FROM INTEGRATED STEEL WORKS
Anișoara CIOCAN
Dunărea de Jos University of Galati email: [email protected]
ABSTRACT
In the metallurgical industry are several sources for pollutant emissions but
the main source is the sintering process. In this paper are analyzed the generation process of persistent organic pollutant emissions (dioxins and furans) mainly from the sintering sector. Also, the emergent techniques that must be apply to prevent or to control emissions of persistent organic pollutants-POPs (the category of substances that includes the dioxins and furans) from iron ores sintering process are presented. These were selected in accordance with best practices that are specifically for the integrated steel works.
KEYWORDS: dioxins, furans, sintering process, emergent techniques
1. Introduction
Since 1920, as a result of global industrialization the global level of dioxins increases. The decreasing of dioxin level in the environment and the endeavor to control the environmental pollution phenomena began in 1970, when PCBs were recognized as highly toxic chemicals [1].
Dioxins and furans, more precisely polychlorinated dibenzo-p-dioxins (PCDD) and polychlorinated dibenzofurans (PCDF) are two of the twelve Persistent Organic Pollutants (POPs) covered by the Stockholm Convention on Persistent Organic Pollutants (POPs). PCDD/PCDF, together with polychlorinated biphenyls (PCB) and hexachlorobenzene (HCB) are listed in Annex C of the Stockholm Convention POPs; they are unintentionally generated and are commonly named “by-products”. Polychlorinated dibenzo-p-dioxins (dioxins, PCDD) and polychlorinated dibenzofurans (furans, PCDF) are two groups of planar, tricyclic ethers which have up to eight chlorine atoms attached at carbon atoms 1 to 4 and 6 to 9, Figure 1 and 2.
Fig.1. General structure of PCDDs where
n and m can range from 0 to 4.
Fig.2. General structure of PCDFs, where 2 ≤ n+m ≤ 8.
In total, there are 75 possible PCDD congeners and 135 possible PCDF congeners giving a total of 210 congeners. Dioxins and furans are generally very insoluble in water, are lipophilic and are persistent. PCDD and PCDF have never been produced intentionally but are unwanted by products of many chemical industrial processes and of all combustion processes.
Almost all possible 210 congeners are released from these sources and, due to chemical, physical, and biological stability and longrange transport, are ubiquitous and have been detected in all environmental compartments.
Due to the persistence of the 2, 3, 7, 8-substituted congeners and the lipophilicity of these compounds, PCDD/PCDF accumulate in fatty tissues and in carbon-rich matrices such as soils and sediments.
- 26 -

FO N D ATĂ197 6
THE ANNALS OF “DUNAREA DE JOS” UNIVERSITY OF GALATI.
FASCICLE IX. METALLURGY AND MATERIALS SCIENCE N0. 3 – 2011, ISSN 1453 – 083X
2. Sintering of iron ores as main source for pollutant emissions of dioxins and furans in the integrated steel works According to statistics provided by EUROFER,
for the EU countries the most important quantity of steel is produced in the blast furnace/basic oxygen furnace route (approximately 62% in 2003). In these integrated flows, sinter plants have an important role for the iron ores preparation. Sinter is produced from predesigned mixtures.
Sintering involves the heating of fine iron ore with flux and coke fines or coal to produce a semi-molten mass that solidifies into porous pieces of sinter with the size and strength characteristics necessary for feeding into the blast furnace.
At the same time, they provide the opportunity for recovery of waste that contained useful elements. In some integrated steel works the sinter process is the unique possible technological solution to be applied for recycling internal valuable wastes [3, 4].
The flexibility of the sintering process permits conversion of a variety of materials, including iron ore fines, captured dusts, ore concentrates, and other
iron-bearing materials of small particle size (e.g., mill scale) into a clinker-like agglomerate.
In addition to sinter, residues or wastes result from process. In integrated steelworks applying the blast furnace/basic oxygen route, sinter plants dominate the overall emissions for atmospheric pollutants [5]. From the materials-handling operations results the airborne dust, and from the combustion reaction on the strand result products of combustion such as CO, CO2, SOx, NOx, and particulate matter. As result the sintering process produces a large variety of pollutants like dust, heavy metals, SO2, HCl, HF, Polycyclic aromatic hydrocarbons (PAHs) and also chlorinated organic compounds (polychlorinated biphenyls-PCBs; polychlorinated dibenzo-p-dioxins-PCDD and polychlorinated dibenzofurans-PCDF) etc. In the European Union, the following air pollutants emitted from the process of sintering iron ores are important: particulate matter, Cd, Cr, Cu, Hg, Mn, Ni, Pb, Tl, V, Zn, HCl, HF, NOx, SO2, CO, CO2, VOCs (volatile organic compounds), PAHs, PCDDs/PCDFs and PCBs. In accordance with CORINAIR standard, except gaseous ammonia all components are known to be emitted from sinter plants, Table 1 [6].
Table 1. Contribution of the pollutant emissions from iron ore sintering plant reported to global
emissions of inventory CORINAIR 90 (Made for the EU Member States)
Contribution to the global emissions [%] (including those issued in nature)
Source Sinter process
SO2 NOx NMVOC CH4 CO CO2 N2O NH3 TSP* PM10* PM2.5*
Typical contribution 1.3 1.0 0.1 0.1 4.9 0.4 - - 1.82 1.96 2.97
Maximum value 5.13 5.37 9.09
Minimum value 0.245 0.234 0.321
* EU PM2.5 Inventory project for EU25 for year 2000 (TNO 2006) (contribution to total emissions, excluding those related to agricultural soils) 0 – emission reported but the exact value is lower as rounded limit (0.1 %) - missions were not reported
Most of the SO2 emission has its origins in
sulphur of the coke combustion. For the nitrogen oxides, NOx emission is the predominant as a result of rapid cooling gas. The main source of the NOx emissions is the nitrogen content of coke (approximately 80%) and the iron ores (approximately 20%). Raw materials are responsible to heavy metal emissions.
In generally, the dust released is associated to the heavy metals emission. During sintering process,
some heavy metals are volatilized from the raw materials used and pass in the flue gas as volatile compounds (eg. chlorides).
We refer mainly to Zn, Pb and Cd. Arsenic is emitted in the gas as As2O3. In the presence of carbon and chlorine or its precursor such oily components, polycyclic organic compounds (PAHs, PCDD/PCDF) are formed.
Some wastes, such as mill scale may be contaminated with oil residues that are the precursors
- 27 -
FO N D ATĂ197 6
THE ANNALS OF “DUNAREA DE JOS” UNIVERSITY OF GALATI.
FASCICLE IX. METALLURGY AND MATERIALS SCIENCE N0. 3 – 2011, ISSN 1453 – 083X
for the formation of polycyclic aromatic hydrocarbons, dioxins and furans respectively. In the same time, chlorine compounds can be brought into the process of sintering iron ores or coke. The chlorine content of the input material deposed as strand on the sintering bed increases from the recycled materials as dust/sludge from the cleaning off-gas system and as mill scale or sewage sludge.
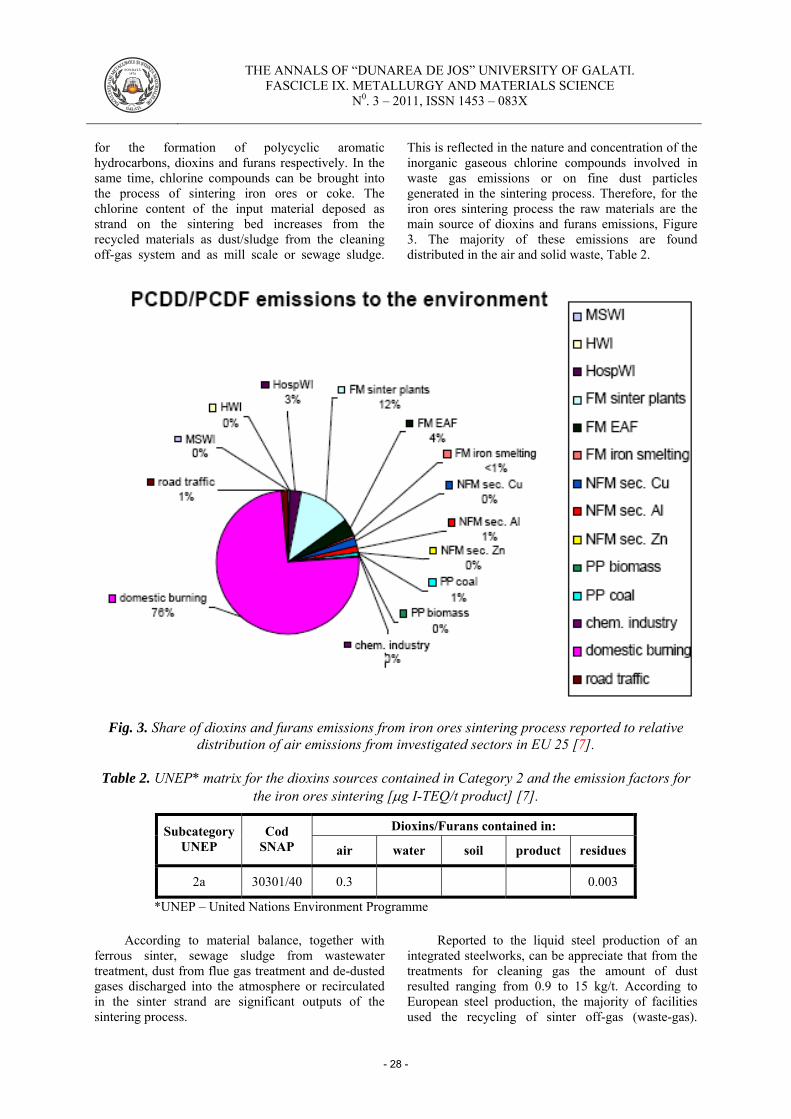
This is reflected in the nature and concentration of the inorganic gaseous chlorine compounds involved in waste gas emissions or on fine dust particles generated in the sintering process. Therefore, for the iron ores sintering process the raw materials are the main source of dioxins and furans emissions, Figure 3. The majority of these emissions are found distributed in the air and solid waste, Table 2.
Fig. 3. Share of dioxins and furans emissions from iron ores sintering process reported to relative distribution of air emissions from investigated sectors in EU 25 [7].
Table 2. UNEP* matrix for the dioxins sources contained in Category 2 and the emission factors for
the iron ores sintering [μg I-TEQ/t product] [7].
Dioxins/Furans contained in: Subcategory UNEP
Cod SNAP air water soil product residues
2a 30301/40 0.3 0.003
*UNEP – United Nations Environment Programme
According to material balance, together with ferrous sinter, sewage sludge from wastewater treatment, dust from flue gas treatment and de-dusted gases discharged into the atmosphere or recirculated in the sinter strand are significant outputs of the sintering process.
Reported to the liquid steel production of an integrated steelworks, can be appreciate that from the treatments for cleaning gas the amount of dust resulted ranging from 0.9 to 15 kg/t. According to European steel production, the majority of facilities used the recycling of sinter off-gas (waste-gas).
- 28 -

FO N D ATĂ197 6
THE ANNALS OF “DUNAREA DE JOS” UNIVERSITY OF GALATI.
FASCICLE IX. METALLURGY AND MATERIALS SCIENCE N0. 3 – 2011, ISSN 1453 – 083X
Recirculation of part of the off-gas from the entire sinter strand, or sectional recirculation of off-gas, can minimize formation and release of pollutants.
The dust arises from dry cleaning of the wastes gases contain alkali and metal chlorides. These emissions can be reduced if the waste gas dedusting operations are developed in several steps (by using the bag filters and scrubbing system).
The dust amount and sludge resulted from these treatment steps is higher, i.e. approximately 0.2...0.5 kg dust/t, respectively ∼0.3 kg sludge/t for which it was considered a contamination with dioxins and furans in the range <0.01 to 20 ppb (mean value
approx. 1.1 ng TEQ/g). The annual amount of the off gas released from sinter strands was estimated at approx. 2300 Nm3, with a contamination level reported for EU states in the range 0.1...5 ng TEQ/Nm3 (for the off-gases the medium value of PCDD/PCDF contamination is 1.2 ng TEQ/Nm3, taking into account the optimization measures implemented to the sintering processes). At a European scale the estimated emissions amount are ~ 595 g TEQ/y. Thereof ~525g are emitted to air and ~70g are emitted to waste. Dioxins emissions and furans released to the sinter production for the UE states are presented in Table 3 [7, 8].
Table 3. Country specific estimation on emitted amounts of
dioxins and furans in the year 2003
Country
Production of crude
steel (oxygen)
[kt/y]
Emission to air
[g TEQ/y]
Discharge to flue gas treatment as residues [g TEQ/y]
AT 3.700 10.2 2.0 BE 15.300 42.0 8.4 CY 0.0 0.0 CZ 6.330 126.6 3.5 DE 28.950 79.5 15.9 DK 0.0 0.0 EE 0.0 0.0 ES 5.400 14.8 3.0 FI 2.700 7.4 1.5 FR 21.550 59.2 11.9 GR 0.0 0.0 HU 900 4.5 0.5 IE 0.0 0.0 IT 11.500 31.6 6.3 LT 0.0 0.0 LU 0.0 0.0 LV 0.0 0.0 MT 0.0 0.0 NL 4.400 12.1 2.4 PL 9.000 13.5 5.0 PT 0.0 0.0 SE 0.0 0.0 SI 250 5.0 0.1 SK 4.000 80.0 2.2 UK 13.800 37.9 7.6
EU-25 127.780 524.4 70.3 EU-15 107.300 294.8 59.0 EU-10 20.480 229.6 11.3
- 29 -

FO N D ATĂ197 6
THE ANNALS OF “DUNAREA DE JOS” UNIVERSITY OF GALATI.
FASCICLE IX. METALLURGY AND MATERIALS SCIENCE N0. 3 – 2011, ISSN 1453 – 083X
3. New and emergent techniques to reduce emissions of dioxins/furans generated in
the iron ores sintering sectors
There are several factors to prevent or control emissions of persistent organic pollutants-POPs (the category of substances that includes the dioxins and furans) from stationary sources. Also there are the available measures that can be applied separately or together.
One of these measures is to replace raw materials that have POPs content, if any direct relationship exists between POPs emissions and input materials. Although not determined a precise relationship between chlorine content of raw materials and emissions of dioxins/furans, should be eliminated or reduced the oil impurities from the wastes recycled, prior to their use of sinter strands.
Halogenated compounds can be a source of dioxins/furans in the sintering process if these are present in the input materials subjected to the thermal agglomeration (coke dust, salts from the ores) and in the recyclable materials added (blast furnace dust, steelmaking dusts, sludge from wastewater treatment, mill scale etc.) [9, 10].
The avoid use of the contaminated material (associated with the helplessness to recycling by other ways the wastes with high iron content as a substitute for iron ores) leads to accumulation of considerable quantities of landfilled wastes with negative effects especially on the environment. These are determined by the storage on large areas, and potential risks of air, soil and water pollution in case of uncontrolled storage and long times. Other methods relate to the application of best environmental practices, such as sound internal flow, preventive maintenance programs; the control of the processes to ensure complete combustion and to minimize the formation and release of PCDD, PCDF and other pollutants by the control parameters (temperature of combustion, strand speed, bed composition, optimum flue gas treatment by post-combustion, thermal or catalytic oxidation, adsorption or cleaning), treatment applied to sewage, residues or sludge from cleaning systems etc [11, 12].
Most effective solution to reduce the dioxins and furans emissions is to combine different secondary measures, the so-called measure "end-of-pipe", as follows [13-15]:
- recirculation of off-gases (recycling of sinter off-gas) which significantly reducing of the dioxins/furans emissions and more significantly which reducing of the gaseous effluents flow. On this way, the cost of the devices installing for the anti-emissions on the discharge is diminished;
- utilisation as removal techniques the following: the textile filters/filter bags; the
adsorption/absorption that involves sorption of PCDD and PCDF to a material such as activated carbon together with effective particulate matter (de-dusting) control; the regenerative activated carbon technology (the electrostatic precipitator is used to reduce dust concentration in the off-gases prior to entry to the activated carbon unit); the sorption technique that use of lignite or activated carbon injection, together with a fabric filter; the fine wet scrubbing system
4. Conclusions The PCDD/PCDF emissions of the sintering
sectors from the ferrous metallurgy are quite significant, they are typically in range of 0.4 to 4 ngET/m3.
To prevention and control of these emissions must be applied the solutions adapted from Best Available Techniques (BAT). In the European Union are known and implemented a series of process integration techniques, specific emerging technologies for sinter plants are following: the optimizing of the processes to minimize the dioxins and furans emissions; the recycling into sinter process of the wastes containing iron content; decreasing of the oil content in materials feed to the sinter strand, reducing the sulphur content in feed for sintering; heat recovery from sintering and cooling sinter process; off-gases recirculation.
However, for sinter plants of the European Union states is necessary to use the following "end-of-pipe" techniques like the using of the dry electrostatic precipitation, dust filters, cyclone, with fine wet scrubbing systems, gas desulphurization of gases wastes, selective catalytic reduction etc.
Environmental concerns and also the high operating costs led to declining use of traditional sinter plants. In return, were developed other techniques which allow increasing the amount of wastes recycled in the feed mixtures (as an alternative to sintering process). Some of these are tested in the pilot-scale plants. These methods (rotary hearth processes-Inmetco, fluidized bed process, smelting plasma processes-Siromelt, Plasmelt, Daido Special Method, CONTOP, RADUST) [13].
For these recycling solutions, the main objective is to apply special treatment before recycling wastes. These involve decomposition, vaporisation and separation of heavy hydrocarbons and also zinc and other heavy metals (if they are present in remarkable amounts of iron-containing wastes).
From a technical standpoint it is possible to solve these problems. The following solutions are available: the selective leaching of zinc, lead and other heavy metals by hydrometallurgical treatment; processing at high temperature to vaporize the zinc and lead and to decompose of the heavy hydrocarbons
- 30 -

FO N D ATĂ197 6
THE ANNALS OF “DUNAREA DE JOS” UNIVERSITY OF GALATI.
FASCICLE IX. METALLURGY AND MATERIALS SCIENCE N0. 3 – 2011, ISSN 1453 – 083X
and cyanides. The aims of pirometallurgical methods are the reducing of the iron oxides. The product resulted from process is a molten alloy (similar to blast furnace product) or an oxides melts with high iron content. In the first case, the product is loaded directly into the basic oxygen furnace as a substitute for ferrous scraps. In the latter case, iron-rich slag can be recycled into sinter plants or into blast furnace.
References
[1]. Bor, A.M., Ciuculescu, C.A., Meghea, A. - Determinarea dioxinelor/furanilor prin gaz-cromatografie cuplată cu spectrometrie de masă, Revista de Chimie, București, Nr. 2, 2007 [2]. *** La Revue de Metallurgie Janvier 2004, [3]. Ciocan, A. - Valorificarea deşeurilor mărunte şi pulverulente generate în siderurgie, Grup editorial Naţional, Bucuresti, 2003 [4]. Ciocan, A. - Valorificarea deşeurilor metalurgice. Procese şi tehnologii”, Galaţi University Press, 2008 [5]. Nicolae, M., și colectiv - Dezvoltare durabilă în siderurgie prin valorificarea materialelor secundare, Ed. Printech, București, 2004 [6]. *** - Emission Inventory Guidebook, December 2006 [7]. *** - Study to facilitate the implementation of certain waste related provisions of the Regulation on Persistent Organic Pollutants (POPs), European Commission, Brussels,
REFERENCE: ENV.A.2/ETU/2004/0044, FINAL REPORT, August 2005, www.pops-waste-full-report.pdf [8]. *** - Ghid la Convenţia de la Stockholm privind poluanţii organici persistenţi Publicat de Programul Naţiunilor Unite pentru Mediu în aprilie 2005. Elaborat de Secretariatul Convenţiei de la Stockholm şi Biroul Informaţional al convenţiilor UNEP. ep.ch, www.pops.int [9]. *** - UNEP BAT-BEP 2004 [10]. *** - Guidelines on Best Available Techniques and Guidance on Best Environmental Practice relevant to the provisions of Article 5 and Annex C of the Stockholm Convention. [11]. Cadariu, A. - Proiectul Internaţional de Eliminare a POP, România, Raportul de Ţară privind Poluanţii Organici Persistenţi, Iulie, 2005, www.ipen.org [12]. Considine T.J., Jablonowski C., Considine D.M.M. -Environment and New Technology Adoption in the US Steel Industry, Final Report To National Science Foundation & Lucent Technologies Industrial Ecology Research Fellowship BES-9727297, 2001 [13]. Jalkanen, H., et al. - Journal of Mining and Metallurgy, 41 B (2005) [14]. Heino J., Makkonen H. - Recycling or Utilization of Dust, Scales and Sludge from Steel Industry, www.ce.jyn.fi/helsie/pdf/heino.pdf. [15[. *** - Legea nr. 271 din 23 iunie 2003 pentru ratificarea protocoalelor Convenţiei asupra poluării atmosferice transfrontaliere pe distanţe lungi, încheiată la Geneva la 13 noiembrie 1979, adoptate la Aarhus la 24 iunie 1998 şi la Gothenburg la 1 decembrie 1999.
- 31 -
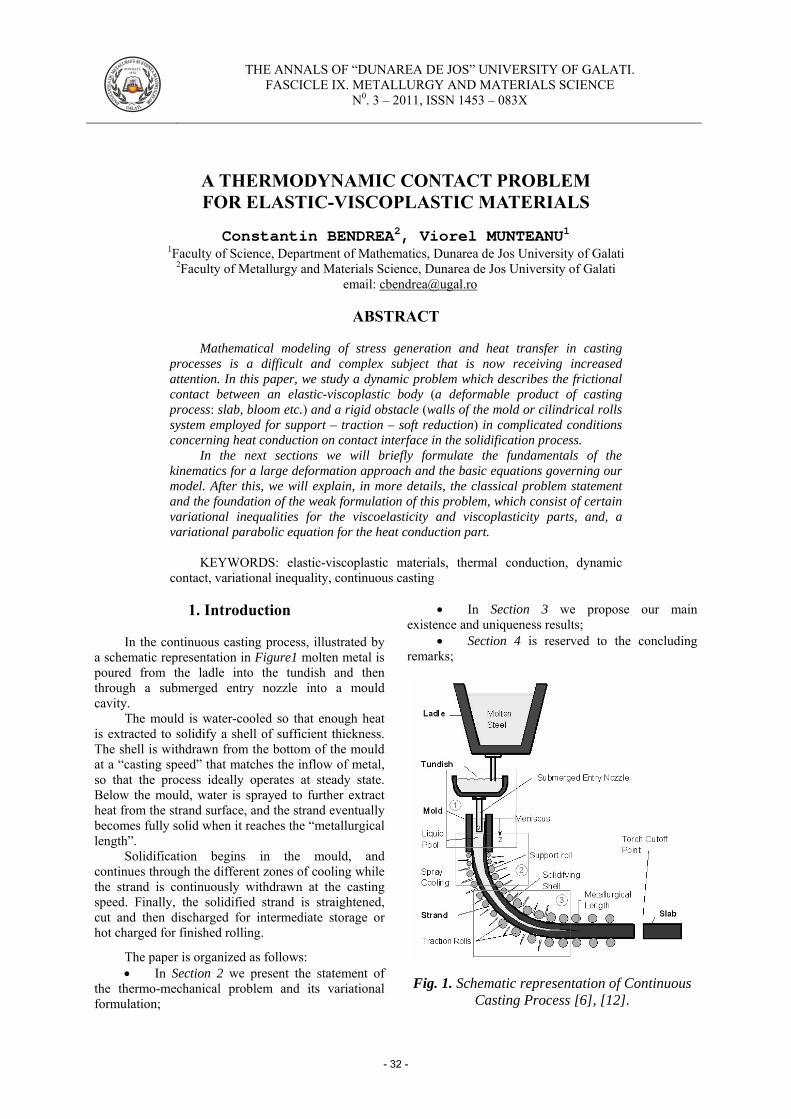
FO N D ATĂ197 6
THE ANNALS OF “DUNAREA DE JOS” UNIVERSITY OF GALATI.
FASCICLE IX. METALLURGY AND MATERIALS SCIENCE N0. 3 – 2011, ISSN 1453 – 083X
A THERMODYNAMIC CONTACT PROBLEM FOR ELASTIC-VISCOPLASTIC MATERIALS
Constantin BENDREA2, Viorel MUNTEANU1
1Faculty of Science, Department of Mathematics, Dunarea de Jos University of Galati 2Faculty of Metallurgy and Materials Science, Dunarea de Jos University of Galati
email: [email protected]
ABSTRACT
Mathematical modeling of stress generation and heat transfer in casting processes is a difficult and complex subject that is now receiving increased attention. In this paper, we study a dynamic problem which describes the frictional contact between an elastic-viscoplastic body (a deformable product of casting process: slab, bloom etc.) and a rigid obstacle (walls of the mold or cilindrical rolls system employed for support – traction – soft reduction) in complicated conditions concerning heat conduction on contact interface in the solidification process.
In the next sections we will briefly formulate the fundamentals of the kinematics for a large deformation approach and the basic equations governing our model. After this, we will explain, in more details, the classical problem statement and the foundation of the weak formulation of this problem, which consist of certain variational inequalities for the viscoelasticity and viscoplasticity parts, and, a variational parabolic equation for the heat conduction part.
KEYWORDS: elastic-viscoplastic materials, thermal conduction, dynamic
contact, variational inequality, continuous casting
1. Introduction
In the continuous casting process, illustrated by a schematic representation in Figure1 molten metal is poured from the ladle into the tundish and then through a submerged entry nozzle into a mould cavity.
The mould is water-cooled so that enough heat is extracted to solidify a shell of sufficient thickness. The shell is withdrawn from the bottom of the mould at a “casting speed” that matches the inflow of metal, so that the process ideally operates at steady state. Below the mould, water is sprayed to further extract heat from the strand surface, and the strand eventually becomes fully solid when it reaches the “metallurgical length”.
Solidification begins in the mould, and continues through the different zones of cooling while the strand is continuously withdrawn at the casting speed. Finally, the solidified strand is straightened, cut and then discharged for intermediate storage or hot charged for finished rolling.
The paper is organized as follows: • In Section 2 we present the statement of
the thermo-mechanical problem and its variational formulation;
• In Section 3 we propose our main existence and uniqueness results;
• Section 4 is reserved to the concluding remarks;
Fig. 1. Schematic representation of Continuous Casting Process [6], [12].
- 32 -

FO N D ATĂ197 6
THE ANNALS OF “DUNAREA DE JOS” UNIVERSITY OF GALATI.
FASCICLE IX. METALLURGY AND MATERIALS SCIENCE N0. 3 – 2011, ISSN 1453 – 083X
1. Schematic of tundish and mould region of continuous casting process and of specific contacts;
2. Thermo-elastic-viscoplastic contact between slab and the support- rolls on secondary cooling zones (detail in Figure 2.);
3. The contact between slab and the traction-soft reduction rolls on secondary cooling zones;
Fig. 2. The contact between slab and
support rolls.
2. Problem statement and variational formulation
In earlier mathematical publications there were
several simplifications assumed recording to which the deformable bodies were linearly elastic. However, numerous recent studies are dedicated to the modeling, variational analysis and numerical approximations of contact problems involving rheological properties of the materials.
Moreover, a variety of new and modified contact conditions have been employed, reflecting a variety of possible physical contact settings and conditions.
Now, we describe the model for the physics process and derive its weak (variational) formulation.
An elastic-viscoplastic body (slab, blum, etc.) occupies a regular domain
with surface that is portioned into three disjoint measurable parts
such that means ( .
Let be the time interval of interest with
. The body is clamped on and therefore the displacement field vanishes there. We denote by the spaces of second order symmetric
tensors, while “ ” and will represent the inner
product and the Euclidean norm on or . Let
denote the unit outer normal on , and everywhere in
the sequel the index runs from (summation over repeated indices is implied and the index that follows a comma represents the partial derivative with respect to the corresponding component of the independent variable).
We also use the following notation and physical nomenclatures:
;
; ;
for ;
time variable;
spatial variable; u : → ℝd displacement vectorial field;
velocity and inertial vectorial fields;
stress tensor field (second order Piola –Kirchhoff) ;
) strain tensor field
(linearized tensor Green-St. Venant); temperature scalar field;
The aim of this paper is to study a thermodynamic contact problem for elastic-viscoplastic materials with a constitutive law of the form (2.1), where and are nonlinear operators whitch will be described below, and
represents the thermal expansion tensor. Here and below, in order to simplify the
notation, we usually do not indicate explicitly the dependence of the functions on the variables
(on the time ). Examples of constitutive laws of the form (2.1) can be constructed by using thermal aspects and rheological arguments, see e.g. [10], [8], [14], [7].
(2.1)
It follows from (2.1) that, at each time moment ,
the stress tensor is split into two parts, where,
, is the purely viscous part, and
(2.2)
- 33 -

FO N D ATĂ197 6
THE ANNALS OF “DUNAREA DE JOS” UNIVERSITY OF GALATI.
FASCICLE IX. METALLURGY AND MATERIALS SCIENCE N0. 3 – 2011, ISSN 1453 – 083X
is the rate-type elastic-viscoplastic part.
(2.3)
When the constitutive law (2.1) reduces to the Kelvin-Voigt viscoelastic behaviour of the materials,
, (2.4) We turn to describe the frictional contact conditions. Since the linear unilateral contact at high temperature between deformable body (product of the cast) and the rigid obstacle (walls of the mold, or traction-support rolls, respectively) is lubricated all trough of the solidification process, we assume that the normal stress on the contact
surface can be satisfies through the following semilinear relation (see [5], [7]) ,
, on (2.5) The normal damped response function is
prescribed and satisfies for , since then there is no contact. As an example, we may consider (see [10], [7])
, (2.6) where represents a deformability positive
coefficient and . Also, we consider the following associated friction law,
, on . (2.7) As an example, we may consider the following form of tangential damped response function ,
, (2.8)where is a frictional coefficient and the tangential
shear stresses is proportional to the tangential
velocity (the setting where the contact surface is lubricated with a thin layer of a newtonian fluid). Both and are friction-contact constitutive functions whose properties will be described below. Finally, the evolution of the temperature field is governed by the heat transfer equation (see [6], [8], [9]),
, in (2.9)where,
is thermal conductivity tensor
is thermal expansion tensor;
represent the density of volume heat sources. In order to simplify the description of the problem,
a homogeneous condition for the temperature field is considered on ,
, on (2.10) It is straightforward to extend the results shown in this paper to more general cases.
Also, we assume the associated temperature boundary condition is described on ,
, on (2.11)where is the reference temperature of the obstacle,
and is the heat excange coefficient between the body and the rigid foundation.
Thus, the classic thermo-mechanical problem corresponding to the thermo-cvasistatic contact of an elastic-viscoplastic body with a rigid foundation, involving the friction and the heat conduction, can be written as follows: Problem (P): Find,
a displacement field u : → ℝd ,
a stress tensor field and,
a temperature field such that,
(2.12)
, (2.13) , (2.14)
, on (2.15) , on (2.16) , on (2.17)
on (2.18)
, on (2.19) ; ; (2.20)
Here, and represent the initial
displacement and the initial temperature, respectively. Also, is the initial velocity of displacement. A
volume force of density acts in and a surface
traction of density acts on .
- 34 -

FO N D ATĂ197 6
THE ANNALS OF “DUNAREA DE JOS” UNIVERSITY OF GALATI.
FASCICLE IX. METALLURGY AND MATERIALS SCIENCE N0. 3 – 2011, ISSN 1453 – 083X
In order to obtain the variational formulation of Problem (P), let us introduce additional notation and assumptions on the problem data, ;
; �
; .
Here, and are the Hooke deformation and divergente operators, respectively. The real Hilbert spaces are endowed with the corresponding cannonical inner products,
We recall that the following Green’s formula
holds: for a regular function fixed,
=
,
(2.21)
We remember that the elastic-viscoplastic body is occupied by the regular domain with the
surface that is a sufficiently regular boundary, portionned into three disjoint measurable part,
such that .
Thus, we define the closed subspaces and of
and , respectively, by: ,
(2.22)
and be the convexe set of admisible displacements given by,
. (2.23) Since , Korn’s inequality holds (see
[9], 1997-pp.291) and, hence, on we consider the inner product given by:
(2.24)and the associated norm,
It follows that and are equivalent norms
on and therefore is a real Hilbert space.
In an analogous way, we can prove that the norm associated to the
inner product on given by
is equivalent to the classical norm on . Hence
is a real Hilbert spaces. We also recall (see [18], [4]), that for every real Banach spaces we use the notation
and for the space of continuous and continuously differentiable function from
, respectively.
and are real Banach spaces with the norms,
, =
(2.25)
If and are arbitrary, then we
use the standard notation for the Lebesgue spaces and for the Sobolev spaces
. While the Banach spaces is
we have,
,
. (2.26)
In the study of the thermo-mechanical problem
we assume that the
viscosity operator , the elasticity operator , the
viscoplasticity operator and the contact-friction
functions satisfies some regularity conditons (see [7], [2], [3] ). We assume the following for the given force densities, ; (2.27)
and that the thermal conductivity and expansion tensors are symmetrically bounded tensors satisfying, ;
. (2.28)
Finally, we also suppose that the mass density satisfies, : , (2.29)and the initial data satisfy, . (2.30)
- 35 -

FO N D ATĂ197 6
THE ANNALS OF “DUNAREA DE JOS” UNIVERSITY OF GALATI.
FASCICLE IX. METALLURGY AND MATERIALS SCIENCE N0. 3 – 2011, ISSN 1453 – 083X
Because the inclusion mapping of into
and identifying with its own dual we
can write the Gelfand triple . Let ,
= ,
.
(2.31)
We also consider the contact-functionals, ,
.
(2.32)
and defined by,
,
. (2.33)
We suppose in what follows that are smooth functions satisfying the problem
We take the dot product of equation (2.12) with
, for an arbitrary element of , the
integrate the result over , and using Green’s formula (2.21) we obtain,
=
, a.e .
(2.34)
Thus, the variational formulation for thermo-mechanical problem (P) is obtained. Problem (VP): Find, a displacement field ,
a stress field and,
a temperature field such that for
a.e.
(2.35)
(2.36)
+ ,
+ ,
(2.37)
. (2.38)
4. Existence and uniqueness of the solution
The main result of this section is the following theorem of existence and uniqueness of the weak solution in the thermomechanical problem (P). Theorem 3.1 Under the assumptions , there
exists a unique solution of the Problem
. Moreover, the solution satisfies the regularity properties,
,
.
(3.1)
The proof of Theorem 3.1 is based on the
result concerning a fixed point strategy, similar to that used in [7], [3], [14]. It is carried out in several steps, and the variational problem has decomposed in three auxiliary problems meant to determine of the displacement field, the stress field and the temperature field, respectively.
5. Conclusions
Because of the importance of the continuous
improvements to the casting processes of the steels, a considerable effort has been made in modeling and numerical simulations of the tribologycal contacts between casted products (slab, bloom, etc) and walls of the mould, and as well, between slab and the support (traction, soft-reduction) rolls, during the secondary cooling.
In the present paper has been investigated a mathematical model for triboprocesses involving the coupling thermal and mechanical aspects by specific behaviour laws of materials.
The dynamical contact has been described as the effect of a normal and tangential damped response conditions. The classical as well as a variational formulation of the thermodynamical problem are presented.
- 36 -

FO N D ATĂ197 6
THE ANNALS OF “DUNAREA DE JOS” UNIVERSITY OF GALATI.
FASCICLE IX. METALLURGY AND MATERIALS SCIENCE N0. 3 – 2011, ISSN 1453 – 083X
References
[1]. Amassad A., Kuttler L., Rochdi M., Shillor M. - Quasistatic thermo-viscoelastic contact problem with slip dependent friction coefficient, Math. Computat. Modelling, No. 36, pp.839-854, 2007 [2]. Andrews K.T., Kuttler K.L, Shillor M. - On the Dynamic behaviour of a Thermo-Viscoplastic Body in Frictional Contact with a Rigid Obstacle, European J. Applied Mathematics, vol.8, pp.417-436, 1997 [3]. Ayyad Y., Sofonea M. - Analysis of two Dynamic Frictionless Contact Problems for Elastic-Visco-Plastic Materials, EJDE, No.55, pp.1-17, 2007 [4]. Barbu V. - Nonlinear Semigroups and Differential Equations in Banach Spaces, Bucharest–Noordhoff, Leyden, 1976 [5]. Bendrea C. - Evolutionary variational problems and quasi-variational inequalities in the mathematical modeling of the tribological processes concerning continuous casting machine, Thesis, Galati, 2008 [6]. Bendrea C., Munteanu V. - Thermal Analysis of an Elastic-Viscoplastic Unilateral Contact Problem in the Continuous Casting of the Steel, Metalurgia International, Vol XIV (2009), No 5, pp. 72 [7]. Campo M., Fernandez J.R. - Numerical analysis of a quasistatic thermo—Viscoelastic frictional contact problem, Comput. Math., No.35, pp.453- 469, 2005
[8]. Chau O., Fernandez J.R., Han W., Sofonea M. - A frictionless contact problem for elastic-viscoplastic materials with normal compliance and damage, Comput. Methods Appl. Mech. Engrg., 191, pp.5007-5026, 2002 [9]. Ciarlet P.G., Mathematical Elasticity (vol. I, II), Elsevier, Amsterdam – New-York, 1997 [10]. Fernandez J.R, Sofonea M., Viano J.M. - A Frictionless Contact Problem for Elastic-Viscoplastic Matherials with Normal Compliance: Numerical Analysis and Computational Experiments, Comput. Methods Appl. Mech. Engrg., vol. 90, pp.689-719, 2002 [11]. Han W., Sofonea M. - Quasistatic Contact Problems in Viscoelasticity and Viscoplasticiy , AMS , Int. Press, 2001 [12]. Moitra A.,Thomas B.G. - Applications of a Thermo-Mechanical Finite Element Method of Steel Shell Behaviour in the Continuous Slab Casting Mold, SteelMaking Proceedings, vol.76, pp.657-667, 1998 [13]. Munteanu V., Bendrea C. - A Thermoelastic Unilateral Contact Problem with Damage and Wear in Solidification Processes Modeling, Metalurgia International, Vol XIV (2009), No 5, pp. 83 [14]. Wang H., Li G. et. al. - Mathematical Heat Transfer Model Research for the Improvement of Continuous Casting Slab Temperature ISIJ Int. vol.45, No.9, pp.1291-1296, 2005.
- 37 -
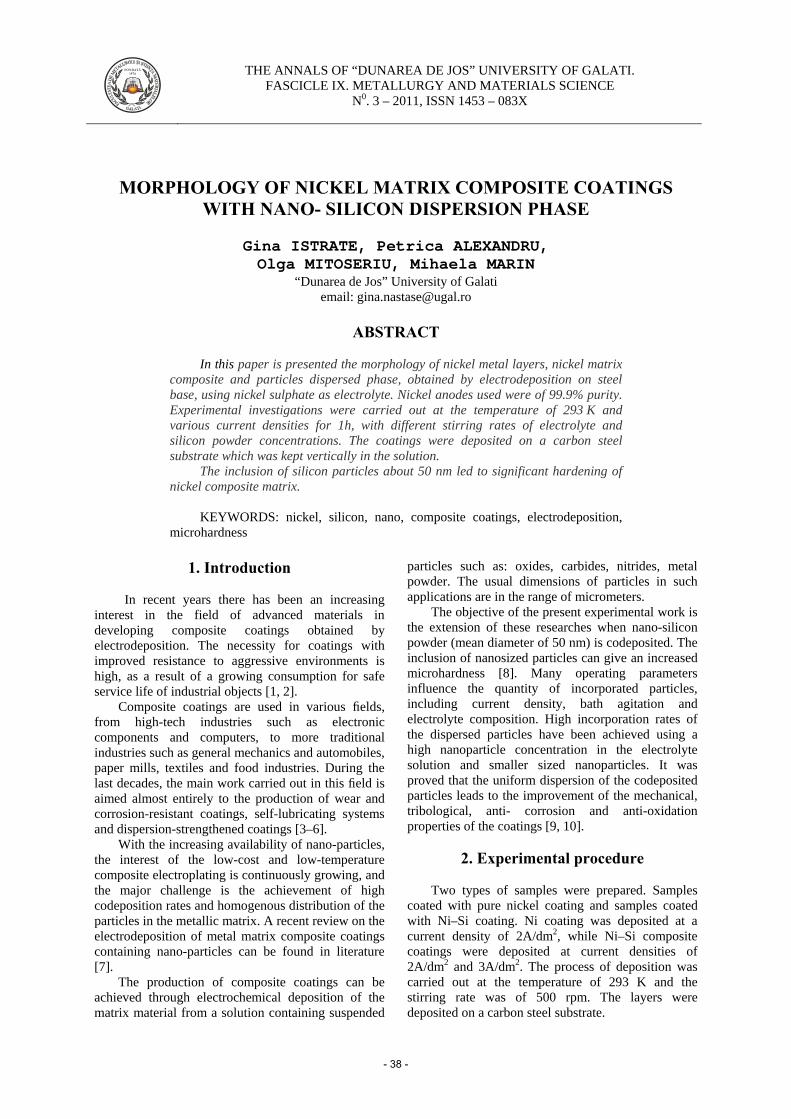
FO N D ATĂ197 6
THE ANNALS OF “DUNAREA DE JOS” UNIVERSITY OF GALATI.
FASCICLE IX. METALLURGY AND MATERIALS SCIENCE N0. 3 – 2011, ISSN 1453 – 083X
MORPHOLOGY OF NICKEL MATRIX COMPOSITE COATINGS WITH NANO- SILICON DISPERSION PHASE
Gina ISTRATE, Petrica ALEXANDRU, Olga MITOSERIU, Mihaela MARIN
“Dunarea de Jos” University of Galati email: [email protected]
ABSTRACT
In this paper is presented the morphology of nickel metal layers, nickel matrix
composite and particles dispersed phase, obtained by electrodeposition on steel base, using nickel sulphate as electrolyte. Nickel anodes used were of 99.9% purity. Experimental investigations were carried out at the temperature of 293 K and various current densities for 1h, with different stirring rates of electrolyte and silicon powder concentrations. The coatings were deposited on a carbon steel substrate which was kept vertically in the solution.
The inclusion of silicon particles about 50 nm led to significant hardening of nickel composite matrix.
KEYWORDS: nickel, silicon, nano, composite coatings, electrodeposition,
microhardness
1. Introduction
In recent years there has been an increasing interest in the field of advanced materials in developing composite coatings obtained by electrodeposition. The necessity for coatings with improved resistance to aggressive environments is high, as a result of a growing consumption for safe service life of industrial objects [1, 2].
Composite coatings are used in various fields, from high-tech industries such as electronic components and computers, to more traditional industries such as general mechanics and automobiles, paper mills, textiles and food industries. During the last decades, the main work carried out in this field is aimed almost entirely to the production of wear and corrosion-resistant coatings, self-lubricating systems and dispersion-strengthened coatings [3–6].
With the increasing availability of nano-particles, the interest of the low-cost and low-temperature composite electroplating is continuously growing, and the major challenge is the achievement of high codeposition rates and homogenous distribution of the particles in the metallic matrix. A recent review on the electrodeposition of metal matrix composite coatings containing nano-particles can be found in literature [7].
The production of composite coatings can be achieved through electrochemical deposition of the matrix material from a solution containing suspended
particles such as: oxides, carbides, nitrides, metal powder. The usual dimensions of particles in such applications are in the range of micrometers.
The objective of the present experimental work is the extension of these researches when nano-silicon powder (mean diameter of 50 nm) is codeposited. The inclusion of nanosized particles can give an increased microhardness [8]. Many operating parameters influence the quantity of incorporated particles, including current density, bath agitation and electrolyte composition. High incorporation rates of the dispersed particles have been achieved using a high nanoparticle concentration in the electrolyte solution and smaller sized nanoparticles. It was proved that the uniform dispersion of the codeposited particles leads to the improvement of the mechanical, tribological, anti- corrosion and anti-oxidation properties of the coatings [9, 10].
2. Experimental procedure
Two types of samples were prepared. Samples
coated with pure nickel coating and samples coated with Ni–Si coating. Ni coating was deposited at a current density of 2A/dm2, while Ni–Si composite coatings were deposited at current densities of 2A/dm2 and 3A/dm2. The process of deposition was carried out at the temperature of 293 K and the stirring rate was of 500 rpm. The layers were deposited on a carbon steel substrate.
- 38 -

FO N D ATĂ197 6
THE ANNALS OF “DUNAREA DE JOS” UNIVERSITY OF GALATI.
FASCICLE IX. METALLURGY AND MATERIALS SCIENCE N0. 3 – 2011, ISSN 1453 – 083X
The Ni - Si coatings were electrodeposited from a suspension of Si nanoparticles (50 nm) in nickel sulphate electrolyte. Suspensions were prepared by adding 10 g/L of Si nanoparticles and they were stirred for 1 h before the deposition. The substrate was steel and the anode pure nickel.
The study of the surface morphology, microhardness measurements were carried out for the characterization of the composite coatings of this work.
The investigation of morphological appearance of coatings was performed with an optical microscope Olympus BX 51M.
The measurements of the Vickers microhardness of pure nickel and Ni-Si composite deposits were performed on their surface by using a 20 g load for a period of 10 s and the corresponding final values were determined as the average of 3 measurements.
3. Results and discussion
3.1. Morphology In Fig. 1 is presented the macrostructure of
metallic support, without nickel coating. A macrography of a pure nickel coating obtained by eletrolitic deposition is shown in Fig. 2 while Ni - Si coatings are shown in Fig. 3 and Fig. 4. Both coatings were electrodeposited at a current density of 2 A/dm2. As it can be observed in Fig. 3 (dark field and bright field illumination), the composite coatings are more compact than the pure one. As a consequence better mechanical and anticorrosive properties of the composite coating should be expected. The surface appearance of metal deposition (Ni) reveals a uniform and compact layer without pores or other defects, which faithfully follows the steel support
Fig. 1 Metallic support
- without Ni coating (X200). Fig. 2. Ni coating, 2A/dm2, 500 rpm
(X400). In figure 3 is presented the macrostructure of Ni-Si coatings (10 g/L Si 50 nm) for operating
conditions: current density – 2A/dm2, time – 60 min, stirring rate – 500rpm.
a) b) c)
Fig. 3. Macrostructure of Ni-Si coating (10g/L Si 50 nm), 2A/dm2, 60 min, 500rpm: a) X400 dark field illumination, b) X500 dark field; c) X1000 dark field.
- 39 -
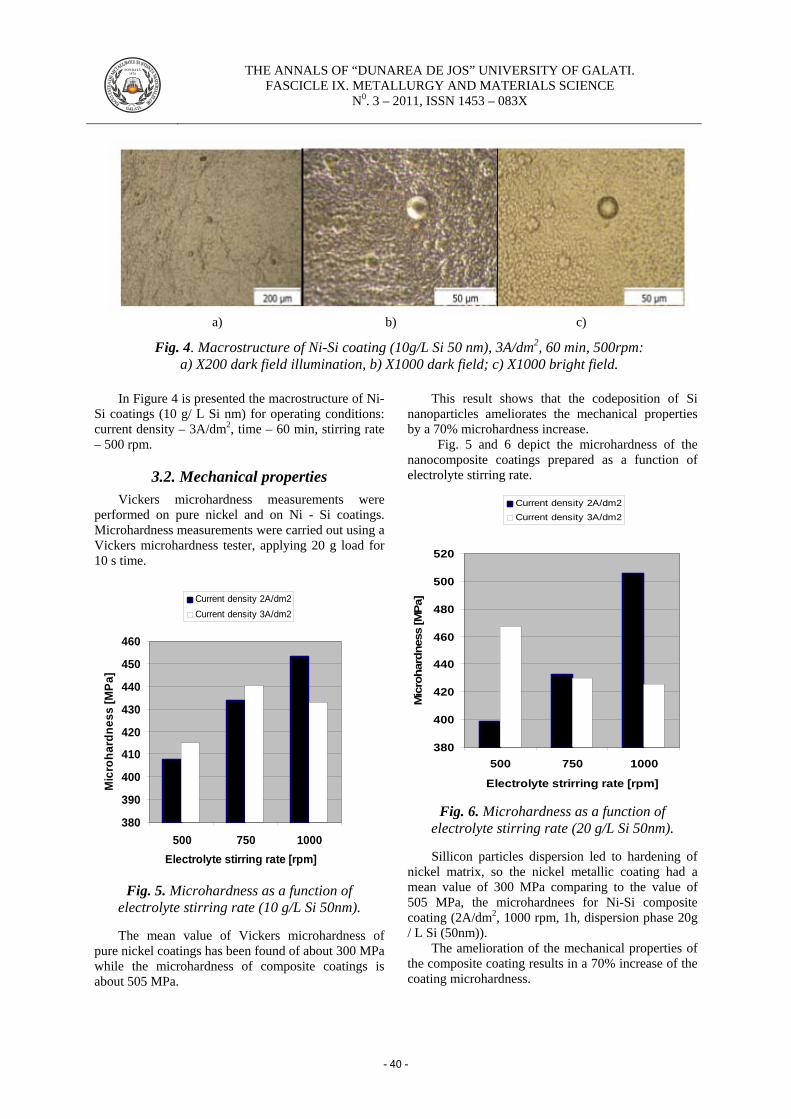
FO N D ATĂ197 6
THE ANNALS OF “DUNAREA DE JOS” UNIVERSITY OF GALATI.
FASCICLE IX. METALLURGY AND MATERIALS SCIENCE N0. 3 – 2011, ISSN 1453 – 083X
a) b) c)
Fig. 4. Macrostructure of Ni-Si coating (10g/L Si 50 nm), 3A/dm2, 60 min, 500rpm: a) X200 dark field illumination, b) X1000 dark field; c) X1000 bright field.
In Figure 4 is presented the macrostructure of Ni-
Si coatings (10 g/ L Si nm) for operating conditions: current density – 3A/dm2, time – 60 min, stirring rate – 500 rpm.
3.2. Mechanical properties
Vickers microhardness measurements were performed on pure nickel and on Ni - Si coatings. Microhardness measurements were carried out using a Vickers microhardness tester, applying 20 g load for 10 s time.
380
390
400
410
420
430
440
450
460
500 750 1000Electrolyte stirring rate [rpm]
Mic
roha
rdne
ss [M
Pa]
Current density 2A/dm2Current density 3A/dm2
Fig. 5. Microhardness as a function of electrolyte stirring rate (10 g/L Si 50nm).
The mean value of Vickers microhardness of
pure nickel coatings has been found of about 300 MPa while the microhardness of composite coatings is about 505 MPa.
This result shows that the codeposition of Si nanoparticles ameliorates the mechanical properties by a 70% microhardness increase. Fig. 5 and 6 depict the microhardness of the nanocomposite coatings prepared as a function of electrolyte stirring rate.
380
400
420
440
460
480
500
520
500 750 1000
Electrolyte strirring rate [rpm]
Mic
roha
rdne
ss [M
Pa]
Current density 2A/dm2Current density 3A/dm2
Fig. 6. Microhardness as a function of electrolyte stirring rate (20 g/L Si 50nm).
Sillicon particles dispersion led to hardening of
nickel matrix, so the nickel metallic coating had a mean value of 300 MPa comparing to the value of 505 MPa, the microhardnees for Ni-Si composite coating (2A/dm2, 1000 rpm, 1h, dispersion phase 20g / L Si (50nm)).
The amelioration of the mechanical properties of the composite coating results in a 70% increase of the coating microhardness.
- 40 -
FO N D ATĂ197 6
THE ANNALS OF “DUNAREA DE JOS” UNIVERSITY OF GALATI.
FASCICLE IX. METALLURGY AND MATERIALS SCIENCE N0. 3 – 2011, ISSN 1453 – 083X
4. Conclusions
The experimental results led to the identification of electrodeposition parameters that provide a very good adhesion to metallic support, the metal layers are compact without pores or other defects, almost flat, with relatively constant thickness.
Significant increase in composite coatings hardness versus nickel coatings certifies that nano-sillicon particles were included and their presence induces a strong hardening in the metal matrix.
References
[1]. I. Gurrappa, L. Binder - Electrodeposition of nanostructured coatings and their characterization - a review, Sci. Technol. Adv. Mater. 9, 043001, 2008. [2]. R. C. Agarwal, Vijaya Agarwal - Electroless alloy/composite coatings: A review, Sadhana, volume 28, issue 3-4, pages 475-493, 2001. [3]. J. Kubisztal, A. Budniok - Electrolytical production of Ni + Mo + Si composite coatings with enhanced content of Si, Applied Surface Science, volume 252, pages 8605–8610, 2006.
[4]. C. Kerr, D. Barker, F. Walsh, J. Archer - The electrodeposition of composite coatings based on metal matrix-included particle deposits, Transactions of the Institute of Metal Finishing A., vol. 78, issue 5, pages 171-178, 2000. [5]. M. Musiani - Electrodeposition of composites: an expanding subject in electrochemical materials science, Electrochimica Acta, volume 45, pages 3397-3402, 2000. [6]. M. Srivastava, V.K.W. Grips, A. Jain and K.S. Rajam - Influence of SiC particle size on the structure and tribological properties of Ni-Co composites, Surface and Coatings Technology, volume 202, issue 2, pages 310-318, 2007. [7]. C.T.J. Low, R.G.A. Wills, F. C. Walsh - Electrodeposition of composite coatings containing nanoparticles in a metal deposit, Surface and Coatings Technology, volume 201, pages 371-383, 2006. [8]. S.T. Aruna, V.K. William Grips, K.S. Rajam - Ni-based electrodeposited composite coating exhibiting improved microhardness, corrosion and wear resistance properties, Journal of Alloys and Compounds volume 468, pages 546–552, 2009. [9]. T. Borkara, S. Harimkar - Effect of electrodeposition conditions and reinforcement content on microstructure and tribological properties of nickel composite coatings, Surface and coatings Technology, volume 205, issues 17-18, pages 4124-4134, 2011. [10]. I Garcia, J.-P Celis - Electrodeposition and sliding wear resistance of nickel composite coatings containing micron and submicron SiC particles, Surface and Coatings Technology, volume 148, issue 2-3, pages 171-178, 2000.
- 41 -
FO N D ATĂ197 6
THE ANNALS OF “DUNAREA DE JOS” UNIVERSITY OF GALATI.
FASCICLE IX. METALLURGY AND MATERIALS SCIENCE N0. 3 – 2011, ISSN 1453 – 083X
SPECTROPHOTOMETRIC DETERMINATION OF OS(VIII) WITH NITROSO R SALT AS CHROMOGENIC REAGENT
Rodica WENKERT1, Carmen PADURARU2, Lavinia TOFAN2,
Strul MOISA3 1„ Soroka” University Medical Center , Beer-Sheva, Israel
2„Gh. Asachi” Technical University of Iasi, Faculty of Chemical Engineering and Environmental Protection 3„Ben-Gurion” University of the Negev, Beer-Sheva, Israel
email: [email protected]
ABSTRACT
Several methods have been reported for the spectrophotometric determination of osmium with various chromogenic reagents. Some of these reagents react slowly with osmium and the conditions for obtaining reproductibile colours are usually empirical.
In this context, a simple and sensitive spectrophotometric method for the determination of trace amounts of osmium(VIII) using disodium-1-nitroso-2-hydroxynaphthalene-3,6- disulphonate (Nitroso R salt) is described. The method is based on the formation of an Os–Nitroso R salt complex which exhibits two different colours as function of pH. Linear calibration graphs are obtained up to 60μg/mL of the analyte at pH = 4.8. The stoichiometry of the complex is found to be 1: 4 by mole ratio method. The method is optimized and different analytical parameters were evaluated. For instance, the calculated values for the molar absorptivity are of 3.645.103 L/mol.cm (pH=0; λ= 550nm) and 1.695.103 L/mol.cm (pH=4.8; λ=510nm), respectively. The proposed method should be valuable for the determination of osmium(VIII) with good accuracy and precision.
KEYWORDS: osmium, spectrophotometric determination, Nitroso R salt,
chromogenic reagents
1. Introduction
Osmium is the rarest and a trace platinum–group element in the Earth’s crust; it is usually accompanied by many other elements. It is frequently used in small quantities in alloys where frictional wear must be minimized. These alloys are typically used in ballpoint pen tips, fountain pen tips, record player needles, electrical contacts and high pressure bearings. It is therefore not surprising that osmium is no longer considered industrially important, considering this list of applications. A less dated application of osmium is in the platinum/osmium (in a 90:10 ratio) alloy used in implants such as pacemakers and replacement valves. Osmium compounds are used in many processes of organic synthesis. For example, heterometal complexes of osmium with chromium are efficient catalysts of alcohol oxidation, the reaction by–product being only water. Such reactions are promising in the so–called green chemistry [1]. Osmium compounds are used in medical, biological and tomographic studies. There
are osmium compounds characterized by antitumor activity. Osmium containing reagents are promising for diagnostics of the presence of specific DNA nucleotide sequences [1].
The quantitative determination of osmium in complex samples usually demands considerable efforts at all stages of the analysis because Os is likely to participate in redox processes and dissolution of the samples can be accompanied by osmium losses as a result of incomplete dissolving and the formation of volatile OsO4. Unfortunately, the number of spectrophotometric methods providing rapid quantitative determination of osmium in real samples is rather small [1]. Spectrophotometric methods involving organic reagents (Table 1) are often used in the analytical practice, though most of these methods demand complicated sample preparation, e.g. preliminary separation of osmium in the form of tetraoxide, or the extraction of coloured osmium compounds by means of organic solvents. Therefore the search for new accessible, selective and sensitive reagents, which would make it possible to determine
- 42 -

FO N D ATĂ197 6
THE ANNALS OF “DUNAREA DE JOS” UNIVERSITY OF GALATI.
FASCICLE IX. METALLURGY AND MATERIALS SCIENCE N0. 3 – 2011, ISSN 1453 – 083X
the total osmium content, independently of the form of osmium in the analyte, is a very actual task.
Table 1. Chromogenic reagents for the spectrophotometric determination of osmium
Reagent Remarks Refe- rence
Thiobenzhydrazides
The formed colored complexes are stable for more than 12 hours and
their molar absorptivities are in the 104 range.
[2]
Ethyl isobutrazine
hydro chloride
The reagent reacts with Os(VIII) to form red
complex species instantaneously in 2M HCl
at 25∓20C
[3]
4– (2- pyridylazo) resorcinol
The orange – red mixed complex of Os absorbs light at λmax= 530nm with a molar
absorptivity of 2.5·104 L/mol·cm
[4]
Pyro catechol and
hydroxyl amide
An ethanolic solution of pyrocatechol in the presence
of hydroxyamide and Os(VIII)on heating at a pH between 7.0 and 9.0 gives a
very sensitive color reaction.
[5]
5 – chloro – 2 –
hydroxythiobenzhydrazi
de
Beer’s law was obeyed in the concentration range of 1.8 – 14.4 ppm of osmium in a chloroform solution at
510 nm. The molar absorptivity was 1.056·104
L/mol·cm.
[6]
Carminic acid
peroxide
The method is based on the osmium catalytic effect on the oxidation of carminic
acid by hydrogen peroxide.
[7]
Basic dyes
The catalytic effect on the oxidation reactions on
methylene blue, buthylrhodamine B and nile blue by KIO4 is applied for the determination of Os(IV)
in the acidic medium at 90∓0.50C.
[8]
Allyl thiourea
Os(VIII) forms a 1:1 complex with allylthiourea. Conformity to Beer’s law
was observed for up to 20μg/mL of osmium in acidic medium (molar absorptivity 2.17·104 L/mol·cm at 298nm)
[9]
Pheno thiazine
derivatives
Phenothiazine derivatives readily react with osmium in acid or buffer media to yield colored species which could
be followed spectrophotometrically.
[10]
Phenanthrenequinone
monoxime
Beer’s law is obeyed in the concentration range of 1.0 – 10.9 μg of osmium in 10 mL
of chloroform.
[11]
Ethylene thiourea
The method is based on the formation of an
instantaneously purple colored complex at room temperature in strongly acidic (pH=1) solution
having absorption maximum at 490 nm.
[12]
The first attempts of spectrophotometric determination of osmium using Nitroso R salt as chromogenic reagent have been reported by S. Nath and R.P. Agarwal [13]. Their study was focused on the establishment of the optimum conditions of complex formation and Beer’s law conformity.
Due to the fact that the speciality literature contains litle information regarding the complex formed between osmium and Nitroso - R salt, our aim was to carry out a detailed study on the conditions of this complex formation. In this context, the influence of the solutions pH, heating time and the concentration of ligand and metallic ion have been studied.
2. Experimental research
2.1.Reagents and apparatus The experiments were performed with: -Stock solution of osmium of 3mg/mL
concentration which has been obtained by the dissolution of OsO4 in 0.5M HCl. The working solutions were prepared by the dilution of the corresponding amount of the stock solution with bidistilled water at 25 mL.
-The aqueous solution of the Nitroso–R salt (NRS) with a concentration of 10-2M
-The pH adjustments were made with the solutions of HCl, CH3COOH and CH3COONa
-The pH values of the solutions were measured with a Radiometer pH M64 pH –meter.
-The absorbance of the solutions was measured on a 104D-WPA spectrophotometer, using glass cells of 1cm.
- 43 -

FO N D ATĂ197 6
THE ANNALS OF “DUNAREA DE JOS” UNIVERSITY OF GALATI.
FASCICLE IX. METALLURGY AND MATERIALS SCIENCE N0. 3 – 2011, ISSN 1453 – 083X
2.2.Methodology of determination To a volume of maximum 5 mL of solution
containing osmium (0.3-1.5mg) 10mL of Nitroso–R salt solution and 5 mL of buffer acetate(or a determined volume of 2N HCl) were added. Then, the mixture is heating on a bath water, for 2 hours, at boiling. After cooling, the solution is quantitatively passed with bidistiled water into a flask of 25 mL and its absorbance is measured versus a blank sample.
3. Results and discussion Due to the extraordinary chemical inertness of
Os(VIII), the complex with nitroso–R salt is formed only after a continuous heating on a water bath at boiling the minimum time of heating being of two hours. The complex is stable more than 24 hours.
In the case of Os–NRS complex, the change of absorbance as function of the solution pH (Figure 1) indicates a strong influence of the acidity on this complex formation and stability.
Fig.1. The effect of the solution pH on
the Os–NRS complex (COs=1.89x10⁻⁴ mol/L; CSRN= 10-2mol/L).
According to Figure 1, it is obvious the
existence of two ranges of pH in which the Os–NRS complex exhibits different colours. Thus, in hydrochloric solutions (pH=0) a violet color is obtained, while in acetate buffer solutions a green color with the absorption maximum at pH=5 appeared.
In order to study the behavior of the Rh(III) and Os(VIII) mixture, the experiments were performed more in acetate medium.
The absorption spectra of the Os(VIII) complex at pH=0 and pH=4.8, by comparison with that of the Nitroso– R salt reagent are shown in Figure 2.
It can be seen in Figure 2 that the complex spectrum recorded at pH=0 exhibits an absorption maximum at λ=550nm. On the other hand, the spectrum from the acetate medium exhibits two maxima, at λ=510nm and 620nm, respectively.
Fig. 2. Absorption spectra for:
1- Nitroso-Rsalt reagent; 2-Os-NRS complex at pH= 4.8; 3-Os-NRS complex at pH=0.
(COs= 1.261x10⁻⁴mol/L; CNRS= 10-2mol/L).
In order to establish the linearity range of the absorbance–osmium concentration dependence, the calibration curves were performed at pH=0 and pH=4.8, the absorbance measurements being accomplished at three wavelengths (Fig. 3).
Fig. 3. The calibration curves at the determination of Os(VIII) with NRS
pH= 0, λ= 550nm (●); pH = 4.8, λ= 510 nm (■), λ= 620nm (▲).
The statistical parameters characteristic to the
calibration curves for the spectrophotometric determination of Os(VIII) with Nitroso–R salt as chromogenic reagent are listed in Table 2.
- 44 -

FO N D ATĂ197 6
THE ANNALS OF “DUNAREA DE JOS” UNIVERSITY OF GALATI.
FASCICLE IX. METALLURGY AND MATERIALS SCIENCE N0. 3 – 2011, ISSN 1453 – 083X
Table 2. Analytical parameters
Reaction medium
Parameter
pH = 0
(λ= 550)
pH = 4.8 (λ= 510)
pH =4.8 (λ= 620)
Intercept Slope (L/μg)
Correlation coefficient (R2)
RSD (%) Linear dynamic range
(μg/mL) Molar absorptivity
(L/mol.cm)
0.014 0.0173·10-3
0.9935 1.26
6- 24
3.645·103
0.016 0.0065·10-3
0.9946 2.68
12- 60
1.695·103
0.0099 0.0062·10-3
0.9975 2.70
12- 60
1.458·103
The composition of the Os–NRS complex has
been established by the mole ratio method. This method involves the variation of the ligand amount,
while the amount of metal is keeping constant. The method was applied at pH=0 and 4.8, respectively (Figure 3 and Figure 4).
Fig. 3. Establishment of the combination ratio for the Os–NRS complex. COs= 0.1892x10⁻³mol/L;
CNRS- changing ; λ= 510nm; pH = 4.8.
Fig. 4. Establisment of the combination ratio for the Os–NRS complex formed in solutions of
pH =0 ; COs = 0.1263x10⁻³mol/L; CNRS= changing; λ= 550nm.
From the analysis of the obtained plots, it is
obvious that by the metal–ligand interaction a complex with the combination ratio of 1Me: 4L is formed.
The complex of green color formed at pH=4.8 is characterized by a constant stability with the value of β= 1.5203x10¹⁵.
This combination ratio might be due to the fact that in the hydrochloric media OsO4 is unstable and reduces at low states of oxidation.
According to Losev’s and Kudrina’s research findings [14], as a result of the temperature increasing, in solution is formed the hexachlorosmat (IV) which by interaction with Nitroso–R salt leads to the formation of new Os–O bonds.
The most probable modality of osmium bonding would be the formation of the stable cycles I and II, corresponding to the enolic or cetonic form of the Nitroso–R salt.
- 45 -

FO N D ATĂ197 6
THE ANNALS OF “DUNAREA DE JOS” UNIVERSITY OF GALATI.
FASCICLE IX. METALLURGY AND MATERIALS SCIENCE N0. 3 – 2011, ISSN 1453 – 083X
N O
SO3NaSO3Na
O
MN
SO3NaSO3Na
O
O
M
(I) (II)
4. Conclusions
• The complexation reaction between Os(VIII)
and Nitroso–R salt depends on the solution pH; the complex may be formed both in acidic medium of pH = 0 (hydrochloric solutions) and at pH 4.8(acetate buffer)
• The products of the reaction are: − at pH=0 a complex of violet color
having the maximum absorbance at λ= 550nm;
− at pH=5, a green complex with the maximum absorbance at λ1=510nm and λ2= 620nm.
• The calibration curve is linear up to 60μg/mL at pH = 4.8.
• The composition of the Os–NRS complex, established by the mole ratio method, is of 1Os to 4NRS.
• The calculation of the stability complex of the Os–NRS complex leads to the value β= 1.5203x10¹⁵.
References
[1]. D.B. Petrenko, O.A. Tyutyumuk, Yu.M. Dedkov - Catalytic kinetic methods for determining osmium(review), Inorganic Materials 46(2010) 1493 – 1498. [2]. S.C. Shome, S. Nandy, A. Guhathakurta, N.C. Ghosh, H.R. Das, P.K. Gangopadhyay - Spectrophotometric determination of ruthenium, rhenium, osmium and platinum with organic thiohydrazides, Mikrochim Acta 70(1978) 343 – 357 .
[3]. A. Thimme Gowda, N.M. Made Gowda - Spectrophotometric determination of osmium with ethylisobutrazine hydrochloride, Microchimica Acta 88(1987)351 – 357. [4]. S. Dadfarnia, M. Shamsipur - Extraction–spectrophotometric determination of osmium using 4–(2- pyridylazo) resorcinol, Bull. Chem. Soc. Jpn. 64(1991)3063- 3066. [5]. M.K. Deb, N. Mishra, K.S. Patel, R.K. Mishra - Sensitive spectrophotometric determination of osmium with pyrocatechol and hydroxyamide,Analyst 116(1991) 323– 325. [6]. S.S. Sawant - Sequential separation and spectrophotometric determination of osmium and platinum with 5–chloro–2–hydroxythiobenzhydrazide, Anal. Sci. 25(2009) 813– 818. [7]. J.L. Manzoori, M.H. Sorouraddin, M. Amjadi - Spectrophotometric determination of osmium based on its catalytic effect on the oxidation of carminic acid by hydrogen peroxide, Talanta 53(2000) 61– 68. [8]. Q.E. Cao, Z.Li, J. Wang, C.Li - Catalytic spectrophotometric determination of osmium based on oxidation of basic dyes, Chem. Anal.(Warsaw) 47(2002) 701–712. [9]. B. Morelli - Allylthiourea as a reagent for the spectrophotometric determination of osmium, Analyst 111(1986)1289–1292. [10]. J. Seetharamappa, N. Motohashi, D. Kovala–Demertzi - Application of phenothiazine derivatives and other compounds for the determination of metals in various samples, Current Drug Targets 7(2006) 1107–1121. [11]. A. Wasey, R.K. Bansal, B.K. Puri - Spectrophotometric determination of iridium(III) and osmium(VIII) with phenanthrenequinone monoxime after extraction into molten naphtalene, Microchimica Acta 82(1984) 211 – 220. [12]. B. Joseph, S. John, M. Prajila, A. Joseph - Spectrophotometric determination of osmium(VIII) in trace amounts using ethylene thiourea(ETU) as chromogenic reagent, Indian Journal of Chemical Technology 18(2011) 113 -117 [13]. C. Paduraru - Ph. D. Thesis „Analitycal Chemistry of Platinum Metals” (2005) [14]. V.N. Losev, Yu. V. Kudrina, A.K. Trofimchuk, P.N. Komozin - Features of the sorptive extraction of osmium in different states with silica gels chemically modified with mercapto and disulfide groups, J. Anal. Chem. 59(2004) 546 - 551
- 46 -
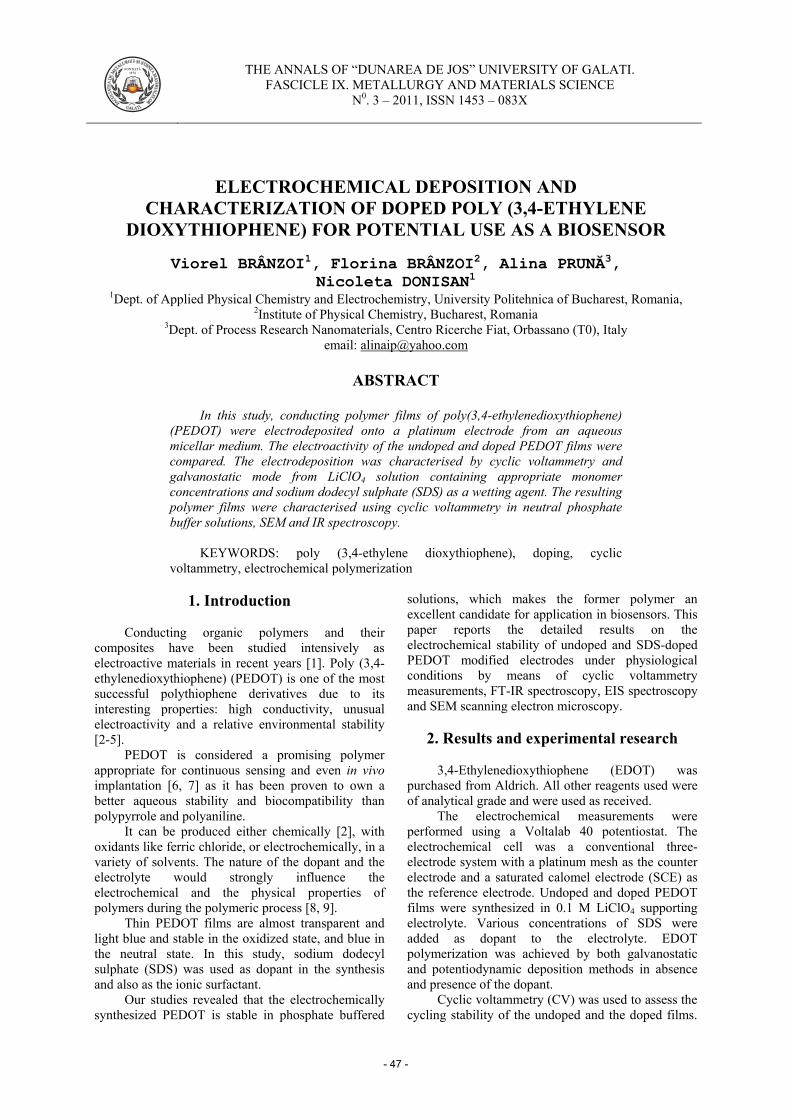
FO N D ATĂ197 6
THE ANNALS OF “DUNAREA DE JOS” UNIVERSITY OF GALATI.
FASCICLE IX. METALLURGY AND MATERIALS SCIENCE N0. 3 – 2011, ISSN 1453 – 083X
ELECTROCHEMICAL DEPOSITION AND CHARACTERIZATION OF DOPED POLY (3,4-ETHYLENE
DIOXYTHIOPHENE) FOR POTENTIAL USE AS A BIOSENSOR
Viorel BRÂNZOI1, Florina BRÂNZOI2, Alina PRUNĂ3, Nicoleta DONISAN1
1Dept. of Applied Physical Chemistry and Electrochemistry, University Politehnica of Bucharest, Romania, 2Institute of Physical Chemistry, Bucharest, Romania
3Dept. of Process Research Nanomaterials, Centro Ricerche Fiat, Orbassano (T0), Italy email: [email protected]
ABSTRACT
In this study, conducting polymer films of poly(3,4-ethylenedioxythiophene)
(PEDOT) were electrodeposited onto a platinum electrode from an aqueous micellar medium. The electroactivity of the undoped and doped PEDOT films were compared. The electrodeposition was characterised by cyclic voltammetry and galvanostatic mode from LiClO4 solution containing appropriate monomer concentrations and sodium dodecyl sulphate (SDS) as a wetting agent. The resulting polymer films were characterised using cyclic voltammetry in neutral phosphate buffer solutions, SEM and IR spectroscopy.
KEYWORDS: poly (3,4-ethylene dioxythiophene), doping, cyclic
voltammetry, electrochemical polymerization
1. Introduction Conducting organic polymers and their
composites have been studied intensively as electroactive materials in recent years [1]. Poly (3,4-ethylenedioxythiophene) (PEDOT) is one of the most successful polythiophene derivatives due to its interesting properties: high conductivity, unusual electroactivity and a relative environmental stability [2-5].
PEDOT is considered a promising polymer appropriate for continuous sensing and even in vivo implantation [6, 7] as it has been proven to own a better aqueous stability and biocompatibility than polypyrrole and polyaniline.
It can be produced either chemically [2], with oxidants like ferric chloride, or electrochemically, in a variety of solvents. The nature of the dopant and the electrolyte would strongly influence the electrochemical and the physical properties of polymers during the polymeric process [8, 9].
Thin PEDOT films are almost transparent and light blue and stable in the oxidized state, and blue in the neutral state. In this study, sodium dodecyl sulphate (SDS) was used as dopant in the synthesis and also as the ionic surfactant.
Our studies revealed that the electrochemically synthesized PEDOT is stable in phosphate buffered
solutions, which makes the former polymer an excellent candidate for application in biosensors. This paper reports the detailed results on the electrochemical stability of undoped and SDS-doped PEDOT modified electrodes under physiological conditions by means of cyclic voltammetry measurements, FT-IR spectroscopy, EIS spectroscopy and SEM scanning electron microscopy.
2. Results and experimental research
3,4-Ethylenedioxythiophene (EDOT) was purchased from Aldrich. All other reagents used were of analytical grade and were used as received.
The electrochemical measurements were performed using a Voltalab 40 potentiostat. The electrochemical cell was a conventional three-electrode system with a platinum mesh as the counter electrode and a saturated calomel electrode (SCE) as the reference electrode. Undoped and doped PEDOT films were synthesized in 0.1 M LiClO4 supporting electrolyte. Various concentrations of SDS were added as dopant to the electrolyte. EDOT polymerization was achieved by both galvanostatic and potentiodynamic deposition methods in absence and presence of the dopant.
Cyclic voltammetry (CV) was used to assess the cycling stability of the undoped and the doped films.
- 47 -

FO N D ATĂ197 6
THE ANNALS OF “DUNAREA DE JOS” UNIVERSITY OF GALATI.
FASCICLE IX. METALLURGY AND MATERIALS SCIENCE N0. 3 – 2011, ISSN 1453 – 083X
The modified electrodes were subjected to successive cycles CV test, at a scan rate of 25 mVs−1, and the CV curves were measured.
All of the assessment measurements for the obtained films were performed in 0.1M phosphate buffered saline (PBS) solutions (pH 7) and the potentials are given against SCE, unless stated otherwise.
Electrochemical impedance spectroscopy (EIS) was employed to assess the properties of PEDOT films by using the Voltalab 40 equipment.
Morphologies of the polymer-coated electrodes were examined using a Philips SEM-500 scanning electron microscope, at an accelerating voltage of 12 kV, and the formation of PEDOT film was assessed by a Nicolet FT-IR spectrophotometer.
PEDOT films were electropolymerized at the surface of a bare platinum electrode by cyclic
voltammetry in the - 0.4 V and 1.2 V potential range. As can clearly be seen in Figure 1, in absence of a dopant, the reaction current increases sharply when the applied potential is larger than 0.7 V, which reveals the formation of the radical cations [10]. The increased current implies that the EDOT radical cations start to electropolymerize onto the platinum electrode.
In the presence of SDS (Figure 1b), it is observed that the current response of doped PEDOT films decreases as the dopant concentration increases. Moreover, the current decreases with continuous cycling in the potential range (Figure 1b). During the first potential scan, the polymerization potential of PEDOT on Pt is around 0.985 V, while the onset of polymerization shifts significantly on the following scans to more positive potentials and stabilizes at 1.080 V, for concentrations above 75 mM SDS.
-600 -400 -200 0 200 400 600 800 1000 1200 1400-0.5
0.0
0.5
1.0
1.5
2.0
2.5
i [m
A]
E [mV]0 700 1400
0
1
2
I [m
A]
E [mV]
0 10 100
a) b) Fig. 1. The cyclic voltammograms of EDOT polymerization at a scan rate of 20 mVs-1 in a) absence of
SDS, b) 1st cycle and c) 10th cycle in presence of different SDS concentrations.
Table 1. Polymerization potential of SDS-doped PEDOT film as a function of SDS concentration
[SDS] mM
Polymerization potential [mV]
0 818 10 815 25 832 50 865 75 886
100 900
The choice of the electrochemical synthesis method has an influence on the morphology, appearance and adhesion of the polymer [11]. Generally, films obtained by alternating polarization are more adhesive and smoother than the ones obtained at a constant current or potential. As it can be seen in Table 1, when a 0.25 mAcm-2 constant
current is employed for the electrosynthesis of PEDOT films, the polymerization potential ranges the 0.8-0.9 V potential window and it increases as the SDS concentration value increases. All PEDOT films were smooth and adherent to the surface of Pt electrode. The electrochemical behavior of the PEDOT films deposited electrochemically from
- 48 -

FO N D ATĂ197 6
THE ANNALS OF “DUNAREA DE JOS” UNIVERSITY OF GALATI.
FASCICLE IX. METALLURGY AND MATERIALS SCIENCE N0. 3 – 2011, ISSN 1453 – 083X
aqueous solution, in absence and presence of SDS, was further characterized by using cyclic voltammetry. These films can be cycled repeatedly between the conducting (oxidized) and the insulating (neutral) state, without significant decomposition of the material, which is consistent with the results reported in the literature [12].
The current–voltage characteristic of SDS doped PEDOT films in the potential range of −0.4 to 0.6V in 0.1 M PBS solution (pH 7) is shown in Figure 2. For comparison, the current–voltage wave of undoped PEDOT polymerized in 0.1 M LiClO4 electrolyte is
also displayed. As can be seen, the curves of these polymer films have a nearly rectangular shape, which is typical of the pure capacitive behavior of the tested object [13]. However, the current of film obtained by potentiodynamic method in presence of 75 mM dopant is nearly 3 times that of the film gained in absence of the dopant, which proves that more SDS can hinder the polymer electroactivity after a certain concentration. The same observation can be made for the case of galvanostatic synthesis, the decrease of film current being more evident as the SDS concentration increases.
-400 -200 0 200 400 600-0.2
-0.1
0.0
0.1
0.2
0.3
0.4
I [m
A]
E [mV]
A B C E
Fig. 2. Voltammetric behavior of the PEDOT/SDS/Pt electrode in comparison with the PEDOT/Pt electrode obtained by potentiodynamic mode: A – in absence of SDS, B – in presence of 75 mM SDS
and galvanostatic electrodeposition mode in presence of: C – 10 mM SDS, D – 100 mM SDS in 0.1M LiClO4 electrolyte at 25 mVs-1
Electrochemical impedance spectrometry is a
more reliable technique than cyclic voltammetry for measuring the capacitance with minimised effect from non-capacitive Faradaic contributions [14]. Therefore, the doped and pure polymer films were studied by EIS. The resulting Nyquist plots for PEDOT and SDS-doped PEDOT systems obtained by galvanostatic and potentiodynamic modes are shown in Figures 3 and 4. As can be observed in Figure 3, the Nyquist plot for PEDOT film is featured by a vertical trend at low frequencies, indicating a capacitive behaviour according to the equivalent circuit theory. When SDS was added to the polymer, the capacitive behaviour could be observed to be replaced by the more inclined diffusion line as the SDS concentration increased. It can be said that
increasing SDS concentration leads to an increasing diffusive behaviour, observation corroborated with the changed morphology of doped PEDOT film in Figure 5c.
The capacitances of the electrode materials were calculated according to the equation: C = -1/(2πf Zim (f = frequency; Zim = imaginary impedance), from the slope of the linear correlation between the imaginary impedance and the reciprocal of the frequency at low frequencies (see Figure 4c). One can observe the decrease of capacitance value for SDS-doped PEDOT films as compared with undoped ones: it is smaller as the SDS concentration increases (see Table 2). The SDS leads to increased capacitance value but only if added up to 10 mM concentration to the polymerization electrolyte.
- 49 -
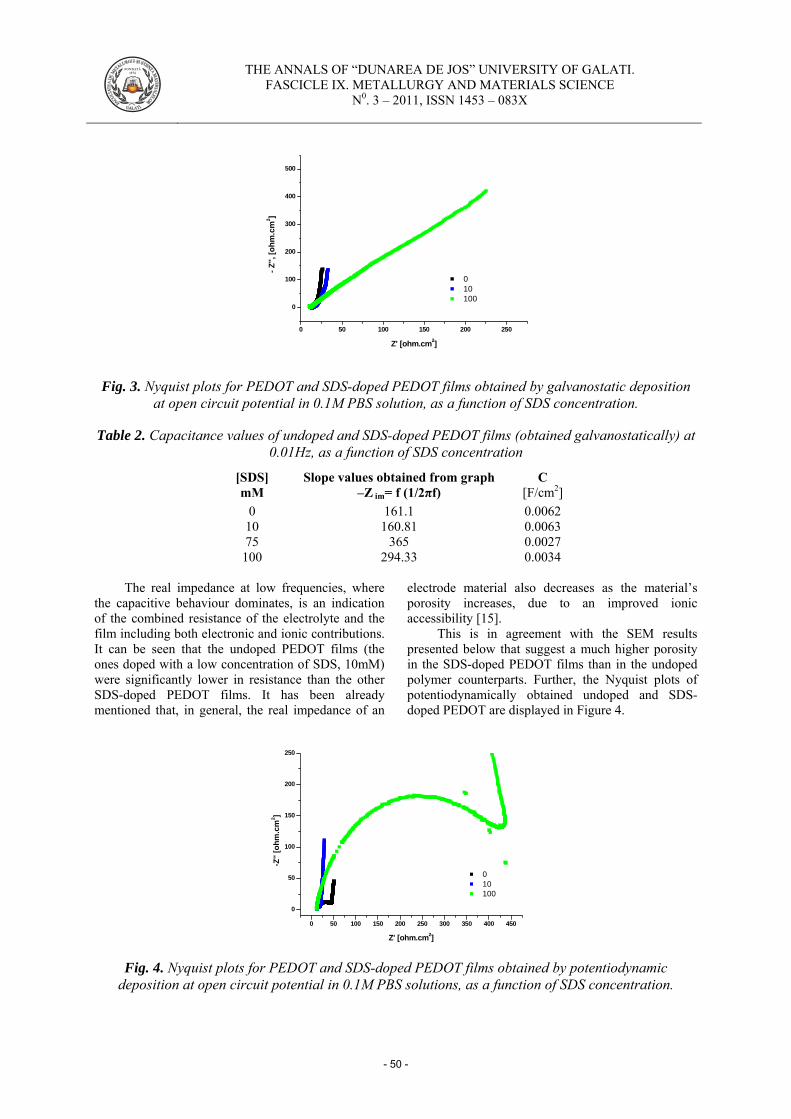
FO N D ATĂ197 6
THE ANNALS OF “DUNAREA DE JOS” UNIVERSITY OF GALATI.
FASCICLE IX. METALLURGY AND MATERIALS SCIENCE N0. 3 – 2011, ISSN 1453 – 083X
0 50 100 150 200 250
0
100
200
300
400
500
- Z'',
[ohm
.cm
2 ]
Z' [ohm.cm2]
0 10 100
Fig. 3. Nyquist plots for PEDOT and SDS-doped PEDOT films obtained by galvanostatic deposition at open circuit potential in 0.1M PBS solution, as a function of SDS concentration.
Table 2. Capacitance values of undoped and SDS-doped PEDOT films (obtained galvanostatically) at
0.01Hz, as a function of SDS concentration
[SDS] mM
Slope values obtained from graph –Z im= f (1/2πf)
C [F/cm2]
0 161.1 0.0062 10 160.81 0.0063 75 365 0.0027
100 294.33 0.0034
The real impedance at low frequencies, where the capacitive behaviour dominates, is an indication of the combined resistance of the electrolyte and the film including both electronic and ionic contributions. It can be seen that the undoped PEDOT films (the ones doped with a low concentration of SDS, 10mM) were significantly lower in resistance than the other SDS-doped PEDOT films. It has been already mentioned that, in general, the real impedance of an
electrode material also decreases as the material’s porosity increases, due to an improved ionic accessibility [15].
This is in agreement with the SEM results presented below that suggest a much higher porosity in the SDS-doped PEDOT films than in the undoped polymer counterparts. Further, the Nyquist plots of potentiodynamically obtained undoped and SDS-doped PEDOT are displayed in Figure 4.
0 50 100 150 200 250 300 350 400 450
0
50
100
150
200
250
-Z''
[ohm
.cm
2 ]
Z' [ohm.cm2]
0 10 100
Fig. 4. Nyquist plots for PEDOT and SDS-doped PEDOT films obtained by potentiodynamic
deposition at open circuit potential in 0.1M PBS solutions, as a function of SDS concentration.
- 50 -
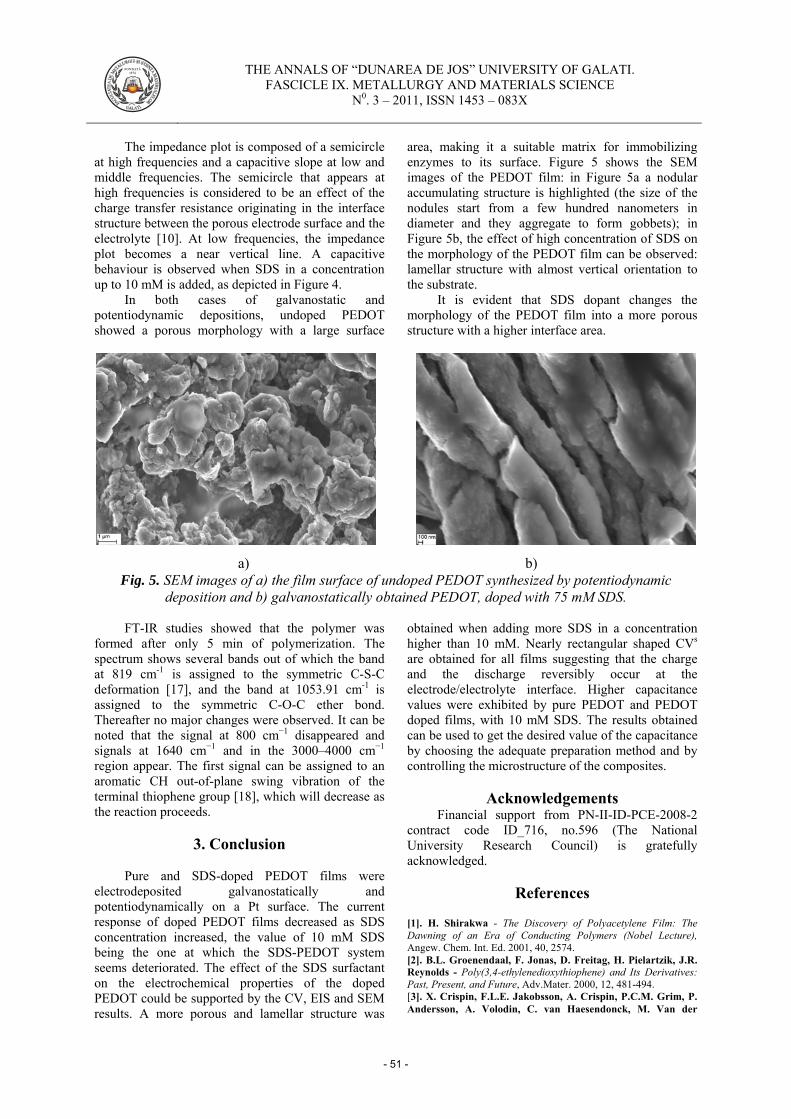
FO N D ATĂ197 6
THE ANNALS OF “DUNAREA DE JOS” UNIVERSITY OF GALATI.
FASCICLE IX. METALLURGY AND MATERIALS SCIENCE N0. 3 – 2011, ISSN 1453 – 083X
The impedance plot is composed of a semicircle at high frequencies and a capacitive slope at low and middle frequencies. The semicircle that appears at high frequencies is considered to be an effect of the charge transfer resistance originating in the interface structure between the porous electrode surface and the electrolyte [10]. At low frequencies, the impedance plot becomes a near vertical line. A capacitive behaviour is observed when SDS in a concentration up to 10 mM is added, as depicted in Figure 4.
In both cases of galvanostatic and potentiodynamic depositions, undoped PEDOT showed a porous morphology with a large surface
area, making it a suitable matrix for immobilizing enzymes to its surface. Figure 5 shows the SEM images of the PEDOT film: in Figure 5a a nodular accumulating structure is highlighted (the size of the nodules start from a few hundred nanometers in diameter and they aggregate to form gobbets); in Figure 5b, the effect of high concentration of SDS on the morphology of the PEDOT film can be observed: lamellar structure with almost vertical orientation to the substrate.
It is evident that SDS dopant changes the morphology of the PEDOT film into a more porous structure with a higher interface area.
a) b) Fig. 5. SEM images of a) the film surface of undoped PEDOT synthesized by potentiodynamic
deposition and b) galvanostatically obtained PEDOT, doped with 75 mM SDS.
FT-IR studies showed that the polymer was formed after only 5 min of polymerization. The spectrum shows several bands out of which the band at 819 cm-1 is assigned to the symmetric C-S-C deformation [17], and the band at 1053.91 cm-1 is assigned to the symmetric C-O-C ether bond. Thereafter no major changes were observed. It can be noted that the signal at 800 cm−1 disappeared and signals at 1640 cm−1 and in the 3000–4000 cm−1 region appear. The first signal can be assigned to an aromatic CH out-of-plane swing vibration of the terminal thiophene group [18], which will decrease as the reaction proceeds.
3. Conclusion
Pure and SDS-doped PEDOT films were electrodeposited galvanostatically and potentiodynamically on a Pt surface. The current response of doped PEDOT films decreased as SDS concentration increased, the value of 10 mM SDS being the one at which the SDS-PEDOT system seems deteriorated. The effect of the SDS surfactant on the electrochemical properties of the doped PEDOT could be supported by the CV, EIS and SEM results. A more porous and lamellar structure was
obtained when adding more SDS in a concentration higher than 10 mM. Nearly rectangular shaped CVs are obtained for all films suggesting that the charge and the discharge reversibly occur at the electrode/electrolyte interface. Higher capacitance values were exhibited by pure PEDOT and PEDOT doped films, with 10 mM SDS. The results obtained can be used to get the desired value of the capacitance by choosing the adequate preparation method and by controlling the microstructure of the composites.
Acknowledgements Financial support from PN-II-ID-PCE-2008-2
contract code ID_716, no.596 (The National University Research Council) is gratefully acknowledged.
References [1]. H. Shirakwa - The Discovery of Polyacetylene Film: The Dawning of an Era of Conducting Polymers (Nobel Lecture), Angew. Chem. Int. Ed. 2001, 40, 2574. [2]. B.L. Groenendaal, F. Jonas, D. Freitag, H. Pielartzik, J.R. Reynolds - Poly(3,4-ethylenedioxythiophene) and Its Derivatives: Past, Present, and Future, Adv.Mater. 2000, 12, 481-494. [3]. X. Crispin, F.L.E. Jakobsson, A. Crispin, P.C.M. Grim, P. Andersson, A. Volodin, C. van Haesendonck, M. Van der
- 51 -

FO N D ATĂ197 6
THE ANNALS OF “DUNAREA DE JOS” UNIVERSITY OF GALATI.
FASCICLE IX. METALLURGY AND MATERIALS SCIENCE N0. 3 – 2011, ISSN 1453 – 083X
Auweraer, W.R. Salaneck, M. Berggren - The Origin of the High Conductivity of Poly(3,4-ethylenedioxythiophene) − Poly(styrene-sulfonate) (PEDOT−PSS) Plastic Electrodes, Chem. Mat. 2006, 18 4354. [4]. D.W. Breiby, L.B. Samuelsen, B. Groenendaal, B. Struth - Smectic structures in electrochemically prepared poly(3,4-ethylenedioxythiophene) films, J. Polym. Sci.:Part B: Polym. Phys. 41 (2003) 945-952. [5]. B. Winther-Jensen, K. West - Stability of highly conductive poly-3,4-ethylene-dioxythiophene, React. Funct. Polym. 2006, 66, 479. [6]. A. Kros, N.A.J.M. Sommerdijk, R.J.M. Nolte - Poly(pyrrole) versus poly(3,4-ethylenedioxythiophene): implications for biosensor applications, Sens. Actuators B 2005,106, 289. [7]. S.C. Luo, Ali. E. Mohamed, N.C. Tansil, H.H. Yu, S. Gao, E.A. Kantchev, J.Y. Ying - Poly(3,4-ethylenedioxythiophene) (PEDOT) Nanobiointerfaces: Thin, Ultrasmooth, and Functionalized PEDOT Films with in Vitro and in Vivo Biocompatibility, Langmuir 2008, 24, 8071. [8]. L. Li, D.C. Loveday, D.S.K. Mudigonda, J.P. Ferraris - Effect of Electrolytes on Performance of Electrochemical Capacitors Based on Poly[3-(3,4-difluorophenyl)thiophene], J. Electrochem. Soc. 2002, 149, A1201. [9]. J. Tanguy, M. Slama, M. Hoclet, J.L. Baudouin - Impedance measurements on different conducting polymers, Synth. Met. 1989, 28, 145.
[10]. J. Roncali - Conjugated poly(thiophenes): synthesis, functionalization, and applications, Chem. Rev. 1992, 92, 711. [11]. T. F. Otero and E. DeLaretta - Electrochemical control of the morphology, adherence, appearance and growth of polypyrrole films, Synth. Met. 1988, 26, 79 [12]. X. Du, Z. Wang - Effects of polymerization potential on the properties of electrosynthesized PEDOT films, Electrochim. Acta 2003, 48, 1713. [13]. B.E. Conway - Electrochemical Supercapacitors Scientific Fundamentals and Technological Applications, 1st ed., Macmillan, New York, 1999. [14]. C. Peng, J. Jin and G. Z. Chen - A comparative study on electrochemical co-deposition and capacitance of composite films of conducting polymers and carbon nanotubes, Electrochim. Acta, 2007, 53, 525 [15]. M. Hughes, G.Z. Chen, M.S.P. Shaffer, D.J. Fray and A.H. Windle - Comp.Sci&Techn. 2001, 64, 2325. [16]. J.-I. Hong, I.-H. Yeo, W.-K. Paik - Conducting Polymer with Metal Oxide for Electrochemical Capacitor: Poly(3,4-ethylenedioxythiophene) RuOx Electrode, J. Electrochem. Soc. 2001, 148, A156. [17]. G. Lu, C. Li, J. Shen, Z. Chen, G. Shi - Preparation of highly Conductive Gold−Poly(3,4-ethylenedioxythiophene) Nanocables and Their Conversion to Poly(3,4-ethylenedioxythiophene) Nanotubes, J. Phys. Chem. C 2007, 111, 5926. [18]. O. Ingan - in: S.H. Nalwa (Ed.), Handbook of Conducting Polymers, vol. 2, Wiley, New York, 1997, p. 785.
- 52 -

FO N D ATĂ197 6
THE ANNALS OF “DUNAREA DE JOS” UNIVERSITY OF GALATI.
FASCICLE IX. METALLURGY AND MATERIALS SCIENCE N0. 3 – 2011, ISSN 1453 – 083X
EFFECT OF FLUIDIZED- BED CARBURIZING ON MECHANICAL PROPERTIES AND ABRASIVE WEAR
BEHAVIOR OF SINTERED STEELS
Mihaela MARIN, Florentina POTECAŞU, Elena DRUGESCU, Octavian POTECAŞU, Petrică ALEXANDRU
Dunărea de Jos University of Galati email: [email protected]
ABSTRACT
In this paper is studied the influence of fluidized bed carburizing of sintered
steels, for three different types of powder. Carburization is one of the most popular variety of temochemical treatment. Usually, carburization occurs in the temperature range of 850-950 ºC. In powder metallurgy, the carburization had a great importance to establish the dependencies between porosity and their ability to take carbon.
KEYWORDS: powder metallurgy, fluidized bed carburizing, abrasive wear
1. Introduction
The growth of ferrous powder metallurgy (P/M)
over the past three decades has been outstanding as this technology proves to be an alternate lower cost process to machining, casting, stamping, forging, and other similar metal working technologies. Parts manufactured by powder metallurgy (P/M) are widely used, especially in the automotive industry.
Powder metallurgy parts of complex shapes are obtained and close to final form, with precise surface [1]. Also, specific parts made by powder metallurgy processing help to save time, energy, material, labor and money [2, 3].
Compared to classical metallurgy, additional processes (such as machining, forging, etc.) are minimized in powder metallurgy [4, 5].
Sintering is the process of compaction, consolidation by heat treatment. It is a complex process representing a summation of physical and physic-chemical phenomena that follow each other or overlap.
Sintering process can be divided conventionally into three stages which follow each other at high temperature:
• initial stage - is the transformation of point
contacts between particles in bridges and their expand to about 25-30% of the particle radius to form "necks" that cause hardening of the specimen. At this stage the particles retain their individuality, and contractions are small (max.4-5%).
• intermediate step is to extend necks between particles to particles, losing their individuality. At this stage occurs 85-90% of total densification and grain growth of the particles.
• the final stage starts at a lower porosity, 10% and consist in transforming the network channels in isolated pores. The mechanisms involved in the transport of material to sintering are surface, intergranular limits and volume diffusion (Fig. 1).
The properties of sintered materials are determined both by the nature of the material’s characteristics of powders used, pressing and sintering process parameters and subsequent processing procedures applied [6].
Fig.1. The schematic of two powder particles
during sintering, carried out using finite element method at different sintering times,
t0 < t1< t2 < t3 [7].
- 53 -
FO N D ATĂ197 6
THE ANNALS OF “DUNAREA DE JOS” UNIVERSITY OF GALATI.
FASCICLE IX. METALLURGY AND MATERIALS SCIENCE N0. 3 – 2011, ISSN 1453 – 083X
Carburizing consists in a surface carbon enrichment, which gradually decreases towards the core [8-14].
In this paper, the mechanical properties and abrasive wear behavior of carburized in fluidized bed sintered steels are analyzed. The abrasion tests were conducted under constant load and speed conditions.
2. Experimental procedure
2.1. Materials
Specimens prepared from atomized iron powder and from pre-alloyed iron base powders were analyzed in this paper. The chemical composition of the powder samples, pure iron and iron-based prealloyed powder with Cu, Ni and Mo is presented in Table 1. To evaluate the mechanical properties, a die for making the samples in the form of a cylinder was produced. The samples were used to evaluate mechanical properties such as Vickers microhardness and abrasive wear.
The powders were mixed with 1% zinc stearate. The samples were compressed in a universal mechanical testing machine to a pressure of 600 MPa, the dimensions of disc specimens are φ 8 × 6 mm. Uniaxial pressing in the mold is used effectively for mass production of simple components.
In figure 2 is the picture of the sample.
Fig. 2. Aspect of sintered sample. The green samples were sintered in a laboratory
furnace, within a controlled atmosphere. The sintering temperature was approximately 1.150 °C and the sintering time was 60 min with a heating rate of 30-40 °C/min. All the samples were kept in the furnace for slow cooling to room temperature.
The microstructure depends on the amount of sintered carbon and cooling rate. Before the sintering temperature is reached, the parts were maintained during 30 min at 500 °C to burn lubricant, respective zinc stearate.
After cooling to room temperature the samples were carburized-treated.
Table 1. Chemical composition of analyzed powders
Treatment conditions for the fluidized bed
carburizing process were heating at 900 °C during 60 min. Specimens were then air-cooled to room temperature.
The microstructure of carburized samples was observed by optical microscopy (Olympus BX 50). Photomicrographs were obtained at a magnification of 200X. In Figure 3 is presented the size distribution of the analyzed powders.
2.2. Mechanical properties The samples, carburized in fluidized bed were
analyzed according to their mechanical properties. The microhardness tests were performed by measuring Vickers microhardness, and the test parameters are: the penetrator is a diamond pyramid diameter and load of 100g.
The microhardness was the average of three indentations on the top and another on the bottom surfaces of the samples.
2.3. Abrasion wear tests Abrasive wear is a process of removal and
destruction of surface tested material. It is affected by many factors such as mechanical properties and abrasive materials, microstructure, loading condition, etc.
Samples subject to fluidized bed carburizing were tested for abrasion wear test (Fig. 4). The SiC particles on the emery papers were the size of 80µm and the load applied was 855g. The distance traversed in each case was limited to 150 cycles corresponding to 76,5 m. The samples were subjected to circular motion over the wheel on which the abrasive paper was stuck.
The abrasion wear process in which the abrasion test was carried out included:
- first, fixing the abrasive paper on the wheel; - the samples of known weight were loaded on
the machine and applied the load;
Powder type Cu Mo Ni C P1 0.096 0.008 0.046 <0.01 P2 1.50 0.50 1.75 <0.01 P3 1.50 0.50 4.00 <0.01
- 54 -

FO N D ATĂ197 6
THE ANNALS OF “DUNAREA DE JOS” UNIVERSITY OF GALATI.
FASCICLE IX. METALLURGY AND MATERIALS SCIENCE N0. 3 – 2011, ISSN 1453 – 083X
- the specimen surface and the abrasive paper were always in strong contact with each other under the predetermined load, and
- the samples were cleaned and weighed prior to and after each test interval.
Fig. 4. Aspect of worn surface after the abrasion test.
The samples were weighed using a precision balance with a sensitivity of 10–4 before and after each test, so it was possible to evaluate the wear undergone by the material. After the tribological tests, the worn surfaces were examined by optical microscope, in order to identify the dominant wear mechanisms.
3. Results and discussion
3.1. Microstructure
Optical micrographs representative of carburized samples are presented in Figures. 5 (a, b, c). Microstructural analysis shows uniform structures with specific components of steel depending on difussion carbon content.
Most alloying elements move the S point to the left of the Fe-C diagram, means that powder by increasing the carbon content by applying thermochemical treatment in fluidized bed carburizing can be reached at the surface structures of eutectiod hipereutectoid steel (pearlite and cementite).
Fig. 5. Microstructure of sintered steel subject to fluidized bed, etching 2% Nital, 200x. This distribution of structures explains the
major hardness of carburized superficial layer. Figure 6 shows a microhardness values for carburized treated samples studied.
It is found that all three types of samples have proximate values of Vickers microhardness.
290
300
310
320
330
340
350
360
P1 P2 P3
Microhardness [μHV100]
Powder type
P1
P2
P3
Fig.6. Vickers microhardness values of the
carburized samples.
a) b) c)
- 55 -

FO N D ATĂ197 6
THE ANNALS OF “DUNAREA DE JOS” UNIVERSITY OF GALATI.
FASCICLE IX. METALLURGY AND MATERIALS SCIENCE N0. 3 – 2011, ISSN 1453 – 083X
3.2. Tribological tests
The worn surfaces of carburized samples after abrasion tests were examined in optical microscope, the typical aspects of abraded surfaces are represented in Figure 8.
The depth and width of wear grooves of carburized samples P1 are greater compared to samples P2 and P3.
Figure 7 presents the weight loss of the sintered samples tested to abrasive wear.
The wear rate was measured as the weight loss, sample P3 provided the greatest weight loss.
0
0.02
0.04
0.06
0.08
0.1
0.12
0.14
0.16
P1 P2 P3
Mass loss [g]
Powder type
P1
P2
P3
Fig. 7. Weight loss for carburized treated
samples.
4. Conclusions
According to the experimental results in this study, the following conclusions may be discussed:
■ Based on the measurements of microhardness, the samples P2 and P3 show higher values. ■ Abrasive wear surfaces for all three types of powders presents deeper traces in unalloyed samples and finer trace in samples alloyed P2 and P3, as subsequent wear tests give results in conformity with these aspects of the surface. ■ The carburized sample P1 presents a greater depth and width of wear grooves, thus there is a possibility of less resistance. ■ The carburized samples P2 and P3 present a much smaller wear groove width that can ensure a good resistance. ■ The weight loss is less for the carburized samples P2 and P3.
References
[1]. K.V. Sudhakar - Fatigue behavior of a high density powder metallurgy steel. Int J Fatigue 2000;22:729–34. [2]. G.B. Jang, M.D. Hur, S.S. Kang - A study on the development of a substitution process by powder metallurgy in automobile parts, J Mater Process Technol 2000:110–5. [3]. V. B. Akimenko, I. A. Gulyaev, O. Yu. Kalashnikova, M. A. Sekachev - The Prospects for Russian Iron Powder, Central Scientific-Research Institute of Ferrous Metallurgy, Vol. 37, No. 5, p. 472–476, ISSN 0967-0912; 2007. [4]. J. Georgiev, T. Pieczonka, M. Stoytchev, D. Teodosiev - Wear resistance improvement of sintered structural parts by C7H7 surface carburizing, Surface and Coatings Technology, volumes 180-181, Pages 90-96. 2004 [5]. C. Anayarana C, E. Ivanov, V.V. Boldyrev - The science and technology of mechanical alloying. Mater Sci Eng A, 304–306:151–8, 2001. [6]. K.S. Narasimhan - Sintering of powder mixtures and the growth of ferrous powder metallurgy. Mater Chem Phys 2001;67:56–65. [7]. Hadrian Djohari, JorgeI Martínez-Herrera, Jeffrey J.Derby - Transport mechanisms and densification during sintering: I.Viscous flow versus vacancy diffusion, Department of Chemical Engineering and Materials Science, MN55455-0132.
Fig.8. Optical photomacrographs of worn surfaces for carburized samples (x200):
a) P1, b) P2, c) P3
a) b) c)
- 56 -

FO N D ATĂ197 6
THE ANNALS OF “DUNAREA DE JOS” UNIVERSITY OF GALATI.
FASCICLE IX. METALLURGY AND MATERIALS SCIENCE N0. 3 – 2011, ISSN 1453 – 083X
[8]. G. Krauss - Microstructure residual stress and fatigue of carburized steels, in: Proceedings of the Quenching and Carburizing, The Institute of Materials, pp. 205–225, 1991. [9]. G. Krauss - Principles of Heat Treatment of Steels, American Society for Metals, pp. 251. [10]. M. Askaria, H. Khorsand S.M. Seyyed Aghamiric - Influence of case hardening on wear resistance of asintered low alloy steel, Journal of Alloys and Compounds Volume 509, Issue 24, 6800-6805, 2011 [11]. S. Mansoorzadeh, F. Ashrafizadeh - The effect of thermochemical treatments on case properties and impact behaviour of Astaloy CrM, Surface and Coatings Technology, Volume 192, Issues 2-3, Pages 231-238, 2005
[12]. J. Kazior, C. Janczur, T. Pieczonka, J. Ploszczak - Thermochemical treatment of Fe–Cr–Mo alloys, Surface and Coatings Technology, Volumes 151-152, 1 March 2002, Pages 333-337 [13]. I. D. Radomysel'skii, A. F. Zhornyak, N. V. Andreeva, G. P. Negoda - The pack carburizing of dense parts from iron powder, Powder metallurgy and metal ceramics, Volume 3, 204-211. [14]. O. I. Pushkarev, V. F. Berdikov - Increasing the wear resistance of equipment in pressing parts from high-hardness powder materials, Refractories and industrial ceramics, Volume 39, Numbers 9-10, 326-328, DOI: 10.1007/BF02770594.
- 57 -

FO N D ATĂ19 76
THE ANNALS OF “DUNAREA DE JOS” UNIVERSITY OF GALATI.
FASCICLE IX. METALLURGY AND MATERIALS SCIENCE N0. 3 – 2011, ISSN 1453 – 083X
A POSSIBILITY TO DECREASE THE SINTERING TEMPERATURE OF CORUNDUM CERAMICS
Vladimir PETKOV1, Radoslav VALOV1, Dimitar TEODOSSIEV2, Ina YANKOVA3
1Institute of Metal Science, Equipment and Technologies “Acad. A. Balevski” with Hydroaerodynamics centre, Bulgarian Academy of Sciences, Sofia, Bulgaria
2Space and Solar-Terrestrial Research Institute, Bulgarian Academy of Sciences, Sofia, Bulgaria 3Technical University of Sofia
email: [email protected]
ABSTRACT
The ceramics consisting of more than 95%Al2O3 is called corundum ceramics. The name comes from the name of the α-crystalline form of the aluminum oxide - corundum.
The basic technological process influencing the properties of this ceramic is the temperature and the duration of the sintering process. Sintering aids are used to improve sintering and to control grain size.
The possibility to use CaTiO3 as sintering aid is investigated. This substance lowers the sintering temperature with more than 100oC and at the same time the mechanical properties are preserved. The compressive strength is more than 2000 MPa and the flexural strength is more than 200 MPa.
KEYWORDS: alumina, sintering temperature, corundum, calcium titanate
1. Introduction
The ceramics consisting mainly of Al2O3 is
called corundum ceramics after the name of the α-form of alumina - corundum. This ceramics must contain more than 95% Al2O3 and the main crystalline phase has to be corundum [1]. The corundum ceramics possesses a series of valuable properties and for this reason it is widely applied.
The sintering of the corundum ceramics is the
basic technological process influencing its properties. The sintering is carried out at relatively high temperatures – 1600-1750oC. Corundum is difficult to be sintered.
The diffusion mechanism as well as the
recrystallization process depends on temperature and time of exposure at high temperature, the grain size and crystalline condition of the row material, the initial density of the sample [2].
The presence of specially introduced additions
exerts a particular influence on the sintering temperature and the grain size and from there on the properties of the final product.
2. Results and discussion The alumina ceramic must have a fine grain
polycrystalline structure consisting mainly of α-Al2O3 (corundum). This microstructure is essential for the mechanical properties of the ceramic components. The increase of the grain size decreases the strength of the material. Sintering additions are used to improve sintering and to control grain size. The possibilities to use CaTiO3 as sintering additions are investigated. CaTiO3 is added to Al2O3 micrometric size powder in quantity of 3, 6 and 9 weight %. Samples are fabricated by pressing and sintering at different temperatures. The apparent density, the compressive and bending strength in relation with the sintering temperature are determined.
It is interesting to evaluate whether a high content (up to 10%) of CaTiO3 will lower considerably the sintering temperature and at the same time will preserve the high mechanical properties of the corundum ceramics. The mechanical properties versus the sintering temperature and the quantity of the sintering additions are studied. The average values of the compressive strength depending on the CaTiO3 content and the temperature of the heat treatment are given in Table 1.
- 58 -
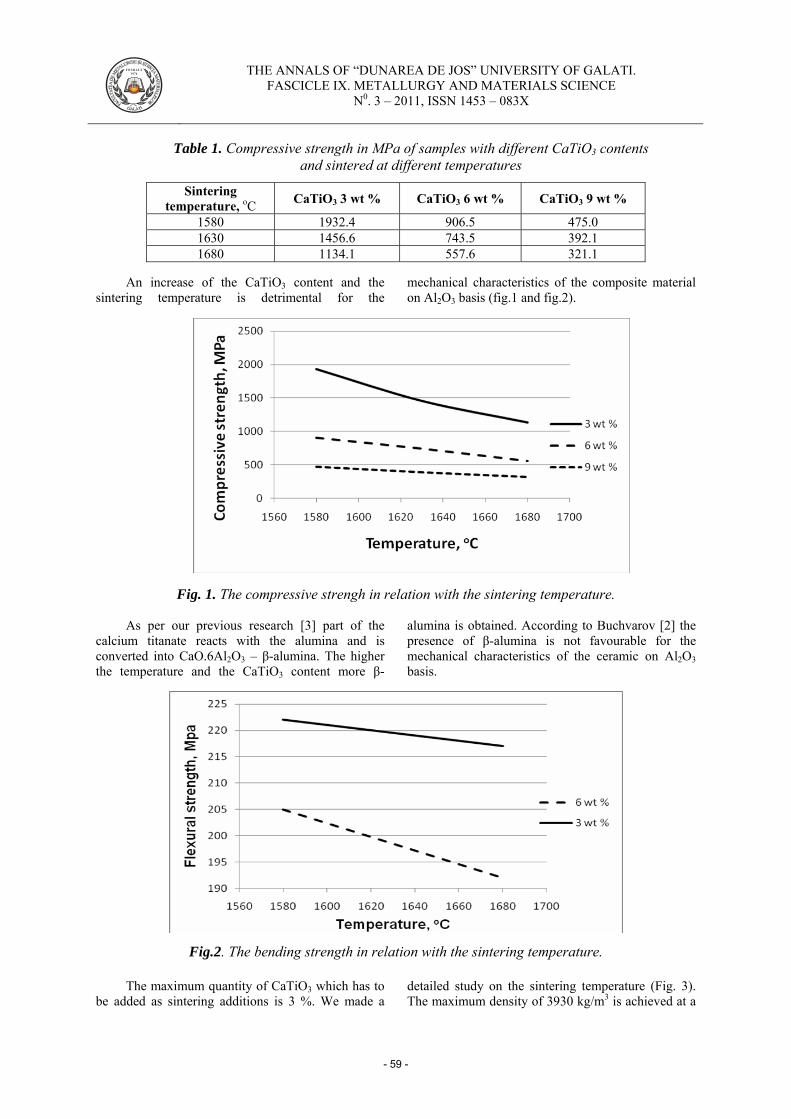
FO N D ATĂ19 76
THE ANNALS OF “DUNAREA DE JOS” UNIVERSITY OF GALATI.
FASCICLE IX. METALLURGY AND MATERIALS SCIENCE N0. 3 – 2011, ISSN 1453 – 083X
Table 1. Compressive strength in MPa of samples with different CaTiO3 contents and sintered at different temperatures
Sintering temperature, oC CaTiO3 3 wt % CaTiO3 6 wt % CaTiO3 9 wt %
1580 1932.4 906.5 475.0 1630 1456.6 743.5 392.1 1680 1134.1 557.6 321.1
An increase of the CaTiO3 content and the
sintering temperature is detrimental for the mechanical characteristics of the composite material on Al2O3 basis (fig.1 and fig.2).
Fig. 1. The compressive strengh in relation with the sintering temperature. As per our previous research [3] part of the
calcium titanate reacts with the alumina and is converted into CaO.6Al2O3 – β-alumina. The higher the temperature and the CaTiO3 content more β-
alumina is obtained. According to Buchvarov [2] the presence of β-alumina is not favourable for the mechanical characteristics of the ceramic on Al2O3 basis.
Fig.2. The bending strength in relation with the sintering temperature.
The maximum quantity of CaTiO3 which has to be added as sintering additions is 3 %. We made a
detailed study on the sintering temperature (Fig. 3). The maximum density of 3930 kg/m3 is achieved at a
- 59 -

FO N D ATĂ19 76
THE ANNALS OF “DUNAREA DE JOS” UNIVERSITY OF GALATI.
FASCICLE IX. METALLURGY AND MATERIALS SCIENCE N0. 3 – 2011, ISSN 1453 – 083X
sintering temperature of 1600оС. When the compressive strength at different sintering
temperatures is determined, a similar relation is achieved (Fig. 4).
Fig.3. The apparent density in relation with the sintering temperature (CaTiO3 – 3 wt.%).
Fig.4. The compressive strength in relation with the sintering temperature (CaTiO3 – 3 wt.%)
3. Conclusions
Calcium titanate can be used as sintering
additions for ceramic on Al2O3 basis. During the temperature treatment part of the
CaTiO3 reacts with the alumina and is converted into CaO.6Al2O3 – β-alumina. The presence of β-alumina is not favourable for the mechanical characteristics of ceramic on Al2O3 basis. The content of CaTiO3 must not exceed 3 weight % in alumina based ceramic.
The sintering temperature of ceramic on Al2O3 basis containing CaTiO3 should not be higher than 1600oC. Samples with 3 wt. % CaTiO3 as sintering additions and sintered at 1600oC possess compressive strength of 2100 MPa and flexural strength of 220 MPa.
Acknowledgements
The authors are grateful to the National Science Fund, Ministry of Education and Science of Republic of Bulgaria (Grant DO 02-234/2008) for the financial support of the project.
References [1]. Kingery W.D., H.K. Bowen, D.R. Uhlmann - Introduction to Ceramics, 2nd ed., NY, Wiley and Sons, 1976. [2]. Buchvarov S. - Ceramic Technology, Sofia, 2003, 865 (in Bulgarian). [3]. D. Teodossiev, V. Petkov, R. Valov, J. Georgiev, M. Selecka S. Stefanov - Composite Material on Al2O3 Basis Coated With Vitreous Carbon for Medical Needs, Powder Metallurgy Progress, 2011, (to be published)
- 60 -
FO N D ATĂ197 6
THE ANNALS OF “DUNAREA DE JOS” UNIVERSITY OF GALATI.
FASCICLE IX. METALLURGY AND MATERIALS SCIENCE N0. 3 – 2011, ISSN 1453 – 083X
SUPERPLASTIC BEHAVIOR OF 2024 ALUMINUM ALLOY SHEET SUBJECTED TO THERMOMECHANICAL PROCESSING
Luciana RUS, Marius TINTELECAN, Monica SAS-BOCA,
Dan NOVEANU, Ionut MARIAN Tehnical University of Cluj-Napoca
email: [email protected]
ABSTRACT
This paper describes the superplastic behavior of the commercial 2024 aluminum alloy. The investigated alloy was processed in a 3 mm thick sheet form. The superplastic properties of the alloy were investigated using an uniaxial tensile testing, with a constant strain rate in the range 8x10⁻⁴÷1x10⁻² s-1, at temperatures in the range 450÷480oC. The investigations included the determination of the true-strain, the true-stress caracteristics, the elongation to failure, the strain-rate sensitivity exponent m and the aspect of the alloy microstructure. Elongations to failure longer than 200% for the fine grained 2024 aluminum alloy were obtained at 4600 and lower strain rates and at 4800C and a higher strain rate.
KEYWORDS: 2024 aluminum alloy, elongation to failure, strain-rate
sensitivity exponent, superplastic properties, thermomechanical processing
1. Introduction
The attractive characteristics of aluminum alloys have become of great interest both in the academic and in the industrial research fields. Their high specific strength can be functional for most of the structural purposes. The exceptional elongation can be reached only by the grain refinement technique: powder-metallurgy processing, thermomechanical processing, sever plastic deformation [1]. One method to produce a very fine grain size usually consists of rolling and then carrying out a heat treatment which causes a precipitation of another phase or phases in a finely divided form, pins at the grain boundaries of the simultaneously recrystallizing matrix [2]. This is the technique used for producing commercial superplastic aluminum alloys.
However, the basic requirement of fine grain size (<10 μm) is a necessary but not always a sufficient condition to obtain superplasticity [3]. If the fine grain microstructure is not stable at high temperatures, superplastic elongation will be significantly reduced.
Superplasticity is defined as the ability of a polycrystalline material to exhibit, in a generally isotropic manner, very high tensile elongations prior to failure [4]. There are two basic requirements for achieving superplasticity: first, a very small and stable grain size, typically less than ~10 μm; second, a high testing temperature, typically ≥ 0,5 Tm (where Tm
represents the absolute melting temperature of the material), so that diffusion-controlled processes are reasonably rapid. Superplastic elongations are achieved over a limited range of strain rate in the superplastic region II (10-5÷10-3 s-1) [5, 6].
2. Material and experimental procedure
The material studied in this work is an extruded bar (22 mm in diameter) of commercial aluminum alloy 2024-T3, produced by S.C. ALPROM S.A. Slatina, Romania, with the following chemical composition (in wt %): 4.955 Cu; 1.322 Mg; 0.437 Mn; 0.358 Zn; 0.300 Fe; 0.119 Si; 0.017 Cr; 0.005 Sn; 0.005 Sb; 0.005 Pb; 0.003 Ni; Al-balance.
Because the ductility of the received 2024 aluminum alloy samples is small (tensile tested at temperatures and strain rates used in this research, the tensile elongation is smaller than 108% for round samples of 25 mm gauge length and 5 mm diameter) [7], the material was processed thermomechanically (a method meant to increase the ductility through grain refinement).
The processing route for the 2024 aluminum alloy is shown in Figure 1. The specimens from the received material (60 mm length and 22 mm diameter) were homogenized at 500oC for 8 hours before rolling. Hot rolling was carried out unidirectionally to obtain a thickness reduction of 68% and prepare a 7 mm thick strip which was
- 61 -

FO N D ATĂ197 6
THE ANNALS OF “DUNAREA DE JOS” UNIVERSITY OF GALATI.
FASCICLE IX. METALLURGY AND MATERIALS SCIENCE N0. 3 – 2011, ISSN 1453 – 083X
quenched. Then the samples were cold rolled (a final 3 mm thickness, with a thickness reduction of 57%), fast heated up to 480oC, soaked for 15 minutes and
quenched in water. The rolled plates were then soaked at 350oC for 30 minutes, in order to make the fine-grained structure stable.
Fig. 1. Schematic thermomechanical processing route for 2024 aluminum alloy. The tensile samples were prepared with a 25
mm gauge length, 6.6 mm width and 3 mm thickness, all of them being machined with the tensile stress direction parallel to the rolling direction.
The tensile tests were conducted on the testing equipment that was interfaced with a computer to provide complete control of the strain rate. After heating the specimens in the electrical horizontal furnace (Carbolite CTF 12/75/700) to the necessary temperatures, for 25÷30 minutes, each specimen was submited to a tensile axial load which produced the deformation until fracture. The tensile load and the elongation were recorded simultaneously.
Constant strain rate tests were conducted over a range of strain rates of 8x10⁻⁴ ÷5x10⁻³ s-1 and test temperatures of 450÷480oC. After fracture the samples were coaled in water to keep the resulting structure during the test. The behavior of the material is described by the constitutive equation [3] mKεσ &= (1), where σ is the true flow stress, K is a constant, ε& is the true strain rate and m is the strain rate sensitivity exponent.
The logarithms equation (1) to obtain a relationship with the general form
ii mK εσ &lnlnln += (2), where i = 1…N representing the number of experimental tests.
The characteristics of the material, m and K, are determined by minimizing the function f (m, lnk) expressed according to the method of least squares, calculating first order derivatives of function f and solving the system of equations [7]. The as-received and as-processed aluminum samples were cut in transversally, polydol mounted, and mechanically polished. Keller’s reagent (a composition of 3 ml HCl, 2 ml HF, 5 ml HNO3 and 190 ml of distilled water) was used to reveal the microstructure of this material by the intercept method.
3. Experimental results
3.1. Microstructural characteristics Figure 2 shows the as-received alloy and the
microstructural changes during the thermomechanical processing of 2024 aluminum alloy.
a) b)
- 62 -
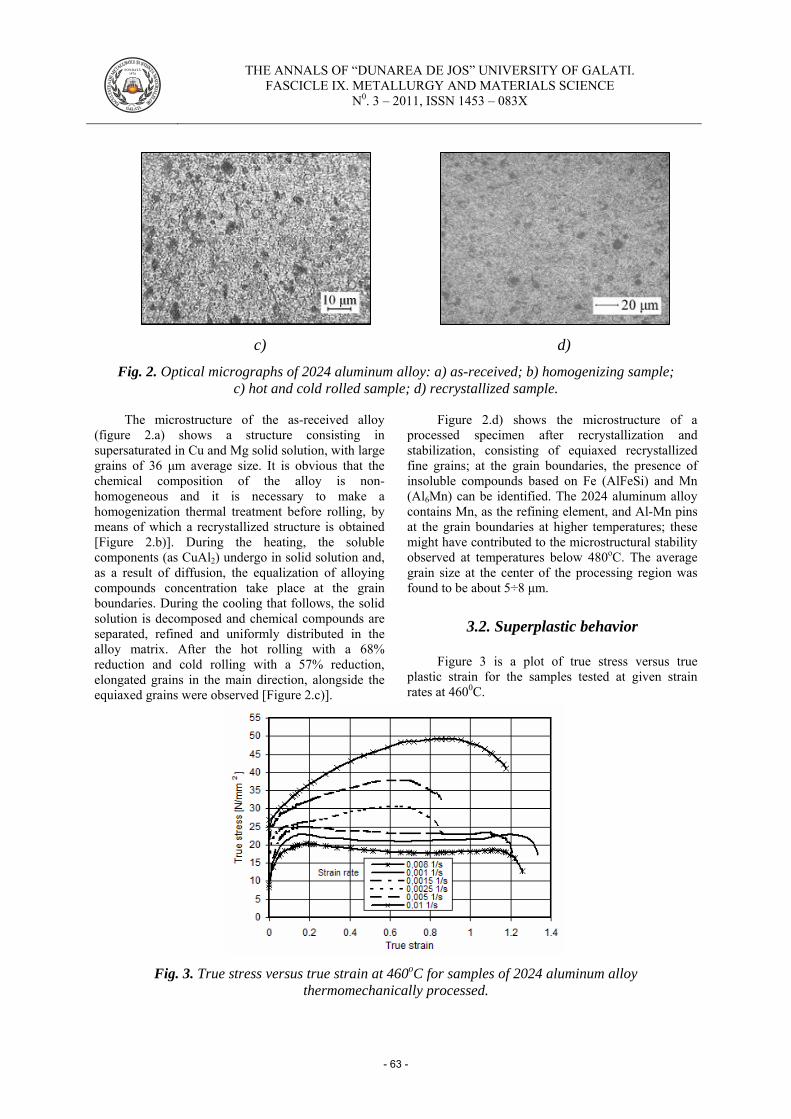
FO N D ATĂ197 6
THE ANNALS OF “DUNAREA DE JOS” UNIVERSITY OF GALATI.
FASCICLE IX. METALLURGY AND MATERIALS SCIENCE N0. 3 – 2011, ISSN 1453 – 083X
c) d)
Fig. 2. Optical micrographs of 2024 aluminum alloy: a) as-received; b) homogenizing sample; c) hot and cold rolled sample; d) recrystallized sample.
The microstructure of the as-received alloy
(figure 2.a) shows a structure consisting in supersaturated in Cu and Mg solid solution, with large grains of 36 μm average size. It is obvious that the chemical composition of the alloy is non-homogeneous and it is necessary to make a homogenization thermal treatment before rolling, by means of which a recrystallized structure is obtained [Figure 2.b)]. During the heating, the soluble components (as CuAl2) undergo in solid solution and, as a result of diffusion, the equalization of alloying compounds concentration take place at the grain boundaries. During the cooling that follows, the solid solution is decomposed and chemical compounds are separated, refined and uniformly distributed in the alloy matrix. After the hot rolling with a 68% reduction and cold rolling with a 57% reduction, elongated grains in the main direction, alongside the equiaxed grains were observed [Figure 2.c)].
Figure 2.d) shows the microstructure of a processed specimen after recrystallization and stabilization, consisting of equiaxed recrystallized fine grains; at the grain boundaries, the presence of insoluble compounds based on Fe (AlFeSi) and Mn (Al6Mn) can be identified. The 2024 aluminum alloy contains Mn, as the refining element, and Al-Mn pins at the grain boundaries at higher temperatures; these might have contributed to the microstructural stability observed at temperatures below 480oC. The average grain size at the center of the processing region was found to be about 5÷8 μm.
3.2. Superplastic behavior
Figure 3 is a plot of true stress versus true plastic strain for the samples tested at given strain rates at 4600C.
Fig. 3. True stress versus true strain at 460oC for samples of 2024 aluminum alloy thermomechanically processed.
- 63 -
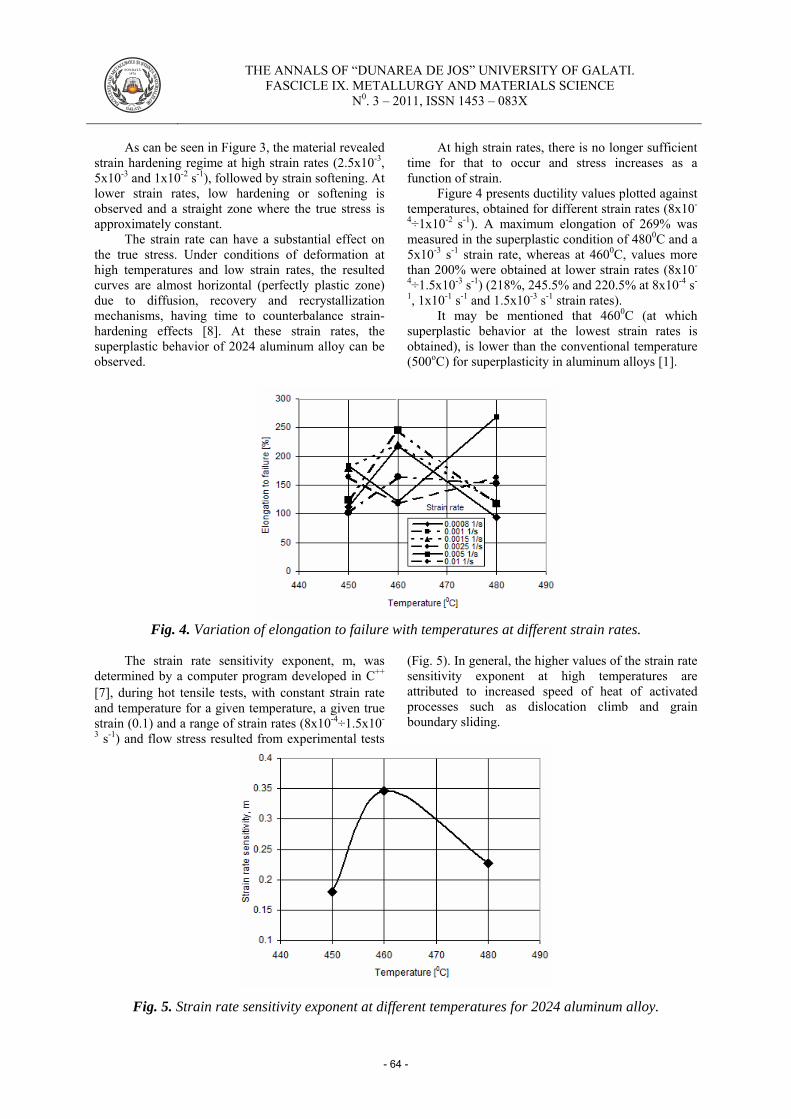
FO N D ATĂ197 6
THE ANNALS OF “DUNAREA DE JOS” UNIVERSITY OF GALATI.
FASCICLE IX. METALLURGY AND MATERIALS SCIENCE N0. 3 – 2011, ISSN 1453 – 083X
As can be seen in Figure 3, the material revealed strain hardening regime at high strain rates (2.5x10⁻³, 5x10⁻³ and 1x10⁻² s-1), followed by strain softening. At lower strain rates, low hardening or softening is observed and a straight zone where the true stress is approximately constant.
The strain rate can have a substantial effect on the true stress. Under conditions of deformation at high temperatures and low strain rates, the resulted curves are almost horizontal (perfectly plastic zone) due to diffusion, recovery and recrystallization mechanisms, having time to counterbalance strain-hardening effects [8]. At these strain rates, the superplastic behavior of 2024 aluminum alloy can be observed.
At high strain rates, there is no longer sufficient time for that to occur and stress increases as a function of strain.
Figure 4 presents ductility values plotted against temperatures, obtained for different strain rates (8x10-
4÷1x10⁻² s-1). A maximum elongation of 269% was measured in the superplastic condition of 4800C and a 5x10⁻³ s-1 strain rate, whereas at 4600C, values more than 200% were obtained at lower strain rates (8x10-
4÷1.5x10⁻³ s-1) (218%, 245.5% and 220.5% at 8x10⁻⁴ s-
1, 1x10⁻¹ s-1 and 1.5x10⁻³ s-1 strain rates). It may be mentioned that 4600C (at which
superplastic behavior at the lowest strain rates is obtained), is lower than the conventional temperature (500oC) for superplasticity in aluminum alloys [1].
Fig. 4. Variation of elongation to failure with temperatures at different strain rates.
The strain rate sensitivity exponent, m, was
determined by a computer program developed in C++ [7], during hot tensile tests, with constant strain rate and temperature for a given temperature, a given true strain (0.1) and a range of strain rates (8x10⁻⁴÷1.5x10-
3 s-1) and flow stress resulted from experimental tests
(Fig. 5). In general, the higher values of the strain rate sensitivity exponent at high temperatures are attributed to increased speed of heat of activated processes such as dislocation climb and grain boundary sliding.
Fig. 5. Strain rate sensitivity exponent at different temperatures for 2024 aluminum alloy.
- 64 -

FO N D ATĂ197 6
THE ANNALS OF “DUNAREA DE JOS” UNIVERSITY OF GALATI.
FASCICLE IX. METALLURGY AND MATERIALS SCIENCE N0. 3 – 2011, ISSN 1453 – 083X
The value of the strain rate sensitivity exponent increases with temperature, but at a temperature of 4600C, where the alloy shows superplastic behavior, a value of m greater than at other temperatures is obtained, although still to the lower limit of the
requirement for the micrograin superplasticity (m>0.3) (m = 0.3462).
Figure 6 shows hemispheres, obtained from circular membranes of fine grained 2024 aluminum alloy, that were free-bulged under low air pressure.
Fig. 6. Hemispheres obtained through free-bulging under low pressure.
4. Conclusions - Superplasticity can be achieved in a commercial 2024 aluminum alloy by termomechanical processing. - The maximum elongation of 269% was obtained at 4800C and a strain rate of 5x10⁻³ s-1 in the thermomechanically processed alloy. - Elongations higher than 200% were also achieved in tensile testing at 4600C (218%, 245.5% and 220.5% at strain rates of 8x10⁻⁴s-1, 1x10⁻³ s-1 and 1.5x10⁻³ s-1). - An average grain size of 5÷8 μm can be achieved by control of recrystallization. - In 2024 aluminum alloy, the value of the strain rate sensitivity exponent to a true strain of 0.1 has the highest value - 0.3462 at 4600C and a strain rates range of 8x10⁻⁴÷1.5x10⁻³ s-1, where the aluminum alloy shows superplastic behavior. - By gas pressure blow forming tests, the possibility of obtaining hemispheres from 2024 aluminum alloy sheets, thermomechanically processed by hot rolling, cold rolling and recrystallization was demonstrated.
References [1]. Charit, I. and Mishra, R.S. - High Strain Rate Superplasticity in a Commercial 2024 Al Alloy Via Friction Stir Processing. In: Materials Science and Engineering A, volume 359, Issues 1-2, 2003, pp. 290-296. [2]. Perce, R. - Sheet Metal Forming, Institute of Physics Publishing, Philadelphia: Hilger, 1991, pp. 122-127. [3]. Pilling, J. and Ridley, N. - Superplasticity in Crystalline Solids. The Institute of Metals, London, 1989, pp. 3-8. [4]. Langdon, T.G., Wadsworth, J. - Superplasticity in Advanced Materials, The Japan Society for Research on Superplasticity, Osaka (Japan), 1991, p. 847. [5]. Langdon, T.G. - Mechanisms of Superplastic Flow. In: Superplasticity: 60 Years after Pearson, Edited by Norman Ridley, The Institute of Materials, London, 1995, pp. 9-13. [6]. Carrino, L., Giuliano, G. and Palmieri, C. - On the Optimisation of Superplastic Forming Processes by the Finite-Element Method. In: Journal of Materials Processing Technology, volumes 143-144, 2003, pp. 373-377. [7]. Rus A. L. - Cercetari privind comportarea superplastica a materialelor metalice (Researches Concerning Superplastic Behaviour of Metallic Materials) - Ph.D. Thesis - Technical University of Cluj-Napoca, 2006. [8]. Guillard, S. - Workpiece Materials Datebase. In: Metalworking: Bulk Forming, volume 14 A, ASM International, The Materials Information Society, 2005, pp. 651-659.
- 65 -

FO N D ATĂ197 6
THE ANNALS OF “DUNAREA DE JOS” UNIVERSITY OF GALATI.
FASCICLE IX. METALLURGY AND MATERIALS SCIENCE N0. 3 – 2011, ISSN 1453 – 083X
SYNTHESIS AND SPHEROIDIZATION OF DISPERSE HIGH-MELTING (REFRACTORY) POWDERS IN PLASMA DISCHARGE
Rositsa GAVRILOVA, Viktor HADZHIYSKI
University of Chemical Technology and Metallurgy, Sofia, Bulgaria email: [email protected]
ABSTRACT
One of the areas of using arc and radio-frequency induction (RFI) plasma in
metallurgy is to obtain refractory metals and materials with spherical shape of particles. The main advantages of using spherically shaped particles are high purity of particle surface, high bulk density (minimum surface/volume ratio) and ability to gain control on porous article properties and to separate the particles in fractions. Spherical particles are needed in the formation of powder-metallurgy elements with desired and uniform porosity, which are operated at high temperature, in highly aggressive media and at high velocity fluid flows.
The present work considers the possibilities of using arc and RFI-plasma in metallurgy to obtain high-melting point metals and materials with spherical shape of particles.
KEYWORDS: Arc plasma, RFI plasma, refractory materials, spherically
shaped particles
1. Using powder-like materials with spherical particle shape in powder
metallurgy and surface welding
One of the areas of using arc and radio-frequency induction (RFI) plasma in metallurgy is to obtain spherical and refractory metals and materials, [1, 6, 9, 12÷17].
It is known that plasma treatment of the initial materials aimed at producing disperse powders with particles of spherical-shape still finds broader application and has become a very perspective method, allowing to produce powders from W, Mo, Cr, Ta, B, Al, oxides, carbides, silicates, etc.
The main advantages of using spherically shaped particles are high purity of particle surface, high bulk density (minimum surface/volume ratio) and ability to gain control on porous article properties and to separate the particles in fractions.
Spherical particles are needed in the formation of powder-metallurgy elements with desired and uniform porosity, which are operated at high temperature, in highly aggressive media and at high velocity fluid flows.
Powders with spherically shaped particles of high-melting materials make it possible to
substantially enhance the performance parameters of the produced articles. For example, porous filters of high-melting-point materials intended for purification of fuels, oils, aggressive liquids and gases contribute to attain higher effectiveness of the processes in chemical, metallurgical, food, pharmaceutical and a number of other industrial areas.
Another branch of high-temperature technique, where powders with spherical particle form still find wider application, is surface welding of complexly shaped elements intended for heavy operation conditions.
The quality of the surface-welded layer depends on the regular feeding of the welded material in the gas-flame or plasma devices, [5, 8].
Only powders with particles of spheroid shape and fixed within a narrow range of granulometric distribution ensure high operation properties of the surface-welded layer, [12, 15], (Fig. 1).
The standard fluidity of the material makes it possible to use dosing equipment with simplified construction and high reliability in the process of operation if steady flow of the spheroidized material is achieved, and if constant temperature of the particle is ensured in the moment of its contact with the welded surface.
- 66 -

FO N D ATĂ197 6
THE ANNALS OF “DUNAREA DE JOS” UNIVERSITY OF GALATI.
FASCICLE IX. METALLURGY AND MATERIALS SCIENCE N0. 3 – 2011, ISSN 1453 – 083X
Fig.1. Principle of surface-welding with RFI-
plasmotron
The process of plasma spheroidization is based on the intensive heating of the treated material and rounding of the liquid particles under the effect of surface tension forces, (Fig. 2).
Fig.2. Plasma surface welding of elements with refractory materials
The single stages of the process are:
• Melting and pulverization of the processed material;
• Spheroidization of the molten particles in a hot gas flux;
• Solidification of the particles; • Cooling and collecting the spheroidized material.
Arc or high-frequency (RF) plasmotron is used for realizing the process.
2. Treatment of powders in an arc
plasmotron
The treatment of powders is carried out in ordinary or multi-chamber plasma generators (plasmotrons). This provides the possibility of producing spherical particles with sizes from 1 to 200μm.
The use of protective medium ensures the possibility preserve the chemical composition of the processed powder-like material.
When spheroidizing preliminarily prepared granules, the particles acquire not only a spherical shape, but are also formed with sufficiently uniform grain-size distribution, (Fig.3). At low velocities of the transporting gas, particle kinetic energy is insufficient for their deep penetration in the plasma and the main part of the material passes through the peripheral section of the stream and along the walls of the plasma reactor.
Fig.3. Powdery corundum (Al2O3) prior to and after spheroidization, x120
At very high velocities of the transporting gas
the particles “break through” the jet, [3, 8, 10]. It has been established that when processing TiC
the relative amount of spherical particles increases with increasing the electric current intensity (as a result of particle intensive heating and increasing jet geometric dimensions).
The processing of initial powder with grain sizes of 30μm yields spheroidization of 40% of the particles, the average dimension being reduced to 25μm. It is observed that the amount of the spheroidized particles (C, %) depends on the initial sizes of the powder (in the case of TiC pulverization), (Table 1), [1÷3, 14].
- 67 -

FO N D ATĂ197 6
THE ANNALS OF “DUNAREA DE JOS” UNIVERSITY OF GALATI.
FASCICLE IX. METALLURGY AND MATERIALS SCIENCE N0. 3 – 2011, ISSN 1453 – 083X
Physical properties
Chemical formula Molecular Weight Melting point Boiling point Density Heat Capacity Thermal conductivity
Ti 47.867 g/mol 1668oC 3287oC 4.506 g/cm3
523 J/(кgК) 22 W/(mK)
Table 1. Quantity of particles on the initial sizes of the powder
Particle size, μm 2 2-5 5-10 10-15 15 С, % 90 90 80 50 30
When processing WC powder with an initial
particle size of 5μm, the concentration of spherically shaped particles is 95%, and the average size is 3÷5μm. The studies on TiC and WC behavior during plasma spheroidization in argon show that the impact of high temperature leads to reducing the carbon content in carbides [14, 15]. The spheroidization is
carried out in hermetically sealed columns, where the processing zone is isolated from atmospheric oxygen and nitrogen.
The greatest effect is achieved during treatment of carbide powder with 5% of carbon black in a plasma stream. The spherical particles at the outlet amount to 60%.
The conclusion is made that the lower the particle heat conductivity and the larger the particle size, the more is the spheroidization process inefficient.
By selecting the appropriate regime of powder pulverization and transportation it is possible to find conditions, under which the processed material passes through the central parts of the jet.
When high-melting-point materials are pulverized and spheroidized in plasma stream, the material often adheres to the internal walls of the die channel and coating is formed [14, 17].
In an arc plasmotron of ordinary construction the powder is introduced in the transporting gas under an angle of 90° with respect to the plasma stream direction.
At low values of the kinetic energy the powder particles move under the impact of the plasma stream along a trajectory, which prevents them from sticking to the opposite channel wall. If the particles possess sufficient kinetic energy to break through the plasma jet, they move along a trajectory that leads to the formation of incrustations on the opposite die wall.
Depending on the growth of the external layers of this deposition, it starts melting and is pulverized by the plasma stream in large drops, i.e. the process of powder pulverization is replaced by pulverization of a material in the liquid state. This phenomenon, which is, for example, undesirable when placing coatings (as the evaporation of larger particles exerts adverse impact on surface quality and other characteristics of the coating), could be used for producing coarser powder than the fine-grained one [1÷5, 7, 8, 12, 13].
The experimental results prove that granules with lower density should be applied in the processing in order to ensure conditions for their transportation in the plasma stream without noticeable evaporation. The size of the initial granules should be with 40-50% larger than that of the obtained spherical particles.
Disturbance in chemical composition is often observed during spheroidization of oxide powders in neutral (argon) plasma, and hence partial recovery is needed. In cases when such disproportioning is undesirable, the spheroidization is carried out in oxygen plasma. With this approach it is natural that preference is given to RFI-plasma heating of oxygen or oxygen-containing gas [9].
Physical properties
Chemical formula Molecular Weight Melting point Boiling point Density
WC 195,9 g/mol ~ 2800oC ~ 6000oC 15.7 g/cm3
- 68 -

FO N D ATĂ197 6
THE ANNALS OF “DUNAREA DE JOS” UNIVERSITY OF GALATI.
FASCICLE IX. METALLURGY AND MATERIALS SCIENCE N0. 3 – 2011, ISSN 1453 – 083X
3. Powder processing in RFI-plasmotrons
The low velocity of the plasma stream and the large volume of plasma in both its transverse and longitudinal cross section allow for very effective spheroidization of the particles of different refractory materials. The specificity of Radio-Frequency-Induction (RFI) plasma discharge provides the opportunity of introducing the treated powder immediately along the plasma volume axis and using most effectively the energy of the RFI-discharge.
The current density along the RFI-discharge axis is equal to zero and therefore powder introduction in the central zone does not disturb the stability of discharge burning [4].
Temperature distribution in the plasma discharge volume is not uniform. Its maximum value reaches ≈ 9÷10000 K. There are places along the discharge axis, where temperature is reduced to 500÷1000 K. When the transporting gas is fed, the gas temperature along the RFI-discharge axis is also significantly reduced.
The productivity of the RF-plasma equipment is sufficiently high: when the power of the RFI-
discharge is 6.5 kW, about 1÷2 kg/h Al2O3 powders with sizes of 63÷100μm are spheroidized, while the analogous productivity in the arc plasmotron is achieved by power of 100 kW.
The efficiency of spheroidization of plasma heated powder is determined by the duration of particle sojourn in the high-temperature (HT) area of the stream. In the case of RFI-plasma, characterized by low gas velocity, the treated particles move slowly with 2÷5 m/s.
The length of the plasma torch of the RFI-discharge is considerably larger than the length of the arc plasma stream of the same power.
Furthermore, plasma dynamics in RFI-discharge intensifies the heat exchange of the processed powders.
4. Conclusion
All mentioned factors indicate that the duration
of particle sojourn in the plasma RFI-discharge is significantly increased, (Table 2). In its turn, this is the basis for the high efficiency of the RF-plasma processes for powder spheroidization, (Table 3).
Table 2. Technological characteristics
PLASMOTRON Stream length, mm
Particle velocity, m/s
Duration of particle sojourn in the HT-zone, m/s
One-chamber 50 100 0.5 Multi-chamber 100 25 4 RF-induction 300 3 100
Table 3. Thermal efficiency of heated powders
Spheroidization method Thermal efficiency of heated powders, % Arc plasma, neutral wire 1-1.5 Arc plasma, granulated powder 1-5 Arc plasma, conductive wire 8-10 RF-plasma 25-30
RFI-plasma not only enhances the efficiency of
the spheroidization process, but also provides the possibility of rounding the larger particles. For example, in arc plasma Al2O3 powders with spherical particle shape and sizes of up to 60÷70μm are obtained, while in RFI-plasma the size of the treated particles may be increased to 600÷800 μm. If coarser Al2O3 fractions or powders with the same sizes but of higher-melting-point materials are processed, it will be necessary to increase the plasma heat flux towards the particles.
In oxygen plasma it is possible to spheroidize with RFI-discharge MgO and ZrO2 powders, which cannot be processed in argon plasma and RFI-discharge of the same power.
The analysis of powder spheroidization processes of high-melting-point materials in arc and RFI-plasma proves the undisputable advantage of the latter compared to the shortcomings of the process, realized in arc plasma, namely:
• non-uniform heating of the particles; • powder feeding devices with complex
construction; • impossibility of ensuring flawless operation
of the plasmatron; • restrictions concerning the type of plasma
forming gas; • possibility for contamination of the
processed material with elements from the arc plasmatron electrodes.
- 69 -
FO N D ATĂ197 6
THE ANNALS OF “DUNAREA DE JOS” UNIVERSITY OF GALATI.
FASCICLE IX. METALLURGY AND MATERIALS SCIENCE N0. 3 – 2011, ISSN 1453 – 083X
The advantages of the RFI-plasma are: • uniform heating of the particles due to their
facilitated introduction in the desired point of the plasma volume;
• possibility of heating particles with relatively large sizes due to the low velocity of the plasma-forming gas and long time of sojourn of the particles in the plasma volume;
• possibility for operation with different technological and plasma forming gases (from neutral to highly aggressive);
• possibility for high purity of the obtained product due to the non-electronic nature of generation of RFI-plasma.
The enumerated facts lead to the still broader
application mainly of RFI-plasma for treatment of powders from high-melting point materials, aimed at spheroidization of their ingredient particles. The calculations and experimental results concerning RFI-plasma generation and the possibilities for its management will be the subject of another publication.
References [1]. Danov, С. К., Kurnaev, V. А., Romanovskii, М. К., Tsvetkov, I.V. - Osnovi fisicheskih protsesov v plazme I plazmenih ustroistvah, Moskovskii gosudarstvennii ingenerno-fisiceskii institut, Moskva 2000. (In Russian) [2]. Dendy, R. - Plasma Physics: an Introductory Course. Cambridge Univ. Press,Cambridge, 1995. [3]. Boyd T. J. M. & Sanderson J. J. - The Physics of Plasmas Cambridge University Press Cambridge, U.K.; New York, 2003.
[4]. Shalom Eliezer - Introduction to Plasma Physics: The Fourth State of Matter, Institute of Physics Publishing Bristol and Philadelphia IOP Publishing Ltd 2001. [5]. Blinkov I. V. - Fisico-chimia visokih temperatur I davlenii, Moskva 1988. (In Russian) [6]. Shalimov A. G., Gotin V. N., Tulin N. А. - Intensifikatsia protsesov spetialnoi elektrometalurgii, Moskva, 1988. (In Russian) [7]. Dashkevich I. P., Visokochestotnie razryadi v Elektrotermii, vipusk 13, “Mashinostroenie”, Leningrad, 1980. (In Russian) [8]. Plazma Technology in metallurgical processing, Iron and Steel Society, Inc.1987. [9]. Dembovskii V. - Plasmennaya metalurgiya, “Metalurgiya”, M., 1981. (In Russian) [10]. Kalinin N. N. - Metalurgicheskie visokochestotnie plazmotroni: Elektro I gazo dinamika, “Nauka”, M., 1987. (In Russian) [11]. Tsenov Ts. - Diplomna rabota “Konstruirane I izrabotvane na postoyanno tokova zachranvashta sistema za metalurgichna plazmena instalatsiya”, UCTM, Sofia 1989. (In Bulgarian) [12]. Xu J.L., K.A. Khor, R. Kumar - Physicochemical differences after densifying radio frequency plasma sprayed hydroxyapatite powders using spark plasma and conventional sintering techniques, Materials Science and Engineering A 457 (2007),24–32. [13]. Dahl P., I. Kaus, Z. Zhao, M. Johnsson, M. Nygren, K. Wiik, T. Grande, M.-A. Einarsrud - Densification and properties of zirconia prepared by three different sintering techniques, Ceramics International 33 (2007),1603–1610. [14]. Anselmi-Tamburini U., J.E. Garay, Z.A. Munir - Fundamental investigations on the spark plasma sintering/synthesis process III. Current effect on reactivity, Materials Science and Engineering A 407 (2005), 24–30. [15]. Wenbin Liu, Xiaoyan Song, Jiuxing Zhang, Fuxing Yin, Guozhen Zhang - A novel route to prepare ultrafine-grained WC–Co cemented carbides, Journal of Alloys and Compounds 458 (2008), 366–371. [16]. Zhang Zhao-Hui, Fu-Chi Wang, Lin Wang, Shu-Kui Li - Ultrafine-grained copper prepared by spark plasma sintering process, Materials Science and Engineering A 476 (2008), 201–205. [17]. Tiwari Devesh, Bikramjit Basu, Koushik Biswas - Simulation of thermal and electric field evolution during spark plasma sintering, Ceramics International 35 (2009), 699–708.
- 70 -

FO N D ATĂ19 76
THE ANNALS OF “DUNAREA DE JOS” UNIVERSITY OF GALATI.
FASCICLE IX. METALLURGY AND MATERIALS SCIENCE N0. 3 – 2011, ISSN 1453 – 083X
A COMPARATIVE APPROACH OF DEGRADATIVE POTENTIAL OF TWO DIFFERENT NANOPHOTOCATALYSTS ONTO
A MODEL TEXTILE DYE
Diana TANASA1, Narcisa VRINCEANU1, Claudia-Mihaela HRISTODOR1, Eveline POPOVICI1, Diana COMAN2, Florin BRINZA1, Ionut Lucian BISTRICIANU3, Daniela Lucia CHICET3
1“Al.I. Cuza” University, Iasi, 2„Lucian Blaga” University from Sibiu,
3„Gh. Asachi” Technical University email: [email protected]
ABSTRACT
Motivations and objectives. It is quite a difficult issue to treat, decolorize and
mineralize textile dye waste containing dyes by conventional chemical methods (primary: adsorption, flocculation and secondary: chlorination, ozonization. It has been demonstrated that semiconductor photocatalytic oxidation of organic substances can be an alternative to conventional methods of removal of organic pollutants from water [1]. Advanced oxidation processes (AOPs) employing heterogeneous catalysis have emerged as a potentially destructive technology leading to the total mineralization of most of organic pollutants. An additional advantage of the photocatalytic process is its mild operating conditions and the fact the semiconductor can be activated by sunlight (near UV), thus reducing significantly the electric power requirement and hence the operating cost [2].
The main result and characterizing aspect of the research consist of the effectiveness of a semiconductor photocatalytic treatment of synthetic wastewater. Nanophotocatalysts ZnO have been successfully grown by hydrothermal method, onto some fibrous supports previously functionalized (grafted with MCT (monochlorotriazinyl-β-cyclodextrin, MCT-β-CD). The synthesis is reported elsewhere. The hydrothermal synthesis was performed using two types of surfactants widely used in nanoparticles preparation: Pluronic P123(triblock copolymer) and CTAB (cetyltrimethylammonium bromide). The novelty of the study consists in using these two different surfactants in growning of ZnO onto the fibrous supports. For degradation of Erionyl Roth dye, batch experiments were performed by irradiating the aqueous solution of model textile dye, containing ZnO nano-coated fibrous supports as semiconductor, in the presence of UV light. The photocatalytic process occurs under the illumination of an UV lamp, emitting light at wavelength 365 nm. The rate of decolorization was estimated spectrophotometrically from residual concentrations.
Results and discussion. The enhancement of the photocatalytic activity is attributed to the CTAB. The performance of the photocatalytic system indicated that the photodegradation of the Erionyl Roth, in the presence of CTAB, occured with a 20 % reduction of time, compared to P123.The study has demonstrated that using the semiconductor performed by CTAB on the ZnO nano-oxides synthesized onto previously MCT grafted fibrous supports is effective in degradation of dyes as well as in the treatment of textile dye waste.
KEYWORDS: fibrous linen nanocomposites, photodegradation,
nanophotocatalyst, zinc oxide
- 71 -

FO N D ATĂ19 76
THE ANNALS OF “DUNAREA DE JOS” UNIVERSITY OF GALATI.
FASCICLE IX. METALLURGY AND MATERIALS SCIENCE N0. 3 – 2011, ISSN 1453 – 083X
1. Introduction
Generally present in the effluents of the textile, cosmetics, paper, leather, pharmaceutical, food and other industries, dyes are among the most important water pollutants. There are many methods (coagulating sedimentation, filtration, electro-coagulation, and adsorption by activated carbon) which have been investigated to remove the dyes; the main disadvantage of these methods consists in only transferring the dyes from one medium to another. Consequently, the developing of environmentally benign routes combining effective adsorption with enhanced photocatalytic efficiency, which completely mineralizes the organic pollutants became crucial [1,2]. Due to advances in its synthesis and unique optoelectronic, catalytic, and photochemical properties, ZnO, a compound semiconductor with a band gap of 3.37 eV, has attracted substantial attention in recent years. Although TiO2 has been widely used as the most active photocatalyst[3,4], ZnO could be a suitable alternative because of its lower cost, larger quantum yields, and better antibacterial effect. ZnO has been successfully used in photocatalytic degradation of pollutants [5,6] and is more efficient in the decomposition of several organic contaminants than TiO2 [2,7,8]. However, ZnO nanoparticles are prone to aggregation especially after calcination above 400◦C. This results in a remarkably reduced surface area and much larger crystallite size. In addition, ZnO has a relatively low adsorptive capacity, and its photocatalytic efficiency is not high in very dilute solutions of organic pollutants. Consequently, enrichment of reactants by adsorption is required for a highly efficient photocatalytic performance [9-11].
Recently green chemistry and chemical processes have emphasized the preparation of nanoparticles to eliminate or minimize generated waste and implement sustainable processes [12]. Nanoparticles of metal oxide and sulfides are prepared with polysaccharides as stabilizer. Zinc oxide nanoparticles can be synthesized using water as a solvent and MCT-β-CD(MonoChlorotriazinyl–β-Cyclodextrin) as a stabilizer [13,14,15].
2. Experimental approach 2.1. Synthesis of nano-ZnO particles In our research ZnO nanoparticles were
synthesized in-situ on linen fibrous supports having a certain concentration of MCT-β-CD (monochlorotriazinyl– β -cyclodextrin) by using the hydrothermal method. The linen samples with sizes of 30 x 30 cm2 were immersed in the solution prepared as follows: zinc acetate Zn(CH3COO)2·2H2O, purity –
99%) (0,005 mol) as precursor was solved in deionized water to form a clear solution by stirring and then 0,1 mol of urea solution was added drop-wise with constant stirring. Second, the pH value of the mixed solution was adjusted to 5 by adding acetic acid, added drop wise. The final reaction mixture was then magnetically stirred for two hours at room temperature and poured into into stainless-steel autoclaves with a 100-ml Teflon (poly[tetrafluoroethylene]), followed by immersion of the fibrous supports. Then the autoclaves were placed in the oven for the hydrothermal treatment at 90◦C overnight.
Fig. 1. Flow chart for the preparation of
nanoparticles-coated linen support.
The autoclaves have been cooled down to room temperature naturally. The textile samples are then extracted from the autoclaves. The obtained products were washed several times with distilled water. After complete washing nanocomposites were dried at 60◦C overnight for 3 h for complete conversion of the remaining zinc hydroxide to zinc oxide.
2.2. Photocatalytic activity of the synthesized catalysts
The photocatalytic experiments were conducted in a 400 ml beaker under the illumination of a single UV light lamp produced by Vilber Lourmat France, which predominantly emits at 365nm with intensity of 350 μW/cm2. Erionyl Roth was provided by a certain textile enterprise. All aqueous solutions were prepared using deionised water. For each experiment, the reaction suspension was prepared by adding 0.3 mg catalyst into 150 mL Erionyl Roth solution with an initial concentration of 30 mg/L. The suspension was magnetically stirred for 30 minutes in the dark to ensure the absorption/desorption equilibrium between dye molecules and the photocatalyst surface. Afterwards, the suspension was irradiated by the UV lamp. During the photodegradation process, the UV lamp was positioned horizontally above the surface of the suspension. In all experiments, the reaction temperature was kept at 25 ±2ºC.
Samples were taken out for measurement after various reaction times. The upper clear liquid obtained after centrifugal separation was analyzed by UV-Vis spectroscopy, on a Shimadzu UV-2401 UV-
- 72 -
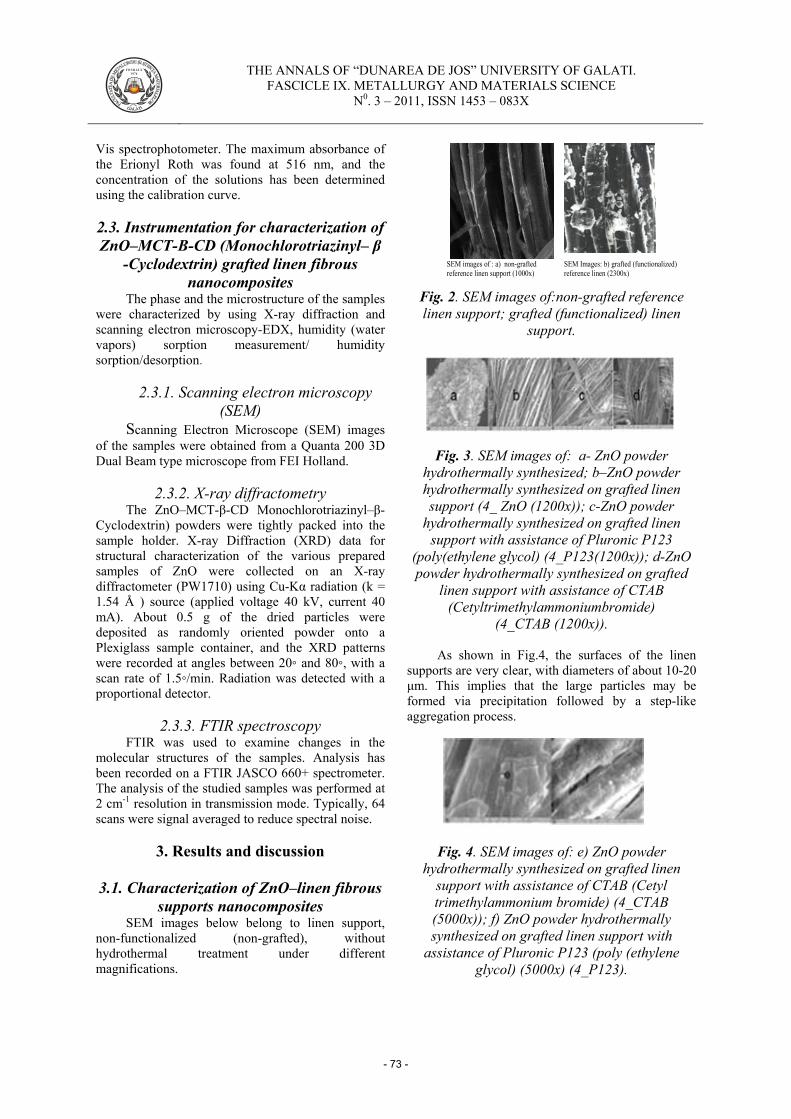
FO N D ATĂ19 76
THE ANNALS OF “DUNAREA DE JOS” UNIVERSITY OF GALATI.
FASCICLE IX. METALLURGY AND MATERIALS SCIENCE N0. 3 – 2011, ISSN 1453 – 083X
SEM images of : a) non-grafted reference linen support (1000x)
SEM Images: b) grafted (functionalized) reference linen (2300x)
Vis spectrophotometer. The maximum absorbance of the Erionyl Roth was found at 516 nm, and the concentration of the solutions has been determined using the calibration curve.
2.3. Instrumentation for characterization of ZnO–MCT-Β-CD (Monochlorotriazinyl– β
-Cyclodextrin) grafted linen fibrous nanocomposites
The phase and the microstructure of the samples were characterized by using X-ray diffraction and scanning electron microscopy-EDX, humidity (water vapors) sorption measurement/ humidity sorption/desorption.
2.3.1. Scanning electron microscopy
(SEM) Scanning Electron Microscope (SEM) images
of the samples were obtained from a Quanta 200 3D Dual Beam type microscope from FEI Holland.
2.3.2. X-ray diffractometry The ZnO–MCT-β-CD Monochlorotriazinyl–β-
Cyclodextrin) powders were tightly packed into the sample holder. X-ray Diffraction (XRD) data for structural characterization of the various prepared samples of ZnO were collected on an X-ray diffractometer (PW1710) using Cu-Kα radiation (k = 1.54 Å ) source (applied voltage 40 kV, current 40 mA). About 0.5 g of the dried particles were deposited as randomly oriented powder onto a Plexiglass sample container, and the XRD patterns were recorded at angles between 20◦ and 80◦, with a scan rate of 1.5◦/min. Radiation was detected with a proportional detector.
2.3.3. FTIR spectroscopy
FTIR was used to examine changes in the molecular structures of the samples. Analysis has been recorded on a FTIR JASCO 660+ spectrometer. The analysis of the studied samples was performed at 2 cm-1 resolution in transmission mode. Typically, 64 scans were signal averaged to reduce spectral noise.
3. Results and discussion
3.1. Characterization of ZnO–linen fibrous
supports nanocomposites SEM images below belong to linen support,
non-functionalized (non-grafted), without hydrothermal treatment under different magnifications.
Fig. 2. SEM images of:non-grafted reference linen support; grafted (functionalized) linen
support.
Fig. 3. SEM images of: a- ZnO powder
hydrothermally synthesized; b–ZnO powder hydrothermally synthesized on grafted linen support (4_ ZnO (1200x)); c-ZnO powder
hydrothermally synthesized on grafted linen support with assistance of Pluronic P123
(poly(ethylene glycol) (4_P123(1200x)); d-ZnO powder hydrothermally synthesized on grafted
linen support with assistance of CTAB (Cetyltrimethylammoniumbromide)
(4_CTAB (1200x)).
As shown in Fig.4, the surfaces of the linen supports are very clear, with diameters of about 10-20 μm. This implies that the large particles may be formed via precipitation followed by a step-like aggregation process.
Fig. 4. SEM images of: e) ZnO powder
hydrothermally synthesized on grafted linen support with assistance of CTAB (Cetyl trimethylammonium bromide) (4_CTAB (5000x)); f) ZnO powder hydrothermally synthesized on grafted linen support with
assistance of Pluronic P123 (poly (ethylene glycol) (5000x) (4_P123).
- 73 -

FO N D ATĂ19 76
THE ANNALS OF “DUNAREA DE JOS” UNIVERSITY OF GALATI.
FASCICLE IX. METALLURGY AND MATERIALS SCIENCE N0. 3 – 2011, ISSN 1453 – 083X
Due to its high number of coordinating functional groups (hydroxyl and glucoside groups) as polysaccharide, MCT-β-CD (monochlorotriazinyl–β-cyclodextrin) could form complexes with divalent metal ions [15]. It might be possible that the majority of the zinc ions was closely associated with the MCT-β-CD (monochlorotriazinyl–β-cyclodextrin) molecules. Based on the previous research, it can be claimed that nucleation and initial crystal growth of ZnO may preferentially occur on MCT-β-CD (monochlorotriazinyl–β-cyclodextrin). Moreover, as polysaccharide, MCT-β-CD (monochlorotriazinyl–β-Cyclodextrin) showed interesting dynamic supramolecular associations facilitated by inter- and intra-molecular hydrogen bonding, which could act as matrices for nanoparticle growth in size of about 30–40 nm. They aggregated to irregular ZnO–CMC nanoparticles in a further step. Figures 4e) and 4f) show SEM images of linen supports coated with ZnO with assistance of the two surfactants. As shown in the figures above, the nanoparticles exhibited an approximately lamellar morphology and the particles can be seen to be coated on the fibrous support surface. The fibrous supports surface became coarser after the treatment.
Fig. 5. (Color online) XRD patterns of: ZnO-powder (ZnO non-calcinated powder
hydrothermally synthesized); MCT- β -CD (Monochlorotriazinyl–β-cyclodextrin) 4 grafted (functionalized) linen fibrous support (4-CVT);
ZnO powder hydrothermally synthesized on MCT-Β-CD (Monochlorotriazinyl– β -
Cyclodextrin) 4 grafted linen fibrous support (4_ZnO); ZnO powder hydrothermally
synthesized on MCT-Β-CD (Monochlorotriazinyl– β -Cyclodextrin) 4 grafted
linen fibrous support in presence of Cetyl trimethylammonium bromide (4_CVT_ZnO_B) );
ZnO powder hydrothermally synthesized on MCT-β-CD (Monochlorotriazinyl– β -
Cyclodextrin) 4 grafted linen fibrous support in presence of P123 (4_CVT_ZnO_P123).
In addition, according to the SEM images of the
coated fabric, the uniformity of the fabric coated with
ZnO powder hydrothermally synthesized with assistance of CTAB (Cetyl Trimethylammonium Bromide) is better than that of ZnO powder hydrothermally synthesized in the presence of Pluronic P123 and possesses good washing fastness. The coating particles fell off easily for the ZnO powder hydrothermally synthesized without any surfactant assistance after washing, which might have been caused by the weak attaching force (covalent bonding between ZnO and linen) induced by the deteriorated crystallinity.
The standard XRD pattern of ZnO - non-calcinated powder hydrothermally synthesized with hexagonal phase structure corresponds to JCPDS card No 76-0704 [16]. All peak positions and relatively very small, decreased peak intensities of ZnO–linen supports nanocomposites matched well with those of the standard XRD pattern, which confirms that the samples consist of ZnO on linen matrix without any other impurity phase.
As it can be seen in Fig. 5, the intensities of the diffraction peaks weaken as the FWHM of the peaks decreases with the assistance of the two surfactants. In the case of ZnO nanoparticles synthesized with the assistance of those two surfactants, the result is suppressed ZnO grain growth and deteriorated crystallinity; it can be noted that the width of the peaks for nano-ZnO fibrous composites has decreased in a more relevant manner, in case of the presence of P123, compared to the sample synthesis assisted by CTAB.
The diffraction peaks of ZnO–linen nanocomposites showed a broadening at the base due to the nano-size effect.
In Fig. 6, the FTIR spectrum of hydrothermally synthesized, non-calcinated ZnO powder exhibited a high intensity broad band at about 430 cm_1 due to the stretching of the zinc and oxygen bond.
A similar band was also observed in synthesized nano-ZnO composites. As shown in the FTIR spectrum of MCT-β-CD (Monochlorotriazinyl– β -Cyclodextrin) , the absorption bands between 1000 and 1200 cm-1 were characteristic of the – C –O– stretching on polysaccharide skeleton. And two peaks appeared at 1420 and 1610 cm-1 corresponding to the symmetrical and asymmetrical stretching vibrations of the carboxylate groups. And the peak at 2920 cm-1 was ascribed to C–H stretching associated with the ring methane hydrogen atoms. A broad band centered at 3450 cm-1 was attributed to a wide distribution of hydrogen-bonded hydroxyl groups. The FTIR spectra indicated that in ZnO–MCT-β-CD (Monochlorotriazinyl – β - Cyclodextrin) nanoparticles, there was the strong interaction, but no obvious formation of covalent bonds between MCT-β-CD (Monochlorotriazinyl – β - Cyclodextrin) and ZnO.
- 74 -
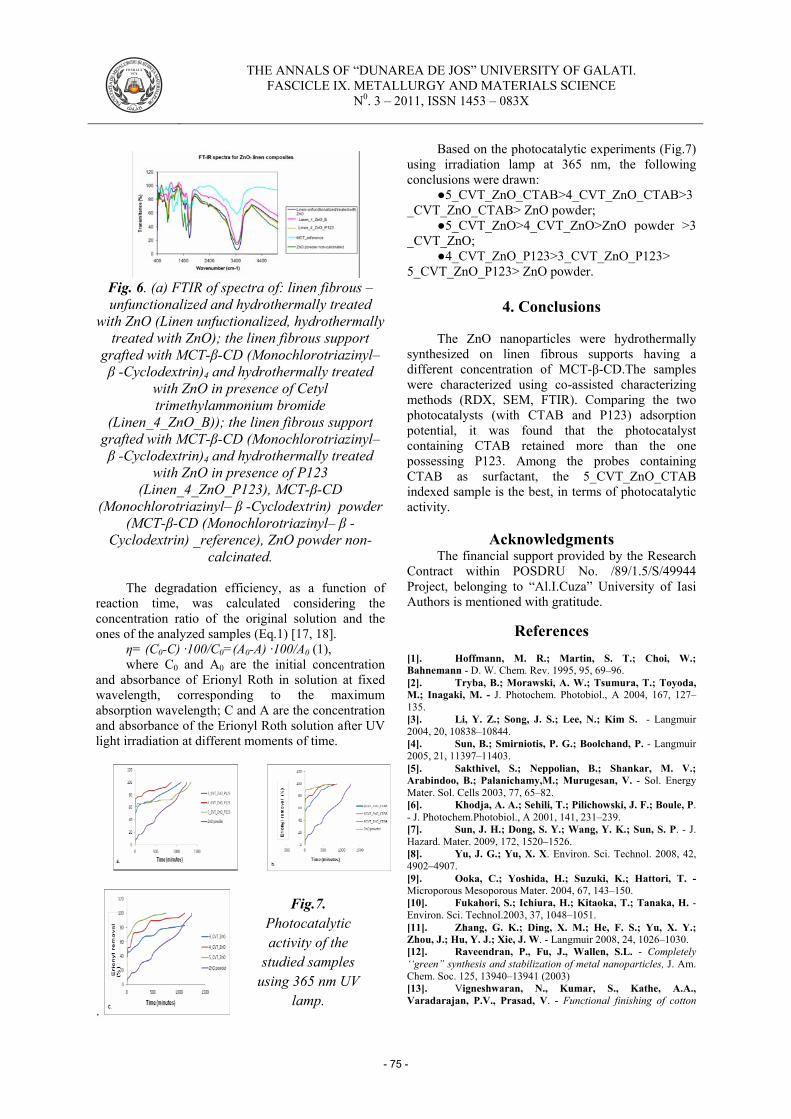
FO N D ATĂ19 76
THE ANNALS OF “DUNAREA DE JOS” UNIVERSITY OF GALATI.
FASCICLE IX. METALLURGY AND MATERIALS SCIENCE N0. 3 – 2011, ISSN 1453 – 083X
Fig. 6. (a) FTIR of spectra of: linen fibrous –unfunctionalized and hydrothermally treated
with ZnO (Linen unfuctionalized, hydrothermally treated with ZnO); the linen fibrous support
grafted with MCT-β-CD (Monochlorotriazinyl– β -Cyclodextrin)4 and hydrothermally treated
with ZnO in presence of Cetyl trimethylammonium bromide
(Linen_4_ZnO_B)); the linen fibrous support grafted with MCT-β-CD (Monochlorotriazinyl– β -Cyclodextrin)4 and hydrothermally treated
with ZnO in presence of P123 (Linen_4_ZnO_P123), MCT-β-CD
(Monochlorotriazinyl– β -Cyclodextrin) powder (MCT-β-CD (Monochlorotriazinyl– β -
Cyclodextrin) _reference), ZnO powder non-calcinated.
The degradation efficiency, as a function of
reaction time, was calculated considering the concentration ratio of the original solution and the ones of the analyzed samples (Eq.1) [17, 18].
η= (C0-C) ·100/C0=(A0-A) ·100/A0 (1), where C0 and A0 are the initial concentration
and absorbance of Erionyl Roth in solution at fixed wavelength, corresponding to the maximum absorption wavelength; C and A are the concentration and absorbance of the Erionyl Roth solution after UV light irradiation at different moments of time.
.
Based on the photocatalytic experiments (Fig.7) using irradiation lamp at 365 nm, the following conclusions were drawn:
●5_CVT_ZnO_CTAB>4_CVT_ZnO_CTAB>3_CVT_ZnO_CTAB> ZnO powder;
●5_CVT_ZnO>4_CVT_ZnO>ZnO powder >3 _CVT_ZnO;
●4_CVT_ZnO_P123>3_CVT_ZnO_P123> 5_CVT_ZnO_P123> ZnO powder.
4. Conclusions
The ZnO nanoparticles were hydrothermally
synthesized on linen fibrous supports having a different concentration of MCT-β-CD.The samples were characterized using co-assisted characterizing methods (RDX, SEM, FTIR). Comparing the two photocatalysts (with CTAB and P123) adsorption potential, it was found that the photocatalyst containing CTAB retained more than the one possessing P123. Among the probes containing CTAB as surfactant, the 5_CVT_ZnO_CTAB indexed sample is the best, in terms of photocatalytic activity.
Acknowledgments
The financial support provided by the Research Contract within POSDRU No. /89/1.5/S/49944 Project, belonging to “Al.I.Cuza” University of Iasi Authors is mentioned with gratitude.
References [1]. Hoffmann, M. R.; Martin, S. T.; Choi, W.; Bahnemann - D. W. Chem. Rev. 1995, 95, 69–96. [2]. Tryba, B.; Morawski, A. W.; Tsumura, T.; Toyoda, M.; Inagaki, M. - J. Photochem. Photobiol., A 2004, 167, 127–135. [3]. Li, Y. Z.; Song, J. S.; Lee, N.; Kim S. - Langmuir 2004, 20, 10838–10844. [4]. Sun, B.; Smirniotis, P. G.; Boolchand, P. - Langmuir 2005, 21, 11397–11403. [5]. Sakthivel, S.; Neppolian, B.; Shankar, M. V.; Arabindoo, B.; Palanichamy,M.; Murugesan, V. - Sol. Energy Mater. Sol. Cells 2003, 77, 65–82. [6]. Khodja, A. A.; Sehili, T.; Pilichowski, J. F.; Boule, P. - J. Photochem.Photobiol., A 2001, 141, 231–239. [7]. Sun, J. H.; Dong, S. Y.; Wang, Y. K.; Sun, S. P. - J. Hazard. Mater. 2009, 172, 1520–1526. [8]. Yu, J. G.; Yu, X. X. Environ. Sci. Technol. 2008, 42, 4902–4907. [9]. Ooka, C.; Yoshida, H.; Suzuki, K.; Hattori, T. - Microporous Mesoporous Mater. 2004, 67, 143–150. [10]. Fukahori, S.; Ichiura, H.; Kitaoka, T.; Tanaka, H. - Environ. Sci. Technol.2003, 37, 1048–1051. [11]. Zhang, G. K.; Ding, X. M.; He, F. S.; Yu, X. Y.; Zhou, J.; Hu, Y. J.; Xie, J. W. - Langmuir 2008, 24, 1026–1030. [12]. Raveendran, P., Fu, J., Wallen, S.L. - Completely ‘‘green” synthesis and stabilization of metal nanoparticles, J. Am. Chem. Soc. 125, 13940–13941 (2003) [13]. Vigneshwaran, N., Kumar, S., Kathe, A.A., Varadarajan, P.V., Prasad, V. - Functional finishing of cotton
Fig.7. Photocatalytic activity of the
studied samples using 365 nm UV
lamp.
- 75 -

FO N D ATĂ19 76
THE ANNALS OF “DUNAREA DE JOS” UNIVERSITY OF GALATI.
FASCICLE IX. METALLURGY AND MATERIALS SCIENCE N0. 3 – 2011, ISSN 1453 – 083X
fabrics using zinc oxide–soluble starch nanocomposites, Nanotechnology 17, 5087–5095 (2006) [14]. Ma, X.F., Chang, P.R., Yang, J.W., Yu, J.G. - Preparation and properties of glycerol plasticized-pea starch/zinc oxide–starch bionanocomposites, Carbohydr. Polym. 75, 472–478 (2009) [15]. Radhakrishnan, T., Georges, M.K., Nair, P.S. - 2007. Study of sago starch–CdS nanocomposite films: Fabrication, structure, optical and thermal properties, J.Nanosci. Nanotechnol. 7, 986–993 (2007) [16]. Jiugao, Yu, Jingwen, Yang, Baoxiang, Liu, Xiaofei, Ma - Preparation and characterization of glycerol plasticized-pea
starch/ZnO–carboxymethylcellulose sodium nanocomposites, Bioresource Technology 100, 2832–2841 (2009) [17]. F. Ollis, E. Pelizzetti, and N. Serpone -“Photocatalyzed destruction of water contaminants,” Environ. Sci.Tech., vol. 25, no. 9, pp. 1522-1529, Sept. 1991. [18]. D. Y. Goswami - “Engineering of the solar photocatalytic detoxification and disinfection processes,” in Advances in Solar Energy, vol. 10, [19]. K. W. Böer - Ed. Boulder: American Solar Energy Society Inc., 1995, pp.165-209.
- 76 -
MANUSCRISELE, CĂRŢILE ŞI REVISTELE PENTRU SCHIMB, PRECUM ŞI ORICECORESPONDENŢE SE VOR TRIMITE PE ADRESA:
MANUSCRIPTS, REVIEWS AND BOOKS FOR EXCHANGE COOPERATION, AS WELLAS ANY CORRESPONDANCE WILL BE MAILED TO:
LES MANUSCRIPTS, LES REVUES ET LES LIVRES POUR L’ECHANGE, TOUT AUSSIQUE LA CORRESPONDANCE SERONT ENVOYES A L’ADRESSE:
MANUSCKRIPTEN, ZIETSCHRITFTEN UND BUCHER FUR AUSTAUCH SOWIE DIEKORRESPONDENZ SID AN FOLGENDE ANSCHRIFT ZU SEDEN:
After the latest evaluation of the journals achieved by National Center for the Science andScientometry Politics (CENAPOSS), as recognition of its quality and impact at national level,the journal is included in B+ category, 215 code (http://www.cncsis.ro/2006_evaluare_rev.php).
The journal is indexed in Cambridge Scientific Abstracthttp://www.cncsis.ro/userfiles/file/CENAPOSS/B+feb_2011(9).pdfThe papers published in this journal can be visualized on the “Dunarea de Jos” University
of Galati site, the Faculty of Metallurgy, Material Science and Environment, page:www.fmsm.ugal.ro.
Publisher's Name and Address:Contact person: Prof. Dr. Eng. Elena MEREUTAGalati University Press - GUP47 Domneasca St., 800008 - Galati, RomaniaPhone:+40 336 130103, Fax: +40 236 461353Email: [email protected]
Editor's Name and Address:Prof. Dr. Eng. Marian BORDEIDunarea de Jos University of Galati, Faculty of Metallurgy, Materials Science and Environment111 Domneasca St., 800201 - Galati, RomaniaPhone: +40 336 130223, Phone/Fax: +40 236 460750Email: [email protected]

AFFILIATED WITH:
- ROMANIAN SOCIETY FOR METALLURGY
- ROMANIAN SOCIETY FOR CHEMISTRY
- ROMANIAN SOCIETY FOR BIOMATERIALS
- ROMANIAN TECHNICAL FOUNDRY SOCIETY
- THE MATERIALS INFORMATION SOCIETY
(ASM INTERNATIONAL)
Annual subscription (4 issues per year)
Edited under the care ofFaculty of
METALLURGY, MATERIALS SCIENCE ANDENVIRONMENT
Edited date: 30.09.2011Issues number: 200
Printed byGalati University Press
accredited CNCSIS47 Domnească Street, 800036
Galati, Romania