Embed Size (px)
Citation preview
Imported intermediary inputs, R&D and Firm’s Productivity: Evidence from Indian Hi-tech Industries
Chandan Sharma*
andRitesh Kumar Mishra****
AbstractThis paper examines dynamic as well as static effects of imported intermediary inputs and in-house R&D on productivity growth using firm-level panel data for Indian hi-tech manufacturing industries for the period 2000-2009. For this purpose, the present study adopts two empirical frameworks: production function and growth accounting method. Although we do have some evidence to conclude that imported inputs have positive and significant impact on the productivity of firms, but the overall findings are rather mixed. The estimated results from the production function framework suggest that impact of imported intermediary goods on output is reasonably sizable. Surprisingly, however, the role of R&D activities under this framework is found to be insignificant across industries and various estimation specifications. On the other hand, the analysis based on the growth accounting model yields positive results, which suggest that TFP of firms are closely linked with import and R&D activities. Firms that engage in these activities have 8% to 12% higher TFP than other firms across the industries. However, labor productivity is found to be insulated from these activities.
Keyword: imported intermediary, R&D, Firms’ productivity
JEL classification: D22, D24, F10, O30
* Assistant Professor, Department of Economics, National Institute of Financial Management (NIFM), Faridabad-121001, Haryana, India.
Address for communication: National Institute of Financial Management, Sector 48, Faridabad 121 001, Haryana, India, Telephone:+91-129-2465268, Fax: +91-0129-2418867, E-mail- [email protected]
**** Research Scholar, Department of Financial Studies, University of Delhi, India and Institute of Economic Growth (IEG), New Delhi, India. E-mail: [email protected]
1

1. Introduction
International trade in general and import in particular is considered one of the key sources of the
transmission and adoption of new technologies in the growth and development literature (e.g. see
Romer, 1987, Coe and Helpman, 1995, Barro, 1997 and Frankel and Romer 1999). This channel
is particularly important for developing economies where new technology is relatively scarce
mainly because low level of per capita capital and poor institutions quality especially in the
higher education and research. Now in a globalized competitive world, it is believed that firms of
developing world highly dependent on high quality imported intermediate goods. Use of these
goods has become an important channel of obtaining new technology, which finally leads to
enhancement in productivity and income of these countries. Through adoption and simulation of
technologies via import, developing countries can take advantage of research and development
(R&D) of developed countries to improve the efficiency of domestic production. The growth
models also suggest that imported intermediary inputs can potentially enhance productivity of
domestic firms because of their better quality as well as through learning spillovers between
foreign and domestic goods (e.g. Grossman and Helpman, 1991, Krugman, 1979 and Keller,
2004). However, empirical finding on this issue is very mixed. For example, recent studies of
Amiti and Konings (2007), Kasahara and Rodrigue (2008), Goldberg et al. (2008), Jones (2008)
and Halpern et al. (2009), have found a significant role of import or imported intermediary
inputs. Contrary to this, Lawrence and Weinstein (1999), Van Biesebroeck (2003) and Muendler
(2004) have shown insignificant or not very sizable impact of this activity.
On the other hand, the technological change through R&D activities and its impact on
productivity is also well recognized in the growth models (e.g., see Solow, 1957, Grossman and
Helpman, 1990; Smolny, 2000). Klette and Grilliches (1996) extended the edogenous growth
theory for R&D and productivity linkage in the context of firm and presented the quality
ladder model in a partial equilibrium framework. The model explains that R&D investment and
innovations are the engine of growth. Thus, the theortical association between R&D activities
and productivity of firms is well established in the literature. In the empirical literature too, there
is no dearth of studies on R&D and firm’s or plant’s performance. Most of these studies are
invariably found to have a significant and positive effect of R&D on the performance of firm.
However, the estimated elasticity of productivity or output with respect to R&D varies widely in
2

these studies (e.g. see Griliches, 1979, 1986, Griliches and Mairesse, 1990, Jaffe, 1986, and
Griffith et al., 2006).
In this paper, we have taken up both of the issues (imported intermediary inputs and R&D) and
attempt to investigate their role in the hi-tech industries in a developing and emerging economy-
India. The Indian case is both interesting and relevant, because the country has witnessed a series
of reform initiatives in 1990’s and 2000’s. As a part of this process, protection from import has
decreased substantially as the rate of tariffs and non-tariff barriers (NTBs) were reduced
considerable to at par with other developing economies. This has led to a surge in intermediate
imports in the country1. More importantly, with more than two-thirds of the intermediate import
growth occurring in new varieties (Goldberg et al. 2008). On the other side, to encourage firms
for conducting R&D, the government has announced a series of fiscal incentives and financial
support, which includes many new tax exemption schemes and most of the old such schemes
were extended. And the recent data shows that government efforts in this direction have been
reasonably successful as firms, at least in some industries, taking it more seriously and its
intensity have shown dramatic improvements over the period.
Against this background, this paper aims to provide insight stemming from these different
sperms of literature and provide evidence of whether the use of foreign intermediate goods and
doing in-house R&D enhance firm’s productivity, using a very recent panel data set on the
Indian machinery manufacturing firms from 2000 to 2009. The dataset is rich and it provides
heterogeneity in terms of import of intermediate inputs across firms and across time. It also
provides information on yearly R&D expenditure of firms, which is obviously different across
firms and year. We introduce three main novelties in empirical analysis in this paper. First, most
of the previous studies have explained that imported inputs and R&D capital are important
sources of productivity gain for firms. The related theories also explain that import and R&D is
closely linked through various economic channels. However, in the literature both the issues are
tested separately on productivity. We move a step ahead and bring both issues together to test the
impact of import and R&D in a single framework. The second novelty of this paper is to
1 As a result of progressive reduction in customs duty rates and exemptions on various counts, customs duties as a proportion of imports have been falling quite rapidly in India. The customs duty was only 7.40 per cent of imports in 2008-09 compared to 21.88 per cent in 1999-2000. For intermediate imports only 738 number of tariff line are above 10%, while 6782 line are below 10 %( see Table A.1. and A. 2. of Appendix). Source: International Trade, Economic Survey 2009-2010.,http://indiabudget.nic.in/es2009-10/chapt2010/chapter07.pdf.
3
investigate the impact through variety of ways, which includes both static and dynamic analysis.
The study also utilizes both the production function as well as the growth accounting methods to
test the impact. Third, the nature of the empirical analysis conducted in this study is, as generally
expected, subject to endogeneity and the simultaneity problem. To overcome these problems,
therefore, we utilize appropriate methodologies, i.e., the system Generalized Method of Moments
(sys-GMM) (Blundell and Bond 1998, 1999) and Levinsohn and Petrin (2003) (LP hereafter)
estimator to effectively account for these issues. More importantly, we depart from the existing
literature and attempt to accommodate the R&D and intermediate imports in the production
function. For this purpose, we modify the basic LP model.
The rest of the paper is organized as follows: Section 2 presents theoretical background and a
brief review of related literature. Section 3 discusses data related issues, while section 4 presents
empirical models and estimation techniques. Sectional 5 presents empirical results and discuss
their implication. And finally section 6 provides conclusion and policy suggestions on the basis
of the empirical findings.
2. The theoretical linkage and review of the related literature
A growing body of theoretical work and well supported by empirical studies in international
economics suggests that foreign trade has large positive effects on income, output and
productivity (Romer, 1987, Coe and Helpman, 1995, Barro, 1997 and Frankel and Romer 1999).
Especially the role of imported intermediate inputs is understood to be vital and that is why in
the recent years it has attracted considerable attention in the standard literature. How do
intermediate goods affect productivity? Answering this question, the related literature has
explained two important channels: the quality and complementarity mechanisms. One hand,
imported inputs are considerably better in quality than their domestic counterparts, which often
lead to better final products and higher productivity. This mechanism is well discussed and
crucial in the endogenous growth literature (e.g., Grossman and Helpman, 1991). On the other
hand, complementarity advantage is feasible through employing a combination of different
intermediate inputs in the production that may cause gains that are more than the “sum of the
parts”. These gains could come from imperfect substitution across goods, as in the widely
discussed love-of-variety framework of Krugman (1979) and Ethier (1982). It is also possible
through Kremer’s (1993) O-ring theory2 of economic development. The knowledge spillovers 2 The O-ring theory of Kremer (1993) states that high-skill workers-those who make few mistakes-wills be matched together in equilibrium, and that wages and output will rise steeply in skill. The model has been proved to be
4

between foreign and domestic goods could be another channel in this process (e.g., Aitken et al.
1997, Keller, 2004). For the empirical validation, a recent study of Jones (2008) has shown that
in equilibrium (through the income multiplier) these channels can work and potentially enhance
the level of technology, which leads to significant improvement in productivity..
In the standard literature, the other key channel of productivity and income gain is considered to
be innovation and research. In this concern, trade in general and import in particular is associated
with these activities through various ways. More importantly, both channels of productivity gain
are theoretical modeled together in the different growth frameworks. For example, total
investment in R&D is often motivated by anticipated high profits that might further strengthen
the expectation that international trade will reduce innovation and R&D activities in the import
competing industries and increase it in the exporting sectors. And as a matter of fact, if the
impact of import competition is visible in the form of return depressing in some industries, then
it is reasonable to expect comparatively less spending and effort on innovation activities.
However, as argued by Baldwin (1992), firms may have a motivation for not to innovate under
the conditions of imperfect competition, if they are deriving reasonably high profits from the
existing technologies. Therefore, in the condition the import competition could actually
encourage innovation by reducing the monopoly profits derived from not innovating.
The endogenous growth models explain that R&D expenditures of individual firms
contribute to productivity of an economy through their industry-wide spillover effect
(Grossman and Helpman, 1990a; Grossman and Helpman, 1990b; Romer, 1986). In this
framework, individual firms spend on innovation to obtain new technology that augments their
productivity growth. This has significant implications for overall economy as private know-how
of individual firms easily spills over to other firms of the same industry and latter to firms
of other industries. This acts as an external effect in enhancing the productivity of all
firms. With the spillover effect of R&D, a constant or decreasing returns to scale
aggregate production function may demonstrate increasing returns to scale, and this would
finally enhance output growth (Romer, 1986, Raut and Srinivasan, 1993). The implication of
this argument would be that a developing economy can acquire technological know-how through
consistent with large income differences between countries, the predominance of small firms in poor countries, and the positive correlation between the wages of workers in different occupations within enterprises. Furthermore, in the model, imperfect observability of skill leads to imperfect matching and thus to spillovers, strategic complementarity, and multiple equilibria in education.
5

import at a negligible cost. However, some others, for instance, Cohen and Levinthal (1989)
argue that firms need to invest in their own in-house R&D to acquire the new technology
which can be available in public domain through different modes including via import.
Therefore, theoretically it is quite reasonable to argue that R&D and import can work as
supplementary to each other in the production function.
Further, it is also argued that economies of scale often plays very crucial role in determining the
returns from R&D spending in the light of the fact that research also involves a substantial fixed
and sunk cost components. Therefore, in some sense the import competing sectors are expected
to have less R&D investment that scale of activity is limited with that of trade. This can also be
explained in the learning – by – doing framework of Lucas (1988), which explain why is trade is
an important channel of the productivity growth of the involved sectors. Under this approach it is
argued that sectors that produce on a larger scale are highly likely to grow faster than sectors the
produce less. In other word, industries which have comparative advantage will witness an
expansion in output and the expertise of firms and productivity of labor would improve
considerably in producing particular product. But if this is the case, then the exporters may be net
gainers while firms in import competing sectors may find themselves net losers.
Some recent studies have found a significant role of imported inputs in general and imported
intermediate goods in particular. But overall findings in the literature on this issue are rather
mixed. For example, Amiti and Konings (2007) find that the productivity gain from cutting
tariffs on intermediate goods is twice as big as those from comparable cuts for final goods in
Indonesia. Similarly, in case of India, Goldberg et al. (2008) have shown that access to new
intermediate inputs produces substantial productivity gains in India. More recently, while
discussing the importance of intermediate inputs for economic development, Jones (2008)
concluded that they can help in explaining a large income difference across countries. Halpern et
al. (2009) have found that imported inputs have large productivity effects: increasing the share of
imported goods from 0 to 100 percent increases productivity by 11 percent for Hungarian firms.
Similarly, in an important study, Kasahara and Rodrigue (2008) argued that through adoption
and imitation of imported technologies, countries can take advantage of R&D abroad to improve
the efficiency of domestic production. Their empirical analysis using plant-level Chilean
manufacturing panel data clearly suggests that becoming an importer of foreign intermediates
improves productivity.
6

On the other side, Lawrence and Weinstein (1999) found that lower tariffs and higher import
volumes would have been particularly beneficial for Japan during the period 1964 to 1973.
However, their findings suggested that in the Japanese case the salutary impact of imports stems
more from their contribution to competition than to intermediate inputs. Van Biesebroeck (2003)
find that productivity improvements do not happen through the use of more advanced inputs in
Columbia. Similarly, Muendler (2004) reached to the conclusion that there is only a small
contribution of foreign materials and investment goods on output for Brazil.
On the other side, there is also a large volume of empirical literature focuses on R&D and firm’s
or plant’s performance. Most of these studies are consistently found to have a significant and
positive effect of R&D on the performance of firm. However, the estimated elasticity of
productivity or output with respect to R&D found to varies widely in these studies. Considering
the example from firm-level studies, Griliches (1979, 1986) found that the elasticity to R&D in
the US manufacturing was around 0.07. In the case of France, it was found that the elasticity
was larger than the US and it ranged between 0.09 and 0.33 (Cuneo and Mairesse, 1984;
Mairesse and Cuneo, 1985). For USA, Jaffe (1986) estimated the elasticity around 0.20. For the
same country, Griliches and Mairesse (1990) found it is ranging between 0.25 to 0.45, while in
the same study, for Japanese manufacturing it was found to range between 0.20 to 0.50.
However, for Taiwanese manufacturing firms, Wang and Tsai’s (2003) estimation suggested it as
0.19. In a recent paper, Griffith et al. (2006) for the UK manufacturing firms found the size of
the elasticity too low (ranging from 0.012 to 0.029). In the case of India, the elasticity with
respect to value added was calculated to be 0.064 in the heavy industries, 0.357 in the light
industries and 0.101 in the overall industries (Raut, 1995).
In the light of above discussion, three important issues are emerged. First, there is a strong
theoretical linkage between Import, R&D and productivity. Second, empirical findings in this
area are widely mixed and inconclusive. Finally, despite a voluminous research, hardly any study
test the empirical linkage between these variables in a single framework and thus the issue is still
its infancy. Therefore, it is both relevant as well as interesting to explore the issue further to find
out that whether the linkage exists in the Indian manufacturing and if so, what is the direction of
this linkage.
3. Data and Description
7

The dataset contains yearly information on Indian manufacturing firms from 2000 to 2009,
obtained from Prowess database3. Our sample covers firms of three hi-technology industries:
Electrical (125 firms), Electronics (138 firms) and Non-Electrical (195 firms). These industries
are part of 2digit Machinery manufacturing. We select the firms from these industries for our
analysis on the basis of availability of data and firms with missing data of more than one year in
the database are excluded from the study. The primary data series extracted from the company
accounts are industrial sales, number of workers, gross value added, expenses incurred on raw
materials and power, fuel and energy. Since our focus in this study is on R&D and import
activities of firms, we also take these data series from the same database. Two capital related
data series namely gross fixed capital and investment are also taken from the Prowess database.
And to derive the series of capital, a real capital stock series is constructed using the perpetual
inventory capital adjustment Method. We adhere to the construction process outlined by
Levinsohn and Petrin (2003) since that is the methodology used in the TFP estimation process. 4
Our data series are deflated with appropriate deflators. Output related data are deflated by
industry specific Wholesale Price indices (WPI). This deflator is obtained from Office of the
Economic Adviser (OEA), the Ministry of Commerce & Industry of India
(http://eaindustry.nic.in/ ), while raw materials series is deflated by the all commodities WPI, and
the energy series is deflated using the Energy Price Index as provided by the OEA. The capital
data is deflated by capital deflator, which is obtained from Handbook of Statistics on Indian
Economy (RBI) (http://www.rbi.org.in). The details of data series, their definition and
descriptive statistics are presented in Tables A.3 and A.5 of Appendix.
4. Empirical Models and Estimation Techniques
3 Prowess Database is online database provided by the Centre for Monitoring Indian Economy (CMIE). It is a database of large and medium Indian firms. It contains detailed information on over 23,000 firms. These comprise all companies traded on India's major stock exchanges and others including the central public sector enterprises. The companies covered in the database account for 75 per cent of all corporate taxes and over 95 per cent of excise duty collected by the Government of India. The financial data includes in the database are mostly the information that operating companies are required to disclose in their annual reports. The accepted disclosure norms under the Indian Companies Act, 1956, make compulsory for companies to report all heads of income and expenditure, which account for more than 1% of their turnover.
4 Specifically, we compute it as K t=(1−δ ) K t−1+ I twhere K is the capital stock, I is deflated gross investment, and δ is the rate of depreciation taken at 7%, consistent with similar studies for India (Unel, 2003 and Ghosh, 2009). t indicates for year. The initial capital stock equals the net book value of capital stock for 1994.
8

4.1. The Model of Production function Approach In first stage, to examine the effect of imported intermediate inputs and firms’ own R&D
activities, we modify the traditional Cobb–Douglas production function. Broadly we follow a
production function approach, a la Griliches (1980), Schankerman (1981) Bartelsman et al.,
(1996) Branstetter and Chen (2006), Acharya and Keller (2007) and Kasahara and Rodrigue
(2008). And our specification also includes some additional variables which may potentially
affect the firm’s output through technological enhancement. Thus, the output can be described as
Q=K ¿∝N ¿
β M ¿γ ℑ¿
δ RK ¿θ A¿
ϑ eε¿……………………………….1
taking the logs of both sides gives us
q=αk ¿+β n¿+γ dm¿+δℑ¿+θrk+ϑ a¿+ε¿……………………2
where Q is output, K is capital, N is labor input, M is materials, IM is imported intermediary
inputs, RK is the firm’s own R&D stock, and A is the stock of technology. In the equation 2,
lower case letter(s) indicate for logged value of variables. Unlike many of the previous studies
that use dummies for intermediate inputs and R&D, which is static in nature, we use their actual
size. This would make our analysis dynamic in nature that explains the role more effectively and
practically. Estimating equation (2) using Ordinary Least Squares (OLS) with fixed or random
effect usually provides estimates that are generally consistent with a priori knowledge of factor
shares and constant returns to scale (Griliches and Mairesse, 1995). However, the equation is an
augmented production function and a number of generic issues exist in the estimation of the
capital and labor coefficients, and in the multivariate regression context any bias in them
generally leads to biases in the other regression coefficients as well. A major econometric issue
confronting production function estimation is the possibility that some of these inputs are
unobserved. In that case, if the observed inputs are chosen as a function of the unobserved
inputs, there is a problem of endogeneity, and OLS estimates of the coefficients of the observed
inputs will be biased.
To tackle potential endogeneity and unobserved heterogeneity, we use the GMM technique,
following Arellano and Bover (1995) and Blundell and Bond (1998,1999). The Blundell and
Bond estimator, also called system GMM estimator, combines the regression expressed in first
differences (lagged values of the variables in levels are used as instruments) with the original
equation expressed in levels (this equation is instrumented with lagged differences of the
variables) and allows to include some additional instrumental variables. We prefer this option to
9

a fixed-effects estimator for two reasons. First, it allows us to take into account the unobserved
time-invariant bilateral specific effects. Second, it can deal with the potential endogeneity arising
from the inclusion of the lagged dependent variable and other potentially endogenous variables.
Alternatively, Olley and Pakes (1996) and Levinsohn and Petrin (2003) have developed two
similar semi-parametric estimation procedures to overcome this problem. We prefer to apply LP
estimation technique for the estimation, which has been proved to be a superior method. This
methodology explicitly recognizes the endogeneity that occurs since firms observes its
productivity growth.
4.2. Modified Levinsohn and Petrin (2003) method
Original LP method does not allow direct inclusion of imported inputs R&D capital in the
production function. Therefore, considering the aims of this research we modified this model to
accommodate these important variables in the production specification.
The basic model of the LP procedure (gross revenue version) for a Cobb–Douglas production
function is as follows:
q t=β0+βn nt+βk k t +βmmt+ωt+ηt (3)
¿ βn nt+ϕ(k t , mt)+ηt (4)
where ϕ (k t ,mt )=β0+βk k t+βm mt+ωt (k t ,mt )
in the equation q, n, k and m are the firm’s gross revenue, labor, capital and material, respectively
(all variables are logged). In the model, error has two parts, first is ω, which represents the
transmitted productivity component while η an error term that is not correlated with inputs. In
the model material demand is assumed to be dependent on capital and ω.
We have modified the above model (3) and decomposed material and capital variables. Material
is divided into domestically purchased (dm) and imported (im) material, while capital variable is
decomposed into capital (k) and R&D capital (rk). Therefore, our specification is now as follows:
q t=β0+βn nt+βk k t +βrk rkt+ βdmdmt+β ℑ ℑt +ωt+ηt (5)
¿ βn nt+ϕ(k t , rk t , dmt , ℑt)+ηt (6)
where ϕ (k t ,rk t , dmt ,ℑt )=β0+βk k t+βrk rk t+βdm dmt +βℑ ℑt+ωt (k t , rkt , dmt ,ℑt ) (7)
Using OLS for estimation with a third-order polynomial approximation ink t ,rk t , dmtand ℑt in
place of ϕt ( k t , rk t , dmt , ℑt ) ,and we estimate β̂n .
10

In next stage, for candidate values of βk¿ , βrk
¿ , βdm¿¿ βℑ
¿( for βk , βrk , βdm ¿β ℑ), we estimate ω̂t
using
ω̂t=ϕ̂t−βk¿k t−βrk
¿ rkt−βdm¿ dmt−βℑ
¿ ℑt (7)
Using theωt’s for all t, we estimateE^(ωt|ωt−1 ). Then residuals for βk¿ , β rk
¿ , βdm¿¿ βℑ
¿are computed
as
ηt +ξ t=qt−βn n̂ t−βk¿ k t−βrk
¿ rk t−βdm¿dmt−βℑ
¿ℑt−E^(ωt|ωt−1 ) (8)
This residual must interact with at least two instruments to identifyβk , βrk , βdm ¿ βℑ. In the model,
period t’s capital stock (k t and rk t ¿is determined by the previous (t-1) period’s investment
decisions, it does not respond to shocks to this period’s(t) productivity innovation term ξ t,
providing the moment condition
E (ηt +ξ t|k t )=0
E (ηt +ξ t|rk t )=0
which is implicitly imposed in the objective function. An additional momencondition is needed
to identify βdm and βℑ separately from βk and βrk. LP use the fact that the previous period’s level
of material usage βdm and βℑ are uncorrelated with this period’s error, giving us the
moment condition
E (ηt +ξ t|dmt−1 )=0
E (ηt +ξ t|ℑt−1 )=0
Thus, with Zt ≡(k t , rkt , dmt−1 ,ℑt−1), one candidate estimator solves
min ¿ (9)
with h indexing the elements of Zt .
4.3. The Model of Growth Accounting Approach
To examine the effect directly on the productivity and indirectly on the output, as well as to
check the robustness of the results of the production function approach, we follow a growth
accounting method. Under this framework, we test the effect of imported intermediary inputs and
R&D activates on firms’ productivity i.e. TFP and labor productivity. We start our empirical
modeling with the growth accounting framework. Under this approach we broadly follow Coe
and Helpman (1995) and Atella and Quintieri (2001) and test firms’ status in importing
11

intermediary inputs and pursing in-house R&D. Our baseline empirical model to be estimated is
as follows:
Zit = α +β import it +γ R&Dit+β sizeit +uit ……………….10
where Z is TFP or labor productivity (NP) of firm i in period t. import is import dummy (if
import raw materials in period t then 1, otherwise 0) and R&D is R&D dummy (if R&D in
period t then 1, otherwise 0) is dummy for firms status. These dummies would capture the effects
regarding productivity of firms when they, for some exogenous reason, start importing or doing
R&D. Size is modeled in the equation as a control variable, which is proxied by firm’s capital
stock in TFP equation) and capital labor ratio (ratio of capital divided by number of workers) in
labor productivity model. In order to estimate equation 10, our first task is to compute TFP of
firms. For this purpose, we utilize LP estimator and using firms’ value added as output, we
predict TFP of firms’ (see Table A. 4. of Appendix for details). NP is computed as ratio of
value of firm’s sales divided by number of workers.
5. Empirical Results
5.1. Results of Production function Approach The estimated results of production function using OLS-Fixed Effect estimator are presented in
Table 1. Columns 1, 2 and 3 of the table provide results for Electrical, Electronics and Non-
Electrical industry respectively. These results suggest that imported inputs are crucial for the
productivity growth in two out of three industries. The results reveal that in Electrical and Non-
Electrical industry the impact of imported inputs on the firms’ output is positive and highly
significant and it is found to be 3.4% and 5.4% respectively. This implies that firms which use
imported intermediate inputs have higher productivity than those which use only domestically
produced inputs. However, our other important variable, R&D capital is not found to be
significant in all sample industries.
Table 1: Estimates of production function: OLS-Fixed Effect MethodVariables Electrical
(1)Electronics
(2)Non-Electrical
(3)
Capital (k) 0.050161**(0.0356882)
-0.0293907*(0.0518132)
0.0176241*(0.0160354)
Labor (n) 0.0949829**(0.0447031)
0.2860544**(0.0619723)
0.0545596**(0.0244808)
12

Imported Materials (im) 0.0343653**(0.0164002)
-0.0111357(0.035426)
0.0545596**(.0244808)
R&D (rk) 0.0226709(0.0188615)
-0.028858(0.0283994)
0.0294172**(.0084999)
Materials (m) 0.9218663**(0.039649)
0.8337228**(0.0486729)
0.8223895**(0.0196193)
Const. 0.1917927**(0.0959105)
1.564908**(0.1641703)
0.424992**(0.064024)
R2 0.9504 0.9274 0.9799Notes: 1. Standard errors are in parenthesis.2. 2. ** and * denote significant at the 5% and 10% level, respectively.
The OLS-fixed effect estimator is not designed to correct the problem of simultaneity between
inputs and the persistent shock that varies within firm over time. To effectively account for the
simultaneity and endogenity problem in panel data, we further estimate the equation by using sys
–GMM estimator. Estimated results are reported in Columns 1, 2 and 3 of Table 2. Our
estimation results suggest that only in Non-Electrical industry imported intermediary inputs have
some impact (2.1%) on productivity. In other two industries the impact is found to be negligible
as well as statistically insignificant at the conventional level. Consistent with the OLS results, we
fail to find any role of R&D capital on firms’ output in all of our sample industries. However,
some other noticeable changes can be observed at this stage, i.e. the size of the coefficients of
material have reduced in sys-GMM estimation, which is true for all industries.
Table 2: Estimates of production function: sys-GMM MethodVariables Electrical Electronics Non-Electrical
Output lag 1(q t−1 ¿0.4695624**
(0.03769)0.2541608**(.0389974)
0.2674425**(.0391009)
Capital (k) 0.1970341**(0.0345295)
0.0353609*(.0598483)
0.038836*(0.0237644)
Labor (n) 0.0150492*(0.0477412)
0.236663**(.0558817)
0.0061497*(.0369877)
Imported Materials (im) 0.0044729(0.0164402)
-0.0186227(.0324156)
0.021651**(0.0129099)
R&D (rk) 0.0133995(0.0180928)
0.0155522(.0251258)
0.010629(.0144718)
Materials (m) 0.716367**(0.0418642)
0.7706053**(.0583683)
0.6610974**(.0323655)
Const. 0.1911468**(0.1030421)
1.213107**(0.1592218)
0.3812155**(0.085117)
Sargan (p-value) 0.18 0.23 0.09Notes: 1. Standard errors are in parenthesis.2. ** and * denote significant at the 5% and 10% level, respectively.3. Sargan is the Sargan (1958) test of over-identifying restrictions.
13

In the order to correct for the simultaneity problem, we next apply the modified LP method (as
explained in 4.2) and the estimated results are report in Table 3. It is noteworthy that the size of
coefficients for the imported intermediary has now improved in comparison with sys-GMM
estimation. In Electrical and Non-electrical industry the elasticity is estimated to be 4% and 5%,
respectively and they are highly significant. In Electronic industries again the impact of this
variable is found to be weak as well as insignificant. Consistent with previous results here too
we fail to find any impact of in-house R&D capital on the productivity. Results also indicate for
a wide variation in estimated elasticity of other inputs as well.
Table 3: Estimates of production function: LP MethodVariables Electrical Electronics Non-Electrical
Capital (k) 0.0315154* (.1396067)
0.181126**(0.082058)
0.00127(0.039206)
Labor (n) 0.1365191*(0.0768081)
0.2225017**(0.0677643)
0.172844**(0.0242392)
Imported Materials (im) 0.0400799** (0.015478)
0.0008105(0.0272435)
0.050162**(0.011833)
R&D (rk) -0.0046667 (0.0303901)
-0.0143926(0.0160265)
0.0237034(.014944)
Materials (m) 0.9736731** (.1380239)
0.7941083**(0.1293793)
0.7698142**(0.114241)
Wald test (P-Value) 1.47 (0.2251) 1.47 (0.2246) 0.02 (0.8909)1. Standard errors are in parenthesis.2. ** and * denote significant at the 5% and 10% level, respectively.3. Wald test is Wald test of constant returns to scale.
One might wonder why the estimates for import coefficient from the sys-GMM and LP
estimators are substantially different than the OLS-fixed effect estimates. In a multivariate
context, however, even if R&D and import variables are positively correlated with contemporary
shocks, the OLS estimates for both variables could be downwardly biased when R&D and
import are less responsive to a shock than other inputs (e.g., see Levinsohn and Petrin, 2003).
This may probably be the case as R&D and imported inputs are persistent over time in the data.
Not surprisingly, however, the estimated capital and labor coefficient from the LP estimation are
largely different than the OLS-fixed effect estimates perhaps because LP estimators has
corrected the biasness in OLS estimated coefficients. But relative to the general specification,
our specification includes two additional variables—imported inputs and R&D capitals, which
may positively correlated with capital and, consequently, it is difficult to estimate the direction of
OLS bias especially in estimation of capital coefficient in our case.
14

Results of estimation in this section broadly indicate that imported intermediary inputs have
some impact in at least two industries of our sample. This is consistent with endogenous growth
theories, which consider ‘learning by importing’ as an important channel of productivity growth.
Our findings regarding R&D also make sense as the Indian manufacturing traditionally has very
low intensity in this, therefore, lowering the tariff on imports have perhaps made the imported
intermediary inputs as an attractive substitute of in-house R&D activities. Thus, intermediate
inputs may enhance productivity by providing domestic firms with access to technologies that
are embodied in foreign capital goods that are not available domestically. Therefore, it is
reasonable to argue that for technical improvement and productivity enhancement, Indian firms
are more dependent on imported inputs rather than doing their own R&D activities. In other
words, it can be convincingly argued foreign R&D is proved to be more crucial in the Indian
case, which avoids high fixed and sunk cost from in-house R&D.
5.2. Results of Growth Accounting Approach
We estimate equation 10 using OLS-fixed effect method. In Table 4, we present result of the
estimation in which TFP is modeled as dependent variables. Columns 1, 3 and 5 of the table
report results in which import and R&D dummies are tested. To investigate TFP difference for
firms which engage in both import as well as R&D, we interact dummies of both and their results
report in columns 2,4 and 6 of the table. The results suggest that importing has sizable, positive
and statistically significant impact on TFP of firms across our sample industries. This can be
interpreted as importing firms are 14%, 8% and 9.5% more productive than non-productive firms
in Electrical, Electronics and Non-Electrical industry, respectively. Our results also confirm
positive and significant impact of R&D pursuing firms. They indicate that firms that engage in
this activity have 8%, 0.3% and 14% higher TFP in Electrical, Electronics and Non-Electrical
industry, respectively. This result also suggests that TFP of Non-electrical firms are very
sensitive towards the R&D activity. In the alternative specification, we test the impact on TFP of
firms that engage in both import and R&D. Results suggest that firms in Electrical and Non-
Electrical industry are 7.9% and 11% more productive than the rest of firms, respectively.
Overall, these results suggest that unlike the output, TFP of firms across the sample industries
are highly sensitive to both the activities. Our variable for size-capital is found to be statistically
significant and sizable across the industries and various specifications.
15
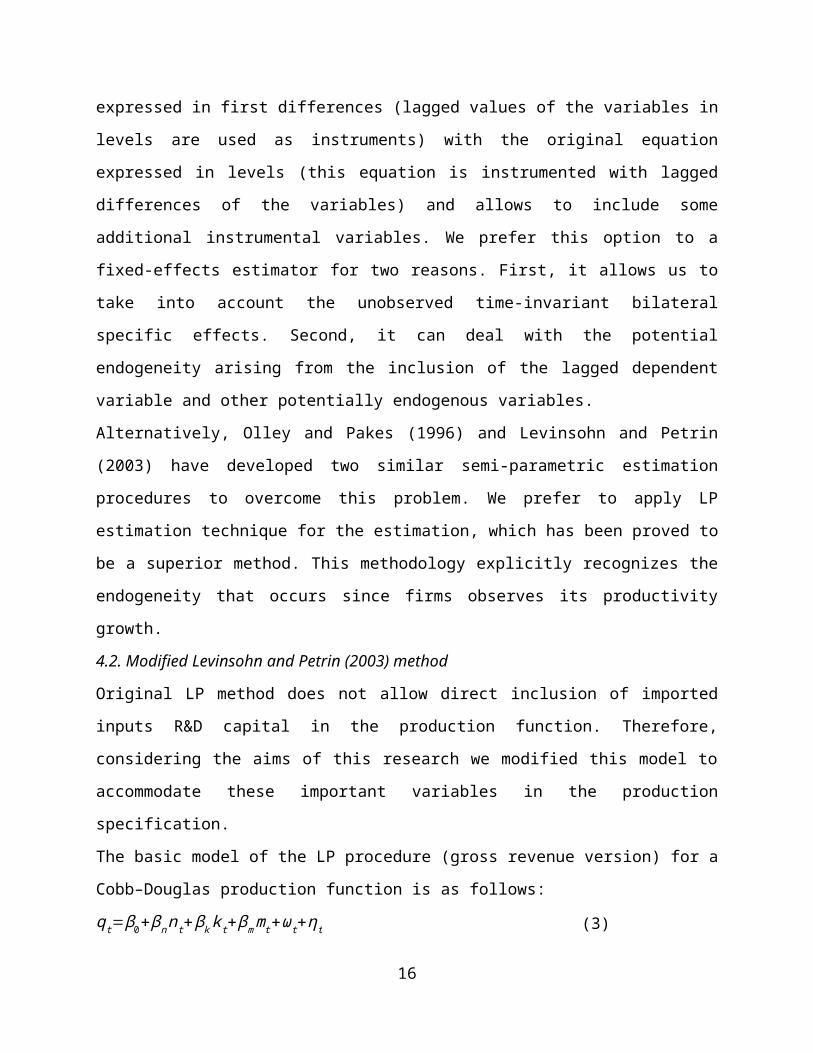
Table 4: Determinants of TFP: discrete variables with the control variableVariables Electrical Electronics Non-Electrical
1 2 3 4 5 6R&D
Dummy0.0843395**(.0266647)
0.0033852**(.0156459)
0.1447293*(.0418966)
Import Dummy
0.1416604** (.0298868)
0.0818501** (.024626)
0.0958881**(.0436655)
R&D Dummy*
Import Dummy
0.0791011**(0.0268055)
0.0007386(0.0158723)
0.1164645**(0.043683)
Size (k) 0.1146176**(0.0363326)
0.1325962**(0.0365582)
0.0135609**(0.0202279)
0.0221698** (0.0201663)
0.0654592**(0.0388705)
0.0683725*(0.038985)
Const. 0.7197804**(.050495)
0.8217608**(0.0467379)
0.5472462** (.028405)
0.6107535(0.0213508)
1.165745**(0.0569005)
1.255574** (0.0442811)
R2 0.0861 0.2630 0.0379 0.0281 0.3025 0.2953 1. Standard errors are in parenthesis.
2. ** and * denote significant at the 5% and 10% level, respectively.
After estimating the effect of importing and R&D on TFP, we now intend to investigate the role
of these activities on labor productivity of firms for our sample industries. The estimated results
of equation 3 for NP are reported in Table 5. Results are indeed surprising as the estimated
coefficient suggests that both importing and R&D don’t have any significant impact on labor
productivity of firms across the sample industries (see columns 1, 3 and 5). Furthermore, the
results also suggest that firms which engage in both of the activities do not have any superiority
in labor productivity over other firms as the interaction variable is not found to be significant in
any of the industries. The hypothesis of endogenous models that workers can acquire the
knowledge to unbundle the new embodied technology through use imports of intermediary
goods, which finally convert into higher labor productivity is not looking true in the Indian case.
Table 5: Determinants of NP: discrete variables with the control variableVariables Electrical Electronics Non-Electrical
1 2 3 4 5 6R&D
Dummy.0148286
(.1022795).0158567
(.1243676).0148286
(.1022795)Import
Dummy.0658908
(.1068353)-.2867931(.1949212)
.0658908(.1068353)
R&D Dummy*
Import Dummy
.0329431(.0222594)
.0088462(.1256226)
-.0042221(.1062981)
size(k/n) 1.155297**(.0536087)
-.488901**(.0491253)
-.0902295*(.0515696)
-.0956673*(.0514673)
1.155297**(.0536087)
1.155206**(.0535971)
Const. -.0766274(.1017393)
.8025466(.0273003)
.6620087**(.1778478)
.4174344**(.0580874)
-.0766274(.1017393)
-.0147769(.0488609)
16

R2 0.2239 0.0891 0.0388 0.0627 0.2239 0.21811. Standard errors are in parenthesis.
2. ** and * denote significant at the 5% and 10% level, respectively.
6. Conclusion
In this paper, we have examined the relationship between imported intermediary inputs, in-house
R&D and productivity using firm-level longitudinal panel data for Indian hi-tech (Electrical,
Electronics and Non-Electrical machinery) manufacturing industries from 2000 to 2009. To test
the linkage, the study follows two empirical frameworks: production function and growth
accounting method. Further, to effectively overcome the problem of potential endogeneity,
simultaneity and unobserved heterogeneity in the analysis, which is highly likely in the
estimation of production function, we use the sys-GMM technique and modified Levinsohn and
Petrin (2003) estimators along with the traditional methods of panel data. The study also
attempts to test both dynamic as well as static effects of both of activities. Although we do have
some evidence to conclude that imported inputs have positive and significant impact on the
productivity of firms, but the overall findings are rather mixed. Estimation results of the
production function framework suggest that the impact of imported intermediary goods on output
is reasonably sizable (2%-5%) on Non-Electrical firms, slightly lower (0.4%-4%) on Electrical
firms and negligible in the Electronic industry across various specifications. These findings are
much lower than that of Kasahara and Rodrigue (2008) for the Chilean manufacturing.
Surprisingly, the role of R&D under this framework is found to be insignificant across the
industries and estimation specifications. Nevertheless, both of these results are somewhat on the
expected line. As despite considerable policy liberalization in the external sector of the economy
in the recent years, the share of imported intermediary inputs in international trade has still not
reached to a level like many other developing countries to have a strong impact on the
productivity. Further, the results are highly dismal in the case of R&D activities and productivity
growth in India. The results suggest that despite significant efforts and incentives, the scale of
R&D is still too low to have any significant impact on the overall productivity of the firms. Also,
over the period, the impact of R&D has not improved substantially, as findings of Raut (1995)
for 1975-1986 showed similar elasticity. The situation, therefore, requires immediate policy
attention to increase the scale of R&D and technology innovation which is considered to be one
of the main sources of productivity growth. Furthermore, the underling linkages are especially
17

weak in Electronic industry. It seems that this industry has not been able to cope up in changing
market dynamic as the Chinese products are dominating in this industry.
On the other hand, the analysis based on the growth accounting model has offered some positive
and encouraging results. In fact under this approach, we try to test the static effects of both of
activities. Our findings suggest that TFP of firms in all three industries are closely linked with
import and R&D activities. Firms that engage in these activities have 8% to 12% higher TFP
than other firms across the industries. However, labor productivity is found to be completely
independent from these activities in all sample industries, which is indeed a surprising result. The
hypothesis of unbundling of new technology through the use of imported intermediary goods and
in-house R&D is found to be true for TFP of firms. However, this acquired knowledge does not
seem to be converting into higher labor productivity, which could be a serious concern for the
policy makers. Overall the results of the present study have strong policy implications for the
productivity enhancement strategies and international trade policy in India. Also, the results may
help indirectly in designing some other policies, i.e. exchange rate and taxation, to boost up the
import intensity and R&D activities to such a level where technological spillover and innovation
can perform a crucial role in augmenting productivity growth.
References:
Amiti, M., Konings, J., 2007. Trade liberalization, intermediate inputs and productivity: Evidence from Indonesia, American Economic Review 97 (5), 1611-1638.
Baily, M. N., Hulten, C., Campbell, D., 1992. Productivity dynamics in manufacturing plants. Brookings Papers on Economic Activity, Microeconomics 67–119.
Barro, R. J., 1997. Determinants of Economic Growth, MIT Press, Cambridge MA.
Bernard, A. B., Eaton, J., Bradford J., J., Kortum, S., 2003. Plants and productivity in international trade. American Economic Review 93 (4), 1268–1290.
Coe, D. T., Helpman, E., 1995. International R&D spillovers, European Economic Review 39(5), 859-887.
Cuneo, P., Mairesse, J., 1984. Productivity and R&D at the firm level in French manufacturing. In: Griliches, Z. (Ed.), R&D, Patents and Productivity. University of Chicago Press, Chicago.
18

Ethier, W. J., 1982. National and international returns to scale in the modern theory of international trade, American Economic Review 72(3), 389-405.
Frankel, J. A., Romer, D. 1999. Does trade cause growth?, American Economic Review 89(3), 379-399.
Goldberg, P., Khandelwal, A., Pavcnik, N., Topalova, P. 2008. Imported intermediate inputs and domestic product growth: Evidence from india. Working paper, Princeton University, Columbia Business School, Dartmouth College and IMF.
Griffith, R., Huergo, E., Mairesse, J., Peters, B. 2006. Innovation and Productivity Across Four European Countries, Oxford Review of Economic Policy 22(4), 483-498.
Griliches, Z., 1979. Issues in Assessing the Contribution of R&D to Productivity. Bell Journal of Economics 10, 92–116.
Griliches, Z., 1986. Productivity, R&D, and Basic Research at the Firm Level in the 1970s, American Economic Review 76 (1), 141–54.
Griliches, Z., 1980. Returns to Research and Development Expenditures in the Private Sector,” pp. 419-454 in Kendrick, J.W. and Vaccara, B. (Eds.), New Developments in Productivity Measurement, National Bureau of Economic Research, University of Chicago Press, Chicago, 1980.
Griliches, Z., Mairesse, J., 1990. R&D and productivity growth: comparing Japanese and American manufacturing firms. In: Hulten, C. (ED.), Productivity Growth in Japan and the United States, NBER studies in income and wealth, Vol. 53, University of Chicago Press, pp. 317-348.
Grossman, G. M., Helpman, E., 1991. Innovation and Growth in the Global Economy, MIT Press, Cambridge MA
Halpern, L., Koren, M., Szeidl, A. 2009. Imported Inputs and Productivity, CeFiG Working Papers 8, Center for Firms in the Global Economy.
Jaffe, A. B., 1986. Technological Opportunity and Spillovers of R&D: Evidence from Firms' Patents, Profits, and Market Value. American Economic Review 76(5), 984-1001.
Jones, C. I., 2008. Intermediate goods and weak links: A theory of economic development, NBER Working Paper No. 13834, National Bureau of Economic Research, Inc.
Kasahara, H., Rodrigue, J., 2008. Does the use of imported intermediates increase productivity? plant-level evidence, Journal of Development Economics 87(1), 106-118.
Keller, W., 2004. International technology diffusion, Journal of Economic Literature 42(3), 752-782.
19

Klette, T. J., Griliches, Z., 1996. The Inconsistency of Common Scale Estimators When Output Prices Are Unobserved and Engogenous, NBER Working Papers 4026, National Bureau of Economic Research, Inc.
Kremer, M., 1993. The O-ring theory of economic development, Quarterly Journal of Economics 108(3), 551-575.
Krugman, P., 1979. Increasing returns, monopolistic competition, and international trade, Journal of International Economics 9(4), 469-479.
Lawrence, R. Z. and Weinstein, D. E., 1999. Trade and Growth: Import-Led or Export-Led? Evidence From Japan and Korea," NBER Working Papers 7264, National Bureau of Economic Research, Inc.
Levinsohn, J., Petrin, A., 2003. Estimating production functions using inputs to control for unobservables. Review of Economic Studies 70(2), 317–341.
Lucas, R. Jr., 1988. On the Mechanics of Economic Development. Journal of Monetary Economics 22(1), 3–42.
Mairesse, J. and Cunéo, P. 1985. “Recherche-développement et performances des entreprises : une étude économétrique sur données individuelles,” Revue Économique, Programme National Persée 36(5), 1001-1042.
Melitz, M. J., 2003. The impact of trade on intra-industry reallocations and aggregate industry productivity. Econometrica 71(6), 1695–1725.
Muendler, M.A., 2004. Trade, technology, and productivity: a study of Brazilian manufacturers, 1986-1998, CESifo Working Paper Series No. 1148.
Muendler, M.A., 2004. Trade, Technology, and Productivity: A Study of Brazilian Manufacturers, 1986-1998, University of California at San Diego, Economics Working Paper Series 28149, Department of Economics, UC San Diego.
Olley, S., Pakes, A., 1996. The dynamics of productivity in the telecommunications equipment industry, Econometrica 65 (1), 292–332.
Pavcnik, N., 2002. Trade liberalization, exit, and productivity improvements: evidence from Chilean plants. Review of Economic Studies 69 (1), 245–276.
Raut, L. K., 1995. R & D spillover and Productivity Growth: Evidence from Indian Private Firms. Journal of Development Economics, 48(1), 1-23.
Romer, P., 1987. Growth based on increasing returns due to specialization, American Economic Review 77(2), 56-62.
20

Smolny, W., 2000. Endogenous Innovations and Knowledge Spillovers, Heidelberg and New York.
Solow, R.M., 1957. Technical progress and the aggregate production function. Review of Economics and Statistics 39, 312–320.
Van Biesebroeck, J., 2003. Revisiting some productivity debates. NBER Working Paper 10065, National Bureau of Economic Research, Inc.
Wang, J., Tsai, K. 2003 Productivity Growth and R&D Expenditure in Taiwan’s Manufacturing Firms, NBER Working Papers No 9724, National Bureau of Economic Research, Inc.
Appendix
21
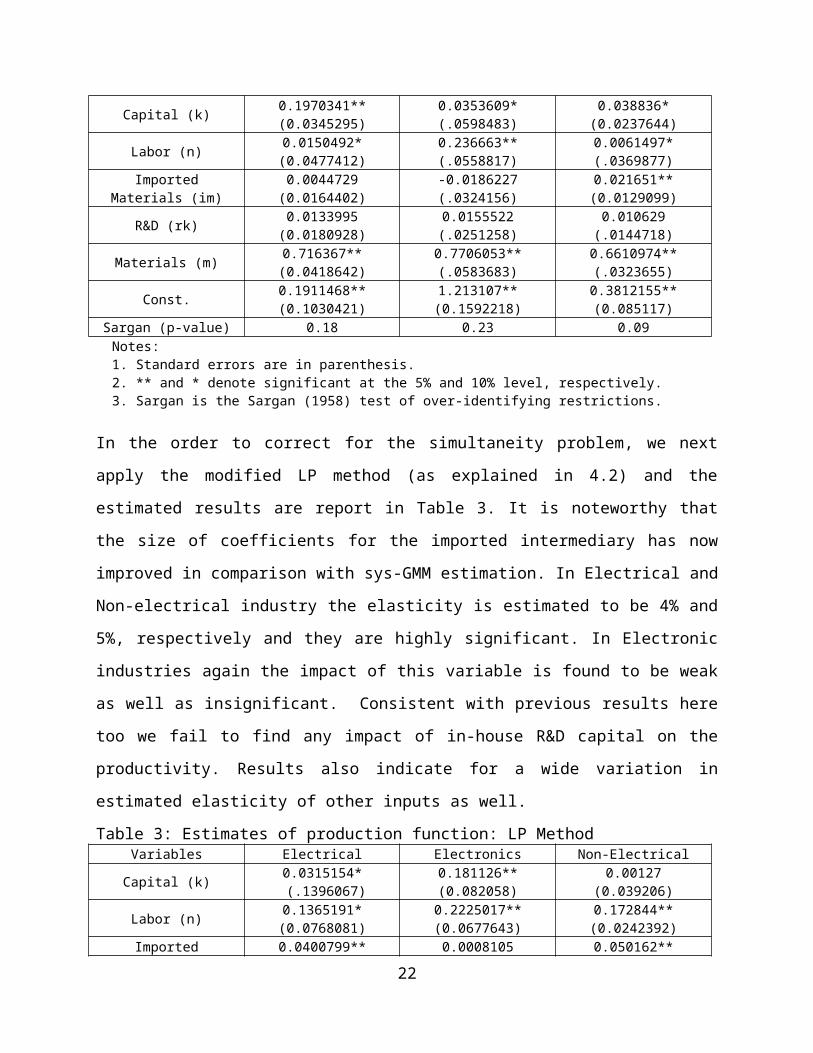
Table A. 1. Peak duty reductions, customs duty collection and import valuesYear Peak duties
(per cent)Customs duty
collections (INR, Million)
Imports(INR, Million)
Customs duty as a percentage of
imports1999-00 40 47,0910 2,15,2370 21.882000-01 38.5 49,0660 2,30,8730 21.252001-02 35 42,2560 2,45,2000 17.232002-03 30 44,6100 2,97,2060 152003-04 25 48,8570 3,59,1080 13.62004-05 20 55,4700 5,01,0650 11.082005-06 15 63,6560 6,60,4090 9.642006-07 12 81,0150 8,40,5060 9.642007-08 10 97,6910 10,12,3120 9.652008-09 10 1,01,7100 13,74,4360 7.4
Source: Economic survey-2009-10 (chap-7, pp-172, http://indiabudget.nic.in/es200910/chapt2010/chapter07.pdf
Table A. 2. Tariff, imports and notional duties in 2008-2009Basic Duty Capital goods Intermediate Goods
Total no. of tariff
lines
Imports(INR,
Million
Notional duty
(INR, Million)
Total no. of tariff lines
Imports(INR,
Million)
Notional duty
(INR, Million)
7.5% or 1079 1,64,1980 383580 3353 8,96,4590 890460Less 10% 334 337450 100820 3429 2,14,8160 641810
Above 10% 15 150 90 738 245910 58420Total 1428 1,97,9740 48,4490 7520 11,35,8606 1,59,0690
Source: Economic survey-2009-10 (chap-7, pp-172, http://indiabudget.nic.in/es200910/chapt2010/chapter07.pdf
Table A.3. Variables Definition and their Source (s), 2000-2009
Variable Definition Data source Output(Q) Industrial sales and Gross value added of firms ProwessGross value added (GVD)
Gross value added of firms Prowess
Labour (N) Number of workers ProwessPhysical capital (K)
Computed as follows:K t=(1−δ ) K t−1+ I t
where K is the capital stock, I is deflated gross investment, and δ is the rate of depreciation taken at 7%.
Prowess and Authors’ calculation
R&D (RD) Annual expenditure on R&D of firms ProwessImported intermediary inputs (IM)
Imported intermediary inputs of firms. Prowess
22

Raw materials(R) Expenditure on raw materials of firms ProwessSize Proxied by Physical capital (K) ProwessTFP Total factor productivity (estimated by value added
method)Authors’ estimation
Labor Productivity (LP)
Output(Q)divided by Labour (N) Prowess and Authors’ calculation
Capital Labor ratio(KN)
Capital (K) divided by Labour (N) Prowess and Authors’ calculation
Note: all series are deflated with appropriate deflator before any econometrics treatment.
Table A. 4. TFP Estimation using value added method
Estimates of production function: LP MethodDependent variable: Gross value added
Variables Electrical Electronics Non-Electrical
Ln(K) 0.2518023(0.1265212)
0.4054239 (.1205553)
0.3266794(0.0367995)
Ln(N) 0.5137311 (0.038732)
0.5456492(0.0510856)
0.3266794(0.0367995)
Wald test 3.78 0.16 13.441. Standard errors are in parenthesis.2. ** and * denote significant at the 5% and 10% level, respectively.3. Wald test is Wald test of constant returns to scale.
Table A. 5. Appendix
Descriptive Statistics on Indian Manufacturing Firms, 2000-2009Mean Standard
Deviation. Minimum Maximum
Electrical Manufacturing lnQ 1.680009 0.8280601 -2.159145 3.75077lnK 1.191061 0.6919384 -0.820011 3.045306lnN 2.285204 0.69529 0.69529 4.033888lnR 1.414774 0.8228378 -2.082814 3.200642TFP 1.013122 0.3528041 0.0995918 3.240328lnIM 0.6865067 0.9595876 0.9595876 3.042615lnRD -0.3632071 0.7569779 0.7569779 1.920906
lnGVA 1.37175 0.8108224 -1.69897 3.796108LP 0.5671659 0.3823772 -4.378668 1.041266KL 0.5154342 0.313055 -0.9409554 4.418177
Electronics ManufacturinglnQ 1.351401 0.995058 -2.034039 3.845397lnK 0.9954211 0.8483159 -1.889778 3.591072lnN 2.12473 0.7938263 -.3684542 4.395881lnR -0.9330774 1.009954 -4.190808 1.559456TFP 0.6334645 0.2259976 .0364906 1.731408lnIM 0.7779548 1.037277 -2 3.341808lnRD -0.1149879 0.9443334 -2 2.386196
lnGVA 1.026984 0.9481932 -2.159145 3.698652LP 0.3840375 1.293154 -14.29298 25.39355KL 0.3744812 1.046504 -15.73373 5.196716
Non-Electrical Machinery Manufacturing
23

lnQ 1.580324 0.8735048 -2.103935 5.037267lnK 1.046852 0.7225934 -1.324855 3.237757lnN 2.363582 0.7643323 -0.3916407 5.037267lnR 1.284801 0.8768178 -1.889778 4.000258TFP 1.371177 0.5944866 0.0873015 4.498017lnIM 0.5700625 0.999707 -2 3.529764lnRD -0.0831359 0.8480057 -2 2.838855
lnGVA 1.327047 0.8613421 -2 4.093714LP 0.4447523 1.14853 -29.23825 2.671072KL 0.3938466 0.4885851 -9.837888 4.607168
24