Embed Size (px)
Citation preview

GEOGRAPHY
GRADE 12
RESEARCH TASK
2018
kn

DBE 2 2018
EDUCATOR GUIDELINES FOR CONDUCTING RESEARCH
THE HYPOTHESIS TESTING APPROACH TO RESEARCH TASKS IN GEOGRAPHY FET
1. The Requirements in the Program of Assessment:
Research Activities Steps Marks Length Time Frame
Formulate the
hypothesis 1 10 Statement
Term 1 (1 to 3 days)
Mapping 2 10 A4 size or smaller
Background information about
the study area (Paragraph)
3 10 Paragraph of EIGHT lines
Data collection 4 10 75 to 100 words
(Photographs/Questionnaires)
Analysis and
synthesis
Representation of data
5 15 300 to 400 words (Graphs/Tables) Term 2
(1 to 3 days) Recommendations and possible solutions
6 10 Structured paragraph(s) of approximately EIGHT lines
Conclusion – ACCEPT/REJECT the hypothesis
7 10 Paragraph of EIGHT lines
Term 3 (1 to 3 days) Bibliography 8 10
Cover page 9 5
Presentation 10 10
Total 100
Submission 9 Due date
2. Choosing a topic for a Geography Research Project (Hypothesis testing):
Isolate topics to specific areas in the Geography CAPS
content, for example:
Climate and Weather: (An analysis of weather data over a longer period)
Geomorphology: (A study of processes and factors influencing flow patterns in
local stream/rivers)
Settlement Geography: (A study of transport patterns in the local community)
Economic Geography: (A study of the local informal sector and its impact on
employment)
DBE 3 2018
GUIDELINES FOR CONDUCTING A GEOGRAPHY RESEARCH
EDUCATOR’S GUIDE
Step 1: Formulating a hypothesis or a geographical statement
As Geographers we seek to understand and explain the interactions between humans, and
between humans and the environment in space and time. This is achieved by asking questions
or making informed geographical decisions on causes, effects and solutions/recommendations
Development of Hypothesis testing in the Geography FET:
The learner has to choose a specific area of study where a geographical
statement can be made.
During this stage a geographical statement is made to ask the following:
WHERE IS IT
WHAT IS IT
HOW OUGHT IT TO BE …
HUMAN IMPACTS …
…THE BIG IDEAS OF CAPS (Empirical Analytical Approach)
The learner should then follow the steps of research to ensure that the
geographical statement is well defined.
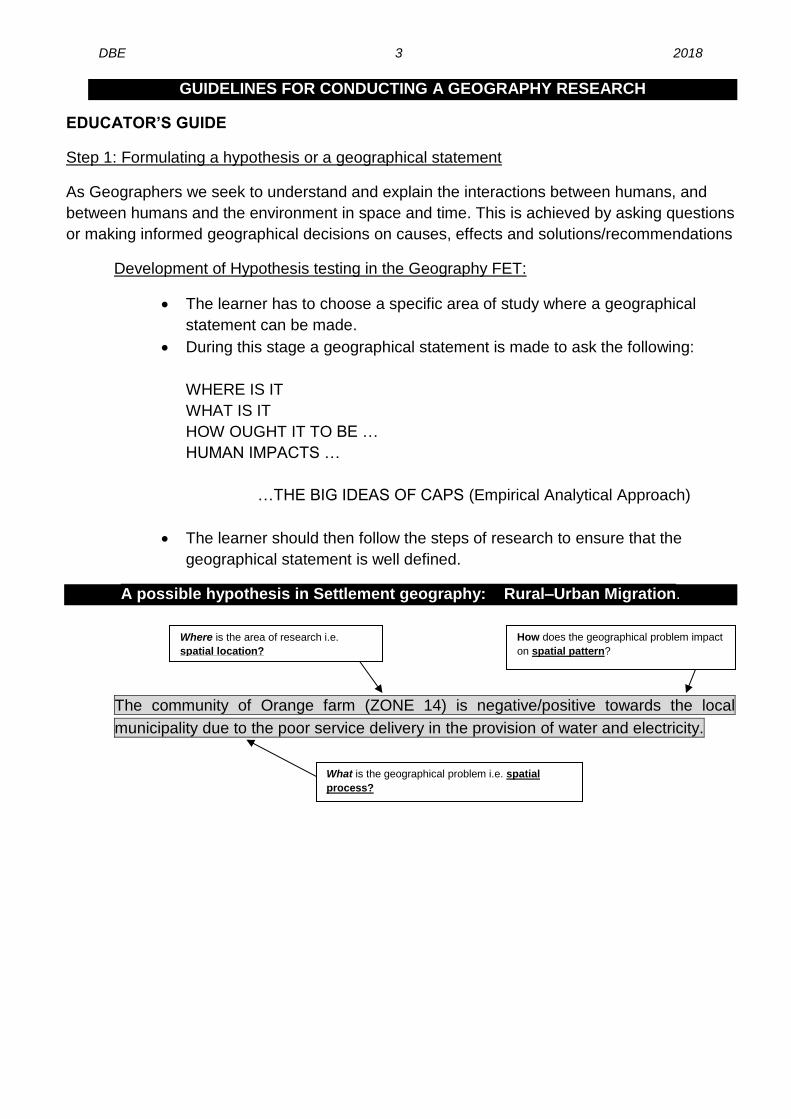
A possible hypothesis in Settlement geography: Rural–Urban Migration.
The community of Orange farm (ZONE 14) is negative/positive towards the local
municipality due to the poor service delivery in the provision of water and electricity.
Where is the area of research i.e.
spatial location?
What is the geographical problem i.e. spatial
process?
How does the geographical problem impact
on spatial pattern?

DBE 4 2018
A possible hypothesis in Geomorphology: Catchment and river management.
The pollution on/in/along the Vaal River is due to the increase in contaminants created
by the Vaal Colliery in the underground water.
Other possible hypothesis type research:
The E-Toll system will impact negatively on the economic position of people
using private transport in Glenvista, south of Johannesburg.
The E-Toll system in the area of the Gilloolys interchange will impact
positively on motorists and traffic flow.
NB: The HYPOTHESIS is a GEOGRAPHICAL STATEMENT (GEOGRAPHICAL
ENQUIRY)
Step 2: Mapping
The learner must provide a map of the area in question.
During this stage the learner has to create a buffer zone around the area
where the geographical problem exists.
The map should have a clear legend/key and must be drawn to scale. The
scale must be indicated on the map.
If the map used covers a wider area, buffer zones around the area of study
should be created.
The map used should be the most recent map of the study area.
Step 3: Background information about an area of study.
Learners need to explain where in South Africa the study area is located.
(This can be indicated on the map)
Description of the study area in terms of its exact position (degrees, minutes
and seconds).
Provide relevant information about the area, for example population of the
area or climate of the area.
Provide media (newspaper/internet/magazine) sources.
Where is the area of research i.e.
spatial location? What is the geographical problem i.e. spatial
process?
How does the geographical problem impact
on spatial pattern?

DBE 5 2018
Step 4: Methods of data collection
(a) PRIMARY DATA SOURCES
The use of questionnaires
Interviews
Observations
Field trips
(b) SECONDARY DATA SOURCES
Newspaper articles
Government department statistics
Books
Internet
Step 5: Analysis and synthesis of data (Data Representation)
Collected data should now be used to formulate a discussion
around the existing geographical problem.
At this stage learners should represent some of the information
graphically where necessary, for example graphs, sketches etc.
Graphic information must be analysed during this stage.
Step 6: Recommendations and possible solutions
Learners should now make recommendations to solve the
geographical problem in question.
Learners should be encouraged to present their original and
realistic opinions as far as they possibly can.
Step 7: Conclusion – ACCEPT OR REJECT the hypothesis.
Learners should now make a decision to either
ACCEPT or REJECT the hypothesis.
Learner to provide reasons for either ACCEPTING or
REJECTING the hypothesis.
Step 8: Bibliography
A comprehensive bibliography should be included.
List web sites in full.
Annexures of questionnaires and interviews conducted should
be included.
Step 9: Submission
Learners are encouraged to include graphs, tables, diagrams
and pictures where necessary.
On submission, ensure that a suitable cover page is included.

DBE 6 2018
EXEMPLAR RESEARCH TASK ONE - GRADE 12
CURRICULUM CONTENT: Urban Decay
Inner city decay in Pretoria central takes ugly turn
TSHWANE - The ongoing decay regarding inner city in Pretoria central, took another turn, with rental agencies placing the blame at the door of the property owners who contracted them to administer the properties, and pocket the monthly rentals. The agencies are accused by tenants of prioritizing the collection of rentals but turning a blind eye to the derelict structures which many families call home in the city centre. “We manage property on behalf of owners, who pay us a commission on the rent received”. Huurkor Agency has a maintenance department which handles all maintenance issues reported by residents,”” However, there are individuals [apartment owners] who do not renovate their property when faults are brought under their attention. Source: ENCA South African cities attract thousands of new residents every year in search of work and a better life. The housing shortage, along with a shortage of housing subsidies, means that for many South Africans there is no alternative but to live in informal housing and shack settlements. The rapid increase of informal settlements around the cities in South Africa has resulted in an increase in crime rates in the inner city. The inner city is a part of the urban settlement that is found in the commercial zone. Inner city problems are a characteristic of old, established cities. In the case of South Africa, cities like Johannesburg, Pretoria, Cape Town, Durban and Port Elizabeth are good examples of urban settlements that experience problems in the inner city.
Compile your research by completing the following activities outlined below:
Step 1: Formulate the hypothesis
Formulate your own hypothesis based on a problem you have identified, e.g. from a
newspaper article/observation/discussion etc.
The lack of INTERVENTION by city authorities on Urban Decay in the Pretoria
CBD has resulted in poor service delivery within the inner city.

DBE 7 2018
NB: Learners must formulate their own hypothesis using the above example.
Step 2: Mapping
Provide a map showing the position of the informal settlement in
relation to the city that you have identified for your research task. (It
is easier to choose your local area as an area of study.
The map should clearly indicate buffer zones where informal
settlements are located.
The map should include areas of the city that are regarded as
crime “hotspots”
The map must have a clear legend/ key.
The scale should be indicated on the map.
Step 3: Background information about the study area
Provide a brief introduction and description (background
information) of the city (study area) you have selected in terms of:
Historical background
Population.
Climate.
Describe the location of informal settlements in relation to the inner
city.
Other relevant statistical information.
Step 4: Data collection
(a) Collect data using at least THREE methods e.g.
questionnaires
interviews
field trips
photographs and maps
Literature research (newspapers, magazines, books etc.)
internet research
Step 5: Analysis and synthesis of data
Analyse the data that you have collected, and formulate a report on
your findings. Support your findings with graphs, photos, etc.
Briefly discuss how the existence of informal settlements
contributes to crime in the inner city.
Briefly discuss the contribution of high unemployment rate in the
informal settlements to crime in the inner city.

DBE 8 2018
Step 6: Recommendations and solutions
Provide suitable recommendations and solutions to the problem
Step 7: Conclusion – ACCEPT/REJECT the hypothesis
Based on your findings in activity five you may either ACCEPT or
REJECT the hypothesis.
Step 8: Bibliography
Provide a bibliography for your research. If you have done any
internet research, you must provide the website that you have used
in full.
Step 9: Submission
Collate all your information.
Include a table of contents.
Ensure that you include a copy of the questionnaire and/or
questions asked in your interviews as annexures.
Design a suitable cover sheet.
Submit your research.

DBE 9 2018
EXEMPLAR RESEARCH TASK 2 - GRADE 12
Curriculum content: Catchment and River Management
THE IMPACT OF HUMAN ACTIVITIES ON RIVERS
Rivers obtain their water from surface run off and ground water of their drainage basin. Activities that take place in the drainage basin affect the quality of water in the river.
Humans impact rivers in many ways. The often flow of harmful substances produced by
humans cause many kinds of changes in rivers and aquatic environment. Often human actions
also change the river flow or the shape of the river bed.
When human settle in the river’s catchment area they usually modify the land surface and
even the river itself, these modifications can impact on the drainage basin in different ways.
The amount of water reaching the river may be considerably reduced.
NB:
Choose the river/stream closest to your school as an area of study AND conduct your
research by following the steps outlined below:
Step 1: Formulate the hypothesis:
Human activities impact negatively on the quality of water and the flow pattern in the
section of the Vaal River passing the town of Parys.
Step 2: Mapping
Provide a map showing the river being studied and the adjacent settlements.
Create a clear buffer zone at the part of the river that is being studied.
The map should have a clear key/legend.
The scale should be indicated on the map.
Step 3: Background information about the river under study
Describe the provincial location of the river.
Climate – particularly the amount of rainfall that is received.
Vegetation
Relief and Topography
Underlying rock structure
Specify the river type: (permanent, periodic, etc.)
Describe the river stage (youth, mature or old age) at your study area.

DBE 10 2018
Step 4: Data collection
Collect data using at least THREE methods e.g.
questionnaires
interviews
field trips
photographs and maps
literature research (newspapers, magazines, books etc.)
internet research
Step 5: Analysis and synthesis of data
Analyse the data that you have collected, and formulate a report on
your findings. Support your findings with graphs, photos, etc.
Using the above sets of data collected determine the extent to
which the river is affected by human activities.
Explain in detail how the identified human activities impact on the
quality of water and the flow pattern of the river.
Step 6: Recommendations and solutions
In your opinion as a researcher what would be the possible
solution(s) to the negative impact caused by human activities in the
river?
Make the long term recommendations to the Government
department(s) leading to the legislature that protects the rivers.
Step 7: Conclusion – ACCEPT/REJECT the hypothesis
Based on your findings in activity five you may either ACCEPT or
REJECT the hypothesis.
Provide reasons for your conclusion.
Step 8: Bibliography
Provide a bibliography for your research. If you have done any
internet research, you must provide the website that you have used
in full.
Step 9: Submission
Collate all your information.
Include a table of contents.
Ensure that you include a copy of the questionnaire and/or
questions asked in your interviews as annexures.
Design a suitable cover sheet.
Submit your research.

DBE 11 2018
RUBRIC FOR RESEARCH TASK
NAME OF LEARNER: ____________________________________________________________ GRADE: ________________
HYPOTHEIS : ____________________________________________________________________________________________ ____________________________________________________________________________________________
MARK 1 2 - 4 5 - 7 8 -9 10 Educator
Mark
Moderator
Mark
Step 1:
Formulation of
hypothesis
Learner has not understood
the formulation of a
hypothesis and has merely
stated a topic.
Learner has formulated the
hypothesis
Not a research topic specific to
Geography Enquiry
Specific area not identified
No specific problem.
No specific impact.
Learner has formulated the
hypothesis
Describes a topic specific to
Geography Enquiry
Geographical area is not
specific.
Problem not specific.
Impact not specific.
Learner has formulated the
hypothesis
Describes a topic specific to
Geography Curriculum.
Geographical area is specific.
Problem is specific.
Impact is specific.
Learner has formulated the
hypothesis
Describes a topic specific to
Geography Curriculum.
Geographical area is
specific.
Problem is specific.
Impact is specific.
MARK 1 2 - 4 5-7 8-9 10 Educator
Mark
Moderator
Mark
Step 2:
Map
Irrelevant map Limited to no information.
Relevant map of Research area included. Limited information No legend. No Scale No Buffer Zones created
Relevant map of Research area included with appropriate legend and limited detail. .
Relevant research area identified
on a map with an appropriate
legend, appropriate labels and
use of scale.
Accurate map used with
appropriate detail showing
accurate details of buffering
and delineation of research
areas with appropriate
information including a
legend and a scale.
MARK 1 2 - 4 5 - 7 8 - 9 10 Educator
Mark
Moderator
Mark
Step 3:
Background information
Unable to give a description or background information of the area being studied in a paragraph
Some description of an area is provided in a paragraph with limited background information given.
Relevant description of an with most of the background information provided in a paragraph
Study area is well motivated and forms part of the local community and a related geographical issue. Learner has fully described the study area in a paragraph and has provided the appropriate background information relevant to the Hypothesis.
Study area is well motivated and forms part of the local community and a related geographical issue Learner has fully described the study area in a paragraph of exactly EIGHT lines and has provided the suitable background information relevant to the Hypothesis.

DBE 12 2018
MARK 1 2 - 4 5 - 7 8 - 9 10 Educator
Mark
Moderator
Mark
Step 4: Data collection
Only one primary or one
secondary source of data is
used.
Primary and secondary sources
of data collected which
inadequately informs research
methodology.
Primary and secondary data
sources that mostly enable an
understanding of the research
area studied.
A variety of primary and
secondary data sources
collected, that accurately define
the hypothesis.
Specific primary and
secondary sources collected
that accurately define the
Hypothesis.
Relevant communication
from related authorities in
the form of letters/emails
etc.
MARK 1 - 3 4 - 6 7 - 9 10 - 12 13 - 15 Educator
Mark
Moderator
Mark
Step 5:
Analysis and
synthesis of data
The learner shows little
understanding of the topic and
is unable to identify, interpret
or show the effects from the
sources used.
Less than 300 words without
appropriate graphical
representation
The learner is able to identify
some of the problems from the
sources but shows limited
understanding of interpretation
and effects.
Between 300 and 400 words.
Graphical information not
relevant to Hypothesis.
The learner is able to identify
and interpret the sources in
most case, but shows limited
ability to show the effects.
Between 300 and 400 words.
Graphical Information relevant
but not interpreted according
to the Hypothesis.
The learner is able to identify the problems and interpret all the
sources and is able to show some insight of the effects.
Between 300 and 400 words Graphical Information relevant
and interpreted according to the Hypothesis
The learner is able to
identify the problems and
interpret all the sources and
is able to provide clear
insight of the effects.
Between 300 and 400 words
used.
Variety of Graphical
Information used relevant
to Hypothesis.
MARK 1 2 - 4 5 - 7 8-9 10 Educator
Mark
Moderator
Mark
Step 6:
Recommendations and solutions
The learner is unable to
provide relevant
recommendations and
solutions to the problem in a
paragraph format
The learner could only provide
some recommendations and
solutions to the problem in a
paragraph format
The learner is able to provide
meaningful recommendations
and solutions to the problem
in a paragraph format.
The learner provides clear insight
into all relevant
recommendations and possible
solutions to the problem in a
paragraph format
The learner provides clear
insight into all relevant
recommendations and
possible solutions to the
problem in a paragraph
format of EIGHT lines
MARK 0 1 - 4 5 6-9 10 Educator
Mark
Moderator
Mark
Step 7:
Conclusion (Accept/Reject)
No conclusion provided with no ACCEPT or REJECT
statement
Conclusion provided but research conducted does not
accept or reject the hypothesis
Conclusion provided with an acceptation or rejection of the
hypothesis.
Conclusion provided with an acceptation or rejection of the
hypothesis. The research conducted provides a framework
for the ACCEPT/REJECT statement
Clear Research methodology using Hypothesis testing techniques. Is able to see
the ACCEPT/REJECT statement with a variety of
sources and findings

DBE 13 2018
MARK 0 1 - 2 - 3 4 - 5 - 6 7 - 8 - 9 10 Educator
Mark
Moderator
Mark
Step 8:
Bibliography
No bibliography provided.
No references used.
Bibliography provided is incomplete.
Sources used are not acknowledged. Poor
understanding in/of the creation and use of a bibliography.
1 to 3 mostly correct references
Limited Bibliography provided but is correctly formatted.
Some sources and materials are referenced accurately.
4 to 6 mostly correct
referenced data.
Bibliography provided in correct format.
Most sources and materials are referenced accurately.
7 to 9 mostly correct referenced
data.
Bibliography provided in the correct format.
Extensive research conducted and bibliography shows insight into research
area. 10 or more correctly referenced sources
MARK 0 1 - 2 3 4 5 Educator
Mark
Moderator
Mark
Step 9
Cover page
No cover page is provided. Cover page is provided with
incomplete details.
Cover page contains all the
required details.
Creative cover page used that
contains elements of research
captured and most of the
relevant information.
Cover Page with all relevant
information including stated
hypothesis and creative
expression of selected area
of study
MARK 0 1-4 5-7 8-9 10 Educator
Mark
Moderator
Mark
Step 10
Presentation
Learner does not present himself on the due date/day of the presentation (No proper medical certificate/reason) for absence given
Learner is unable to present the process followed in identifying the hypothesis and conducting
the research and reaches a state of ACCEPT/REJECT phase
Learner is able to present process in identifying the
hypothesis and conducting the research to reach a state of
ACCEPT/REJECT phase. Is not able to show how
research area is able to benefit the natural and/or social
environment.
Learner is able to present process in identifying the
hypothesis and conducting the research to reach a state of
ACCEPT/REJECT phase. Is able to show how research
area is able to benefit the natural and/or social
environment.
Learner is able to present Hypothesis related to the Geography Curriculum. Traces steps of research processes and is able to
make a logical ACCEPT/REJECT statement. Research is centred around adding value to natural and social environment and is
directly related to the GEOGRAPHY CURRICULUM
Educator
Mark
Moderator
Mark
TOTAL MARK – 100

DBE 14 2018
COMMENTS