Embed Size (px)
Citation preview

© Crown copyright Met Office
Communication of Probability Forecasts for PWSKen MylneEnsemble Forecasting Manager, Met Office, UK
Chair WMO Expert Team on EPS

© Crown copyright Met Office
Outline
• Communication of Probability and Uncertainty
• Why? (1 slide!)
• Some concepts and principals
• Some pitfalls to avoid
• Common misconceptions
• Research on Understanding of Forecasts with Uncertainty Information
• Examples of Presentations

© Crown copyright Met Office
Why Probability Forecasts?

© Crown copyright Met Office
Why? The Effect of Chaos
• Communicating with an audience? Motivate them with a little basic science…
• Up to about 3 days ahead we can usually forecast the general pattern of the weather quite accurately
• Beyond 3 days Chaos becomes a major factor
• Fine details (eg rainfall) have shorter predictability
• The atmosphere is a chaotic system: “… one flap of a seagull’s wing may forever change the future course of the weather”, (Lorenz, 1963)

© Crown copyright Met Office
Communication of Uncertainty

© Crown copyright Met Office
It’s going to rain!
When?Where? How much? Are you sure?
Expressing uncertainty
• Forecasters have always dealt with uncertainty.
…at times…mainly in the NW…up to an inch in places…risk of heavy bursts
• Uncertainty expressed in many ways , mostly subjective.

© Crown copyright Met Office
Probabilities - getting quantitative
How can we improve on subjective description?
People in London have a 50% chance of seeing a light shower this afternoon...
…but in the NW you have an 80% risk of a shower with a 20% chance of over an inch
This is much more informative, but only if the figures are meaningful!

© Crown copyright Met Office
Use of probability forecasts - Clear Definition
What does this mean?
• 30% probability of rain in Florida
• 30% in Orlando?
• 30% somewhere along I-95?
• or 30% “somewhere in Florida”?
• How much?
• A trace? 5mm? Tropical cyclone quantity?!
Probabilities must be unambiguous and relevant to the end user

© Crown copyright Met Office
Clear Definition
Examples of well-defined probability forecasts could be:
• 30% probability of more than 5mm of rain at Orlando Airport between 1200 and 1800.
• 70% probability of wind reaching 40kt in at least one place in Florida on Tuesday.
• 10% probability of wind sufficient to cause severe structural damage in Miami overnight.
The last example shows how a low probability can give useful warning of a serious event
A good test: Can I verify this forecast?

© Crown copyright Met Office
Decision-making with probabilities
Rational decision-making depends on the user’s sensitivity – illustrate with how we respond to low probabilities:
• 5% risk that a plane will crash - would you board it?
• 5% risk of rain – would you play golf?
Decisions must be based on user’s Cost/Loss ratio
• users with low C/L should protect at low probabilities

© Crown copyright Met Office
Probabilities in Context
There’s a 50% prob of snow in London tomorrow
50% ? You mean you don’t know what will happen!
Normally it only snows one day in 50 at this time of year - so 50% is a strong signal.

© Crown copyright Met Office
Some days really are 50%!
• There is nothing wrong with 50% as part of a sequence of forecasts which change from day to day
There’s a 50% prob of rain in Exeter on Thursday
50% ? Rain’s not rare - you really haven’t a clue this time!
No – on this occasion it’s very finely balanced. Yesterday it was 70%, the day before it was 20%. Today the forecast happens to be 50%.

© Crown copyright Met Office
Research on Understanding of Forecasts including UncertaintyThanks to Mark Roulston (ex-Met Office) and Todd Kaplan (University of Exeter)

© Crown copyright Met Office
Methods
• Questionnaire about uncertainty in the 5-day temperature forecast placed on Met Office public website from Tuesday 13th June until Monday 19th June 2006. (1144 external responses).
• Experiments conducted in the experimental economics laboratory at Exeter University to test undergraduates’ understanding of format for 5-day temperature forecasts.

© Crown copyright Met Office
Temperature Uncertainty Questionnaire

© Crown copyright Met Office
Option 1

© Crown copyright Met Office
Option 2

© Crown copyright Met Office
Option 3
© Crown copyright Met Office
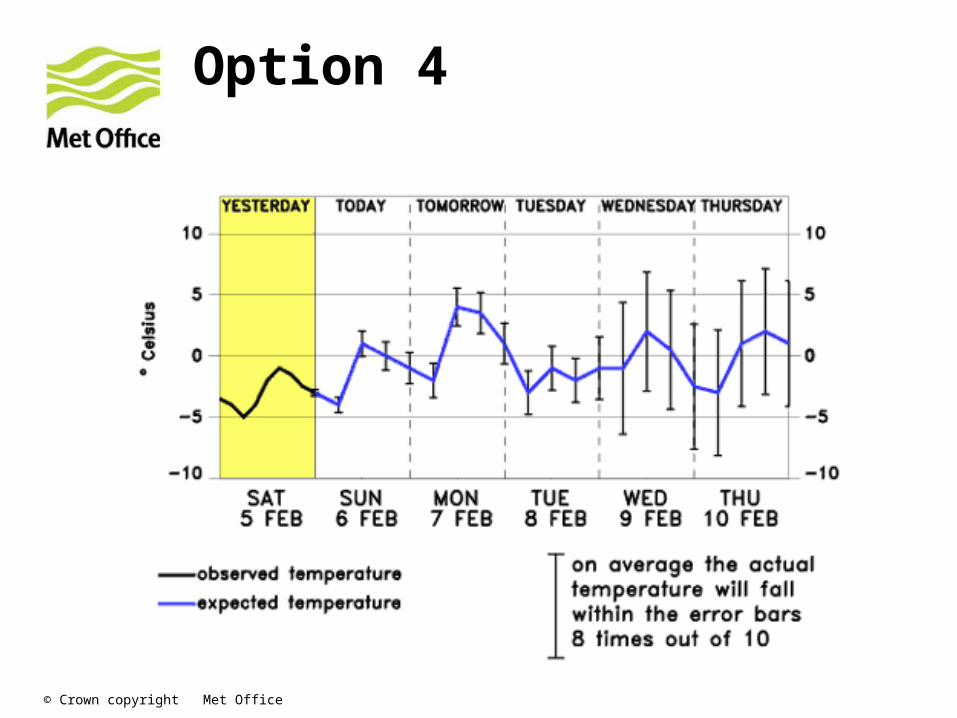
Option 4

© Crown copyright Met Office
Option 5

© Crown copyright Met Office
Most Useful?
23%
9%
8%
2%
49%
9%
Option 1 Option 2 Option 3
Option 4 Option 5 None
Option 1
Option 2
Option 3
Option 4
Option 5

© Crown copyright Met Office
Easiest Format?
32%
10%
6%3%
44%
5%
Option 1 Option 2 Option 3
Option 4 Option 5 None
Option 1
Option 2
Option 3
Option 4
Option 5

© Crown copyright Met Office
Option 5 – design features
Wording in “Natural Frequencies”
•after Gigerenzer
No:
•“Probabilities”
•“Percentiles”
•“Confidence Limits”
Include yesterday’s observations
•Natural reference that user can remember

© Crown copyright Met Office
Temperature Uncertainty Laboratory Experiments

© Crown copyright Met Office
Experimental Design
• Experiments conducted at the Finance and Economics Experimental Economics Laboratory at Exeter University (FEELE) with Todd Kaplan.
• 153 undergraduates at Exeter University participated.
• Students studying business, economics, humanities and sciences/mathematics
• Group A (77) received no uncertainty information.
• Group B (76) received uncertainty information.
Presented with a set of 20 “lotteries”.

© Crown copyright Met Office
Example of a “lottery”Participants asked whether they would rather receive £0.50 (US$1.00) if
A: Temperature at midday on Sunday is below 9ºC
B: Temperature at midday on Monday is below 12ºC
20 questions of this type asked of each group.
GROUP A
GROUP BQuestions in which someone assuming uniform uncertainty would make a different decision to someone with Format B were called “swing” questions.

© Crown copyright Met Office
How did they do?
Group % correct (Format A)
% correct (Format B)
Business/Econ 69.6 85.7
Science/Engr 68.5 85.8
Humanities 66.5 83.8
Male 69.3 85.8
Female 66.8 83.7
Overall 68.5 85.2
Average earnings £7.25
Average earnings £8.48

© Crown copyright Met Office
How long did it take them?Getting faster as the experiment progresses.
Not much difference between groups.

© Crown copyright Met Office
Summary
• Laboratory experiments suggest people are able to correctly interpret uncertainty information.
• Laboratory experiments can be used to objectively evaluate how well people understand forecasts.

© Crown copyright Met Office
Precipitation Uncertainty Web SurveySimilar survey to temperature one. Only conclusion presented here – more details at end if you want to look afterwards.

© Crown copyright Met Office
Two most popular presentations for precipitation

© Crown copyright Met Office
Aspects of Effective CommunicationUse of words and colours

© Crown copyright Met Office
Verbal descriptions of Uncertainty – the IPCC scale
• The IPCC have proposed a Likelihood Scale for communication of climate change predictions:
Virtually Certain >99% probability
Very Likely >90% probability
Likely >66% probability
About as likely as not 33% to 66% probability
Unlikely <33% probability
Very Unlikely <10% probability
Exceptionally Unlikely <1% probability

© Crown copyright Met Office
Verbal descriptions of Uncertainty – an alternative scale
• An alternative scale proposed for general use by WMO:
Extremely Likely >99% probability
Very Likely 90-99% probability
Likely 70-89% probability
Probable – more likely than not 55-69% probability
Equally likely as not 45-54% probability
Possible – less likely than not 30-44% probability
Unlikely 10-29% probability
Very Unlikely 1-9% probability
Extremely Unlikely <1% probability

© Crown copyright Met Office
Misinterpretation of words
• Psychology research shows that many people understand words differently, eg
• Probable
• Possible
• Chance
• People think they understand them, but one person’s understanding is different from another’s
• Increases with cultural difference eg my understanding as British compared to yours as Americans
• Need clear definitions and consistent use

© Crown copyright Met Office
Probs of multiple categories
• Inclusion of probabilities for alternative scenarios can help to communicate that “something else could happen”
• Example from seasonal outlook
• Pie chart is also effective:

© Crown copyright Met Office
Problems with coloursChoose colour scales carefully
• Colours either side of 50% give misleading impression of very small difference in forecast:
• Above/below normal
• Colours at opposite ends of scale very similar
• Revised version:
• Avoids ambiguity

© Crown copyright Met Office
Confidence indices
• Confidence index is easy for users to understand
• Needs care because confidence can be very different for different elements of the forecast, eg.
• Temperature
• Precipitation
• Sunshine

© Crown copyright Met Office
Questions and answers

© Crown copyright Met Office
Precipitation Uncertainty Web SurveyDetails omitted from main presentation.

© Crown copyright Met Office
Methods
• Questionnaire about uncertainty in the 5-day precipitation forecast placed on Met Office public website from 17th January to 9th March (883 external responses).

© Crown copyright Met Office
Option 1

© Crown copyright Met Office
Option 2

© Crown copyright Met Office
Option 3

© Crown copyright Met Office
Option 4

© Crown copyright Met Office
Option 5
© Crown copyright Met Office
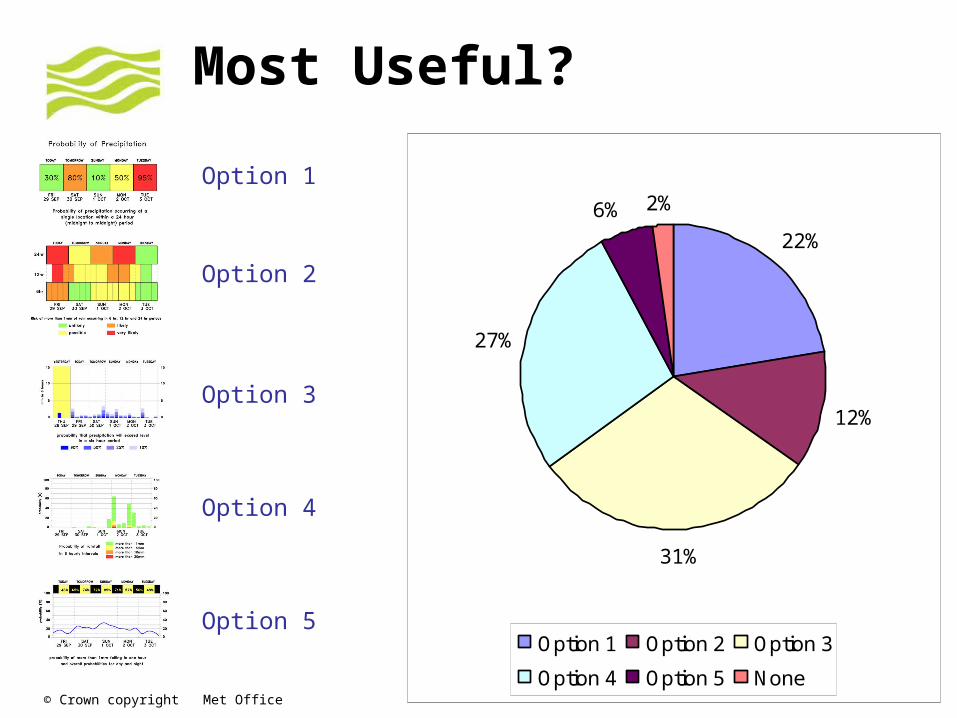
Most Useful?
22%
12%
31%
27%
6% 2%
Option 1 Option 2 Option 3
Option 4 Option 5 None
Option 1
Option 2
Option 3
Option 4
Option 5

© Crown copyright Met Office
Easiest to Understand?
63%5%
16%
9%
4% 3%
Option 1 Option 2 Option 3
Option 4 Option 5 None
Option 1
Option 2
Option 3
Option 4
Option 5

© Crown copyright Met Office
Option 3: Most popular.
“Option 3 is the most intuitively easy format to understand and interpret. It tells you when it's likely to rain and how much is likely to fall at a glance.”
“Format ‘1' is the easiest to interpret quickly but ‘3‘ gives much more information and is also easy to interpret.”
“I favour 3 because the principal information - amount of rain - is seen at a glance, probabilities become apparent on further inspection.”
“The key for format 3 might be better colour coded with red green etc. I like the height of the bar representing amount of rain.”

© Crown copyright Met Office
Option 1: Easiest to understand
“Although I say 1 is easiest to understand that is because it provides least information. I definitely would not want to see that version used.”
“I think ‘1' preferable to the others. The easy and quick to look at format gives the basic information that is needed by most of the public.”
“Are these options mutually exclusive? Could users not be presented with the most simplified option 1 as a default and then request to see the other more complex options according to preference?”
“This would be very useful to display in the Weathercall and Marinecall services and option A seems the clearest and easiest way of expressing the information.”