Embed Size (px)
Citation preview
PEAK-LOAD PRICE^IG IN ELECTRIC POWER H^JDUSTRY
m c m N A
by
AUYANG WAI KEUNG
歐 陽 慧 强
MBA PROJECT REPORT
Presented to
The Graduate School
In Partial Fulfillment
of the Requirements for the Degree of
MASTER OF BUS][NESS ADM^ISTRATION
THREE-YEAR MBA PROGRAMME
THE CH^ESE UNIVERSITY OF HONG KONG
May 1999
The Chinese University o fHong Kong holds the copyright of this project. Any person(s) intending to use a part or whole of the materials in the project in a proposed publication must seek copyright release from the Dean of the Graduate School.

1 1 ‘i
“•'<i — ‘ '* ""'fwX|
^ ^ i - ^ ^ X f _ ‘ \ p ( 2 1 a • j J ^ ^ ^ ^ l m S r f 1肩!
m ^ K A R Y S Y s W y ^ ¾ ¾ ^ ¾ ^
^"**a&vTwwtt*'****''
i
APPROVAL
Name: Au-yang Wai Keung
Degree: Master ofBusiness Administration
Title ofProject: Peak Load Pricing in Electric Power Industry in China
^ ^ T ^ : > " ^ ^ ^ ^ ^ ^ """"^
Professor Dennis Fan
Date Approved: A U ” ^,. f ” f
ii
ABSTRACT
The purpose ofthis MBA Project is to analyze the Peak Load Pricing (PLP) in electric
power industry in China. The analysis will be divided into two parts: theoretical and
practical analysis. The theoretical analysis is based on the economics theory. The focus is
on the PLP. However, the Ramsey pricing and the non-linear pricing would also be
mentioned as an introduction to PLP. One case study would be stated about the PLP
strategy in a city of Guangdong Province, China. What pricing strategy would be used
and how the industry would face the competition in future would be predicted as
conclusion of the study.
iii
TABLE OF CONTENTS
ABSTRACT ii
TABLE OF CONTENTS iii
LIST OF ILLUSTRATIONS v
LIST OF TABLES vi
PREFACE vii
CHAPTER
I. INTRODUCTION 1
Background of Electric Power Industry 2 History of Utilities Pricing 4 Peak-load Pricing 5 Power Generation, Transmission and Distribution 6 Form of Power Generation and Their Cost Structure 7
Nuclear Power 7 Hydropower 8 Thermal Power 9
Load Curve Analysis 11 Summary 12
II METHODOLOGY 14
III EFFICIENCY PRICING 15
Assumption of the Study 15 Overview ofNatural Monopoly 15 Marginal Cost Pricing with Subsidization 17 Deviate from Marginal Cost Pricing 18 Efficiency Pricing Using Linear Pricing 18
Ramsey Pricing 19 Efficiency Pricing Using Nonlinear Pricing 23
Uniform Two-part Tariffs 23
iv
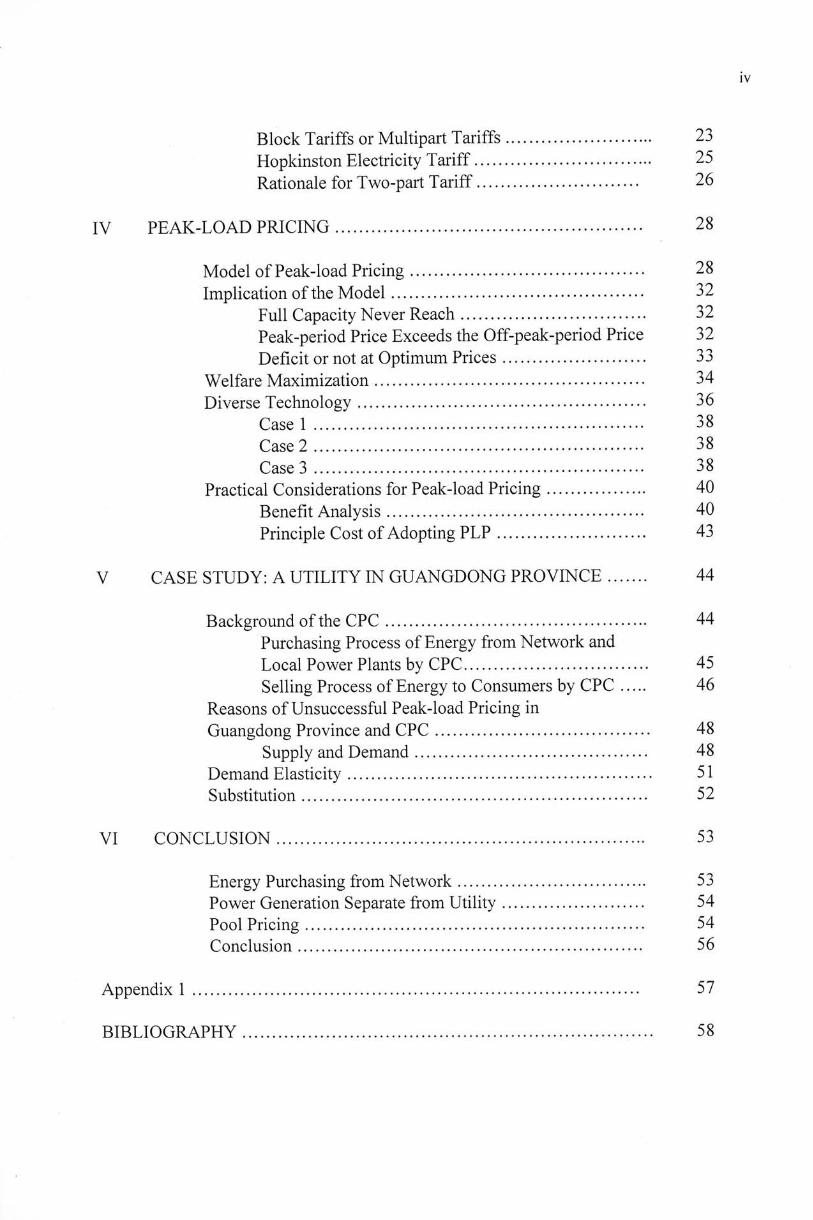
Block Tariffs or Multipart Tariffs 23 Hopkinston Electricity Tariff 25 Rationale for Two-part Tariff 26
IV PEAK-LOAD PRICING 28
Model of Peak-load Pricing 28 Implication of the Model 32
Full Capacity Never Reach 32 Peak-period Price Exceeds the Off-peak-period Price 32 Deficit or not at Optimum Prices 33
Welfare Maximization 34 Diverse Technology 36
Case 1 38 Case2 38 Case 3 38
Practical Considerations for Peak-load Pricing 40 Benefit Analysis 40 Principle Cost of Adopting PLP 43
V CASE STUDY: A UTILITY IN GUANGDONG PROVINCE 44
Background ofthe CPC 44 Purchasing Process of Energy from Network and Local Power Plants by CPC 45 Selling Process of Energy to Consumers by CPC ..... 46
Reasons of Unsuccessful Peak-load Pricing in Guangdong Province and CPC 48
Supply and Demand 48 Demand Elasticity 51 Substitution 52
VI CONCLUSION 53
Energy Purchasing from Network 53 Power Generation Separate from Utility 54 Pool Pricing 54 Conclusion 56
Appendix 1 57
BIBLIOGRAPHY 58

V
LIST OF ILLUSTRATIONS
Figure 1 Typical Load Curve 11
Figure 2 The Monopoly and the Welfare-maximizing Outcomes 17
Figure 3 The Benefit of Peak-load Pricing 41

vi
LIST OF TABLES
Table 1 National Installation and Generation in 1997 1
Table 2 Characteristics of Maj or Type of Power Plants 12
Table 3 Power Plant Capacity and Consumption in
Guangdong Province 49

vii
PREFACE
I would like to express my deepest thanks and appreciation to my
supervisor, Professor Dennis Fan. He has provided a lot ofguidance, advice and mostly
importantly support on this MBA project. The report cannot be better without his inputs.
Ill addition, I would like to thank Mr. Joe Imfeld, Siemens Metering AG,
Mr. Ken Hui, Managing Director of Siemens Metering Ltd.(HK) and Mr. Qi Fucai. They
have given support and information to me during the project preparation.
1
CHAPTER 1
INTRODUCTION
It would be a mistake to view China as one homogeneous region, especially in
economic terms. On the contrary, the diversity of its climate, culture, geography,
demography and development over recent years makes for a wide range of regional
economics. The China's infrastructure is relatively poor especially its electric power
system, transport system, etc. The highly unbalanced nature of industrial growth, with the
coastal provinces leading the way, mean that the economic differences between the
provinces of China are as great as those between east and west Europe.
We can easily assume that the peak-load pricing applied in one province may not
be wise to launch in others. Therefore, the report would introduce different pricing
strategies in electric power industry. We will then focus on the peak-load pricing and
analyze under which situations it would be appropriate. The case study attempts to
illustrate some of the key differences in terms of economic factors and technical factors
due to the regional difference in China.
2
Background of Electric Power Industry
In 1998, the nation's total annual electricity generation was as high as 1,200 TWh
and the total installed generating capacity was up to 266GW\ Both results ranked the
second highest in the worldjust next to USAl
Even China is the second biggest power market, electricity demand is very high.
One reason is that the per capita generating capacity in China is only 0.18kW per person
as against lkW to 2kW^ in most industrialized economies^ In addition, about 80 million
of population are without electric power at all. There is no doubt that significant number
of power plants should be built in order to raise the per capita capacity and to expand the
coverage of the electricity supply.
The ninth five-year plan, covering the period 1996-2000, calls for extra capacity
of 73GW to be added at an annual rate of about 15GW, equivalent to over 8 Daya Bay
Nuclear Power Plant which has 1.8GW power output.
Due to the high growth of the GDP in China especially in coastal provinces like
Guangdong Province, demand for electric power in a number of provinces was far more
than the power company can supply in beginning of 90's. This phenomenon resulted that
some regions of the city had to enforce power outage once, or even twice, a week.
‘Sun Jiaping and Liu Chunsheng, Electric Power Industry in China, 1998, P.25. -International Energy Agency, hitp://www.iea.org 3 China 1997, Business Monitor International Ltd , ISSN 0969-5184,P.142 4 Per capita generating capacity in Hong Kong is 1.6kW.
3
Shenzhen, China, was one of the examples. In order to secure the continuous power
supply, the consumers were willing to install their own power generators at their cost. In
Hong Kong, there would never be the case. A power interruption in Hong Kong or other
developed counties would be challenged by the consumers and the press!
In order to bridge the gap between supply and demand, the simplest solution is to
build more power plants to suit the consumers need. However, this is not the best solution
if no other measure is considered. This approach would end up with an expensive electric
power for two reasons.
For one reason, electric power demand is not constant over days, weeks, months
and even years. In Hong Kong, the power consumption in a hot summer at the peak could
be more than double (or even more) of a winter time. The power companies (utilities)
should install numerous power plants to meet all the demand at the peak load. However,
quite a big proportion of the power generators is used for very short time of a year. The
utilization of some generator is rather low. The investment on the equipment would
finally transfer to the customers' bill indeed.
For another, building a new thermal power plant of medium size, such as
2x350MW, would cost about 600MUSD'. Most importantly, it needs at least three to four
5 China 1998, Business Monitor International Ltd., ISSN 0969-5184,P.222
4
years from planning to commission. To meet the dramatic growth of the electric power
need in China during 90s, it is not a good choice.
For these two reasons, the demand for electric power should be estimated in four
to five years advance. Overestimate would lead to a high idle time in the power plants.
Underestimate could not meet the consumers demand.
Even the power plants are built according to the growth of the country, the peak
load should be shredded so as to minimize the gap between the highest load and the base
load. Peak Load Pricing should also be launched at the same time.
PLP has been introduced since late 70s and early 80s in USA. Economics made a
lot of study in how the PLP can be applied to the monopoly business like electric power
industry. This report would focus on the economic analysis ofPLP. The advantage of
launching PLP over uniform pricing would be analyzed. Some elementary mathematical
calculations would be introduced to illustrate the fundamental supply and demand theory.
The case study would focus on what factors affect the successful ofPLP.
History of Utilities Pricing
Uniform pricing has been adopted by the utility for many decades. It is the easiest
way ofbilling the customers. A simple energy meter can be used to measure the energy
consumption.

5
However, uniform pricing encourage the customers to use the energy in an
unplanned manner. It creates the peak load at the middle of the day during the week day.
During the mid-night, half of the generators should be turned off because the load is too
low to sustain a stable network. In order to maximize the utilization of the resource and
the equipment, the introduction of PLP would reduce the different between peak load and
the base load.
Peak Load Pricing (PLP)/ Time ofUse Tariff
In China, PLP^ starts from 80s. At present, some provinces in China are applying
the PLP to the large consumers. However, some regions like Guangdong province do not
succeed in launching this policy due to various reasons.
The concept of PLP is that, instead of charging at uniform rate, the unit price of
energy (in kWh) is charged at different rate at different time. For example, the current
tariff structure commonly used in China is that PLP starts at 7:00am till 11 :OOpm. The
rest of the time is off peak. This rule applies to some bulk consumers only. The reason is
that the bulk consumers account the major part of the utilities revenue and the energy
consumption usually can be shifted.
For domestic consumers, they cover a limited proportion of the utilities revenue.
Their energy consumption pattern can hardly be changed. Even it is shifted, it does not
provide a significant reduction of the peak.
6
Power Generation. Transmission And Distribution
In order to produce electricity, three basic processes are required. They are
generation, transmission and distribution. Generation is the process of converting energy
from one form, such as thermal energy, into another form, i.e. electricity.
Power generation is performed in a large scale and centralized fashion so as to
achieve the best economic and technical performance. The capacity per unit is ranged
from a few hundred Megawatt (MW) to a thousand Megawatt.
The transmission consists of sending energy from one end, the power plant, to the
other end, the consumers by the transmission line at high voltage. The high voltage
network ensure that the power loss on the transmission line is minimum. In China, the
transmission voltages are 500kV, 330kV, 220kV, 110kV and 66kV. The energy can be
sent at reasonable cost at higher voltage for long distance. On the contrast, the capital cost
would be higher for high voltage equipment.
After transmission, the power should be distributed to the consumer at lower
voltage. The distribution voltage is lOkV or 220V.
6 PLP is called as Time o fUse Tariff in China.

7
Form of Power Generation and Their Cost Structure
There are three major kinds of power generations. They are: thermal power,
hydropower and nuclear power. Each kind of power generation has their own
characteristics. This has to match with the local resource. So each province in China will
have different mix of energy generation. Table 1 summarizes the installation and
generation mixture from different kind of generation sources in 1997.
Table 1
National Installation and Generation in 1997^
National Installed Capacity National Electricity Generation
GW Percentage Increase over TWh Percentage of Increase over of total previous year total previous year
1997 total 254.238 100 7.5 1134.20 100 5.1
Hydropower 59.730 23.5 7.5 194.57 17.1 4.1
Thermal Power 192.408 75.7 7.6 925.22 81.6 5.4
Nuclear Power 2.1 0.8 0 14.42 1.3 12.4
Nuclear Power
The nuclear power is the cheapest form of power generation in terms of
investment and operating cost. However, it is a rather new technology to China. There are
only two nuclear power plant in China. They are Qinshan Nuclear Power Plant (300MW)
in Zhejiang Province and Daya Bay Nuclear Power Plant (1800MW) in Guangdong
7 Sun Jiaping and Liu Chunsheng, Electric Power Industry in China, 1998, P.20.
7
Province. The former is a trail project by Chinese scientists while the latter is based on
the sophisticated French technology.
Nuclear power is operating in non-stop manner. It does not affect by seasonal
factor like hydropower. It is used to cover the base load and operated 24-hour a
day, 7 days a week, except force outage and regular maintenance. The reason is that the
starting and stopping of the nuclear reactor cost a lot of money. Hence, the generator
should be running all the time to optimize the cost.
Hydropower
Hydropower is another form of cheap energy source. The operating cost is even
lower than the nuclear power. The reason is obvious. The water is the natural resource at
free of charge. Once the water damp is opened, the water flow through the generator.
Electric power is produced. The only significant operating cost is the maintenance cost
and the capital cost.
Why is the hydropower encounter only 23.5% of installed capacity? It is because
of geographical location of hydro resource. Hydro resource is most rich in Yunnan
Province and Fujian Province. The hydropower covers their total capacity of 66.78% and
57.62%'respectively in 1997.
8 Sun Jiaping and Liu Chunsheng, Electric Power Industry in China, 1998, P.20.

9
Another barrier is the high capital investment among all other kind of energy
generation. To build a hydropower, the power plant is built on the river that is in between
the mountains. A very high civil work cost would be incurred. The construction period of
hydropower is the longest. It is ranged from 6 to 7 years on average due to tremendous
civil work. Three Gorges Project even takes 17 years to build 26 generators of700MW
each from 1993 to 2009'.
Thermal Power
The thermal power is the lowest capital investment but highest operating cost
form of energy generation. It is divided into three major types: gas turbine, coal fire
generator and oil fire generator.
Gas Turbine
The gas turbine is burning light oil. The operating cost is the highest among all
kind of power generation. The advantage of gas turbine is its inherit feature of quick
starting. The principle of gas turbine is the same as aircraft or car engine. Once the start
button is pushed, it is ready in seconds. The gas turbine is the ideal solution to cover the
peak load that comes in short notice.
9 China 1997, Business Monitor International Ltd, ISSN 0969-5184,P.145
10
Coal Fire Power Plant
The coal fire power plant in China is the majority of the power resource. In
Shandong and Shanxi Province, the coal is so rich that hydropower is nearly non-exist.
The electricity supply relys on the coal fire power plants.
Heavy Oil Power Plant
Due to the oil crisis in 70s, very few countries heavily rely on the heavy oil power
plant. On the one hand, it is not cheap. On the other, the supply can be fluctuated a lot. In
China, only 65TWh'^ out ofl079TWh electricity was generated through these plants in
1996.
'° International Energy Agency, hitp://wWvv.iea.org
11
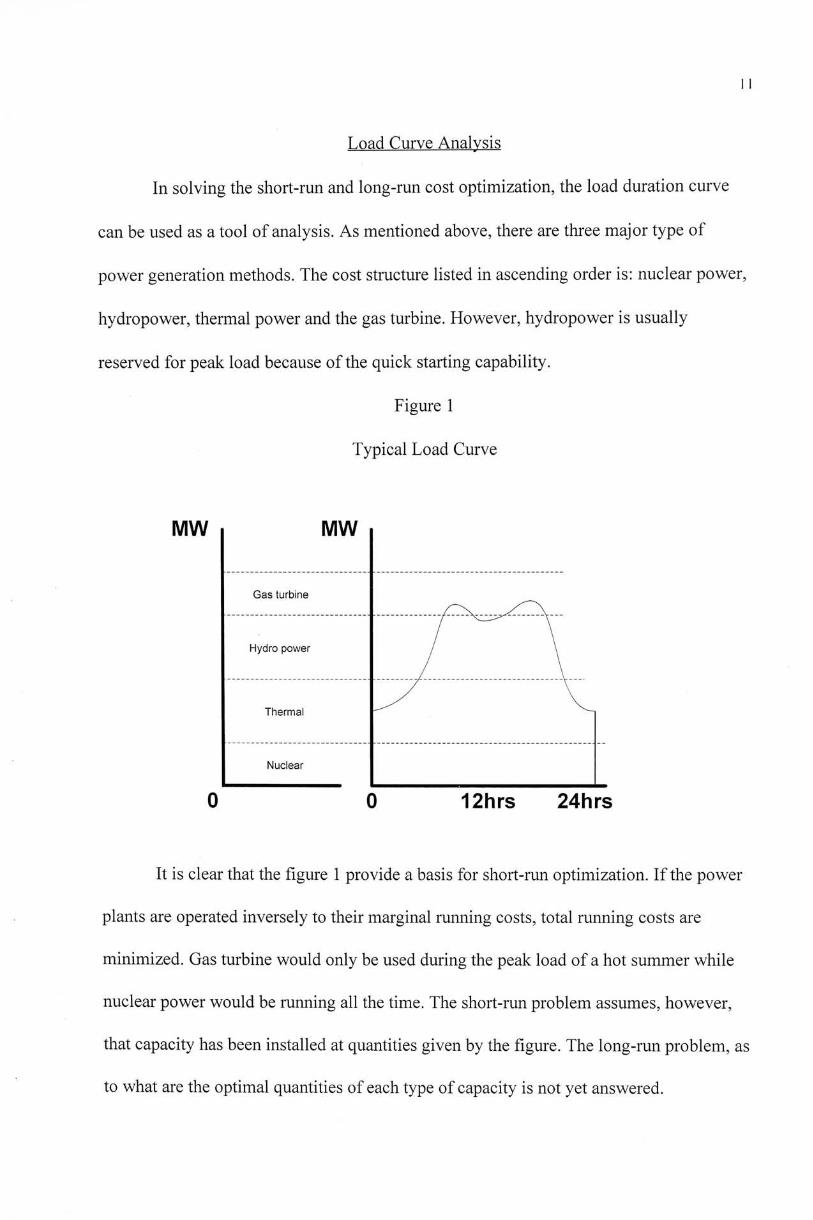
Load Curve Analysis
In solving the short-run and long-run cost optimization, the load duration curve
can be used as a tool of analysis. As mentioned above, there are three major type of
power generation methods. The cost structure listed in ascending order is: nuclear power,
hydropower, thermal power and the gas turbine. However, hydropower is usually
reserved for peak load because of the quick starting capability.
Figure 1
Typical Load Curve
MW MW
Gas turbine
— — — — n Hydro power / \
: y V Thermal ^ ^
Nuclear
0 0 12hrs 24hrs It is clear that the figure 1 provide a basis for short-run optimization. If the power
plants are operated inversely to their marginal running costs, total running costs are
minimized. Gas turbine would only be used during the peak load of a hot summer while
nuclear power would be running all the time. The short-run problem assumes, however,
that capacity has been installed at quantities given by the figure. The long-run problem, as
to what are the optimal quantities of each type of capacity is not yet answered.
12
Summary
Thus, with a choice of plant types as described above, the power companies,
utilities, can select different combination to achieve the cost optimization based on the
previous consumption pattern or load forecast. In view of the fact that electricity is not
economically storable" and the demand fluctuates periodically and stochastically, utilities
faces the peak load problem. To meet consumers' demand, the minimum operating cost is
needed that the power generators are operated in ascending order of running costs. As
demand raise, the next higher running cost generators are bought into operation.
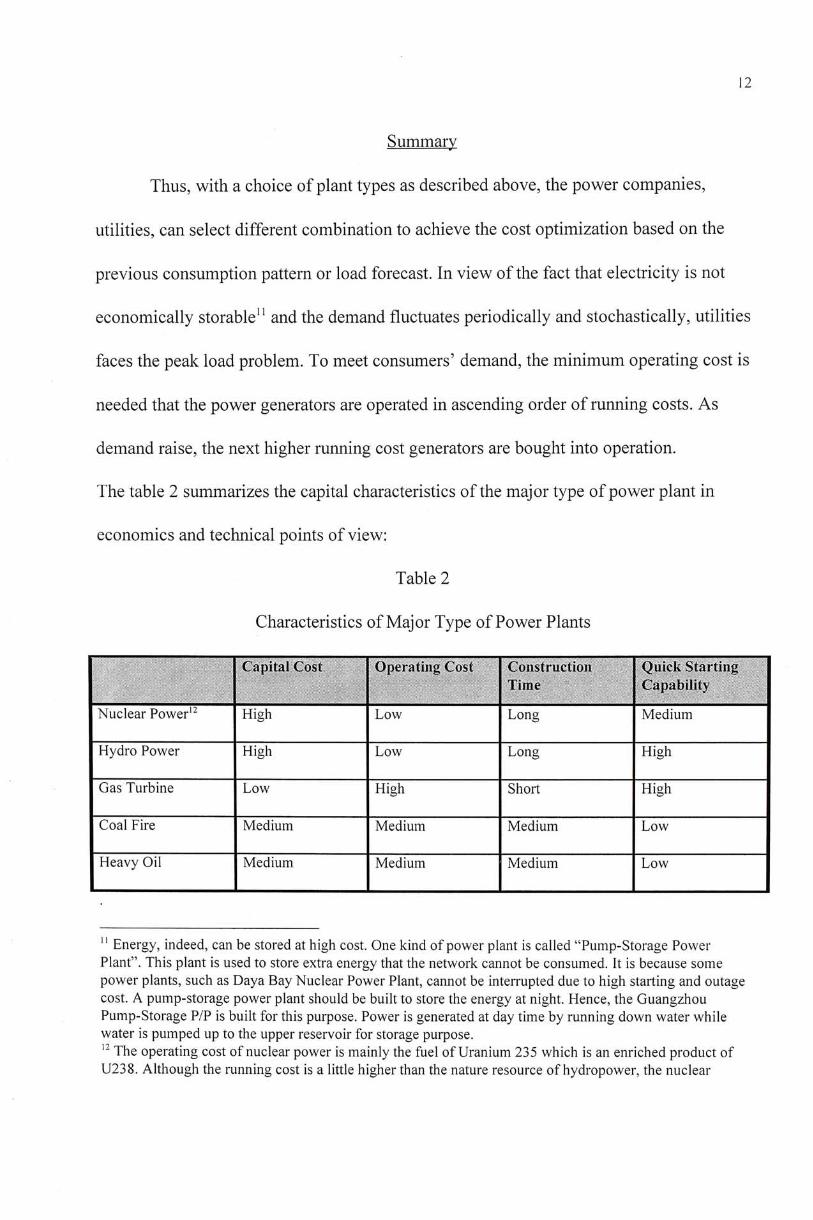
The table 2 summarizes the capital characteristics of the major type of power plant in
economics and technical points of view:
Table 2
Characteristics ofMajor Type of Power Plants
Capital Cost Operating Cost Construction Quick Starting Tiine Capability
Nuclear Power'^ High Low Long Medium
Hydro Power High Low Long High
Gas Turbine Low High Short High
Coal Fire Medium Medium Medium Low
Heavy Oil Medium Medium Medium Low
‘‘Energy, indeed, can be stored at high cost. One kind of power plant is called "Pump-Storage Power Plant". This plant is used to store extra energy that the network cannot be consumed. It is because some power plants, such as Daya Bay Nuclear Power Plant, cannot be interrupted due to high starting and outage cost. A pump-storage power plant should be built to store the energy at night. Hence, the Guangzhou Pump-Storage P/P is built for this purpose. Power is generated at day time by running down water while water is pumped up to the upper reservoir for storage purpose. 12 The operating cost of nuclear power is mainly the fuel of Uranium 235 which is an enriched product of U238. Although the running cost is a little higher than the nature resource ofhydropower, the nuclear

13
power should operate in 24-hour a day, 7-day a week so as to achieve the best efficiency. Hence, nuclear power has higher priority to run as a base load than hydropower
14
CHAPTER II
METHODOLOGY
The electricity pricing in China has been a controversial topic. Very few studies
have been focused in the PLP in electric power industry of China. Hence, the study is
combined with the theory from westem economists and the Chinese utility operators'
experience. Two major parts are formed in the study. They are the theoretical approach
and case study.
The major source of information of theoretical approach is from the related paper,
text book and the statistical sources from books and wet sites. The discussion starts with
the efficient pricing like Ramsey pricing, nonlinear pricing, and followed by the PLP.
The introduction of Ramsey pricing and nonlinear pricing provide a theoretical
foundation ofPLP. The PLP discussion is set out the basic peak-load model as originated
by Boiteux (1949) and Steiner (1957), and developed by Hirshleifer (1958) and
Williamson(1966).
On the other hand, case study is based on the information collected from
interview. This part provides a solid ground for the effect ofPLP strategy used by the
Guangdong Provincial Electric Power Company. The utility experience is the useful
source ofinformation for the transformation of uniform pricing to PLP. The driving force
behind the PLP can also be found out.
15
CHAPTER III
EFFICIENCY PRICING
Assumption of the Study
Throughout the study, the utility being studied is assumed to be a strong natural
monopoly so that the marginal cost pricing of all output will create a deficit. In addition,
we assume that the utility own both the power plants and the transmission network^^
Therefore, from an efficiency view point, cost minimization requires that the utility is the
only firm in the market or markets it serves. In fact, this is true for China on Provincial
level.
Overview ofNatural Monopoly
Utility is one kind of natural monopoly. By studying the supply and demand
behavior, the consumer surplus and supplier profit, or equivalent to society's welfare, can
be measured.
Take the sum of consumer surplus, CS and supplier profit, n, as the measure of
society's welfare. Assuming a single, linear price structure, the welfare maximizing
' ' S o m e counties have forced the utilities to sell or operate independently the power plants
16
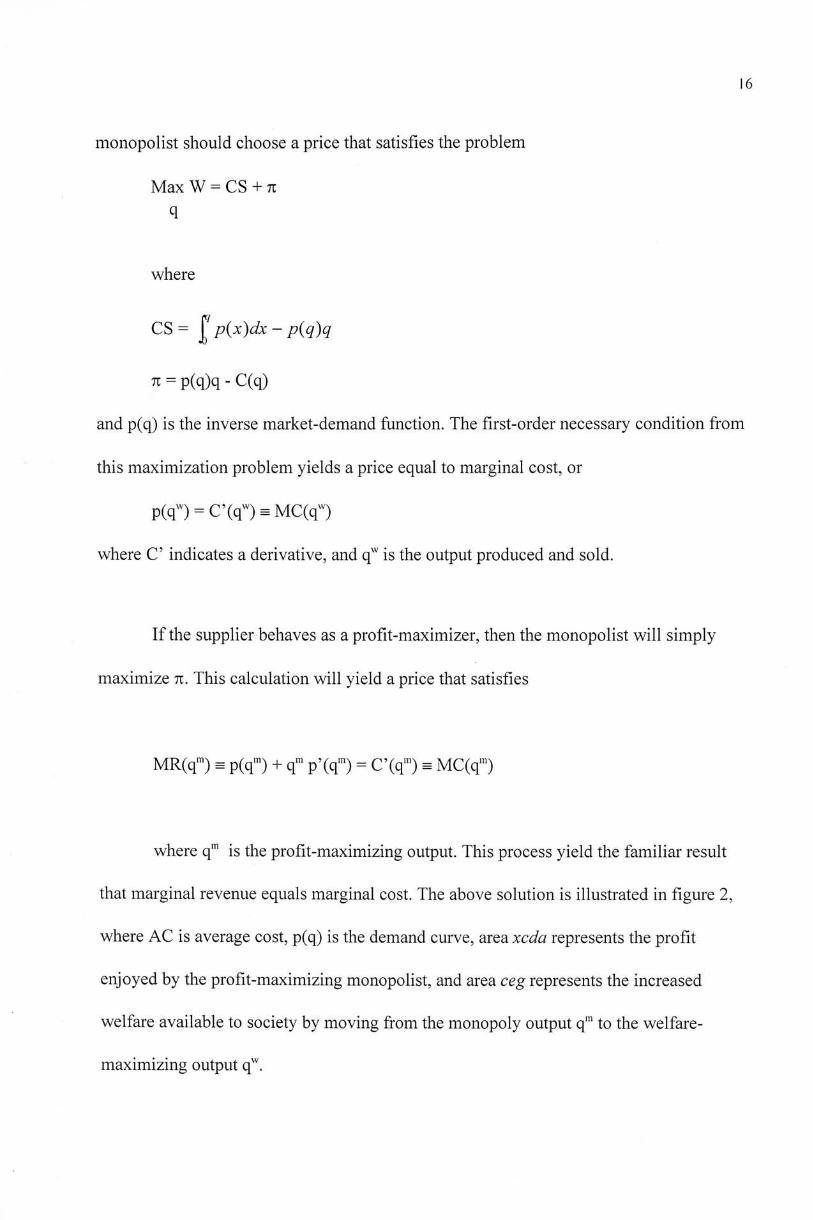
monopolist should choose a price that satisfies the problem
Max W = CS + 7T q
where
rr/ CS = p{x)dx - p{q)q
J3
71 二 p(q)q - C(q)
and p(q) is the inverse market-demand function. The first-order necessary condition from
this maximization problem yields a price equal to marginal cost, or
p(qw) = C,(qw) ^ MC(qW)
where C' indicates a derivative, and q^ is the output produced and sold.
If the supplier behaves as a profit-maximizer, then the monopolist will simply
maximize n. This calculation will yield a price that satisfies
MR(q")三 p(qm) + q™ p'(q") = C'(q") ^ MC(q")
where q'" is the profit-maximizing output. This process yield the familiar result
that marginal revenue equals marginal cost. The above solution is illustrated in figure 2,
where AC is average cost, p(q) is the demand curve, area xcda represents the profit
enjoyed by the profit-maximizing monopolist, and area ceg represents the increased
welfare available to society by moving from the monopoly output q™ to the welfare-
maximizing output qW.
17
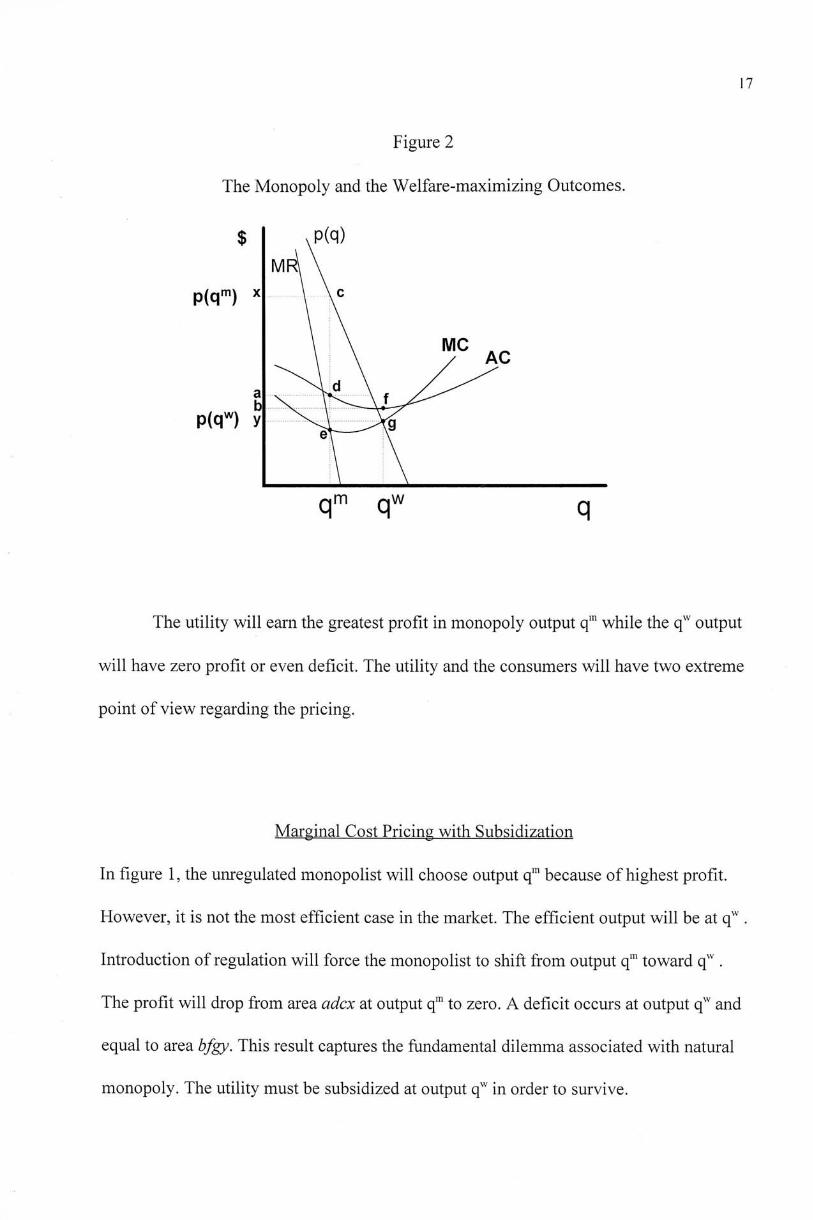
Figure 2
The Monopoly and the Welfare-maximizing Outcomes.
$ \P(q) M R \ \
P(qm) X \ V
『: ;|X 。 P(qw) y ^ ^ : ^ 5 ^
^3 q m q ^ q
The utility will earn the greatest profit in monopoly output q'" while the q^ output
will have zero profit or even deficit. The utility and the consumers will have two extreme
point of view regarding the pricing.
Marginal Cost Pricing with Subsidization
In figure 1, the unregulated monopolist will choose output q" because ofhighest profit.
However, it is not the most efficient case in the market. The efficient output will be at q^ .
Introduction of regulation will force the monopolist to shift from output q'" toward q^ .
The profit will drop from area adcx at output q™ to zero. A deficit occurs at output q^ and
equal to area bfgy. This result captures the fundamental dilemma associated with natural
monopoly. The utility must be subsidized at output q^ in order to survive.
18
Deviate from Marginal Cost Pricing
An alternative to subsidization is to deviate from marginal cost pricing so that the profit
of utility is guaranteed non-negative. There are two major way of doing by using: linear
pricing or non-linear pricing.
If a single linear price structure is applied, the simplest solution is to set the price
at average cost. This solution lead to the output in between q'" and q^. Hence, this output
is not the most efficient but without deficit.
The utility can also be requested by the regulator to launch the nonlinear pricing structure
that would maintain certain efficiency properties while allowing the utility to be
financially solvent. These nonlinear price structures are discussed in details in next few
sections.
Efficiency Pricing UsingLinear Pricing
The marginal-cost pricing implies that inefficiency arises when the value
consumers place on an addition unit of the product is deviated from the opportunity cost
of producing that extra unit. Price regulation in utility can lead to allocative inefficiencies
because some consumers pay at the price different from marginal cost. Regulators face a
problem in how to minimize the misallocations associated with pricing constraints
because both underconsumption and overconsumption involve deadweight losses.
In this section, regulation takes the form of maximizing social welfare subject to
breakeven constraint with a linear pricing system. The first mathematical treatment was

19
developed by Ramsey (1927) who used a consumer surplus analysis in a seminal paper on
taxation. The second best prices often are referred to Ramsey Prices^^.
Ramsey Prices
We derive the simplest version of Ramsey prices by assuming that there is only
one strong natural monopolist and demands are independent of one another.
As discussed on P.15, marginal-cost pricing results in deficit for strong natural
monopolist. The utility should deviate from the marginal cost in order to survive. The
question is how big the deviation is. How can the utility determinate the pricing
structure? Note that the prices are not necessary raised equally. According to Ramsey,
they can be raised in inverse proportional to the absolute value of the demand elasticities
in each market. This minimizes the welfare losses associated with higher prices. A simple
form of Ramsey prices can be developed as follows.
Consider output q = (qi, ... , q„) with a cost function C(q),
the inverse demand function of q goods are Pi(q;), i= 1, ... ,n
assume both C(q) and pj(q;) are differentiable and cross-elasticities of demand are zero,
jt// CSi= J^ Pi(x) dx^ -p;(q) q^
for i = 1, ... , n, and profit for the firm is
/;
冗=X Pi(q) ^i - C(q) /=1
14 The first best prices is marginal-cost pricing
20
If the welfare is to be maximized,
W = ^ CSi + 7i
the prices will be equal to marginal cost. A deficit will be introduced in the strong
monopoly. To eliminate the deficit, a constraint of profit Tc' is added. For a single product
natural monopoly, such a constraint will yield the trivial solution that price is set to
average cost.
Multiproduct natural monopoly
In order to maximize the welfare subject to this break-even constraint, forming a
Lagrangian expression,
max L = W + X (71 - 71') q
where X is a Lagrange multiplier. The partially differentiating ofL with respect to q; is
5 m q, =pfy) -MCi(q) + \ W q ) + qiPi'(q) _ MC.(q)] = 0
where primes denote derivatives, and MCj(q) =5 C(q)/b q^, the marginal cost of q;.
Rearrange this equation,
b/W-MCi(q)](l+X) = -A.AYWX
and then dividing both sides by p (q^ and (1+入)yields
Ui(ai) - ^C-M = • Pi(q^ 1+X (1)
where e;= p-,(q)/[仏 Pi'(q)]< 0, the elasticity of demand in market i.
21
The price in market i, Pi(qj), which maximize total surplus subject to a break even
constraint are often called the Ramsey price. The meaning behind is that the percentage
deviation of price from marginal cost in the 产 market should be inversely proportional to
the absolute value of demand elasticity in the 产 market. A special case which is unlike is
that all elasticities of demand are equal, then prices will be proportional to marginal costs.
From equation (1), and for all markets, the percentage deviation of price from marginal
cost, times the price elasticity, sometimes called the Ramsey number, is equal to -
X/(l+A
The intuition behind this result is straightforward. If cost and demand parameters
yield a X that is very small, the Ramsey number approaches zero, implying that prices
will be very close to marginal cost. That means the deficit under efficient pricing is small.
Reducing profit by one dollar and recalculation prices will not increase welfare
significantly.
On the other hand, if the X is large (say equal to 10), the Ramsey number is close
to unity. It is possible when an unregulated monopolist barely breaks even. Reducing
profit by one dollar will increase welfare by approximately 10 dollars. The price-cost
deviations are so big that significant welfare improvements are feasible if a subsidy can
be transferred to the utility to compensate for reduced profit.

22
The Ramsey prices can be further extended to the case where demands are not
independent and where marginal costs are not constant. However, the analysis becomes
more complicated that the simplicity of Ramsey pricing is lost. The Ramsey prices,
indeed, provide a ground for the non-linear pricing and Peak Load Pricing.
23
Efficient Pricing Using
Nonlinear Prices
In previous sections, we focus on a strong natural monopoly with linear price
structure to achieve the welfare and efficiency maximization. Now this constraint is
relaxed by considering nonlinear pricing. We start with the most straightforward and
widely studied nonlinear pricing method: the uniform two-part tariff.
Uniform Two-part Tariff
The uniform two-part tariff consists of a constant price for each unit purchased, p,
and an access (entry) fee, t, for the privilege of purchasing any positive quantity. Thus,
the total charge to a consumer purchasing q units is
pq + t
Uniform two-part tariffs and other, more complicated nonlinear tariff exist in
utilities. An electricity consumer has to pay for the fix standing charge in addition to the
per unit energy, kWh,used.
Block Tariffs or Multipart Tariffs
Utilities often move one step ahead to adopt the block tariffs. There are two major
kind ofblock tariffs: Declining Block Tariffs and Inverted Block Tariffs.
24
Declining block tariffs
Some electric utilities have used declining block tariffs where marginal price paid
decreases in step ofblocks when the consumed units increased. In mathematical terms,
this concept can be expressed as,
i f O < q < q i , tar i ff=t + piQ
if qi < q < q2, tariff= t + p,q, + P2(q-q1)
H-1 if qn-i < q < q.P tariff= t + PiQi+ Z Pi(qi-qi-i) + Pn (q-q,i-i), for n>3
i=2
The cost-recovery method involves a declining block tariff where p„.i > p,,.
Inverted block tariffs
As the name suggested, the inverted block tariffs have the same structure as the
declining block tariffs but the unit rate of each block is increasing. That means in
mathematical terms, the formula is the same as above except p„_i < p„.
The inverted block tariffs are attempted to aid the low-income demanders who
consume relatively small quantities of electricity. These rate have been labeled lifeline
rates to reflect the view that basic needs are being met. However, the benefits will be
spread without discrimination across population.
The utilities in Hong Kong, both China Light & Power (CLP) and Hongkong
Electric Company (HEC), adopt the inverted block tariff in domestic customers group
25
because of energy conservation. The latest domestic tariff structure of CLP is enclosed in
Appendix 1.
Hopkinston Electricity Tariff
In 1892, Hopkinston electricity tariff distinguished between costs that were
dependent on consumption and costs that were not directly related to consumption but
capacity. The tariff structure associated with Hopkinson priced consumption of energy
(measured in kilowatt-hours, kWh) and maximum instantaneous demand over a certain
period (measured in kilowatt, kW or using more advance technique in kVA) separately.
The consumers have to pay for the unit of energy used in kWh. In addition, the
average demand in every 15 minutes'^ is recorded monthly. Only the highest values of the
demand is billed by the utility. The idea behind is that the consumers are charged not only
on the unit used but also the capacity that utility should be installed for the same
customers.
15 Most European countries is using 15 minutes block while Hong Kong is 30 minutes.
26
For example, bulk tariff customers of CLP has the following tariff structure
(ignore the Peak Load Pricing):
demand charge: $64/kVA
energy charge: $0.68/kWh
If the consumption is 30,000kWh and max. demand is 90kVA, the bill would be
billing value = 30,000 x 0.68 + 90 x 64 = $26,160
The average unit rate can be regarded as
average unit rate = $26,160/30,000 = $0,872
Rationale for Two-part Tariff
Ramsey prices can maximize the total welfare of the society by setting the price at
marginal costs plus markup. By using nonlinear price, two-part tariff, the welfare can also
be maximized.
We can set price equal to marginal cost and then the deficit is covered by the
access fee ofthe tariff. The access fee acts as the lump-sum tax in the first-best solution.
Tariff become nonlinear in the sense that the consumer is paying more than marginal cost
for inframarginal units due to the access fee. If all consumers have to pay the access fee,
this two-part tariff solution work as good as the first-best solution because only the
marginal units produced are sold at marginal cost.
The access fee can be calculated by dividing the deficit created at marginal cost
pricing by the numbers of consumers. However, some consumers who are willing to pay

27
at marginal cost, or even some price higher than marginal cost, may still be forced out of
the market because the access fee exceeds their remaining consumer surplus. Their gain
from two-part tariff will be negative. This phenomenon means that the optimum price, on
the one hand, might be higher than marginal cost price in order to capture these
consumers. Access fee, on the other, can be lowered to attract the consumers back into
the market. To explore the balance between price and access fee, not only the price
elasticity should be considered in the expressions but also the elasticity that reveal the
sensitivity of market participation to prices and access fees.
28
CHAPTER IV
PEAK-LOAD PRICING
The utilities often face two characteristics that further complicate optimum pricing
strategies: the cyclical demand and non-storability.
The electricity demand always depends on seasons, temperature, time of the day,
certain bulk consumers' consumption pattern, etc. Electric energy can hardly be stored in
economic way. Electricity is generated when there is demand.
The utilities have the dilemma: Should the peak demand be met? If so, the excess
capacity during off-peak would be a big burden to utilities. The following section would
present a simple model of peak-load pricing and followed by how the diverse technology
related to peak-load pricing.
Model of Peak-Load Pricing
The following model based on the framework introduced by Mohring (1970) and
Panzar (1976). Both authors examine the peak-load problem in a welfare-maximization
framework.
Assume that the utilities experience a peak-load problem. Demand varies over a
given time period and the energy produced is non-storable. For simplicity, two equal time
29
periods are used. The market demands in these periods are given by Qj(p), j 二 1, 2, where
P 二(Pi, P2, P3) is a vector of prices that includes the prices for the firm's two outputs, p,
and p2, and the price of a composite good, p3. Period 1 is peak period while peak 2 is off-
peak.
Qi(Pi, P2, P3) ^ Q2(P1, P2, P3) for all Pj > 0 and Pi< P2
Thus, demand for the utilities output in period 1, peak, is never less than period 2, off-
peak. The restriction to two equal-length time periods can easily be extended to more
periods of unequal lengths.
The general welfare function which should be maximize:
W(U^ .. •, U') where U' is the consumer i in utility, i =1, ..., s.
To maximize the welfare, the utility must choose the level of inputs used in its
production process as well as linear output prices in both period. In addition, income
redistribution will be required to ensure an actual increase in welfare when maximizing.
To effect this redistribution, the regulator chooses one lump-sum transfers, t, for each
consumer.
Assume consumer i, i= 1, . ..,s, behaves a utility function which has the first and
second differentiable, continuously and strictly quasi-concave characteristics,
UXqi q2', q3O
where q/ is the 产 consumer's consumption of the / � g o o d , j=l, 2, 3.

30
The consumer is a price-taker in all three markets, with a budget constraint given
by
y - t ' = p iq / + p2 q2'+ q3i (2)
where 寸 is income, is the lump-sum transfer, and the price of the composite good
is 1. Differentiate (5.7) with respect to pj and p2 and sum it over all consumers i, i= 1,. . . ,
s to obtain
Qj + PiQij + P2Q2j + Q3j = o j = 1,2
The utility employs one variable input in each period, L� , j = 1, 2 and a fixed input
for both period, K. Whereas the amount K is the full capacity of all power plants. The
utility is a price-taker in the input markets, paying b per unit variable input and p per unit
of fixed input. Setting up the welfare maximization problem,
max. W(U', ...,Us) Pj, t\ Lj, K j = 1, 2 ; i = 1, ..., s
subject to
bL1+bL2 + pK + Q 3 < Y = J yi, (3) /=i
Q, ^ f(Lj, K) j = l , 2 (4)
Pj, t', Lj, K, Qj, i, Yj > 0, j = 1, 2: i = 1, ...,s
Constraint (3) requires that total expenditures do not exceed total income, (4)
requires that consumption in each period do not exceed the utility's output in each period

31
given by the production function f(Lj, K). Differentiate the above equality with respect to
pj, t', Lj and K. By combining with the above conditions, the results are
Pi f'L = b, P2 f \ 二 b,
and
P1fV + P2f 'L-P
Note that the unconstrained welfare maximizing utility not facing cyclic demands
will set price equal to marginal cost, which is equivalent to employing each input until
the value of the marginal products equals their prices, or pf[ 二 b and pf^ = P. With a peak-
load problem, the utility still uses the variable input in this manner; however, the fixed
input is employed until the sum of the value of marginal products over both periods is
equal to the fixed input's price. This is because the fixed input is utilized in both periods
and contributes to output and value in both periods.
Ifthe utility consider to employ one more unit o fK at a cost of P, then additional
output and value are generated in both periods. It is the sum of these margianl-value
products that must be weighed against the marginal cost of p. The fixed input is similar to
a public good that it is available in all periods at no additional cost. In general, for m time
periods, we have
III
E f V / f Y - p / b
7=1
The cost of employing an additional unit of the variable input is confined to a
single period. However, the cost of employing an additional unit of fixed input is spread
32
over all periods. Consequently, marginal cost can vary across periods, implying that
optimum prices should be time-dependent as well.
Implication of the Model
We now derive several implications from this model that will be useful in analysis
the alternative production technologies in the next sections.
Full Capacity Never Reach
Given that the fixed input K. The full capacity is defined as
max.f(Lj, K) Lj • •
The necessary condition for a maximum is f^ = 0, which cannot be zero for all j
and L. Hence, maximum capacity is never reached.
Peak-period Price Exceeds the Off-peak-period Price
Note that p! f ^ = b = p2 f \ . Thus, a higher price in one period implies a lower
marginal product in that period, which in turns implies higher output in that period by
diminishing marginal productivity. This result is obvious that meeting the demands of
peak-period consumers is the cause of the larger capacity that lies idle during off-peak
periods.
Compared with a single price in both periods, the prices derived here provide
consumers with the appropriate signals. The higher peak price suppresses peak demand.

33
The lower off-peak price encourage the consumption. Hence, the idle capacity in off-peak
can be minimized.
Deficit or not at Optimum Prices
Finally, will the optimum prices mn into a deficit? Write total revenue minus total
cost as
Profit = (piQi + P2Q2) - (bLi + bL2 + PK)
substituting the optimum prices results and yields
Profit = pi[fi - fV Li - fV K] + p2[f2 - f \ L, - f \ K] (5)
Total revenue will be greater than, equal to, or less than total cost as the
equation(5) is positive, zero or negative. If the production function is homogeneous of
degree 1, then the bracketed terms are zero and costs are exactly met. In this case, we
have constant returns to scale, and we obtain the not very surprising result that marginal-
cost pricing allows the utility to break-even.
Alternatively, ifthe utility production function is homogenous of degree greater
than 1, the bracketed terms are negative, and the utility runs a deficit. The peak-load
problem does not change the deficit problem associated with marginal-cost pricing.
34
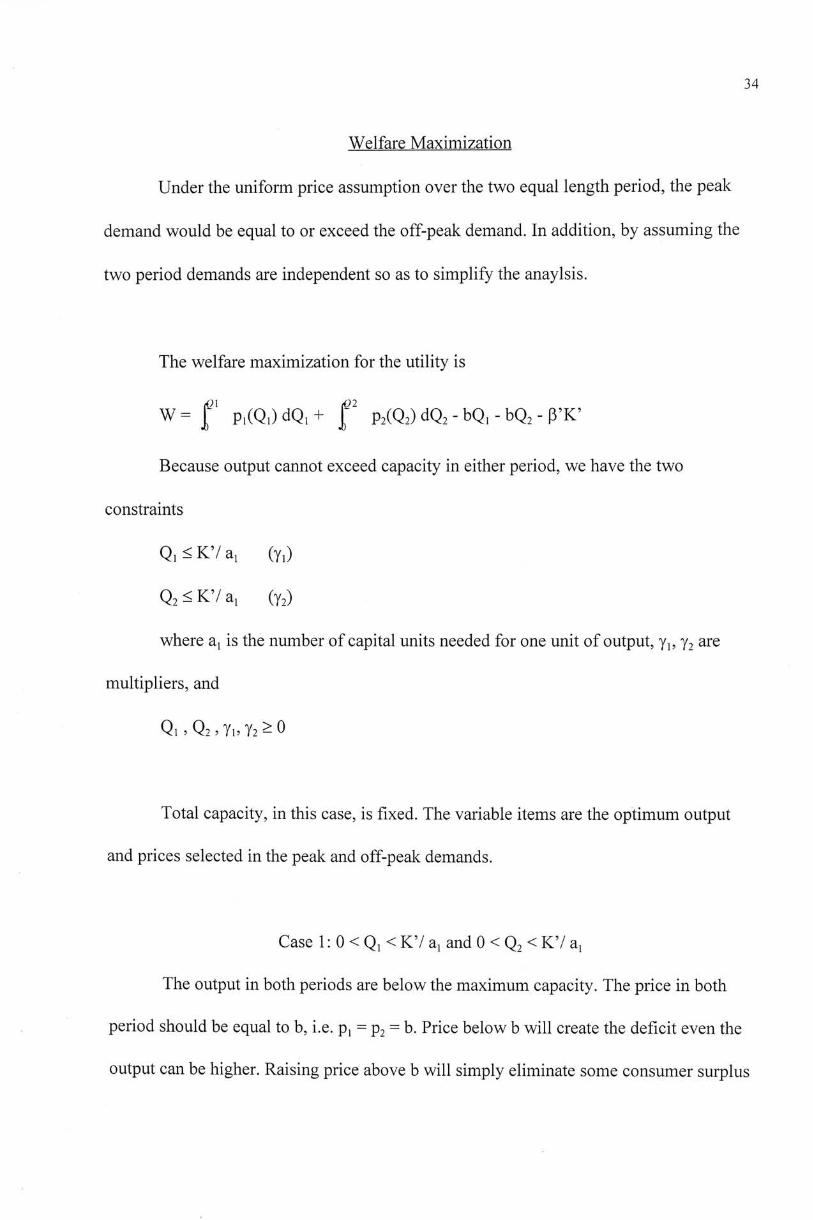
Welfare Maximization
Under the uniform price assumption over the two equal length period, the peak
demand would be equal to or exceed the off-peak demand. In addition, by assuming the
two period demands are independent so as to simplify the anaylsis.
The welfare maximization for the utility is
W = f p,(Q,) dQ, + f P2(Q2) dQ2 - bQi - bQ, - P'K' •0 Ji)
Because output cannot exceed capacity in either period, we have the two
constraints
Qi ^ KV ai (Yi)
Q2 么 KV ai (y,)
where a! is the number of capital units needed for one unit of output, y , 丫2 are
multipliers, and
Q1,Q2,Y1,Y22O
Total capacity, in this case, is fixed. The variable items are the optimum output
and prices selected in the peak and off-peak demands.
Case 1: 0 < Qi < KV a! and 0 < Q2 < KV a,
The output in both periods are below the maximum capacity. The price in both
period should be equal to b, i.e. p! = P2 = b. Price below b will create the deficit even the
output can be higher. Raising price above b will simply eliminate some consumer surplus
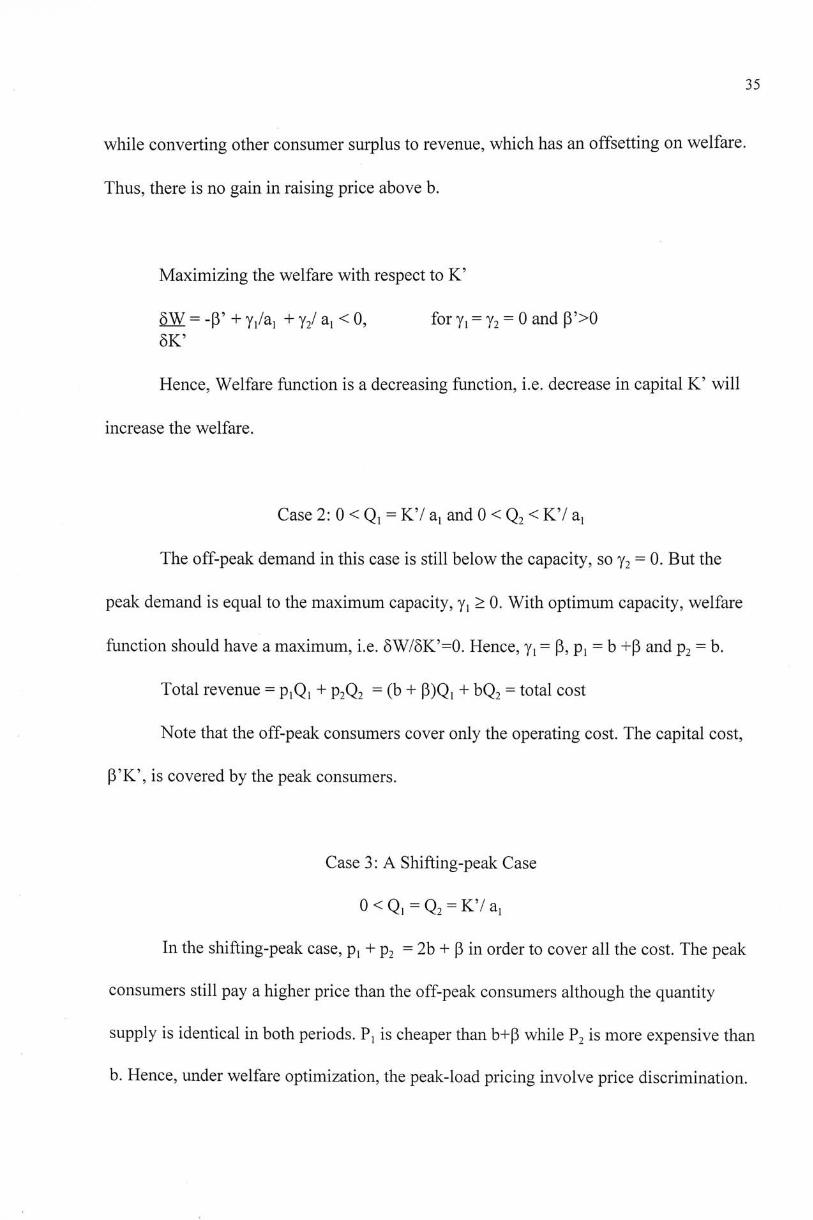
35
while converting other consumer surplus to revenue, which has an offsetting on welfare.
Thus, there is no gain in raising price above b.
Maximizing the welfare with respect to K'
5W = -p, + Yi/a�+ y ai < 0, for y, = y = 0 and P'>0 5K'
Hence, Welfare function is a decreasing function, i.e. decrease in capital K' will
increase the welfare.
Case 2: 0 < Q! = K,/ a! and 0 < Q2 < K7 a!
The off-peak demand in this case is still below the capacity, so y2 = 0. But the
peak demand is equal to the maximum capacity, y, > 0. With optimum capacity, welfare
function should have a maximum, i.e. 5W/5K'=0. Hence, Yi = P, Pi = b +p and P2 = b.
Total revenue = p^Qj + P2Q2 = (b + P)Qj + bQ2 = total cost
Note that the off-peak consumers cover only the operating cost. The capital cost,
P'K', is covered by the peak consumers.
Case 3: A Shifting-peak Case
0 < Qi = Q2 = K7 ai
In the shifting-peak case, p! + p: = 2b + P in order to cover all the cost. The peak
consumers still pay a higher price than the off-peak consumers although the quantity
supply is identical in both periods. P! is cheaper than b+P while P2 is more expensive than
b. Hence, under welfare optimization, the peak-load pricing involve price discrimination.

36
Unlike in case 2 that only the peak consumers pay for the capital cost, both peak
and off-peak consumer pay for part of the capital cost in shifting peak case. Note that
there is no precise rule for allocating capacity costs between peak and off-peak. The
prices depend on the relative strength of these demand. If peak demand increases relative
to off-peak demand, peak consumers have to pay bigger portion of capacity cost than off-
peak consumers.
To determinate if the market is a firm or shifting peak case, not only the demand
in each period but also the size of capacity cost is crucial. If the capacity costs are
relatively large, any failure to utilize capacity fully is expensive. It encourages better
utilization of a switch-over to shifting peak case. If the capacity cost is decreased, there is
little incentive to the consumers to shift the consumption from peak to off-peak. Hence, it
is a firm peak case.
Diverse Technology
Suppose a utility has three major production technologies available for (1) peak
load, (2) intermediate load and (3) base load. Base load is usually covered by coal fire
thermal power plant or nuclear power plant. Intermediate load can be provided by
hydropower or oil-burning plant. The peak load demand should be supplied by the gas
turbine which has the quick start capability. These power plants combination are based on
the fact that all resources, like coal, nuclear, are easily available in this region. Otherwise,
the combination may vary across location.

37
The distinction between the three is in the capacity and operating cost. Capacity
cost refers to the cost of power plant which cost structure mainly depends on the size or
megawatt output, MW. The operating cost refers to the cost of generating a unit of
energy, kWh or MWh. The relation between the power and energy is defined as: f
energy = P{t)dt J)
Suppose the capacity of the power plant is 300MW. The energy output over one
hour is 300MWh.
If the availability is 95% over the year, this plant will generate output
output 二 300MWh X 24 x 365 x 0.95 = 2,496,600MWh or 2,496.6 GWh
Let Pi and bj be the unit capacity cost for a kilowatt for a year using technique i,
i=l, 2,3. All these technologies can be utilized if b! > b � > b3 and p! < P2 < P3.
Suppose there is a new technology that does not fit in these patterns, it can be
discarded from efficiency point of viewi6. Thus, the base-load technique entails high
capacity cost and low operating costs. Reverse is true for peak-load generators. The
intermediate load falls between these extremes.
These concepts can be illustrated by marginal cost technique. The marginal cost
of using techniques i is
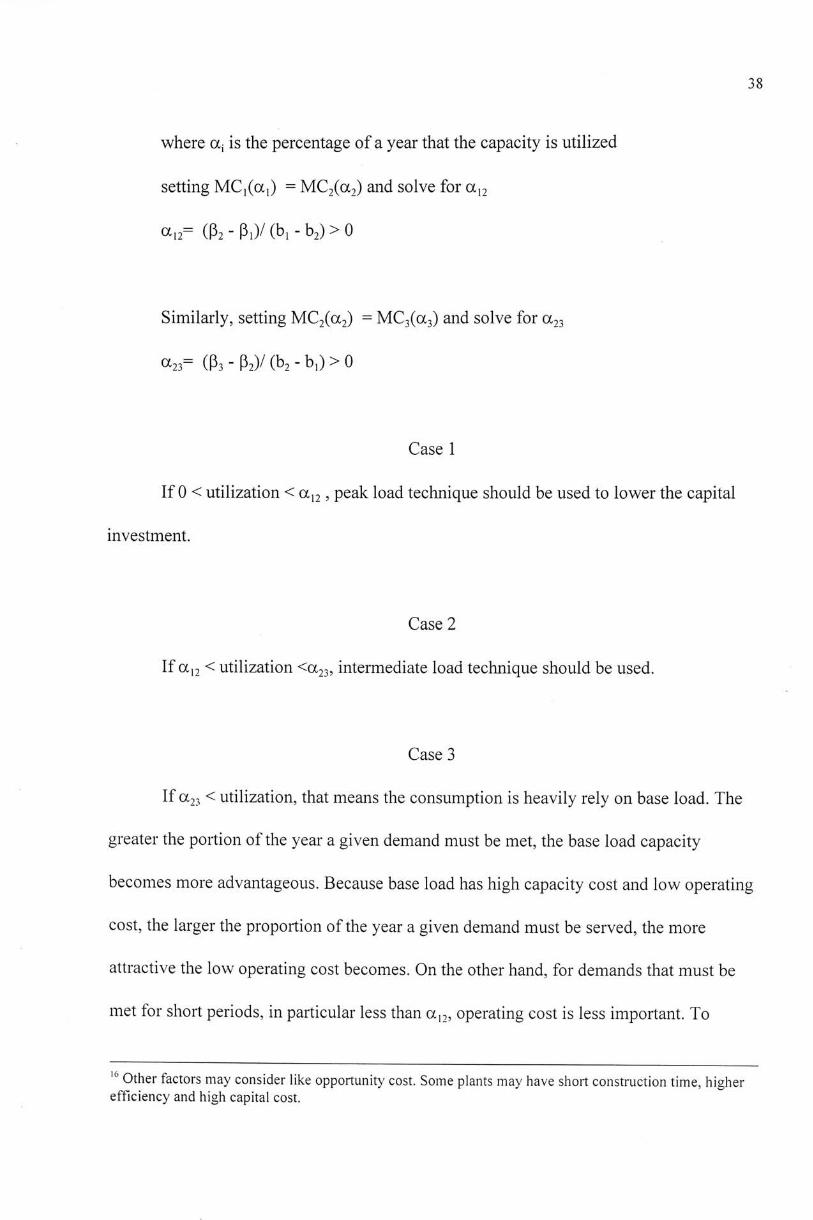
MCi(ai) = ajb, + Pi
38
where a; is the percentage of a year that the capacity is utilized
setting MCi(ai) = MC2(oC2) and solve for 0 2
(½= ( f c - P i ) / ( b i - b , ) > 0
Similarly, setting MC2(oc2) = MC3(oc3) and solve for 0C23
a23- (Ps - P2)/ (b2 - bi) > 0
Case 1
IfO < utilization < �, p e a k load technique should be used to lower the capital
investment.
Case 2
Ifa12 < utilization <oC23, intermediate load technique should be used.
Case 3
Ifa,3 < utilization, that means the consumption is heavily rely on base load. The
greater the portion of the year a given demand must be met, the base load capacity
becomes more advantageous. Because base load has high capacity cost and low operating
cost, the larger the proportion of the year a given demand must be served, the more
attractive the low operating cost becomes. On the other hand, for demands that must be
met for short periods, in particular less than a,2, operating cost is less important. To
16 Other factors may consider like opportunity cost. Some plants may have short construction time, higher efficiency and high capital cost.

39
determine the utilization, a load forecast or survey has to be done. It is always a hardjob
to find the exact figures as the demands are influenced by many uncontrollable factors.

40
Practical Considerations for
Peak-load Pricing
The peak-load pricing in electric power industry has been increasingly popular for
decades. The energy crisis in 70's led to a greater public awareness of the potential for
energy shortages and the need to allocate existing supplies efficiently. On the one hand,
the utility attempts to reduce the use of oil and to increase the use of other resource such
as coal or nuclear in generate electricity. On the other hand, the utility consider to launch
the peak load pricing in order to shed the peak so that the base load can be increased. The
result of increase of base load is the reduction of peak load which has higher total cost. It
is mainly because the idle time of peak load generator is high.
In fact, there are many policies other than peak-load price that can shed the peak-
load. They are, naming a few, seasonal pricing, cogeneration of power, lifeline rates, load
management, interruptible service, etc. Our focus, in the next section, would be the
benefit analysis of peak-load pricing.
Benefit Analysis
To analysis the benefit of peak-load pricing, a simple diagram of peak and off-
peak demand curve can be used. Starting from a firm peak case, with two independent
demand curves. We will identify the benefits of moving from a uniform price, Pu, to an
optimum peak price, pj, and off-peak price, p2.
41
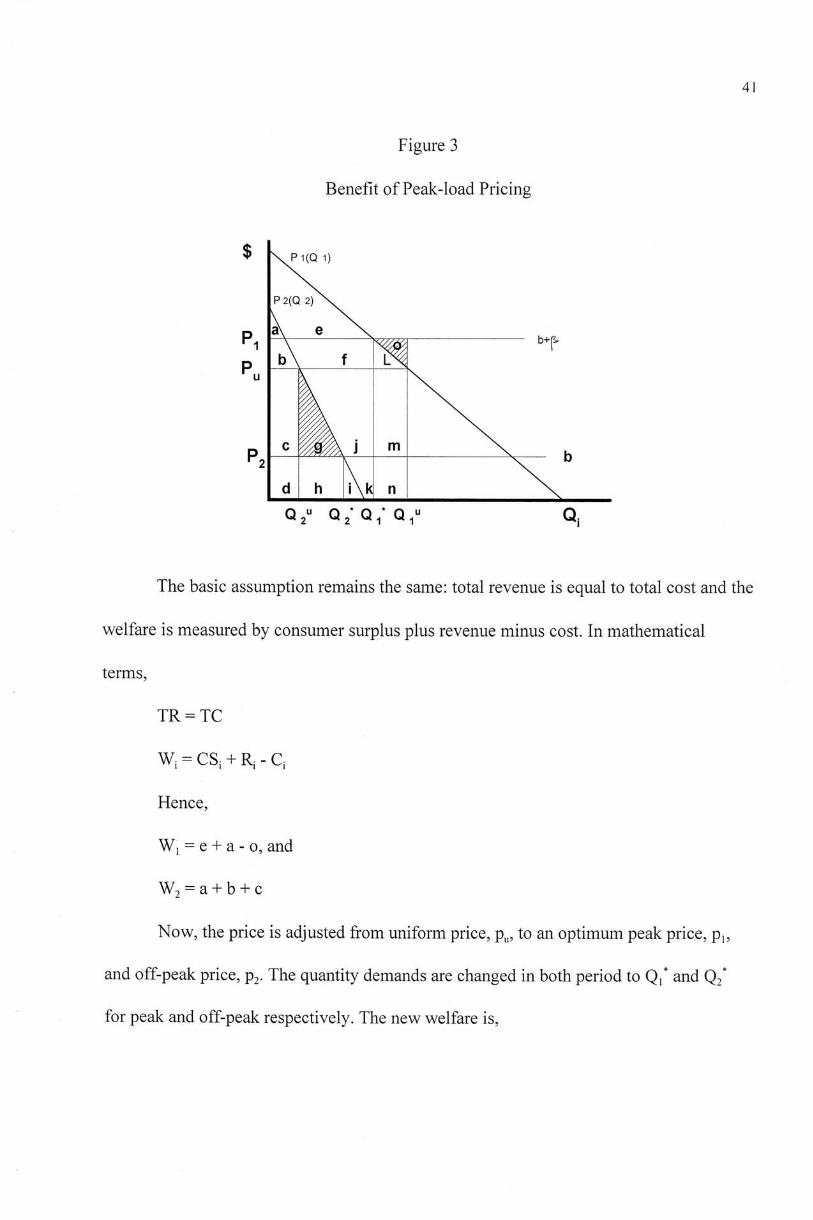
Figure 3
Benefit of Peak-load Pricing
$ ^s^l(Ql)
P 2(Q 2 ) X ^
n ^ e \ ^
p ; \ . ½ ,
p , [ ! \ b
d h _ i \k n X ^
Q2" Q / Q / Q r Qi
The basic assumption remains the same: total revenue is equal to total cost and the
welfare is measured by consumer surplus plus revenue minus cost. In mathematical
terms,
TR = TC
W; = CSi + R i - Q
Hence,
Wj = e + a - 0, and
W, = a + b + c
Now, the price is adjusted from uniform price, p „ to an optimum peak price, pi,
and off-peak price, p2. The quantity demands are changed in both period to Q!* and Q,*
for peak and off-peak respectively. The new welfare is,

42
Wi* = e + a, and
W2* = a + b + c + g
Both of them are increased. The net welfare gain due to the pricing structure changing is
(g + 0).
Note that the surplus of off-peak consumer is increased by (c + g). The surplus of
peak consumer, however, is decreased by (b + f + 1).
The above analysis assumes that the demands are independent. This constraint can
be relaxed to interdependent. Then the off-peak demand curve will shift to the right and
the peak demand curve to left in response to the changes in price structure. Hence, the net
welfare will also be increased. The reason of the shift is simply because some peak-
consumers shift the consumption to off-peak by the lower price. Hence, the off-peak
demand is increased while peak is decreased.
Actually, only part of the load in peak period can be shifted. Take an example of a
factory that operates 10 hours a day. If the peak period is from 9:00 to 21:00, there is no
way to move the production time to the off-peak period.
43
Principal Cost of Adopting PLP
In order to charge different prices for different period, utility has to install a more
sophisticated meter in the consumer's premise. The principle cost of adopting the peak-
load pricing is mainly the cost of the new meter and the installation cost. If the principle
cost is lower than the benefit determined above, peak-load pricing is justified. The typical
finding ofmost benefit analyses in the United States is that peak-load pricing is justified
for large consumers only but not for domestic customers. In Hong Kong, CLP launched
the peak-load pricing in 1996 to 4,000 large consumers which account for 25% of the
monthly revenue out o f l . 7 million consumers. This program will be extended to a few
hundred more large consumers in the coming years but not the domestic consumers.
44
CHAPTERV
CASE STUDY: A UTILITY IN GUANGDONG PROVINCE
A case study through interviewing was conducted in Feb. 99. The interviewee is
the vice-director of a utility in Guangdong Province. On the request of the interviewee,
his name and the utility cannot be disclosed. In the following study, we call this utility as
City Power Company, CPC.
The advantage of the peak-load pricing has been analyzed. In reality, this policy
has not been successfully implemented in Guangdong Province. Our focus below is to
find out why it does not work as good as the theory anticipated. What elements or barriers
can reduce the chance of succeed in PLP theory. The vice director of the CPC provided a
lot of valuable information to us.
Background ofthe CPC
CPC is serving one of the major light industrial areas in Guangdong Province.
The population is about 3 to 4 millions. The electricity consumption in 1998 is about 10
billion kWh that is about 30% of the total consumption in Hong Kong'^
The role ofthe utility is to transmit the electric energy from the power plants
through the power network to the consumers. CPC has no exception. CPC does not own
17 The consumption in Hong Kong was 32 billion kWh in 1998.
45
any power plants directly. The energy is bought from the Guangdong Provincial network
and the local power plants. CPC then sell the electric energy to the consumers.
PLP can be applied at two levels. The first level is in the purchasing process
between CPC and the network or local power plants. The second level is in the selling
process between CPC and the consumers.
Purchasing Process of Energy from Network and
Local Power Plants by CPC
The Guangdong Provincial Power Company, GDPC, supervises the CPC. GDPC
set the electric energy consumption for each city power company under their territories
annually. Each city power company has to achieve the targeted consumption. It is a
planed economy.
Since early 80's, the electric energy consumption measuring has been divided into
two parts: peak and off-peak consumption. Peak period is from 7am till 11pm while off-
peak period is from 11pm till 7am next day. Both peak and off-peak consumption targets
have to achieve. If CPC can achieve the figures, bonus will be issued to the CPC from
GDPC. However, these peak and off-peak consumption are not the real peak-load pricing
policy because both peak and off-peak consumption is charged at the same unit price, i.e.
uniform pricing. There is no driving force behind to encourage CPC or others power
companies to sell more electricity in off-peak and to shift the peak.

46
According to the interviewee, the CPC buys the necessary electric energy from
network and local power company during the peak period. On the other hand, CPC only
buy the off-peak energy from network as the energy demand is low. All energy generated
and fed into network will not be paid during off-peak.
Pricing
The energy pricing from the local power plant is more expensive than from the
network. There are two major reasons. Firstly, energy from the network is generated by
large power plants which have higher efficiency and production scale. Secondly, the local
power plants are usually built under some favorable investment scheme in early 90's. For
example, the unit rate was set at higher than the network rate in order to guarantee the
shorter return on the large capital investment.
Among the local power plants, the unit price is also varied. For economic reason,
CPC will choose the power plants from ascending order unit rate. The cheapest unit rate
power plant will be in the first priority in usage. Next cheapest power plant will be put
into service until the energy demand is fulfilled. The power plant at expensive rate may
not be able to sell any electricity if the demand is less than the total capacity.
Selling Process ofEnergy to Consumers by CPC
Electric energy is transmitted from power plants through the networks and
distributed to the consumers. There are two major types of consumers in this city. They

47
are the light industrial consumers and residential consumers. In Guangdong Province,
uniform pricing is applied in the same type of customers. The unit price is different
between industrial and domestic consumers.
In fact, only utilities of Hong Kong has been launched the peak-load pricing to all
large industrial consumers. Domestic customers are paying at uniform rate in China
except Hong Kong where inverted block tariff is applied.
48
Reasons of Unsuccessful Peal-load Pricing in
Guangdong Province and CPC
Supply and Demand
China government launched the open door policy in 1978. Since then the
economic is growing. In late 80,s and beginning of 90's, the demand of electricity is far
more than the supply especially in Guangdong Province. The Guangdong Province is
located nearest to Hong Kong. People in Guangdong Province share similar culture and
language with Hong Kong people. Investors started to shift their production facilities
from Hong Kong to Guangdong Province in late 80's and early 90's. Hence, the demand
for electricity is growing mainly in industrial consumption that is always a majority part
of total consumption.
In the previous discussion on PLP, when demand is over the supply, it should be
the good time for launching the PLP. However, provincial and local government
encouraged building more power plants to bridge the shortage gap. Numerous thermal
power plants project were approved and built in beginning of 90's. The power plant
capacity was ranged from a few hundred to thousands megawatt. After a few years, all the
power plants are put into service. The following table summarizes the installed capacity
and consumption from 1978 till 1997 in Guangdong Province.

49
Table 2
Power Plant Capacity and Consumption in Guangdong Province^^
Year Installed Capacity in MW Consumption in Billion kWh GDP
Guangdong China Guangdong China (percentage of (percentage of whole country) whole country)
1978 2,390 N.A. 9.4 N.A. belowlOO^'
1980 N.A. 65,870 N.A. 300 100
1993 14,004 (7.6%) 182,910 53.9 (6.4%) 836 344
1997 28,126 (11%) 254,238 98.1 (8.7%) 1,134 510
In beginning of80's, installing capacity and consumption in Guangdong Province
was about 3% of the whole country. In 1993, these figures were raised to 7.6% and 6.4%
respectively. In 1997, these figures werejumped further to 11% and 8.7%. We can find
that both the installing capacity and consumption in Guangdong Province are growing
faster than the average of the country.
In 1993, the installed capacity in Guangdong Province was 14GW. However, in
end 1998, this figure has beenjumped over 28GW. The installed capacity is more than
doubled in 5 years. The only reason for such a big growth is due to the favorable policy
offered by the Guangdong Provincial Power Company. At that time, the PLP
丨8 Source: Electric Power Industry in China, 1994 & 1998. 丨9 The GDP in 1980 was normalized to 100.

50
policy did not launch. A lot of power plants were approved with limited planning. Just in
a few years, the economy is turning from growing to saturating and then declining in
middle of 90's. The installed capacity is far more than the demand. By comparing the
growth rate between 1993 and 1997, the installation growth was 200% and the
consumption was only 182% in Guangdong Province. The consumption growth was
slower than the installation growth. Hence, supply is more than demand. Even the PLP
was launched, the power plant capacity existed already. PLP become less attractive in this
stage.
The long-term solution remains the same that it is to build more power plants. But
it has to be done in organized manner and in desired pace because ofhuge capital
investment on the power plant.
51
Demand Elasticity
The key of success in PLP lies in the consumers' constitution. In the case of CPC,
the majority part of electricity is consumed by the light industrial sector. This sector
consists of the toy factory, garment factory, electronics product factory, etc. There are
very few heavy industry in this city that can operated in 24 hours a day. All the
manufacturing process should be done in the day time. Even a cheaper rate is offered at
off-peak, such as from 9pm to 7am next day, the factory loading can hardly be shifted.
This is also true in other cities in Guangdong Province. The lack of heavy
industrial is a big barrier in launching the PLP successfully. In Guangdong Province, only
one car manufacturing company and one sizable steel plants are located in Guangzhou.
Furthermore, the light industry is usual labor intense. Labor cost is the major part
ofthe whole production cost. Cost in electricity is a small portion of the total cost. Even
ifthe off-peak rate is very low, the saving on electricity cost cannot cover the marginal
cost increased from the night shift labor cost.
In the residential consumption sector, the consumer used to operate the television
set or washing machine in peak period. This consumption is also hard to be shifted. In
addition, residential consumption in China is a small part of utility revenue.
Even the consumers are willing to shift, the principle cost is also too high.
Considering a domestic consumer spends lOORMB on electricity bill every month. The
52
cost of installing a meter that can measure the peak and off-peak consumption would be
about 300 to 500RMB. If the gross profit of the utility is about 10%, the pay back period
just for the meter would be over 30 years! It is not realistic.
Hence, this is the firm peak case as indicated in previous chapter. The demand of
electricity in peak and off-peak is inelastic in these sectors. According to the interviewee,
the shifting-peak case is feasible only if the peak price is two to three times of the off-
peak price. Only heavy industry with night shift can only benefit from off-peak pricing.
Substitution
Electric power industry is monopoly. This assumption is stated and applied
throughout the previous discussion. However, substitution does exist. In early 90's, when
the demand was more than supply, the utility in most cities in Guangdong Province had
to force the power outage once or twice a week. In order to guarantee the continue supply
of electricity, most factory owner installed their own generators.
IfPLP existed, the industrial consumers would compare which cost would be
cheaper. Supposing the peak price is more expensive than the self-generating cost. The
industrial will buy less electricity from the utility and generate more from their
generators. So CPC face the competition from the private generators.
53
CHAPTER VI
CONCLUSION
The peak-load pricing is analyzed based on economic theories and the practical
situation. The theoretical analysis provides a general picture on non-linear pricing under
different constrains. Due to the local policy and regulation, the peak-load pricing has not
been succeeded in Guangdong Province. It seems that the overall welfare has not been
maximized.
The following suggests how to maximize the power companies' and consumers'
welfare and benefit.
Energy Purchasing from Network
As explained in the case study, the electric energy from the network is cheaper
than from the local power plants. Utility should try to purchase as much energy as
possible from the provincial network. The aim of the utility is to deliver the energy from
one end to the other at lowest cost. The utility should reduce purchasing the energy from
the local power plants as far as possible to control the cost.

54
Power Generation Separate from Utility
Utility should not own any power plants in order to avoid the conflict of interest.
In some European countries, the power plants are not operated by utilities but
independent companies. They do not have any share in utilities or vice versa. The power
plant companies have to responsible for the profit and loss. This organization structure
guarantees that both utilities and the power plants are operating efficiently.
Pool Pricing
At the moment, there is no competition between power plants in China. The unit
price is agreed between provincial power companies and the power plants. Unit price can
be different across different power plants even they are located in the same province and
used the same generation technology.
The first country in the world introducing competition between power generating
companies is United Kingdom. The pool pricing concept is introduced.
Supposing that there is n power generating companies in the market,
c r r 。 1 , ^ 2 ' . ” ^ 1 1
They are bidding at price
Pi, ?2, ..., P,i where P! is lowest and P„ is highest
At quantity
Qi, Q2, . . . , Q n respectively

55
Power generating companies have to submit their bidding price, P;, 24 hours in
advance for the quantity, Q;, they want to sell in the next 24 hours period. The utility will
select all the lowest bidder until the demand quantity is fulfilled.
.S'
Demand = ^ Qi, s < n /=i
The highest bidder can never sell any energy to the network as the energy supply
is over the demand in UK.
The utility will pay, as the name suggested, at the pool price. That means the
selected power generating companies will be paid at the same and highest unit rate among
the successful bidder.
Unit rate = P
where Q is the highest bidder among successful bidder, C3+1 is loser
.s
Total energy cost of the utility = P, * ^ g z / = i
The pool pricing enforce the power generating companies to lower the operating
cost so that the bidding price can be attractively low enough to be selected. In fact, some
hydropower plants in UK bid at zero unit rate, i.e. ? ! 圳 , 。 = 0 , because they know that the
thermal power companies can never bid at zero unit rate. Whenever they are not zero,
hydropower companies would be the winners and the price is not zero.

56
Conclusion
Although PLP is one way to maximize the total welfare, there are also some
measures that can improve the total efficiency like pool pricing. PLP is not the only
solution even it is a good one in terms of economics point of view.
In China, Shandong Province will implement the pool pricing in near future by
using similar bidding rules. This is a good start to introduce competition in China. Power
industry will enter to a new era that competition between power plants or even power
companies will be introduced. Utility may no long be monopoly in future.
57
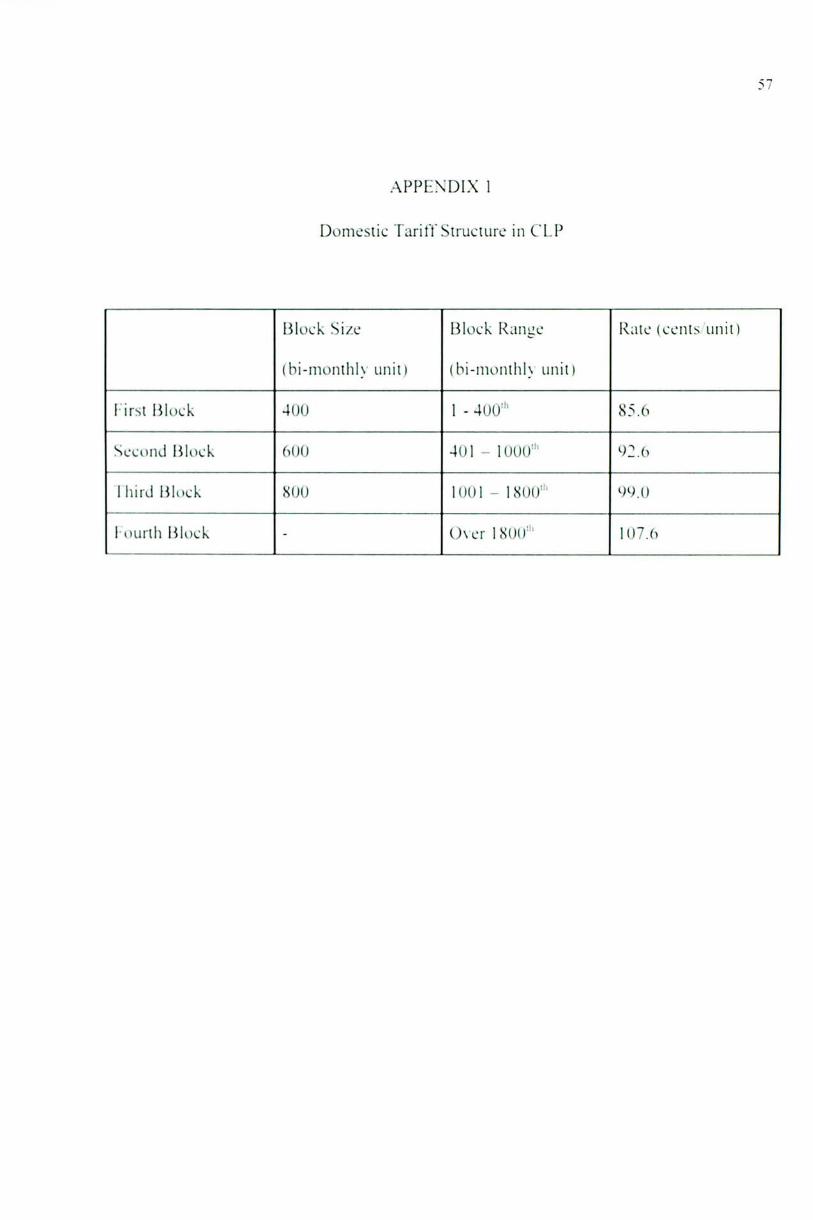
APPENDIX 1
Domcsiic TariffSimcuirc in CLP
Iik)ck Si/c Block Range Raic (cciils iinii)
(bi-monihl> iinii) (hi-nionihI> iinil)
l-irst liluck 400 1 - 40U" 85.6
Sccond Block 600 4Ul — 1 (Jl)0"' 92.6
lhial Block S00 1001 — 1 S()0"' 小).()
l oiirih Block - 0 \c r 1S()0"' K)7.6
t
58
BIBIOGRAPHY
Books
Sanford V. Breg and John Tschirhart, Natural Monopoly Regulation. Cambridge,
Cambridge University Press, 1988
Stephen J. Brown and David S. Siley, The Theory ofPublic Utility Pricing. Cambridge,
Cambridge University Press, 1986
Michael A. Crew and Paul R. Kleindorger, The Economics of Public Utility Regulation.
Massachusetts, The MIT Press Cambridge, 1986
North, D. Institutions. Institutional Changes and Economic Performance. Cambridge:
University of Cambridge Press, 1990
Svetozar Pejovich, Economic Analysis of Institutions and Systems. Kluwer Academic
Publishers, 1995
John Soderbaum, Asia Electricity Study. International Energy Agency, 1997
Periodicals
China 1997, Business Monitor International T.td.. ISSN 0969-5184, Regions P.149 - 170,
Key Economic Sectors P.142 - 147
China 1998, Business Monitor International Ltd.. ISSN 0969-5184, The Political Outlook
P.9 - 17, Key Economic Sectors P.183 - 234
59
Dennis K. Fan and Thomas G. Cowing, Regulatory Information, Market Expectations,
and the Determination of the Allowed Rated of Return, Journal of Regulatory Economics:
6:433-4444(1994)
Kast China Electric Power. Sept. 1998,P.49 - 51
Sun Jiaping and Liu Chunsheng, Electric Power Industry in China. 1994, Financial
Situation and Tariff, P.43 - 44
Sun Jiaping and Liu Chunsheng, Electric Power Industry in China. 1995, Financial
Situation and Tariff, P.48 - 49
Sun Jiaping and Liu Chunsheng, Electric Power Industry in China. 1997, Financial
Situation and Tariff, P.48 - 49
How to Quantify Marginal Costs. National Economic Research Associates Inc., 1977
Measuring the Potential Cost Advantages of Peak-load Pricing. Gordian Associates, 1977
Elasticity of Demand. J.W. Wilson 8c Associates, Inc. 1977
Costing for Peak Load Pricing: Results for Carolina Power and Light Company. Ebasco
Services Incorporated.
World Wide Web (WWW)
http://www.ieEi.org
MpL:Z;: t:i ! 4gmup: Qm

V .
, “
•-
- •
、弓
_.L-
": =•
:C?.
,: -
=. v-
'.r':=
_
广.:,
、:-••
,、
、「
-.
•
. -
:••:
:;
.':;;
r .
•• i
�.
�:
. .'。
••»:-.r
... •
-':..-
•.
--
.-
J ul
. 。
'. ,
I. •• •
:•
'"'-
.
I.r
• .
—._..,....:〜
〜一
―^"
-,,w
,_i-
i.i^
a^^^
fe^M
^^^i
ii^^
^^<^
^^i^
i^ft
iii^
i^M
^WW

iehhDiEDD
11隱__1 s3LJBjqn >iHnD