Embed Size (px)
Citation preview

2/24/2011
1
Principal themes in the population geography of the U.S. and Canada
• An ancient and ongoing Native American legacy.• A long and ongoing history of immigration, although
sources and numbers have varied over time.• Significant regional differences in age, ethnicity,
culture and well beingculture, and well-being.• Urbanization• Significant internal (U.S.) shift, including
– Rural to urban– East to West– North to South (“rust belt” to “sun belt”)– Emptying of the Great plains
Native American map
“BERINGIA”
• THE NAME REFERS TO THE CONTINENTAL SHELF AT THE BOTTOM OF THE BERING SEA, WHICH TODAY SEPARATES ALASKA FROM SIBERIA.
• DURING THE ICE AGE(S) SEA LEVELS WERE AS MUCH AS 450 FEET LOWER THAN THEY AREMUCH AS 450 FEET LOWER THAN THEY ARE TODAY.
• WHEN THAT OCCURRED, THE BOTTOM OF TODAY’S BERING SEA WAS DRY LAND THAT “CONNECTED” NORTH AMERICA AND ASIA.
• THIS ALLOWED THE ANCESTORS OF NATIVE AMERICANS TO MIGRATE ON FOOT TO NORTH AMERICA FROM ASIA.
The Native American Legacy• A diverse contemporary population
numbering about 4.1 million• Numerous semi-autonomous
reservations that vary greatly in sizey g y• A major impact on the nature and
extent of “natural vegetation”• Crop domestication• Trails to roads• Toponyms (place names).

2/24/2011
2
Top Five Native American Groups(2000 U.S. Census)
Cherokee 729,533Navajo 298,197Choctaw 158,774Sioux 153,360Chippewa 149,669
There are 310 Indian reservations in the United States and about 550 tribes that are officially recognized by the U.S. Bureau of Indian Affairs. Thus, not all tribes have a reservation.
The reservations account for about 2.3% of the United States and vary greatly in size. Twelve are larger than the State of Rhode Island. The Navajo Nation is the largest, and is roughly the size of West Virginia.
“Tribal sovereignty” applies to reservations. As a result , laws on tribal lands may differ from surrounding areas. Thus, casinos sometimes are found on reservations, but not elsewhere in the states that contain them.
“Indian Summer”• A period of relatively warm summer-like weather that
occurs in the U.S and Canada during autumn.• The term was coined by European pioneers who
mistakenly believed the warm air was caused by the Indians’ custom of setting fires to forests and fields in the fall.
• The Native Americans did this to encourage the growth of new grasses in the spring that would attract wildlife/game that provided meat, skin, and bones (for tools).
• In the process, they changed the nature of local plants that Europeans came to regard as “natural vegetation.”
Domestication is the successful transformation of plant or animal species from a wild state to a state of dependency on human management, usually with distinctive physical changes from wild ancestors.
• Domesticated plant:– Deliberately planted and tended by humans– Selective breeding
Becomes genetically and physically distinct from wild– Becomes genetically and physically distinct from wild ancestor
• Domesticated animal:– Kept by humans for some utilitarian purpose– Breeding is controlled by humans– Survival is dependent on humans– Differs genetically and behaviorally from wild ancestor due
to selective inter-breeding

2/24/2011
3
The Columbian Exchange refers to the extensive (and historically unprecedented) intercontinental diffusion of culture traits – particularly cultigens (food crops) – in the years following the European discovery of the America’s.
Native American toponyms: A Sampler
• Manhattan• Canarsie• Massapequa• Adirondack
• Mississippi• Michigan• Illinois• Chicago
• Connecticut• Massachusetts• Delaware• Appalachians• Lake Huron• Nantucket
• Kansas• Iowa• Ohio• Missouri• Dakota• Etc., etc., etc. . . .
NATIVE AMERICAN POPUATION DATA:YEAR 2000 U.S. CENSUS
GENERAL NATIVEPOPULATION AMERICANS
TOTAL 277,300,000 4,100,000
PERCENT 98.5 1.5
H.S. GRADS 80.4% 74.7%
P.C. INCOME $21,587 $14,267
POVERTY RATE 12.4% 22.0%
UNEMPLOYMENT 3.7% 6.6%

2/24/2011
4
Beacon Hill, Boston
Farm land in Canyon County, Idaho Estimated Population ofNew York City
(as of July 1, 1909)
Brooklyn 2,567,096Queens 2,306,712M h tt 1 629 054Manhattan 1,629,054Bronx 1,397,287Staten Island 491,730
Total 8,391,879
(Source: U.S. Census)
More people Live in Brooklyn Than Live in:
• Alaska• North Dakota• South Dakota
M
• Maine• Vermont• New Hampshire
Rh d I l d• Montana• Wyoming• Nebraska
• Rhode Island• Delaware• West Virginia
Ellis Island Immigrants

2/24/2011
5
The Commonwealth of Nations(a.k.a., The British Commonwealth)
Cartography by Phil GersmehlCartography by Phil Gersmehl

2/24/2011
6
Ethnic Change in the U.S. Population, 1920-2004
Category 1920 1970 2004White 89.7% 83.5% 67.4%Black 9.9 11.1 12.2Asian 0.2 0.8 4.1Hispanic --- 4.5 14.1Other 0.2 0.1 2.2Total 100% 100% 100%
Source: U.S. Census as reported in New York Times,January 13, 2006, pp. A1 and A8.
A neighborhood in Toronto, Canada
Restaurant in Washington Heights Little OdessaBrighton Beach, Brooklyn
Selected towns in Southern Minnesota(cartography by Phil Gersmehl) Theme town - a settlement (usually a small- to
medium-sized town) that has adopted a certain motif so as to evoke a different time and place for the purpose of attracting tourists.
• Most have a well-established ethnic identity• Often a response to a downturn in the town’sOften a response to a downturn in the town s
traditional economic base• Characterized by affected facades and folk
architecture, ethnic dress; ethnic food; ethnic music; ethnic signs and language; ethnic festivals; ethnic gift items; ethnic . . .

2/24/2011
7
Holland, Michigan
Lindsborg, KansasThe “Little Sweden” of the United States
2/24/2011
8
New Glarus, Wisconsin
Emigration Society – an organization of potential emigrant families formed to promote their resettlement as a contiguous community in a foreign land. Steps:
• Formation of the society in the homeland.• A pooling of monetary resources for purposes of
land acquisition.• Choice of a small group of trusted members to travel• Choice of a small group of trusted members to travel
abroad to– Identify a suitable place to resettle– Purchase a suitable amount of land
• Migration of society members to the new lands.• Allocation of the purchased lands among society
members.
Percent of population aged 75 or older, by county (2000)
(Source: U.S. Census)
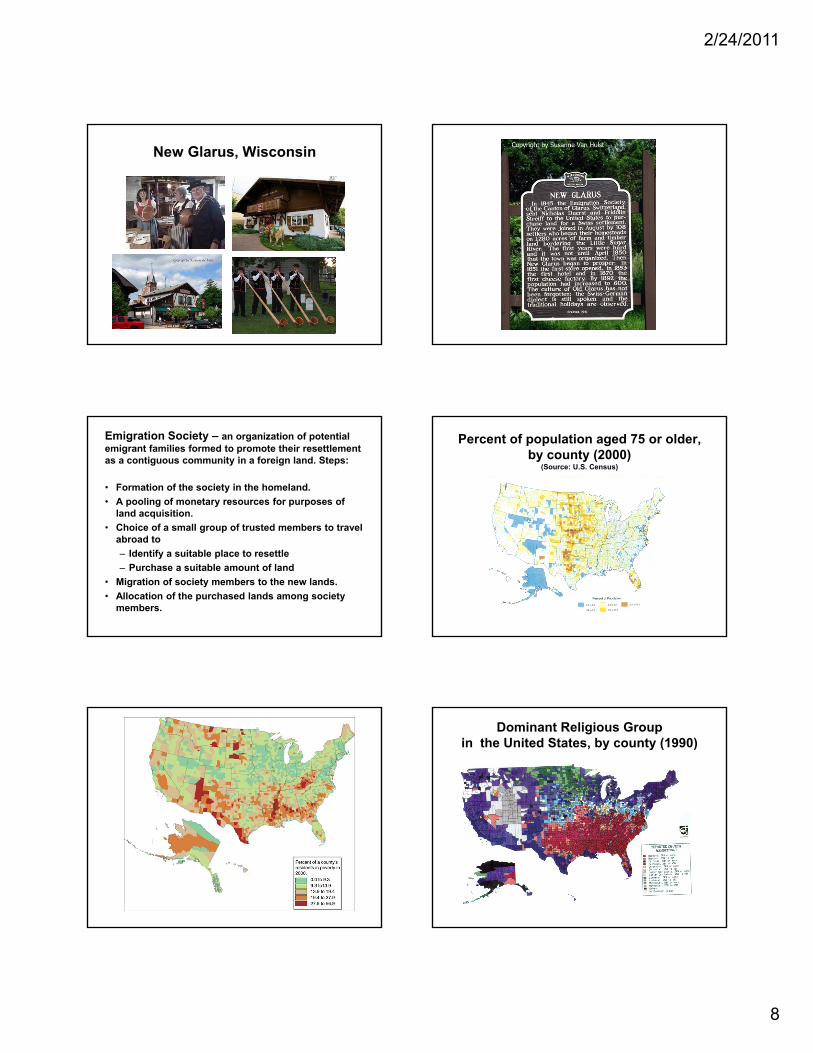
Dominant Religious Groupin the United States, by county (1990)

2/24/2011
9
The center of population(sometimes “population center” is the theoretical point at which a country’s population is equally balanced in all directions That is as many people live todirections. That is, as many people live to the north as to the south, and as many to the east as to the west.
Center of populationin the United States, 1790-2010
(source: U.S. Census Bureau)
Rural-to-urban population change in the United States, 1800-2000
(source: Wadsworth Publishing)
Why Have Cities Grown?• Structural changes in the economy. Rise of
commercial, manufacturing and tertiary activity (wholesale and retail trade; government; transportation; health, personal and information services) versus farming.D li f i lt l t• Decline of agriculture as an employment opportunity due to unavailability of arable land; mechanization of agriculture; and farm consolidation.
• Resulting rural-to-urban migration, and urbanization of immigrants.

2/24/2011
10
Changes in Farms and FarmPopulation in the U.S., 1880-2000
#of Farm % of TotalYear Farms(M) Pop. (M) U.S. Pop.
1880 4.0 21.9 43.8 1930 6.5 30.5 24.91970 2.9 9.7 4.82000 2.0 3.0 1.0

2/24/2011
11
Changes in Number and Sizeof U.S. Farms, 1950 – 2000
# of Average Year Farms (M) Size (acres)
1950 5.6 2141960 4.0 2941970 2.9 3801980 2.4 4261990 2.1 4602000 2.0 490
Cartography by Phil Gersmehl
The Great Migration
• The large-scale migration during the 20th century of African Americans from rural areas in the South to urban areas in Northern, Midwestern, and Western States.
• Viewed by historians as either a singular migration between roughly 1916-1930 involving about 1.3 million people, or
• An initial movement between 1910-1940 involving about 1.6 million people destined mainly to the Northeast and Midwest, followed by a secondary migration between 1940-1970 involving perhaps 5 million people, for whom California was the principal destination.
• Result: A people who were once overwhelmingly southern and rural became more national in their distribution, and much more urban (especially outside the South).
Reasons for the Great Migration
• Oppressive conditions in the South (discrimination, segregation, lynchings . . . )
• A much more receptive legal and social environment in the receiving areas (initially, at least).
• A boll weevil infestation in southern cotton fields (circa 1910) that forced Black sharecroppers and(circa 1910) that forced Black sharecroppers and farm laborers to seek new employment.
• An expansion of manufacturing jobs in the North and Midwest during and following World War I.
• The Immigration Act of 1924, which cut the supply of potential new factory workers from Europe.
• The Great Mississippi River Flood of 1927, which displaced hundreds of thousands of people.

2/24/2011
12
“Rust Belt” and “Snow Belt” are vernacular regions that respectively refer to old manufacturing areas (with closed, rusting factories) and areas with cold climates in the Northeast and Upper Midwest that have become sources of migrants bound for the “Sun Belt” – the warmer tier of southern states stretching from Florida to California.