Embed Size (px)
Citation preview

MINISTRY OF SUPPLY
AERONAUTICAL RESEARCH COUNCIL
REPORTS AND MEMORANDA
q , !
° ChSoXSCte~s¢~cs of ~{~re o D
L X~ss~stsnce 5t~s~n Gauges @
Eo JoNEs, MoSCo and Ko R° •4ASLEN, Mo$Co
Crow~l CopyrigIzt Reserved
,
" 'S " ~ Y L O N D O N " H E R M A J E S T Y S T A ' I I O N E R O F F I C E
9 5 z
PRICE IIS 6~ N E T

The Physical Characteristics of Wire Resistance Strain Gauges
E. jo>a~s, M.Sc. and K. R. MASL~N, M.Sc.
COMMUNICATED BY THE PRINCIPAL DIRECTOR OF SCIENTIFIC RESEARCH (AIR),
M I N I S T R Y OF S U P P L Y ..~__.~
. ] i~1.~ , 7 :I ~ . . . .
R e p . . . . . """:';' )" t; orts a n d M e m o r a n d a No. 2 6 6 I ~! J
November , 194.8 " -'* )
k L i: !i
S u m m a m . - - - T h i s report deals with the fundamental principles of the wire resistance strain gauge. Types of strain gauge in common use and their methods of construction are described, and the mechanism whereby strain effects change of resistance is discussed. A sub-section is devoted to the behaviour of fine wires, in general, under strain..
Possible causes of error, including the effects of humidity and temperature, are discussed, and as far as possible methods are given of overcoming these difficulties. The effect of the passage of current on the strain gauges is described, and methods of increasing the output are suggested. "
The final section is devoted to miscellaneous properties of the wire resistance strain gauge, on several of which very little information is at present available.
1. Introduction.--There is no need to stress the part that can be played in engineering design by an adequate strain gauge technique not only as a check on the soundness of the analysis, but as the basis of a trial-and-error experimental method of design which must take the place of the analytical method when the latter becomes complicated by a large number of parameters.
The subject of this repor t - - the wire resistance strain gauge--has been in process of develop- ment during the past ten years only, but it is not too much to say that its employment is putting an entirely new complexion on many aspects of engineering design, and promises to become one of the most useful experimental techniques at the disposal of the designer.
There have, of course, in the past been many kinds of strain gauge available--mechanical, optical and electrical--but almost without exception these have been expensive, requiring considerable skill in manipulation and none of them has approached the wire resistance strain gauge in versatility, simplicity and cheapness.
Most of the' older types of mechanical and optical strain gauge suffer from the disadvantage tha t they need elaborate fixing arrangements and are direct reading, i.e., the strain reading has to be made on the instrument itself or on a graduated scale near it ; a fact which precludes their use in inaccessible places. In general the older type of mechanical or optical instrument could not be readily adapted to give continuous records of varying strain. Exceptions to this latter generalisation were to be found notably ill the D.V.L. recorder, the De Forest scratch recorders and the Cambridge continuous strain recorder, but even here the frequency response was very low.
* R.A.E. Report Instn. 2, received 20th May, 1949.
A (51sol)

None of these were remote reading instruments, and it will be appreciated that when many strain gauges are used at once the labour of taking a set of observations becomes proliibitive unless the indicating ends of all the instruments can be grouped at a single station. Remote reading or recording instruments of course become a necessity when strain has to be measured at inaccessible points.
The earlier electrical types, based on variations with strain of inductance or capacitance, shared with the mechanical and optical instruments the disadvantage of requiring somewhat elaborate mechanical means of at tachment which detracted from their general usefulness; their use also involved considerable technical knowledge and manipulative skill on the part of the operator.
The stiff mechanical construction, necessary for accuracy, which is the characteristic of most types of strain gauge Cannot be achieved without considerable addition to the weight, and the resulting inertia of the instrument itself militates against its use for the measurement of high speed transient strains and those of very high frequency.
A comprehensive survey of the various types of electl:ical strain gauge is given in a series of papers by H. C. Roberts 1 ; so it is not proposed to describe them here, but it may not be out of place to enumerate the special advantages of the wire resistance strain gauge in comparison with the older types, before discussing it in detail.
(1) Since the wire strain gauge has negligible weight and is cemented in posit ion--not mechanically a t tached--and since it has also negligible electrical inductance and capacity, its frequency response is only limited by that of the ancillary instruments, and the necessity for keeping the gauge length a reasonably small fraction of the wave length of the elastic waves in the material at the given frequency. The upper practical limit is about 40,000 c.p.s.
(2) The gauge is cheap in first cost, is easily applied and can, therefore, be used in large numbers, and since there is no necessity for reclamation can be built in during the fabrication of the structure or assembly of the rhachine as the case may be.
(3) The technical skill required for installation is small.
(4) Its sensitivity and accuracy are sufficient for all practical purposes, and its associated instruments are very simple in the case of static strain measurements and reasonably so for dynamic ones. When measuring the absolute va lue of strain an overall error of less than - /2 per cent may be expected, and changes of strain of 10 -* can be detected.
(5) It can record strain over very small gauge lengths--about 1/16 in. is the present practicable lower limit though this may be much reduced in the near future. This consideration is important in many complex stress applications where the strain is changing rapidly from point to point.
(6) The relation between electrical output and strain is linear for all types of gauges up to strains of about 0.5 per cent, and for some types the linear relation holds up to strains of about 5 per cent.
(7) The signals from two or more gauges can be added or subtracted electrically to measure directly average stresses, bending moments and shears.
(8) The gauge can be almost completely compensated for temperature changes; a very real advantage since many of the applications of the strain gauge in the field, involve very wide variations of temperature.
Though the change of resistance of a wire with strain has long been appreciated as a means of measuring a mechanical movement~, 3 it was never more than a somewhat refined laboratory method. The idea of simplifying the technique by incorporating the filament on or in a wafer, which itself could be cemented to the surface under test was due to Simmons of the California Insti tute of Technology and its first application is understood to have been in connection wi th the measurement of high speed stress transients by Professors Clark and Dottweiler of that institution. Almost parallel, and subsequent fundamental work was carried out by Professors Ruge and De Forest and their colleagues at the Massachusetts Insti tute of Technology ~,5,6.
2

During the years tha t have elapsed since the commercial introduction of the wire resistance strain gauge, its use has extended ra~idly to most branches of engineering research and develop- ment. I t has been welcomed with special avidity in the field of aircraft structures where design uncertainties are particulary marked and where structural weight reduction is, of course, of the highest importance.
I t is to be feared, however, that in common with other techniques developed in war time, the actual use of the wire resistance strain gauge has outrun a knowledge of its limitations and of the physical principles underlying its operations, and much work remains to be done on the fundamentals of the appliance.
The present report is an a t tempt to give a reasonably comprehensive survey of existing knowledge of the physical characteristics of the gauge. I t does not deal with the actual technique of measurement of either static or dynamic strains. The measurement of dynamic strains has been covered in another Royal Aircraft Establishment Report 7.
No apology is offered for the somewhat academic nature of this report or for the fact that much of it is devoted to chasing second order irregularities in behaviour ; the justification being tha t there are many fields of application where these second order quantities become important.
In the application of the wire resistance strain gauge to the measurement of the magnitude and distribution of aerodynamic loads in flight extreme accuracy is essential since, in general, the reading of a single gauge will be a function of loading, moment and torque, and the final reduction of the results to give these three unknowns, will involve the solution of a set of simultaneous equations. I t will be seen that comparatively small inaccuracies in the initial measurement can lead to relatively large errors in the final results.
Again it frequently happens tha t the choice of the strain gauge stations dictated by con- siderations of accessibility may lead to the necessity of measuring strain in a member or part of a member tha t is l ightly stressed giving correspondingly low values of the strain gauge signals. Small absolute errors now become relatively important.
Applications of the method to dynamometers for the measurement of force and torque are accompanied in many cases by the necessity, of accuracies of the order of one part in a thousand over a prolonged period and here again minor irregularities in behaviour cannot be tolerated. For a dynamometer the maximum load will usually correspond to a strain in the measuring member of less than three parts in a thousand so tha t for overall accuracies of the order of 0- 1 per cent strain measurements must be accurate to three parts in a million. This is about five times tha t possible over a long period using a single gauge. If gauges are used in pairs, however, the final accuracy depends on the difference of the irregularities in the individual gauges, and greater overall accuracy is possible.
2. Descriptio~ of Types of Wire Resistance Strain Gauge:--Before discussing the detailed action of the wire resistance gauge it is advisable to give a general description of it as developed by Simmons, DeForest and Ruge.
There are variations in format and methods of i manufacture but essentially the wire resistance strain gauge consists of a length of fine resistance wire embedded in, or affixed to, a suitable wafer--paper or plast ic--which can itself be stuck to the surface of the material under test. Suitable leads connected to the resistance grid are an integral part of the gauge. The wafer to which the resistance wire is bonded, is flexible to a greater or less extent depending on the method of manufacture, and the gauge can, therefore, be attached to a curved surface quite easily. The gauge lengths commercially available, range from 1/16 in. to 6 in. and the resistance from about 50 to 10,000 ohms. There is a lower limit to the gauge resistance beyond which the resistance of connecting wiring in the external circuits becomes unduly important and it is therefore not often practicable to have a gauge with a single longitudinal wire. The necessary length of wire is, therefore, wound backwards and forwards to give several longitudinal strands in series. I t will be seen later tha t the end loops in the multi-strand gauge give rise to complications both in
3 (51501) A

standardisation in manufacture, and in the behaviour of the gauges in complex stress fields but certainly for reasonable gauge lengths and resistances there seems no alternative to the multi- strand gauge'. Some typical wire-resistance strain gauges--English and American-- are shown in Fig. 1.
The material of the gauge resistance element, the matr ix and the adhesive will be discussed later in some detail ; at this stage it is convenient to classify the gauges according to the method of winding the grid.
2.1. The Flat Grid Type.--In this type the wire is wound backwards and forwards in the plane of the gauge as shown in Fig. 2a.
The simple method of winding this type of gauge now to be described is one which enables small numbers of gauges to be produced successfully by anyone with a reasonable amount of manual dexterity.
The winding jig consists of a metal block with two rows of holes into which small pegs can be inserted as a push fit (Fig. 2b). The wire is first passed round peg A, an end of suitable length being left and anchored at the opposite end of the jig. The wire is now brought along the axis of the gauge, peg 13 inserted and the wire passed round it, to be again taken back in the direction of C. The process is repeated until the requisite length of wire has been wound. A thin film of acetate cement is then painted over the jig and wires between the rows of holes and al lowed to set, after which the pegs and the grid can be removed. If a jig plate and pegs of brass amal- gamated with mercury are used, the cement will not adhere to them and the winding comes away readily. The winding can now be mounted on the backing paper using a very dilute cement coating. Cigarette paper makes a suitable backing. Alternatively, the paper can be placed in position on the jig in the first instance and the pegs pushed through it, into the holes. Leads are next soldered or spot welded to the ends of the grid wire and anchored to the backing paper, preferably with a reinforcing paper strip.
Very consistent gauges can be wound in this way, provided care is taken to maintain the wire just taut during winding and to ensure that the end loops are securely cemented to the backing paper - - the latter proviso being specially important.
Another method of winding the flat grid type of gauge which is more suitable than the foregoing for mass production is based on a modified weaving process. The apparatus involved consists of two sets of interleaved hooks, one set fixed, the other sliding in guides as in Fig. 3. Init ial ly the wire passes between the two sets of hooks and is tensioned by a small weight at its free end as in Fig. 3a. The moving hook A1 is then drawn back forming the first loop in the winding, the free end of the wire with its tensioning weight being drawn up to provide the length of wire required for the loop. The remaining movable hooks As, Aa, etc., are then drawn back in succession giving the complete winding as in Fig. 3b stretched between the two sets of hooks. A rising platen with the backing paper folded over its upper face is now caused to rise between the set of hooks until it touches the.winding, and a thin layer of cement is applied to the centre portion. It is convenient to heat the platen electrically so that the cement dries very quickly; the hooks can then be disengaged and the partially cemented gauge removed from the platen top. The end portion of the winding is next cemented to the paper and the leads attached. I t is advisable to provide end reinforcing strips since, with t h i sme thod of winding, the loops at the ends tend to curl upwards owing to the drawing of the wire round the hooks, and, as will be seen later, the effective cementing of the ends of the gauge is most important if batch consistency of gauge factor is to be achieved.
2.2. The Flattened Spiral or Saw-Tooth Type.--In this type the wire is wound spirally on a former which can be either circular in section or a thin, flat strip.
In the first case a cylindrical former is provided with a paper sleeve on which the wire is wound, the completed winding being painted with an acetate or Bakelite varnish. A slight longitudinal
4

taper in the former enables the sleeve carrying the winding to be withdrawn. The tubular winding is now squeezed flat, mounted on backing paper and leads attached in much the same way as for the first type described.
A gauge made in this way is stiffer than one of the flat-grid type owing to the double thickness of the paper sleeve inside the winding ; this greater stiffness has some disadvantage as will be seen later.
In the gauge developed by Dr. Augh{ie of the National Physical Laboratory the method of winding is tha t described immediately above but the subsequent t reatment is different. The winding, which has been done on a sleeve of resin-impregnated paper, is squeezed between two cover slips of the same material and the whole stoved whilst under pressure. The result is in effect a wafer of Bakelite in which the winding is embedded.
A modification of the winding method described, which although calling for a slightly more elaborate and careful manufacturing technique, has the advantage tha t there is only one paper thickness between the top arid bottom layers of the winding, is illustrated in Fig. 4a.
The former in this case consists of a strip of thin paper of width equal to the required gauge length impregnated with a cellulose or Bakelite varnish. I t is gripped at its ends in two headstock clamps pulled apart with a slight tension so tha t the paper former is stretched. The two head- stocks are geared so that they rotate together. A suitable length of filament wire or ribbon is then cut and its two ends cemented to the former with a small free length projecting at each end as shown in Fig. 4a. When the cement securing the ends is dry, the 10op is pulled out by suspending a small weight equal to twice the required winding tension in the gauge. The head- stocks are now rotated and the filament Wire wound as a flat coil round the former, the spacing of successive loops being fixed by the inclination of the sides of the triangular loop of free wire, which remains sensibly constant during the winding, thus giving an evenly spaced coil. When the required amount of wire has been wound as shown in dotted lines, the winding is l ightly varnished. When the varnish is dry a cut is made at XX, leaving two gauge elements on the former. The free ends can now be spot welded to leads tacked in position on the backing sheets. The lat ter process, and indeed the whole of the finishing of the gauge can be carried out before removing the ends of the gauge former from the headstock clamps.
Fig. 4b shows an alternative method of winding on a flat strip. In this, only one end of the filament is fixed initially, and the spacing is obtained by tilting the machine up to the required angle.
In the flat grid type of gauge it will be appreciated that the lower limit to the spacing of the strands and thus to the overall size of the gauge is fixed by the diameter of the pegs and the close- ness with which the holes car~ be drilled. For small gauge lengths the length of wire in the end loops will bear a disproportionate ratio to the total length ; further, owing to the relatively wide spacing of the strands, the overall width of the gauge .will be larger than in the saw-tooth type, in which the strands can be wound closely and in which the end loops are smaller and perpendicular to the plane of the gauge. For gauge length less than ~ in. the saw-tooth type is to be preferred. The same considerations apply when a gauge is desired of the maximum resistance for a given size.
2.3. Wove~¢ Type.- - In this type the resistance wire is actually woven into a fabric backing, the resistance wire forming the weft with the warp of some textile. Gauges of this type made by Messrs. British Celanese have a Eureka wire weft and a rayon warp, the weaving being done in such a way tha t there are no kinks in the wire as it passes through the strands of the warp. The woven gauge material is turned out in the form of a continuous ribbon which can be cut to a length having the desired resistance, the leads being attached after cutting. This latter operation, which requires considerable manual dexterity, is the principal drawback to this type of gauge.
2.4. Materials i~¢ Commode Use.--The cements in common use are of two kinds, cold setting of the Durofix type and thermosetting of the Bakelite type. Most of tile work described in the present report is concerned with strain gauges in which the first type of cement is used.
5

The material of the filament, is almost invariably one of the 60/40 cupro-nickel series. reasons for the present choice will become apparent at a later stage in the report.
The
,
wire
and
I t
Behaviour of the Gauge under Strain. - - I t will be seert from the foregoing description that the resistance strain gaug e consists essentially of three elements:
(a) the resistance wire itself,
(b) the matr ix in which the wire is embedded, or the wafer to which it is fixed, (c) the adhesive layer between the gauge proper and the surface of the specimen under test.
is important tha t the detailed behaviour of these elements should be appreciated.
3.1. Strain Sensitivity of the Wire Filament.--For any type of gauge made of materials in common use and over a given range of strain there is a definite relation between strain and change of resistance which can be expressed by :
~ R _ K e . R
where d R/R is the fractional change in resistance, e is the strain or fractional change in length and K is a constant known as the gauge factor, or strain sensitivity factor.
The value of K for a particular gauge depends on : (a) Dimensional change in the gauge wire due to strain. (b) Change in the specific resistance of the gauge wire with strain. (c) Geometrical arrangement of the gauge winding. (d) Orientation of the gauge axis relative to the principal axes of strain.
The nominal value of the gauge factor, that is, the gauge factor quoted by the makers Of the gauge, refers to the characteristics of the gauge when placed along one of the principal axes of stress, the other principal stress being zero, i.e., a gauge placed along the axis of pull of a specimen in simple tension ; and it is this nominal value of gauge factor which will be meant in discussing (a), (b) and (c) above. I t is to a small extent dependent on the value of Poisson's ra t io of the material of the bar on which the calibrations are done, and this fact must be borne in mind in using the gauge under different Conditions.
3.1.1. Effect on change of resistance of dimensional change in wire under strain.--If the change of resistance of wire under strain were due solely to the dimensional change, we should have
R = o L / A ,
where 0 is the specific resistance, L the length of wire, and A its cross-sectional area.
Then ~R = o(~L/A -- (~A) L /A ~)
i.e., ~R/R = dL/L -- ~A/A . . . . . . . . . . . . . (3.111)
and since $A/A = -- 2~,dL/L, where/~ is Poisson's ratio for the material of the wire,
dR/R = (1 -t- 2/~) ~L/L . . . . . . . . . . . . . (3.112)
That is, the strain sensitivity, which is defined as the ratio of dR/R to ~L/L, would be about 1.6 for all metals if only the dimensional changes in the wire were involved. In fact, as will be shown, the strain sensitivity may be negative or as large as 6 for some metals, facts which cannot be explained on the above analysis except by assuming fantastic values for Poisson's ratio.
6

3.1.2. Effect of tensile strain on the electrical resistance of fine metallic wires.--A considerable amount of experimental work has been done on the variation of the electrical properties of metals with strain 8 to 1~ Most of the information available, however, applies to the effects of large hydrostatic pressures s or torsion 1° to 1~, and up to the present little effort appears to have been applied to the investigation of the effect of tensile or compressive strains on the electrical properties of fine metallic wires. These are in a highly cold worked condition with a considerably distorted crystal structure, and would be expected to exhibit idiosyncrasies in behaviour when strained.
The following discussion based on some preliminary resuRs from a comprehensive research in progress, is intended to bring out some points in the electrical behaviour of metallic wires under tensile strain, which are relevant to the design and working of the wire resistance strain gauge.
Some of the wires considered are pure metals, others are standard resistance alloys, and all wire was supplied by Messrs. Johnson, Matthey & Co.
The materials so far tested are:
Pure Metals
Silver
P l a t i num
Copper
Iron
Nickel
Alloys
Ferry (60/40 Cupro-Nickel)
Minalpha (Manganin)
10 per cent Iridium Plat inum
10 per cent Rhodium Plat inum
40 per cent Silver Palladium.
Since the application of the results to the strain gauge was an important desideratum, the tests were arranged to simulaite the action of the gauge. The test wire was, therefore, a single strand 4 in. long with leads at its ends, placed along the axis of a high duty aluminium alloy'specimen. A mechanical extensometer was arranged to straddle the gauge length to measure the strain, the change of resistance~being measured by a conventional Wheatstone Bridge arrangement.
Some representative results are shown in Figs. 5a, b, c and d. (In Figs. 5a, b only the lower part of the curves is shown; in Figs. 5c, d the curves are shown to breaking point.) Inspection of these figures (and others not given here) shows tha t the relationship connecting strain and resistance change may have one of the five forms represented by Fig. 6a, b, c, d anti e.
In each case, except for annealed Ferry and copper, the curves show at least one change in sensitivity. This change may be abrupt, as in Fig. 6a and b, or gradual as in Fig. 6d and e, but in every case the final sensitivity is in the neighbourhood of 2, and is achieved after a strain of less than 1 per cent.
Fig. 7 shows some representative results obtained by loading and then unloading the specimen at intervals of strain. I t will be seen that in each case the strain sensitivity in unloading returns to the initiM value.
I t is obvious, therefore, tha t for strain gauges consistent up to high strains the only two possible materials (of those hitherto tested) are Ferry and annealed copper, but copper because of its very low resistance is an unsuitable metal for the purpose.
7

TABLE 1
Approximate Strain Sensitivities of Some Metals
Metal Sensi t iv i ty in
Low Range
H a r d drawn
Sensi t iv i ty in
High Range
Change Poin t
(Strain per cent)
Sensi t iv i ty in
Low Range
Annealed
Sens!t!vi ty In
High Range
Change Poin t
(Strain per cent)
Silver . . . . P l a t inum " ' . . . . Copper . . . . . . . I ron . . . . . . Nickel . . . . . . F e r r y . . . . . . Minalpha . . 10 per cent I r i d ium P la t i num . . 10pe r cent Rhod ium P la t inum 40 per cent Silver Pa l l ad ium . .
2•9 6.1 2 . 6 3 -9
nega t ive 2-2 0 . 8 4 . 8 5-5 0 .9
2 .4 2"4 2 . 2 2-4 2 -7 2-1 2-0 2 .1 2-4 1 .9
0 -8 0 . 4 0"5 0"8
s e e Fig. 5a 0"5 0•6 0 -4 0-5 0 . 8
3 .0 5 .9 2 .2 3 .7
negat ive 2 -2 ' 0 . 6 3 . 9 5.1 0 . 7
2 . 3 2 -3 2 .2 2-1 2 .3 2-2 1 .9 1-9 2 . 0 2 -0
0"2 0 . 3
0 . 5 s e e Fig. 5a
s e e Fig. 5c 0 -3 0 -4 0 .5
The wide variations in the strain sensitivity of different metals (see Table 1) indicate that changes in the structure of metals, due to strain, produce changes in the specific resistance of the material, and the amount of this change is a fundamental property of the material.
At present this phenomenon is obscure, and on some aspects of it there is an urgent practical need for knowledge. The change in resistivity is apparently proportional to strain but no infor- mation is available as to whether the relationship is affected by temperature, i.e., is the strain sensitivity as distinct from the resistance affected by temperature•
The relation between unit change of resistance and strain may be put in the f o r m
~R _ (A + B) ~L (3.121) R L- . . . . . . . . . . . . . .
where A depends on dimensional change and B represents some inhereOnt strain-resistance property of the material.
The difference between the characteristics of hard drawn and annealed wires shown in Table 1 • is evidence tha t the quant i ty (A + B) is related to the previous mechanical history of the wire, and it is obvious tha t careful control in this mat ter is essential for standardisation of the strain sensitivity of gauges.
There is available a very large amount of information on the effect of hydrostatic pressure on electrical resistance; Bridgeman 8 has suggested that the pressure:resistance relation for metals can be represented by a family of curves of the type shown in Fig. 8. Some of the metals examined conform to the portion BA, others to AC of tile curve. Taking the experimental results for change in absolute values of the resistance and allowing for known changes in volume under pressure, the fact is established tha t volumetric strain is accompanied by change in the specific resistance of most metals• The mangallin wire resistance pressure gauge based on the work of Bridgeman is now the standard method of measuring hydrostatic pressure greater than about 500 atmospheres and the technique of its use has been fully explored 13.
3.2. Effect on Gauge Factor of the Geometry of the Gauge Winding.--The values of strain sensi- t iv i ty in Table 1 apply to a gauge consisting of a single strand of wire, and it is to be expected that some modification will be necessary in the case of the multi-strand gauge since a part of the
8

wire filament is perpendicular to the axis of the gauge. This transverse part of the winding is, of course, sensitive to strain at right-angles to the gauge axis, and may be relatively important when the gauge is used in a complex strain field.
As the quantities involved are small, it is reasonable to assume the validity of the principle of superposition in this case, and to consider the total change of resistance as the sum of the separate longitudinal and transverse effects which can be expressed in the form
~R - - F~e~ + F y e y , . . . . . . . . . . . . . . (3.21)
R
where F~ and Fy are the longitudinal and transverse strain sensitivities of the gauge and e~ and ey are the longitudinal and transverse strains.
In the following simple approximate geometrical treatment, it is assumed tha t the total length of wire can be split up into effective lengths along and across the gauge, subject respectively to longitudinal and transverse strain.
Let F be the strain sensitivity of a single wire, r the resistance of wire per unit length.
Then in Fig. 2a, if n is the number of strands,
~1 is the length of wire in longitudinal direction, and w the length of wire in transverse direction.
Then total change of resistance z F r (nle, + wey)
F (Ine~ + w e y ) = F,e , + Fyey . . . . . . . . (3.22) R ~ l + w ,, /
where
F n l a n d F y - - F w . . . . . . (3.23) F , - - n l + w u l + w ""
I t will be observed tha t F, + Fy---- F . . . . . . . . . (3.24)
For the gauge in a simple tension field, where ey ---- --/~e,, ~R/R ---- e, (F , -- /~Fy) . . . . . . . . (3.25)
and the apparent gauge factor F ~ = . F ~ - - /~Fy . . . . . . . . . (3.26)
This is the factor quoted by the makers of commercial strain gauges, and is sufficiently accurate for most applications, since with the normal flat-grid type of gauge, the ratio Fy/F, is of the order of 1/50.
The value of T'y/F~ = k, may be found for any type of strain gauge by~ mounting the gauge on an accurately constructed cube, parallel to one pair of faces; applying load in turn parallel to, and at right-angles to the gauge; and measuring the strains with accurate extensometers 15.
With a single gauge mounted in a general strain field, there is no means of correcting for the transverse strain sensitivity of the gauge. However, if two gauges are mounted at right-angles, the true axial strains can be obtained.
For if e/, ey' are the apparent strains in the two gauges using the nominal gauge factor, and the true strains in their directions are e~ and ey,
e f = (e~ + key)l(1 - - ,uk) . . . . . . . . (3.27) e / = + k¢) / (1 -
9

and hence
e~ = (e~' - . k e , ' ) ( 1 - - ~ k ) / ( 1 - - k '~) . . . . . . . . ( 3 . 2 S )
e, = (e, ' - - k e , ' ) ( 1 - - ~ k ) / ( 1 - - k ~ ) .
The actual error in the strain measurement if we use the nominal gauge factor is
e = k ( a + e y / e , ) / ( 1 - ~ k ) . . . . . . . . ( 3 . 2 9 )
which gives us an error EM in the major principal strain given by
E~ = k{(1 +/*)(eM + e=) -- (1 -- #)(e~ -- e,,) cos 2d}/2(1 -- k)eu, .. (3.210)
where eM, e= are the maj or and minor principal strains, and d is the angle between the gauge axis and the direction of eM.
The maximum error occurs when e~ = e~, and cos 2d = -- 1, and in this case
E~ = k(i + ~)/(1 -- #k) . . . . . . . . . . . (3.211)
Taking k = 1/50, ~ = 0.3, EM is about 3 per cent.
The effect of the transverse sensitivity on the reduction of results from strain gauge readings is discussed more fully in a paper by Baumberger and Hines 1~, and measurements of transverse sensitivities are given in a paper by W. R. CampbelP 5.
The above discussion has been limited to the case of the flat wound gauge, i.e., having the whole of its winding in one plane. For the type of gauge in which a spirM winding has been squeezed flat the loops in the wire at the ends of the gauge length are perpendicular to the plane of the gauge and represent a much smaller proportion of the total wire involved. For this type of gauge the transverse effects on tile gauge factor can usually be ignored as also can the effect due to the small inclination of the strands to the longitudinal axis of the gauge.
3.3. Effect of Gauge Orientation.--Small inclinations (up to 5 deg) of the gauge axis to the direction along which the strain is to be measured are not important, but it is sometimes expedient to deduce the strain e, in a uni-directional strain field from measurements of strain at a considerable angle to XX, for instance, where rivet or bolt holes reduce the length available for straight measurement below that necessary for the gauge, as shown in Fig. 9.
It will be realised that in this. case the use of the nominal gauge factor is not justified since there is now a component of strain perpendicular to the axis of the gauge which was not present in its calibration.
If F0 is the modified gauge factor and Fg is the nominal factor then Fo -= Fg Q where, as derived by Norris F. Dow17, "
(2 = 1 - (1 + ~ ) k ' (1 - ~ ) + (1 + ~ ) c o s 2 0 '
where k' = k/(1 + k), and k is defined in (3.2).
I t has been assumed in the above treatment that the single longitudinal strands are not affected by transverse strains. Owing to the negligible efficiency of the transmission of transverse strain through the layer of adhesive and matrix this is regarded as substantially true, though a report by W. R. Campbell 15 gives isolated instances when this is apparently not the case. It has not been found possible by the present writers and other experimenters to confirm the anomalies quoted by Campbell even with gauges commercially identical with those which form the subject of his experiments.
10 "

3.4. Behaviour of Matrix and Adhesive Layer.--In discussing the behaviour of the gauge backing or matr ix and of the layer of adhesive it will be convenient to take them together since their function is the same, that of transferring the longitudinal strain from the test surface to the wire in the resistance filament. I t is useful at this stage to get some idea of the forces involved in transferring strain from test surface to filament.
An approximate transverse cross-section of a typical fiat-grid type of gauge stuck to a specimen is given in Fig. 10.
I t can be assumed tha t the paper i s impregnated with, and has approximately the same mechanical properties as the adhesive. For the gauge shown the cross-sectional area of the wire in 1 in. width of gauge is 1.57 × 10⁻⁵/sq in. and the load required to produce a strain of 0.5 per cent (E = 20 × 106 ) is 1.57 lb. The total area of matr ix including the layer of adhesive is 5 × 10 .3 sq in. and taking an acetate cement with a value of E of 0.2 × 10⁶ the load required to produce a strain of 0.5 per cent is 5 lb.
The bond between the gauge and the specimen must, therefore, develop two longitudinal shear loads of 6.57 lb each acting away from the centre of the gauge in order to produce a strain of 0.5 per cent (Fig. l l ) .
I t can be shown analytically, and there is considerable experimental confirmation of the fact tha t the shear loads a re ' bunched ' at the ends of the gauge wafer so that the distribution of shear stress will take the form shown at Fig. 12a. From this follows the distribution of longitudinal strain in the plane of the winding shown at Fig. 12b, i.e., the strain over the portion of the gauge containing the winding is constant but somewhat less than tha t in the surface to which it is affixed.
A similar state of affairs holds for the transmission of the longitudinal strain by shear from the wafer to the winding itself except that here the pick-up is helped by the hook effect of the end loops.
Since the strain in the winding is to a large extent put in from the ends and only a comparatively small proportion of the winding is subject to shear, the s t ra in sensitivity is not very appreciably affected by the mechanical properties of the matr ix and the adhesive. The effect for instance of creep in the adhesive itself is to alter the stress distribution at the ends of the winding. This affects very little of the working length of the wire, which accounts for the remarkably low values of hysteresis and creep in the wire resistance gauge even when bonded with mechanically unreliable material, such as cellulose acetate, It accounts too for the fact that the strain sensitivity of the wire resistance gauge can be standardised within such close limits. The limits are closer for comparatively long gauge lengths, since a smaller proportion of the winding is subject to the disturbing end conditions.
Factors which promote, the desirable end effects described above are (a) a high shear modulus for the material of the matrix, (b) end portion s which are longitudinally stiff compared with tha t portion of the gauge
within the gauge length.
I t is clearly desirable to keep the central portion of the gauge as mechanically weak as possible to reduce the total shear force to be transmit ted and thus minimise the demands on the adhesive. For this reason, in the case of the paper-backed gauge the paper should be as thin as possible and the coating of adhesive just sufficient to ensure stabil i ty of the winding.
3.5. Effect on Strain Sensitivity of Imperfect Sticki~g.--From what has been said regarding the importance of transferring the strain from the specimen to the filament v~a the ends of the winding it will be appreciated tha t the technique of sticking the gauge can play an important part. The natural tendency of the gauge to curl upward when adhesive is applied to its lower surface gives rise to a tendency for the bond between gauge and specimen at the ends to be faulty, precisely where perfect bond is most important. Two extreme cases of non-uniform sticking are illustrated in Fig. 13 together with strain sensitivities found (in tension) in each case.
11

The normal batch strain sensitivity of the gauge is 1.98_+2 per cent and it will be observed tha t Whereas the effect of unstuck ends in Fig. 13a is to cause a very serious diminution of the strain sensitivity the unstuck middle portion has a comparatively small effect (that is in tension).
3.6. Calibration.--There are several methods of calibration available, the simplest being a • comparison with a mechanical or optical type of extensometer previously calibrated or, a more
accurate method, comparison with an interference type of instrument. When many calibrations have, to be done, however, it is worth while building special apparatus for the purpose. Probably the simplest and most convenient is a beam bent to a circular arc by four point loading. Such a method is shown diagrammatically in Fig. 14, where a beam with equal loads at its ends X X is supported at points YY symmetrically spa~ed along its span. Thus the portion YY is subject to a constant bending moment and is bent into the arc of a circle. A rider AB, resting on the bar within YY carries a dial gauge to measure the deflection of the beam. Thus if A is the strain on the upper or lower face of the beam and y its half depth it can easily be shown that :---
A -- 2~y L 2
where ~ is the central deflection, and AB = 2L. This result is, of course, independent of the material of the test beam.
A calibrator in use at the Royal Aircraft Establishment is shown in Fig. 15.
Some simple precautions in the design are necessary if the beam is really to be bent into a circular arc between Y and Y. For instance, there must be no longitudinal constraint,, i.e., the beam must be free to slide over the supports Y and Y otherwise the frictional forces there produce a variable moment over the central portion of the beam.
Calibration procedure is to load the beam in several stages to give a maximum surface strain of, say, 0.25 per cent with the test gauges on the tension side of the beam, the quanti tat ive change of resistance and central deflection being noted at each stage. The beam is then unloaded again in stages and readings are taken at the same deflections as in loading. The experiment is repeated with the beam reversed, i.e., the top face now underneath, so tha t the gauges are in compression.
There are limits to the range of strain which can be considered by this method owing to the necessity for keeping within the elastic range of the material of the bar, and for calibration in which the strain exceeds about 0.3 per cent, a comparison with an accurate extensometer is necessary.
In the case of an established method of manufacture, a batch calibration (say 2 per cent of production) is usually all that is necessary, but the early stages of the development of a manu- facturing procedure, or subsequent changes in established procedure, should be accompanied by strain sensitivity determinations on very large numbers of gauges, so that the variation, as well as the mean value, of the strain sensitivity may be known.
4. Resistance Changes not due to Externally Applied Strain.--The effect of strain on the wire resistance gauge has been discussed, and it is apposite at this point to give some consideration to the effects of disturbing influences whose magnitude may be important in relation to the effect of the strains to be measured. These effects will be discussed in the following order : - -
(a) Incomplete drying of matrix and adhesive. (b) Humidity. , ' (c) Changing temperature. (d) Internal readjustments in gauge structure.
4.1. Effect of Incomplete Drying.--When a cellulose acetate bonded strain gauge of the type shown in Fig. 2a, in which the initial tension in the gauge wire is very small, is first affixed, it will be observed tha t its resistance s tar ts to rise, reaches a maximum value, and then falls more slowly
12 °

until it reaches a steady value somewhat higher than the original one. This resistance sequence corresponds to a sequence of volume change in the matr ix involved in the exchange and subsequent evaporation of the solvent in the adhesive.
When the gauge is first stuck to the metal surface, the free solvent in the layer of adhesive between gauge and specimen percolates into the dry adhesive of the ga.uge matr ix itself, causing the latter to increase in volume and setting up a tensile stress in the wire. At this stage there will be little resistance to this volume change since the adhesive has not yet developed an appreciable bond to the test surface. The point at which this exchange is complete corresponds to the maximum value reached by the resistance. After this point the total amount of solvent in the gauge is gradually reduced by evaporation from the outer surface, the matr ix shrinks and the resistance falls to a value, 0.1 to 0.2 per cent above the original. The failure to return completely is due to the fact that at some point during the sequence the free adhesive at the edges of the gaug e is completely dried and hence the ends of the gauge became completely stuck, so tha t subsequent shortening is resisted, i.e., the gauge is in tension.
• Following the above lines we can find an approximate theoretical expression for the change of resistance of a gauge in drying. We assume that the changes in the volumes of the matr ix and adhesive are proportional to the concentration of solvent in them, that the concentration of solvent is uniform respectively throughout the matrix and the adhesive, and that the rate of transfer of the solvent across any surface is given by Aq(~ - - /3), where A is the area of the surface, ~ and/3 the difference in concentration on the opposite sides, and q a constant.
Then, if we take V as the
k V ,, A
volume of adhesive under the gauge, volume of gauge matrix, surface area of matrix, surface area of free adhesive, rate of evaporation from free surface of adhesive over
rate of evaporation from surface of matrix,
and assume that the change of resistance of the gauge is directly proportional to the change of the matrix, we can show that, after a time t,
b R / R = KEe ~IAq'/v - - e~'Aq'/v I . . . . . . . . . . . . (4.11)
where t,1, ~,2 are roots of the equation
#2 + ~(2/k + ~a/A + 1) + (2;a /A + 1)/k= 0
and K is a constant.
A curve calculated from this equation is shown in Fig. 16a together with experimental curves. The difference between the latter part of the experimental and theoretical curves is due to the fact tha t in the theoretical work we made no allowance for the stiffening of the adhesive and consequent tension in the gauge.
A gauge of the same general type but in which there is known to be a fa i r lyhigh initial tension in the gauge wire gives a time-resistance drying curve of the type shown in Fig. 16b. At first glance these differ considerably from the curves in Fig. 16a, but if allowance is made for the slacking of the bond between the matr ix and the gaug e wire as the solvents enter the matrix, the curves are seen to be of the same general type.
The complete drying-out time is usually several times that required for the adhesive to develop the shear strength and bond necessary to give full strain sensitivity ; so that, although short tests may be carried out after some 24 hours drying under normal conditions when the total drift during tile test is unimportant, the start of a protracted test should be delayed until the resistance of the gauge has reached a steady value (see section 6.1). Several methods of reducing the drying-out time have been used with varying degrees of effectiveness.
1 3

The discreet use of a domestic electric iron when the position of the gauge does not preclude it, is one convenient method. I t is advisable, if the gauge has no felt cover, to interpose a thin layer of felt between iron and gauge when using this method, otherwise the filament of the gauge may be displaced.
A hot-air blower is also effective and has the additional advantage of providing a turbulent state in the air above the gauge, thus further promoting the process of evaporation from the gauge surface.
In some instances a gauge is in a recess or pocket which traps the vapour from the solvent and thus slows down the process of evaporation. Cases of this kind have been noted in which drying out has been incomplete even after several weeks. In such cases the hot-air blower provides an effective remedy for the b.ad drying conditions. I t has been observed that gauges on the under side of a horizontal surface dry more slowly than those on the upper side.
When the utmost freedom from zero instabil i ty due to incomplete drying is required and the specimen is small enough to be stoved in an oven, a prolonged baking is desirable ; the following baking sequence is that recommended by the makers of the Baldwin-Southwark gauge.
Step 1 Air dry at about 70 deg F for 2 hrs. Step 2 Oven dry at 110 deg F to 120 deg F for 3 hrs. Step 3 Oven dry at 160 deg F to 170 deg F for 8 hrs.
The actual periods of baking will depend a good deal on the construction of the gauge, but for all gauges stuck with cellulose cement, baking at about 160 deg to 170 deg F for a period of days will increase their stability.
I t is important that the application of heat to the drying gauge is not too drastic, otherwise the solvent vapour will form bubbles under the gauge introducing a new set of disturbances.
The final gauge resistance is rather variable and depends on the amount of adhesive used, its proportion of free solvent, (i.e., its consistency), as well as the effectiveness of the process of evaporation from the gauge surface. Thus two gauges of identical initial resistance may after sticking vary by as much as 0.3 per cent. In cdnsidering the question of temperature effects, it will be seen that an external balancing resistance introduced to preserve a fixed zero in the indicating apparatus will in general, upset the conditions for complete temperaturecompensation. While for most work this effect is comparatively unimportant, in cases where the utmost precision is required under conditions of widely varying temperature, some at tempt must be made to secure uniformity in respect of the final value of the resistance of the gauges in the arms of the bridge. If this point is appreciated the methods to be adopted are fairly obvious. The gauges must be affixed at the same time, using the same adhesive, the amount being regulated by the pressure applied to the gauge when it is affixed and during the early stages of drying. The conditions of drying must be made the same, tha t is the gauges should preferably tie in a vertical plane, go through the baking sequence at the same time and be subject to the same conditions of ventilation.
4.2. Effect of Char~gi~g Humidity.--The effects of humidi ty on the wire resistance strain gauge are due to the absorption of moisture by the matrix, and layer of adhesive. There are few organic materials tha t do not suffer changes in their mechanical and electrical properties to a greater or less extent with changes in humidi ty and it is unfortunately a fact that up to the present, materials whose general properties make them most suitable for use as a matr ix or adhesive are particularly susceptible to moisture.
Moisture may affect a gauge in several ways ; firstly, its absorption by the matrix and adhesive. may cause a reduction of the resistance to earth ; secondly, the presence of moisture may cause electrolysis when a current is passed through the gauge, and consequent corrosion of the gauge filament; a n d thirdly, the mechanical strength of the bond may be reduced by the absorption of moisture.
14
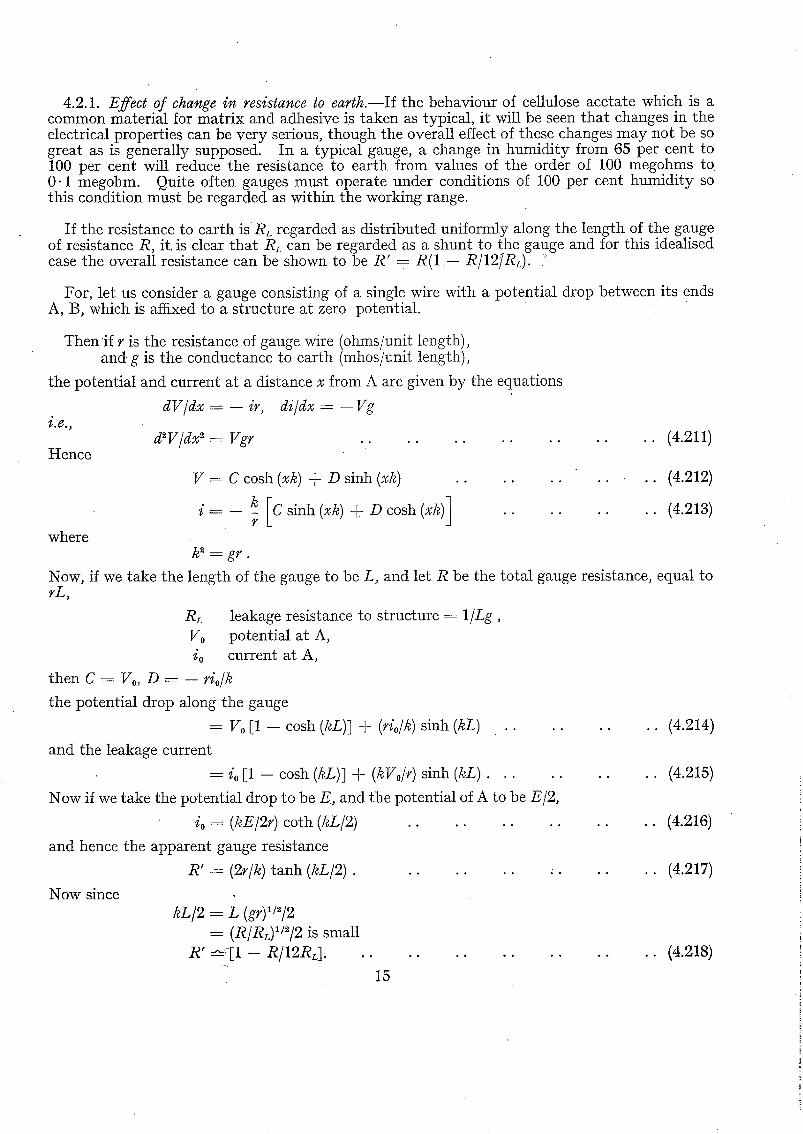
4.2.1. Effec t o f change in resistance to e a r t h . - - I f the behaviour of cellulose acetate which is a common material for matrix and adhesive is taken as typical, it will be seen tha t changes in the electrical properties can be very serious, though the overall effect of these changes may not be so great as is generally supposed. In a typical gauge, a change in humidi ty from 65 per cent to 100 per cent will reduce the resistance to earth from values of the order of 100 megohms to 0-1 megohm. Quite often gauges must operate under conditions of 100 per cent humidi ty so this condition must be regarded as within the working range.
If the resistance to earth is RL regarded as distributed uniformly along the length of the gauge of resistance R , it. is clear tha t RL can be regarded as a shunt to the gauge and for this idealised case the overall resistance can be shown to be R ' = R(1 -- R/127RL ). ~
For, let us consider a gauge consisting of a single wire with a potential drop between its ends A, B, which is affixed to a structure at zero potential.
Then i f r is the resistance of gauge wire (ohms/unit length), and g is the conductance to earth (mhos/unit length),
the potential and current at a distance x from A are given by the equations
d V / d x = - - ir, d i /dx = - - Vg i.e.,
d ~ V / d x ~ = Vgr . . . . . . . . . . Hence
where
V = C cosh (xk) + D sinh (xk)
i -- k r I C sinh (xk) + D cosh (xk)]
. . . . (4.211)
. . . . (4.212)
. . . . (4.213)
Now since k L / 2 = L (gr)i/2/2
= (R/RL)I/~/2 is small R' -----':[1 -- R/12RL] . . .
15
. . . . ( 4 . 2 1 8 )
k 2 = g r .
Now, if we take the length of the gauge to be L, and let R be the total gauge resistance, equal to rL ,
RL leakage resistance to structure ---- 1 / L g ,
V0 potential at A, i0 current at A,
then C = Vo, D = - - rio/k
the potential drop along the gauge
= V o [ 1 - cosh (kL)~ + (rio/k) s i n h ( k L ) . . . . . . . . (4.214)
and the leakage current
= i 0 [ 1 -- cosh (kL)] + (kVo/r) s i n h ( k L ) . . . . . . . . . (4.215)
Now if we take the potential drop to be E, and the potential of A to be El2 ,
io = (kE/2r) coth (kL/2) . . . . . . . . . . . . (4.216)
and hence the apparent gauge resistance
R ' -= (2r/k) tanh (kL/2) . . . . . . . . . . . . . (4.217)

TABLE 2
R ohms
R L
megohms RI
ohms
120 120 120
100 0.1
120 120(1 --10 -7 ) 120(1 --10 -4 )
Thus a change in RL from 100 megohms to 0" 1 megohm will give a proportionate change in overall resistance in a 120-ohm gauge of 10 -7 to 10 -4 which corresponds to a stress change in Duralumin of 500 lb/in 2. If a dummy gauge is used for temperature correction this also will be affected, in the same way, though not necessarily in practice to exactly the same extent, and the net effect is likely to be small, leading to the conclusion tha t changes in electrical properties due to moisture are not likely to be important. The observed serious effect of moisture must therefore be due to the remaining factors.
4.2.2. Electrolysis Effect.--A gauge may be immersed in water for long periods without showing any very marked change of resistance, so long as no curreflt passes through it. If, however, a current is passed through a gauge submerged in tap water an effect such as that 'shown graphically in Fig. 17 is observed leading eventually to complete failure. While the increase of resistance is taking place, bubbles may be seen rising from some part of the gauge winding, and if after such treatment the gauge is examined under a microscope, corroded patches on the gauge wire are observed. I t is, therefore, c l ea r tha t the increase of resistance is due to electrolytic corrosion of the gauge wire.
The rate of the effect varies according to the nature of the water. Fig. 17 gives results for tap water. For distilled water the corrosion is very much slower, and for salt water, very much faster. This probably accounts for difficulties experienced in using gauges on or near the sea.
The effect is most rapid where a portion of the gauge wire has become detached from the gauge matrix, a thing which may easily happen to .a cellulose-based gauge if it is carelessly handled in sticking.
4.2.3. Effect on mechanical properties of changing humidity.--A typical test on cellulose acetate sheet gives an increase in linear dimensions of 4 per cent to 5 per cent for a humidi ty change from 65 per cent to 100 per cent. The large changes of resistance tha t would be expected in a gauge for the same change of conditions due to this cause are not, in fact, observed, and therefore, it appears likely tha t shear stresses between the matr ix and specimen are much increased when moisture is absorbed by the matrix. I t is known that the strength and Young's Modulous of cellulose acetate decrease with humidity, and this reduction would have the effect of reducing the efficiency of the strain transmission in the matrix of a strain gauge, thus reducing the sensitivity. This effect, in addition to that just mentioned, accounts for the observed serious reduction in strain sensitivity under humid conditions and for the fact tha t a prolonged exposure to 100 per cent humidi ty reduces the strain sensitivity to zero. In many cases subsequent prolonged drying of the gauge restores the sensitivity to its original value though this is not always the case; repeated wettings and dryings finally cause the gauge to become detached entirely. Any unprotected gauge tha t has been subject to excessive humidi ty must be regarded as suspect.
The fact tha t the absorption of moisture by the material of matrix and adhesive will ul t imately break down the bond between gauge and metal forms the basis of a technique for removing gauges for re-use. Since water is rather difficult to get rid of, once it has been absorbed, alcohol is used and the process consists of strapping over the gauge a pad of cotton wool soaked in alcohol. After some ten minutes the gauge can be removed quite easily by inserting a safety razor blade under it.
16

The properties desirable for an adhesive for strain gauges are : - - (a) A good bond to metal. (b) Considerable mechanical strength. (c) Elasticity. (d) Ease of application. (e) Repellent to water.
Cellulose acetate is generally used since it satisfies (a), (b), (c) and (d). As it does not satisfy (e), waterproofing for a cellulose acetate gauge is essential.
Other materials which have been tried, because they satisfy (e), are either difficult to apply (e.g., require baking, such as Bakelite) or else do not bond to metals (e.g., polystyrene).
4.2.4. Waterlbroofing.--For precise work some system of waterproofing is desirable even under laboratory conditions; while for work in the open it becomes absolutely necessary. Even a change of humidity of the order of 10 per cent will produce a measurable change of resistances in an unprotected gauge, and sudden changes of temperature are liable to be accompanied by the deposition of moisture on metal structures giving conditions approximating to 100 per cent humidity on t h e surface to which the gauges are affixed. The zero drift which usually accompanies absorption of moisture is due to tile difference in the effect between gauge and dummy, and is an indication tha t moisture is at work in the gauge, with possible effects on the strain sensitivity. I t sometimes happens, however, that the humidity effect is nearly the same in gauge and dummy, and the absences of zero drift gives no warning of possible inaccuracy in .the value of strain sensitivity.
I t is considered, that in view of the small amount of extra labour involved, routine waterproofing is very well worth while, and where the installation isl ikely to be in use 6ver a considerable period it becomes essential in this climate even for work in the laboratory.
The principal desiderata for a waterproofing material are: (a) Ease of application. (b) Absence of shrinkage effects on application. (c) Small mechanical strength in order not to interfere with the action of the gauge.
Many methods have beeI1 tried and rejected for a variety of reasons ; the following are the four which have been found to be most generally useful.
(a) DiJell Method.--DiJell is a petroleum wax in paste form with a comparatively low melting point and almost no mechanical strength. I t can be smeared over the gauge and a reasonable amount of the surrounding test surface with the finger ; though somewhat messy it is completely efficacious. It can be obtained in a range of stiffnesses, DiJell 171 being a generally useful grade. Its bond to metal is very good, and there seems to be no tendency for moisture to seep gradually between film and metal. Surplus wax of course melts off if the temperature rises unduly but the film that is left seems to fulfil its function as well as tile thicker coating. If the messy finish is objectionable, the whole Coating can be covered by a strip of polythene tape. Since DiJell is a petroleum wax it is soluble in petrol, so where there may be danger of accidental splashing with petrol or mineral lubricating oils the polythene tape strip is useful in affording a certain amount of protection.
Gauges protected with DiJell have been worked satisfactorily for long periods completely immersed in water. I t is essential, of course, to extend the protective coating over tile gauge leads and the insulat ing' spats ' which cover the joints between tile leads and the connecting cable.
(b) Hot Wax Method.--This method, while reasonably efficacious, has a limited application since for really good results the whole metal surface must be made hot (60 deg to 80 deg C). The hot wax applied to a colder metM surface with a brush does not stick well, and the poor bond resulting from the method of applic-ation allows moisture to penetrate under the film. The resulting protecting film given by a hard wax properly applied is superior in finish to Dijell, but the greater stiffness of tile wax and its very large setting contraction are liable to introduce complications.
17 (51501) B

Among waxes which have been found reasonably efficacious where applied to a hot surface are Petrosin and Cerrasin and Okerin 0.576. Ordinary paraffin wax crystallises in setting and after a time is not impervious to moisture.
(c) Shellac Japan . - -Severa l coats of a thin shellac japan have been found to give reasonably good results. If the shellac is applied too thickly the contraction in drying out causes the film to leave the metal and to crack. A secondary effect, due to the absorption by the gauge of some of the solvent in the japan, is a change in the gauge resistance. A further drying time should there- fore be allowed till this solvent exchange is complete.
(d) Silica gel.--Since silica gel crystals are very hygroscopic a heap of crystals on the gauge, the whole covered by a metal lid, will prevent the absorption of moisture by the gauge. This method has given good results, but is rather clumsy in use, since the lids must be firmly fixed to the specimen, and the crystals must be renewed at fairly frequent intervals.
4.3. Effect on Resistance of Changing Temlberature.--The change in resistance, when the tempera- ture varies, of a wire resistance strain gauge glued to a test piece is made up of the separate effects due to
(a) change of resistivity of the wire of the gauge, (b) differential change in length due (in general) to the different coefficients of linear expansion
of the wire of the gauge and the specimen.
There will be a secondary effect due to the different coefficient of expansion of the material of the matrix but since the layer between wire and test surface is usually of the order of only 0.002 in. it is not to be expected that the differential expansion of the material of the wafer will play a very important part except in so far as its elastic properties vary with temperature. Ignoring this latter effect the change of resistance for a temperature rise from to to tl will be:
Ro(tl -- to) [o~ + ks (a, -- a~)] . . . . . . . . . . (4:31)
where c~ is the temperature coefficient of resistance of the gauge wire, a, ,, coefficient of linear expansion of specimen,
D
a~ ,, coefficient of linear expansion of gauge wire, k ,, strain sensitivity of gauge wire,
and s is a shear lag term to allow for the fac t that the strain in the wire is slightly less than that in specimen. The value of s is usually of the order of 0 .97.
The above expression requires some modification for the period during heating up of the gauge, since the portion of the specimen immediately under the gauge winding reaches a higher tempera- ture than tha t of its surroundings, due to the heating effect of the current in the gauge. The temperature gradient in the test surface in general, will be accompanied by a stress gradient which will result in a modified value of a,. I t should be emphasized tha t the expression for change Of resistance with change of temperature only applies after the warming up period.
The curves in Fig. 18 (1), (2) and (3), give the results of some experimental determinations of the effect of changing temperatures on, the resistance of standard Ferry wire gauges from the same batch affixed to Duralumin, steel and beryllium copper respectively.
A comparison of curves (1) and (4) is interesting. Both gauges were wound with Ferry wire and stuck to Duralumin but the wires were taken from different batches. In one case the resistance increased, in the other decreased, and it is found that over a range of wires of nominally identical composition, the temperature effect varies considerably over a restricted range from positive to negative.
I t is known that the temperature coefficient of many of the resistance alloys is very susceptible to minute changes in composition and, it is believed, to variations in the operation of wire drawing.
18

This fact suggests that, if the variation in the temperature coefficient could be controlled, it should be possible to produce resistance wires of the copper-nickel type to give a gauge whose resistance is independent of temperature. Since the linear coefficient of expansion vanes from metal to metal it would of course, be necessary to use resistance wires with different temperature coefficients for use on different metals. For instance, considering copper-nickel gauges stuck on Duralumin and steel whose linear coefficients of expansion are respectively 12-9 x 10 -G, 6.28 x 10- 6 and taking the linear coefficient of copper-nickel as 9.5 × 10- ~ (all per deg F), then the value of the temperature coefficient of resistivity would need to be -- 6.56 x 10⁻⁶ for the gauge for use with Duralumin and + 6.1 × 10 -6 for the gauge for use with steel.
The above arguments only apply, of course, to resistance alloys whose coefficient of resistivity is small and which can be negative.
,In the absence of the self-temperature compensating gauge it is almost universal practice to use a dummy gauge, identical as far as possible with the active or measuring gauge, stuck to a slip of the same material as the test specimen.
In view of the wide variation possible in the thermal effects in resistance discussed above, it is essential tha t the dummy gauge should be taken from the same batch made from the same reel of wire as the active gauge.
An alternative method of gauge construction which will give self compensation for temperature changes is to use two wires, one with a positive the other with a negative temperature coefficient of resistance. With combination of nichrome and copeP (the lengths of each wire being fixed by their relative positive and negative resistance temperature coefficients) their relative expansion with respect to the material of the test surface can be made to give a gauge whose resistance is independent of temperature change (but only for the test material for which it is designed) i
4.4. Minor Resistance Changes due to Internal Readjustment of the Gauge Strueture.--The effects of changing temperature and hmnidi ty on the wire resistance strain gauge have been discussed in some detail, and between them these disturbances may be said to account for the major errors in the measurement of strain by this method. There are some effects of a lower order of magnitude, which while not so impor tan t for ordinary work, must be considered when accuracies better than + 2 per cent are desired. These effects are generally the result of t h e ' settling down ' of the internal structure of the gauge with time or with changing external conditions.
Referred to generally as ' drift ' and hysteresis, these effects are of three kinds" (1) Zero drift or movement of the balance point with zero strain in the test surface. (2) Drift under load. (3) Hysteresis effects or zero shift due to loading.
4.4.1. Zero drift during warming up and after temperature stabilisation.--(a) During warming up. - - W h e n the current is first switched on to a gauge and its dummy, it is usually found that there is a steady movement of the balance point in one direction during the period of warming up. This is due to the fact that , in general, the heat dissipation conditions are not the same in the gauge and the dummy-- the latter being usually stuck to a small slip of meta l - -and the internal temperature of the latter is, therefore, usually higher than tha t of the gauge. Both gauge and dummy ult imately reach a steady internal temperature. Typical curves showing the differential change of resistance between a gauge and dummy during warming up are given in Fig. 19a for three values of the operating current.
This warming up effect may produce a positive or negative movement of the balance point depending on whether the temperature coefficient of the gauge and dummy is positive or negative, and the duration of the warming up period depends on the operating current in the circuit.
I t is not generally realised tha t the varying difference of internal temperature of gauge and dummy, due to variation of operating current may account for considerable movements of the balance point. A typical curve of zero shift with changing current is shown in Fig. 19b. The
19 (5x5oi) ~ 2

magnitude of the effect just described clearly depends on how near ly identical are t h e heat dissipation conditions in gauge and dummy, and is bound up with the size of the dummy slip and how the latter is mounted.
The foregoing discussion emphasises the importance of providing close voltage stabilisation of the current supply to the gauge and dummy even when using a null method.
(b) After temperature stabilisation.--A further form of zero drift shows itself as a reduction with time, of the gauge resistance or an apparent compression. Its importance depends on the amount and kind of adhesive used, the preciseotechnique of sticking, and on the previous strain history of the gauge subsequent to glueing to the specimen. I t is found to increase rapidly with increasing ambient temperature and with higher operating currents. T h e a m o u n t of this drift varies considerably from gauge to gauge so that even when a dummy gauge is used the effects do not necessarily cancel each other.
There are two possible reasons for this drift, assuming tha t there are no changes in the electrical properties of the wire filament itself with time"
(a) Changes in the matr ix and adhesive with time. (b) Relief of the initial sticking stresses in the gauge.
I t is known that materials of the cellulose acetate type undergo small changes in their mechanical properties during ageing, and this is reflected in the behaviour of the strain gauge, as a change in the strain sensitivity of the order of 0.1 per cent, over a period of some months. The volume changes likely to be associated with change in mechanical properties--volume decreasing with age--would have some small effects on the resistance of the gauge over very long periods, but certainly would not account for the zero drift that can be observed over a period of a few hours. I t seems probable that the major part of the effect is due to initial stresses in the gauge.
I t has been shown (see section 4.1) that when the gauge is stuck to the specimen there is initial tension in the gauge wire with its accompanying transmission shear and hook stresses at the ends of tile filament. The passage of current through the gauge raises the temperature of the filament and of the matr ix in its immediate neighbourhood, and, under the initial stresses, ' creep ' takes place, its rate depending on the magnitude of the initial tension, the current passing and the conditions facilitating heat dissipation--the two last named factors fixing the temperature at the surface of the wire.
I t will be realised tha t the problem of reducing zero drift is not so much the complete elimination of resistance change in the measuring gauge as achieving equality between tha t in tile measuring gauge, and tha t in the compensating gauge. This problem is really to standardise the initial tension--a t as low a value as possible--in the two gauges of the pair ; and to produce, as far as possible, identical heat dissipation conditions in the gauge and the dummy.
The initial tension in both gauges can be reduced to a very small value by prolonged baking (about 3 to 4 days) at about 70 deg C while the normal operating current is passing. The normal drift is increased by the elevated temperature, and approaches zero asymptotically.
The heat dissipation from tile surface of the filament is a function of the thickness of the layer of matr ix and adhesive between filament and test Surface through which most of tile heat dissi- pation occurs. Therefore, it is highly important to standardise this thickness in the case of gauge and dummy by subjecting both gauges during sticking to the same pressure. (About 2 lb is a suitable value for this pressure.)
I t has been observed tha t there are wide variations in the amount of zero drift from gauge pair to gauge pair, and it is not possible to give a close estimate of the amount that should be expected. With normal sticking technique and in the absence of the more elaborate precautions enumerated above, the drift expressed as a value of strain should not exceed 10 -5 in 24 hours - - tha t is at normal
20

operating currents. This can be reduced almost indefinitely by reducing the operating current, but involves the disadvantages associated .with the more highly sensitive ancillary measuring apparatus necessary.
4.4.2. Drift u~der load.--It has been observed in calibration tests such as those described in section 3.6 that there is a kind of reverse hysteresis in wire resistance strain gauges ; for example, in a tension test, under increasing load the readings of resistance are slightly greater than the readings of resistance as the load is removed. I t appears that when a gauge is strained the change of resistance overshoots the mark and then gradually slips back to the ' t r u e ' value. This happens whether tension o r compression is applied, and also when either is removed. There is not a great deal of information available on this subject, but the following may be stated with a fair degree of certainty : - -
(a) At least for small strains, the amount of overshoot is proportional to the ioad which has been applied, i.e., the overshoot will be the same if the strain is increased from 0 to 0.05 per cent strain, or if it is increased from 0.05 per cent to 0.1 per cent, given the same gauges under the same conditions.
(b) The amount of overshoot is less if the load is applied slowly. (c) The effect appears to decrease for gauges of greater gauge length. (d) At least with gauges bonded with cellulose cements the amount of overshoot decreases
with temperature.
(c) and (d) suggest tha t the cause of the drift is creep in the adhesive Since at lower temperatures the adhesive is stiffer, and for longer gauges the shear stresses in the adhesive are lower. On the other hand, similar phenomena have been observed in unbonded gauges, which would seem to lay the blame on the gauge wire. However, even in unbonded gauges the wire is bonded to the pegs round which it is wrapped, and it is possible tha t the drift may be in this bond.
The drift from the overshoot is asymptotic, and the greatest amount takes place in the first few minutes after the load has been applied. I t is therefore advisable that for precision measure- ments with strain gauges the load should be applied so tha t the increments of strain are approximately equal, and the readings should be taken at a fixed time after the application of the load.
The amount of overshoot is of the order of 2 per cent of the total strain with cellulose-bonded gauges at room temperature, and most of the return drift is accomplished in the first few hours after the load is applied. The drift is considerably less with Bakelite-bonded gauges of the same types.
4.4.3. Effect of temperature o~¢ creep u~der load.IThe very marked effect of temperature on creep in plastics under load would be expected to find a reflection in the behaviour of the loaded wire resistance strain gauge.
The curves in Fig. 20 give the results of tests on a cupro-nickel acetate gauge on a Duralumin specimen with a constant strain of 0.2 per cent. The creep in the resistance change--progressively greater with increased temperature and more marked in tension than in compression--is due presumably to the gradual breakdown in the strain transmission from test surface to gauge filament.
This type of creep is distinct from that discussed in the previous section. The gauges whose drift is shown in Fig. 20 still continued to hold their gauge factor, up to 95 deg C, if the change of resistance was measured immediately after loading, and even exhibited the negative hysteresis discussed above, but it is plain that at the higher temperatures the drift from the overshoot is swamped in the slackening of the bond.
The effects even after four hours are serious. At 95 deg C for instance the creep in the compression gauge corresponds to a fictitious falling off of the strain of some 11 per cent of its true value while for the tension gauge the corresponding figure is 16 per cent.
21

The different amounts of creep in tension and compression may result from an initial tension in the gauge filament due to thermal expansion of the Duralumin test-piece. The actual strain in tension will be higher and in compression will be lower than the indicated value with corresponding effects on the creep in the two instances. For a gauge with an initial tensile strain of 0.1 per cent on the filament, an applied strain of 0.2 per cent, and a rise in temperature of 80 deg C, giving a differential strain of 0. 075 per cent, the actual strain on the filament will be 0.375 per cent in tension and 0. 025 per cent in compression.
5. Current Carrying Capac i t y . - - I t is evident that since the signal due to change of resistance of the gauge is proportional to the current it is carrying, the allowable value of the latter should be as large as possible. The limit to the gauge current is set by the allowable rise in temperature of the wire, or rather temperature of the matrix in immediate contact. In discussing the mechanism of strain transmission from test surface to filament, the existence of high concen- trations of stress at the ends of the latter was pointed out, and it is clear that the mechanical deterioration of the material of the matrix at a high temperature would result in a less efficient strain transference and a reduced strain sensitivity for the gauge.
If the normal working current is applied to a gauge ~ot cemented to a test-piece, the gauge will show definite signs of overheating.
5.1. Self-heating of Gauge . - -Tak ing the case of a standard low resistance gauge in which the spacing of the strains of the filament is of the order of ten times the diameter of the wire itself, it appears reasonable to neglect the mutual thermal interference of adiacent strands and confine the argument to a single length of wire.
The gauge reaches its (constant) working temperature when the rate of heat generation in the winding becomes equal to the rate of heat dissipation from the filament to its surroundings.
An expression for the allowable current for a given set of conditions can be found as follows : - Let a be the cross-sectionai area of gauge wire,
p ,, perimeter of gauge wire, e ,, specific resistance of wire,
,, current in gauge, T ,, temperature of gauge wire,
and T A , , ambient temperature.
Then, when stable conditions of temperature are reached, the rate of heat generation must be equal to the rate of heat dissipation from the wire filament, i.e.,
i2e/a = K ( T - TA)p . . . . . . . . . . . . . . (5.11)
where K is a constant.
That is, for a given set of cooling conditions, the allowable value of i is given by
i = K~ / (pa / e ) where K is a constant . . . . . . . . . (5.12)
For a circular section, this gives
i ---- (K~/2) ~/(d~/e) . . . . . . . . . . . . . (5.13)
Little knowledge is available of the allowable temperatures for various metals, of or the constants associated with any given set of cooling condi.tions, but a few general conclusions may be drawn from equation (5.12).
Actual working experience--rather limited in extent--suggests that for ordinary room temperatures, and when the gauge is affixed to a specimen of fair size, a value may be tentatively assigned to K in (5.13) which gives
i = 8000 . V / ( C P / O ) . . . . . . . . . . . . (5.i4)
where i is in amperes, d in inches, ~ in microhms per cm cube.
22

Table 3 below gives values of allowable current in milliamps for wires of cupro-nickel, and niehrome (nickel-chromium, or nickel-chromium-iron) for wires of diameter 0. 0005 in., 0.001 in., 0.002 in.
TABLE 3
Diameter (inches)
Allowable current (mA)
Cupro-Nickel Nichrome
0.0005 0.001 0.002
12"5 35
100
9 25 70
These results only apply to gauges in which the filament strand spacing is more than 6 times the wire diameter, and must be modified for closer winding. For instance with 1 rail diameter Eureka wire wound at a spacing of 2 rail the allowable current falls to 5 milliamps.
Increase in the wire d iameter and reduction in its specific resistance increase the allowable current. Limits to the increase in wire diameter are fixed by the fact that the shear forces necessary to produce a given strain in the filament increase as tile square of the diameter while the area resisting these forces increases only as the diameter itself. In other words the transmission stresses vary as the diameter, and increasing tile filament wire diameter lowers the point at which the transmission breaks down and the gauge becomes non-linear.
For cases in which the strain to be measured is small, in which there is no danger of mechanicM breakdown in the strain transmission a case can be made out for the use of wire of larger diameter.
5.2. Filament of Rectangular Section Wire.--Even the fine wires used for strain gauge filaments can be rolled down to approximately rectangular section and although some difficulties are introduced in the manufacture of gauges from this wire it possesses many advantages.
Difficulties in obtaining wire of ribbon section have precluded its use up to the present; no information is therefore available of its performance in practice, but it is worth while to examine its theoretical advantages.
The expression (5.12) becomes in tile case of a rectangular section of thickness t, width rot, area m# and perimeter 2t(1 + m).
i : K d ( 2 m t ~ ( l + m) ) (5.21) t . . . . " " " " ° ° ° °
i.e., if we have a rectangular-section wire, and a circular-section wire of the same material and cross-sectional area, and assuming the same conditions of heat dissipation in each case, the ratio of their current carrying capacities is given by the expression
(1 + m)ll2/(um 1/4) . . . . . . . . . . . . . (5.22)
Hence, if for example we take m = 10, the value of expression (5.22) is 1.40, that is the current carrying capacity is increased by 40 per cent ; and if we take m ---- 40, tile increase is 95 per cent. These values of m give about the thinnest strips which can be handled whose areas are equivalent to those of circular wires of diameter 0. 001 in. and 0" 002 in. respectively.
These results assume that the efficiency of the heat dissipation4s the same in each case ; but in practice it is to be expected that the efficiency would be greater in the case of tile rectangular wire since there is in this case a considerable area of tile wire actually parallel to the test surface to which most of the heat flows, i.e., the figures quoted above are probably conservative estimates.
23

Another advantage of the rectangular section wire lies in the decreased value of the ratio a/p, as compared with the circular section. The shear stress in the matrix necessary to produce the strain in the gauge is a linear function of this ratio ; therefore, it is desirable to decrease its value as much as possible.
Now for a circular section wire qc ~ K d . . . . . . . . . . . . . . . . . . (5.23)
where K is a constant ; and for the equivalent rectangular strip qs = K d V'(zm)/(1 q- m) . . . . . . . . . . . . (5.24)
i.e., in the first case considered above, where d ---- 0.001 in., and m ---- 10, qcl----K × 10 -3 ,q,1----0-51K × 10 -3
and in the second case where d ---- 0.002 in., and m ---- 40, q 0 2 = 2 K × 10 -3 , q,~----0.55K × 10 -~
i.e.~ q01 : q,1 : qc~ : q,2 ---- 1 : O- 51 : 2 : O" 55 . . . . . . . . . . . . . (5.25)
Considering the advantages of the rectangular section filament from the point of view of rise in surface temperature for a given value of the current and a given material we have from the equation (5.1 l)
1 . . . . . . (5.26) that ( r - . . . . .
Considering the ratio of the temperature rises for a given operating current for a circular wire and for equivalent rectangular wires with m = 10 and m = 40 the ratio will be seen to be 1 : 0 . 5 1 : 0 . 2 7 5 .
When the drift in the gauge under load--a function of stress and temperature--must be a minimum, as in most instrumental applications the advantage of the rectangular-section filament becomes outstanding especially for high values of strain. A comparison of the circular wire and an equivalent rectangular one with m = 10 shows that both the maximum shear stress and the surface temperature of the wire are reduced by some 50 per cent.
From the above purely thermal consideration, it is evident that for any given section of filament wire the current carrying capacity can be increased by increasing the cross-section of the wire and using materials with lower values of the specific resistance, both of which alterations lower the total resistance for a given total length of filament. The implications of this statement cannot be discussed apart from over-all circuit considerations.
5.3. Effect of Current and Resistance on Output S igna l . - - I t will be useful to consider the effect of gauge current and resistance on the output signal from the gauge for
(a) current-sensitive indication, (b) voltage-sensitive indication.
5.3.1. Optimum resistance value . - -The small signals given by the wire resistance gauge are its fundamental disadvantage, and there is a general belief that by increasing the resistance of the gauge the signal for a given strain can be increased almost indefinitely. This is only partly true, since, for a gauge of given external dimensions, increase of resistance can only be obtained by reducing the diameter of the wire, using wire of high specific resistance or by close winding. All these methods reduce the current carrying capacity, and this reduction may offset the gain due to the increased resistancel
In the absence of sufficient experimental data concerning the effect of wire spacing on the current carrying capacity, it is impossible to formulate general statements on the optimum resistance, but a single example will give an indication of the effect mentioned in the preceding section. It is known that, with a 100-ohm gauge made with l-rail diameter cupro-nickel wire
24

spaced at 20 rail, the allowable current is 35 mA, whereas with the same wire, the same external dimensions, and a spacing of 2 rail (hence with a resistance of 1000 ohms) the allowable current is 5mA.
Consider two cases" (a) Measurement of the signal by a current sensitive device, e.g., a micro-ammeter. (b) Measurement by a high input impedance voltage sensitive device, e.g., an amplifier and
cathode-ray tube.
In case (a) the maximum sensitivity is attained if the arms of the measuring bridge and a galvanometer are of equal resistance, and the signal current is given by I s = iKA/4, where i is
t h e current in the gauge, K is the gauge factor, and A is the strain. For any given type of micro-ammeter the actual movement of the instrument pointer is proportional to I~.v/Rv where Rg is the instrument coil resistance so tha t ¢, the absolute value of the signal indication, is proportional to iv 'R.
For the two gauges above 41 4, = 35 /100.5 /1000
= 1"0 .45 .
In this case it is clear tha t the low resistance gauge is the better. For the voltage sensitive measuring device of case (b) the signal voltage is proportional to I R so that the ratio of the signals for the two gauges is
E~I" EG2 = 35 × 100" 5 × 1,000 = 0 - 7 " 1
in which the advantage goes to the high resistance gauge. Table 4 compares the signals using a current sensitive and a voltage sensitive indicator for different sizes of wire (cupro-nickel and nichrome)--the figure of merit being based on uni ty for a standard 100-ohms gauge (1 rail cupro-nickel wire). In each case the ratio of Wire spacing to wire diameter is twenty.
TABLE 4
Material Wire
diameter (in.)
Wire spacing
(in.) Resistance
(ohms) Current
(mA)
Fig~are of merit
Current sensitive detector
Voltage sensitive detector
cupro-nickel
Nichrome
0.002 0"001 0"0005
0.002 0"001 0"0005
0.040 0.020 0.010
0.040 0.020 0 . 0 1 0
12.5 100 800
25 200
1600
100 35
12-5
70 25
8-75
1.0 1-0 1-0
1.0 1.0 1.0
0"36 1"0 2" 82
0-5 1.41 4.0
I t will be seen that the figure of merit is uni ty for all the cases in which a current sensitive measuring device is used. This might be deduced from a previous expression (5.14)
, jf- j f so tha t
¢ o: i o:
Where L is the length of wire in the gauge.
25

For a constant ratio of winding spacing to wire diameter, Ld is constant so that i~/R is constant.
Examinat ion of the Table 4 enables the following conclusions to be drawn: (a) For current-sensitive indication, given free choice of galvanometer resistance, the low
resistance gauge is a satisfactory solution in the light of the materials available at present.
(b) For voltage-sensitive indication in which the gauge feeds into a device with a high input impedance, improvements can be made to the figure of meri t by using smaller diameter wire.
The above analysis ignores the value of the gauge factor, which is not unreasonable when only cupro-nickel and nichrome gauges are considered, since in each the strain sensitivity is approxi- mately 2. If, however, wires of different sensitivities are used the gauge factor must be included in the analysis, since the output is directly proportional to the gauge factor.
5.4. Effect on Gauge Factor of Increased Current.--The figures quoted in the foregoing section for generally allowable gauge current, are based on usage which may involve poor conditions of heat dissipation (as, for instance, a pair of gauges placed back to back on thin plate), and generally speaking are attended only by small values of drift. Where drift is not important as in purely dynamic measurements, and where heat dissipation conditions are good, the conservative values quoted above can be increased considerably.
In this connection the curves in Fig. 21 are of interest as illustrating the breakdown of the strain transmission with increased current and also the effect of test bars of different sizes on the allowable current. Gauges P and A3 are fiat wound, with a filament wire l-rail diameter spaced at 20 rail while the gauge A7 is of the flattened spiral type of the same wire, but with half the
-spacing. In each case the effect is shown for tension and compression. For the A7 gauge the loops at the ends of the winding are of much smaller radius than those in the case of the types P and A3 and it is to be expected tha t the temperature in the neighbourhood Of the loops will be correspondingly higher, hence the earlier breakdown. I t Will be observed that the breakdown occurs quite suddenly as the current is increased and failure occurs at a lower value of the current in the case of the compression gauge.
I t must be emphasised tha t the curves given are peculiar to the particular conditions of heat dissipation. For the case of two gauges back to back on a thin plate or for a number of gauges close together, conditions giving a higher test surface temperature, the breakdown Occurs at a lower value of the operating current.
6. Miscellaneous Properties of the Wire Resistance Gauge.--6.1. Development of Strain Sensitivity during 'Sticking' Period.--A gauge which has not completely dried out, will exhibit a strain sensitivity less than its final value, and at the same time show very marked hysteresis. This is illustrated in Fig. 22 which gives the results of experiments on two types of wire resistance gauge. In each case the gauge was strained to an equal extent and the figure taken as ' hysteresis ' is the average of the differences of the readings taken during loading and unloading. The results A refer to gauges of the squeezed spiral type in which the strain filament is wound on Bakelised paper interleaving, and the wafer so formed sandwiched between two layers of porous paper. The curves B refer to gauges with flat wound filaments stuck to a single layer of paper. In each case a cellulose base adhesive was used.
In both cases it will be seen that the gauge factor rises rapidly at first, to about 80 per cent of its ultimate value, and then at a much slower ra te of increase leading finally to a very slow approach in which the change over a long period accounts for an increase of only about 1 per cent.
The very great difference in the sticking time required for the tWO types, is due to the fact tha t for the Bakelised gauge A, elimination of the adhesive solvent can only take place round the edges of the internal Bakelised wafer which is relatively impervious, whereas in the gauge B the whole
26

surface of the gauge is available for the passage and evaporation of the solvent. Type A is a much more robust gauge than type B and where sufficient time can be allowed for sticking this advantage should not be overlooked.
The curves of hysteresis which express the percentage shift of the zero, emphasize the possibility of error in using gauges if insufficient sticking time has been allowed.
I t should be noted tha t the curves in Fig. 22 are representative of tests carried out at room temperature and at fairly low values of ambient humidity, and tha t considerable modification of the drying time is to be expected when the solvent evaporation is slowed down by a high moisture content in tile atmosphere surrounding the gauge, and/or by a low ambient temperature.
6.2. Range of Linearity and Behaviour at High Tensile Strains.--The results of tests on representative gauges of three types are shown in Fig. 23 in which percentage resistance change is plotted against tensile strain expressed as a percentage. In each case the end of the curve corresponds with failure of the gauge filament.
The results were obtained from gauges of the flat wound type. The flattened spiral type gives approximately the same kind of curve, but ultimate failure occurs at lower strains, presumably due to the greater stresses at fhe end loops.
In the case of the Advance (cupro-nickel) gauge shown, there is no detectable departure from linearity up to failure. This feature was common to all the gauges which were tested, whose gauge wires were of this type of metal, as would be expected from Fig. 5d.
The Iso-Elastic and Nichrome gauges show the same form of resistance-strain curve as many of the wires whose behaviour is discussed in section 3.12. that is, the strain sensitivity at low strains changes to a value of approximately 2.0 at some value of below 1 per cent strain, the curves having the form illustrated in Fig. 6a.
Now the point A in Fig. 6a appears to coincide with the yield point of the gauge filament, and the position of B depends on the percentage elongation of the wire of the gauge filament. Hence, if we wish to increase the value of strain below A, it is desirable to use hard-drawn wire (since the yield point is higher) in.the construction of the gauge, but if we wish to increase the strain below B it is desirable to use annealed wire (since its elongation is greater). I t is a singularly fortunate circumstance, tha t in cupro-nickel, a material generally very suitable for strain gauges, the difference between the gauge factor at low strains and at high strains is very small. Fig. 7 shows that once the strain has passed the point A (for metals in which there is a change of strain sensitivity) any kind of repeated loading involves the use of two gauge factors, the initial gauge factor over ranges of resistance which have already been covered ; and a gauge factor of approxi- mately 2.0 when in a range not previously covered. Since the actual position of A is somewhat Variable (depending, among other things, on the initial tension in the gauge wire) it is plain tha t if measurements of repeated loadings at high strains are required, only a cupro-nickel gauge (of those in commercial production at the moment) is likely to give convenient and satisfactory results.
Though the position of B is dependent on the total elongation of the gauge wire, it is also par t ly dependent on the geometry of the gauge, and on the nature of the connectionbetween the gauge filament and the lead. The lead is usually at tached either by welding or soldering, and this has the effect of reducing the strength of the gauge filament at that point, so that, almost invariably, failure of the gauge takes place there. The removal of the joint from the stress field by mounting it on an unstressed portion of the matrix, or by bending up the end, has the effect of increasing considerably the break-down strain of the gauge.
I t has been suggested 17 tha t Minalpha should be used for high strain measurements (for investigation into the plastic range of metals), and gauges of this material, with unstressed joints between the gauge filament and leads have reached 14 per cent elongation before failure. But as indicated above, and illustrated in Fig. 7, because of its varying gauge factor this material is not really a satisfactory solution to the problem.
27

As far as is known, there is no information available about the behaviour of the wire resistance strain gauge at high values of compressive strain.
6.3. Limits behaviour of
There does
of Frequency [email protected] are no test results known to the authors of the the wire resistance strain gauge at very high strain frequencies.
not appear to be any reason why the process of strain transmission from test surface to resistance filament should be affected unduly by the rapidi ty with which the process takes place, except in so far as the hysteresis effects in the materials of the matrix and adhesive may be transformed into local heat, and, by affecting their mechanical properties, may reduce the efficiency of strain transference.
A theoretical limit to the upper frequency is, however, imposed by the requirement that the gauge length shall be a small fraction of the wave length of the disturbances to be measured. Assuming this fraction to be 1/20 then for a gauge length of 0.25 in. the allowable wave length is 0.25 X 20/12 = 0.417 ft and for aluminium in which the velocity of sound is 16,740 f.p.s, the allowable frequency is 16,740/0.417 ---- 40,000 c.p.s, for a L-in gauge.
Since the layer of matr ix and adhesive is only a few thousandths of an inch in thickness it does not seem likely that inertia effects even at these frequencies can be serious.
6.4. Fatigue under Repeated Loadings.--The breakdown of wire resistance strain gauges under repeated loadings is of two types, one connected with the failure of the joint between the filament and lead, the other with the failure of the bond between the filament and matrix. There are probably high stress concentrations in the immediate vicinity of the junction of the filament and the much stiffer lead. In addition, welding or soldering must almost inevitably reduce the strength of the filament at the junction. Failures at the junction are very erratic and it has not been found possible to establish any definite relations between the mean stress, the range of stress and the number of repetitions of load before failure. For frequencies up to 100 c.p.s, there appears to be no effect of frequency on failures of this type. Sometimes the joint failure is found to be associated with a complete breakdown of the bond between the lead itself and the matrix. Therefore, it is very important that the lead should be supported along its entire length.
The second type of fatigue failure is usually associated with ranges of strain of the order of + 0 . 1 per cent or above. The breakdown seems to be due to the degeneration of the bond between matrix and filament at the ends of the latter. The feature of this type of failure is a sudden decrease in the resistance of the gauge. It will be remembered that in discussing the resistance changes during sticking of the gauge, it was pointed out that there is some in i t ia l tension in the gauge wire. The breakdown of the bond at the ends of the filament evidently releases this we-tension giving the characteristic drop in resistance. Further repetition of the loading results in a gradually increasing drop in the resistance indicative of a progressive break- down of the bond. In this type of failure it has also been found impossible to obtain a consistent correlation between the quantities involved.
A few experiments have been carried out to determine t h e ' life ' of strain gauges under repeated loading. I t has been found, that with a range of strain of 1 0 " 1 per cent about a mean strain of 0.12 per cent, a gauge where limit of l inearity under a steady load is about 1 per cent, has a life of about 170,000 reversals at 18 c.p.s., but with the range of strain reduced to ± 0 - 0 7 per cent and a me'an strain of 0.09 per cent, the life of a similar gauge is over 3,000,000 reversals. In each of these two cases, the gauge factor showed no falling off, but there was a sudden very large increase of gauge resistance to infinity which was discovered to be due to breakage at the junction of filament and lead.
6.5. The Wire Resistance Strain Gauge in Compression.--Doubts are frequently expressed regarding the ability of the wire resistance strain gauge to record strains in compression accurately.' If the bond between gauge and specimen is complete throughout the gauge length, then the gauge as a whole will be prevented from buckling under compressive strain, and the strain sensi t ivi ty should be sensibly the same as in tension.
28

In fact, however, it is found that the strain sensitivity in compression is in general slightly less, 1 to 2 per cent, than in tension and the scatter in any batch of gauges tested in compression is higher than when the same gauges are tested in tension.
The relation between strain and percentage change of resistance for a gauge on its first (compression) loading usually has the form shown in Fig. 24. For the first portion of the loading OA the gauge factor has a value identical with that in tension. Thereafter, the curve AB though still sensibly linear has the slope corresponding to a gauge factor reduced by 1 to 2 per cent.
In discussing resistance change during the sticking on of the gauge it was shown that the filament is usually in tension at the conclusion of the sticking process and it has been found that the value of this initial tension corresponds approximately with the change point A in the calibration of a gauge in compression, i.e., the absolute value of the gauge resistance at A is the same as that of the gauge before sticking. Up to the point A then, the gauge filament is in tension and it
behaves correspondingly. After reaching A the gauge filament is in compression and though prevented from buckling as
a whole by the bond to the specimen, can be regarded as a long compression member subject to a continuously distributed transverse elastic constraint along its length. The transverse constraint is provided by tensile and compressive forces in the layer of matrix between the filament Strand and the test surface. The form of buckling associated with this type of constraint, gives a sinusoidal transverse deflection whose wave length depends on the stiffness of the wire and of the elasticity of the layer of matrix which forms the transverse constraint. The total shortening will be made up of that due to direct compression together with a (dy/dx) ~ term resulting from the transverse bending.
The fact that the initial tension in the gauge may reach a value of 0.2 per cent strain may account for the fact that the change in gauge factor described above has not been observed by other experimenters, whose calibrations rarely extended much above this figure is.
It has been noted earlier in this report, that the initial sticking tension decreases with time corresponding to the zero drift usually observed and this change is accelerated by a raised tempera- ture and during tension loadings. It is to be expected, therefore, that the position of the point A will vary very considerably from gauge to gaug 9 and this has been found to be the case.
6.6. Behaviour at Low Temperatures.--For temperatures down to - -50 deg C no serious divergences from normal behaviour have been observed. The strain sensitivity in tension has been investigated, for instance, at this temperature without revealing any change from its value at room temperature. It is believed, however, that the adhesive may break down if it is subjected to very low temperatures for a long time.
I tseems likely that the allowable current will increase to a marked extent as the temperature is reduced, but no figures for this increase are available.
6.7. Behaviour at High Ternper atures.--For work involving steady strains where the experiments extend over a relatively lengthy period, the upper limit of working ambient temperatures will generally be fixed by the allowable drift. The curves already discussed (Fig. 20) referring to a standard cellulose acetate bonded gauge give an indication of drift effects to be expected with normal operating current.
While some improvement is to be expectect by reducing the current, it is evident that for the cellulose acetate bonded gauge there is a fairly modest limit to the w0rkingtemperature for protracted tests.
In the case of dynamic tests of short duration, where drift is not important, the working limit of temperature will be fixed by the breakdown of the stress transmission from test surface to filament owing to the mechanical degeneration of the gauge material with temperature.
29

Using a moderate value of the operating current (30 mA) this limit has been found to be about 100 deg C fo r the acetate bonded gauge and about 250 deg C for the gauge bonded with Bakelite varnish, which in@be-e:~%nded to-a00 d e g c ~Srl ver~/sh0rt.~festL . . . . ~:. : . . . . . .
There is an.urgent.need for a wire r:esistance gauge to deal with the:hightemperatures associated, in particular, with the gas tm:bir}e. Some s.uccess has beefl: h a d in t h e .U..S.A. with plat inum filaments bonded ceramically {o p{~rts sulSjedt:to temperatures up to about• i000 deg C, the gauges
. . . . . . . . . . ' 1 9 " being fabricate d :directly o n t h e tes t surface . " . .
No.
1
2
3
4
5
6
7
8
9
10
11
12
13
14
15
16
17
. , . : , .
. . , - , . .
; : • A ~ t a o ,
H. C. Roberts . . . . . . ' . . :
William Thompson ' . . ... . .
Elie W a r t m a n " . . . . . . . . . .
A. V. De Fo re s t and K. Leaderman . .
Edward E; Simmons, J a r . . . . .
Ar thu rC , Ruge . . . . . " , - . . . : , . . -
G. E. Benneti,i G.. :R . Richards land . E. C. Voss.
P, W. Bfidgman . . . : . . . . . . . , ,
P.W. ridgm; . : : . . . . .
T. Ueda . . . . . . . . , ,.. . .
J. E. Calthrop - :.-1 _ _ . . . . . . . .
C. H. Lees and J)E: Calthrop ' , . . . " . .
L. H. Adams/, R. W , - G o r a n s o n ' and R. E. Gibson. :: : - '
R, BaumlSerger and F. Hines . . . . .
W. IZ. Campbell . . . . ! . . . .
Norris F. - D o w . ::-.." ' : . . i : . " . . " ;..
K. Swainger , ' ' " " - - _..
18 W. R, CampbeU . . . . . . : , ,
' i 7 : 7 c ' , ~' ' _ - 19 SI S. Maison~ ' R . - H , K e m p a n d W/ C.
l~{organ7
DiJell and 0kerin-are supplied b y Messrs. Astor, Boisselier and Lawrence, Ltd.
Petrosin and Cerrasin are supplied by Messrs. Socony Oil Co. Inc.
REFERENCES • - : , . . . . Title, etc.
Mechanical Measurements by Elec{rical Methods., Ins t rument Publishing Co. In~. Pittsb~irgh. i946.. ' " -
On the Elec t rodynamic Qualities of Metais. Pt4i}osophical Trans- actions Royal Society. V01. 146. 1856.
On the Effect of Pressure on Electric Conductivity. of Metallic Wire,. Philosophical Magazine (London). Vol. 17.4. 1859.
. . . . .
The Development of Electrical Strain Gauges l N.A.C.A. Technical Note 744 . . . . . •
U.S. Patent . SerialNo. 320,327.
U.S. P a t e n t . Serial Nos. 410,865;413,333;'451;063, 453,505.
~lectronics Applied to Measurement o f Physical Quantities. R. & M. 2 6 2 7 . 1947 (M9nograph).
• The Phys@s of High Pressur e, Bell. 193L. , . . . . . . . f
The Effect of Tens ion-on t h e Thermai _and-Electrical Conductivi ty of Metais~ Proceedings American Academy of.Arts and Sciences,
,, Vol( 89. 1923:24. " "
Scie ti o eport, Tohoku Impe;ial t:niversity, 19. 1930. . ,Proceedings. Physical Societ353S. 1926.- •
Proceed{rigs Physical Societj, 35. 1923; 36. 1924~
Constru'ction a n d Properties 0f Manganin Resistance Pressure Gauge. Review of Scientific.Instruments. Vol. 8. 1937. "
Practical Reduction Formulas for Use in B o n d e d W i r e Strain Gauges. Proce'edings Society Expdr{me~tal St~'ass Analysi£ Vol. I I , No. I.
'Performance Tests on Vgire S t r a in Gauges . .N:IK.C,A. Technical : Note No. 1042.
Analys~s _0! Straii{s-in.dicated bY Mul f ip leS t rand Wire Strain Gauges used as Rosettes: A.R.C.- Repor t "_No. 6688. 1943. (Unpublished.)
The : Measuremen± a n d :Interpretat ion . of Pos{ Yield Strains. Pro'ceedings Society Experimental Stress Analysi£ Vol. V, No. I I .
Performance Tests on Wire Resist.dace S-train" Gauge. N.A,C,A. •. Technical :Ngtes N o s . . 9 5 4 and 978 . . . . .
High Tempera ture 'S t ra in Gauges and ' the i r Application to Measure- ment 6f Vibrating Stresses in TurS0supercharge,Buckets. N.A.C.A. Technical Note No. 1174. :, . . . .
30

F~G. I.
81 (51501) B*

j ( )
,C
FIo. 2a. Flat grid type of strain gauge.
T FIXED
=O~ME~
4N PLATEN
Fla. 2b. Simple mettiod of winding flat grid type.
FIG. 3.

<b
A~e~ T. eo~ S
<A X~S TIL
FIG. 4. Schematic arrangement oi R.A.E.-type gauge winding machine.
3

-5 °4/ It) ILl
,v 3 z
a.° ,./
J
~0 I ~_
°/o ,sTI~,A~ N
COPPER (HARD)
.
// /
oi0 5TR.tkiN
COPPER ~N NEALED)
FIG. 5a.
/ ~/0 STR'AIN
NICKEL (HA R 0)
Sensitivity of free wires (in tension).
/ /
/ I P.
°/o STRAIN
NICKEL (ANNEALED)
Z
I/3
Z
w if)
IJ Z
~ 4 Z
~ 3
/ / /
i 2
0/o STRAIN
40°/o SILVER PALLADIUM CHARD)
/
/ I
/
/
! e
i I
I 2
40% SILVER PALLADIUM I0% RHODIUM (ANNEALED) (HARD)
FIG. 5b. Strain sensiti~ty of #me ~res.
3
PLATINUM
/ / / /
% 5TRAIN IOO/o RHODIUM PLATINUM
~NNEALED)
84

15
13
W
z
W
W
o
/ /
/
0
f /
/ f
I~'IG. 5c.
3 4 5 6
MINALPHA 6 N N E A L E ~
Strain sensitivity of free wires.
35
@
/
(515O1) C

t~ U x
W
Z
W
W Of U Z
15
14
~3
FIG. 5d.
.5
3 = 5
% 5"r~N
FERRY (ANNEALED) Strain sensitivity of fine Wires.
36
/
. k
<. ~b

E
B
/ A
.(Q) 5TR~,~N
IRON • HARD DRAWN COPPER
SILVER
PLATINUM
"6
/
o STRAIN
bo)°/o SILVER PALLADIUM
I O % IR ID IUM PLATINUM
I O % R H O D I U M PLAT INUM
FIG. 6a-e.
o
FERRY ANNEALED COPPER
STP.AIN (d)
NICKEL
Typical strain sensitivity curves.
o STRAIN (¢? MINALPHA
uJ'* t3 ~E ,% ~ z IX
Z
to .,:f
/ /
/ °/o ST P.,AI N
MINALPHA
S
¢ [tl tJ
_z
w ~ if) Ld o£ U z
/ /
J / a 2.
40% SILVER PALLADIUM
IB g z g 03 tLI O~
Z
W
X
I 2.
% 5TR~,IN
I0% RHODIUM PLATINUM
FIG. 7. Behaviour of fine wires under increasing and decreasing strain.
~T~.~,IN OECREP,~IN~
37

+
t I , I
i X
t O t ~ t ~ EL
FIG. 8.
# ,
----i,- RESISTANCE;
Variation of resistance :with pressure. J;
- +
I iX. -
/ e ~ T e l \ a / I P
\ i \ \
y _ . . . . .
" ' 0 \ \ \ I \ I \ I \ I \ IX, \
FIG. 9. Gauge at large angle to required strain.
ADHESIVE ' " o , 0 ~ 1 ' " s .. PAPEIR . _ . ~ , ~ , L I ~ FILAMENT
~1 m / / c~vE~ oF ADH-OSive. / .
O , 0 o i v
FiG. 10. Cross-section of flat grid type gauge.
5HeA~
FIG. 12.
@
FoRc.E
i CAusE L.EN C~'T H G
c~AUC~E ~ONUED TO , I
FIG. 11.
SI;RAIN~.0
Forces acting on gauge.
SHEAR
SPC. . r . . IME, N
FORCE
_•'l'l.,/ MATRIX . . . . ~ WINOIN~ m,
\ , \ I I I . ~ \ \ i i i \ \ \ I i ,
L _~_.____(o.) SHEAR STRESS
~X'~x~x LON~ITLID I N AL STRAIN
Distribution of shear stress and longitudinal strain along gauge.
IWINBIN~ I
GAUGE FACTOR =1.64
FIG. 13.
IWINqINq I
L (b) GAUGE FACTOR: 2. Ol
Effect of partial sticking on gauge fador.

"f A-- ~ Y
FIG. 14. Diagram of calibration method.
RIDER CARRYING I ~ l A I r - A I f ~ - l i t r7
FIG. 15. R.A.E. calibrator.
39 (51501) C*

Z 1,3
5 Y~
, / ,i,
M I NlUTE5 \ "~ i
1 2
TYPE A3 ~AUGE ADHF-..,.~,IVE-SR-4 CE.,MF.NT
/ I TYPE AI &AUGF..5 /
/ ~ ? ADHEa~VF- ~ J DUROF'IX
z TN EORETICAL CURVE
3 4 5 6 7 8 9 t 0 I 0 0
FIG. 16a. Drift during drying.
I000 ~0,000
(Flat grid, initially unstressed.)
tO t./ Z
I-- 09 t~ taJ tX
Z
ttl if)
tlJ of t ) Z
tO t9 r
Z w O ul a_
i
, ~ ~ _ _ _ _ _ _ . . . _ -- '~ - TIME A F T E R 5 T I C K I N ~ IN M I N U T E S Q
" \ % . ' ~ o I~o
-°"
-0"?-
FIG. 16b. Drift during drying. (Flat grid, initially stressed.)
40

- ~ . , ~ -
3 " B
3.6
:3.4
3.?-
-3.~o - - IV
~.~ o~ ~/
-~-.4. ~
-a.a B
-?_.oo
- I ' ~ "~ I 0
- . h 4
/ / _ l . ( ~ O - -
- / f - 0 . 6
-D'Z
t I t [ I
TIME. AFTER D#,MI:IN¢~
FIG. 17. Increase of resistance due to electrolysis at 100 per cent. humidity.
.IOQ °
\ 0 \ \ co
\
- O' 1 - O - Q 5 0 . 0 5 % INE;REA.~E 0~' RESISTANCE
FIG. 18.
I
o ~ CaAU~E MOUNTED QN DURAL SLIP
1) ~J I~ BERY'LLIUM CQPPER 5LIr'
)) n J) 5TEE.L SLII~
f f~ ,U~E FROM DIFFERENT BATCN M~UNTE.O f ON DURAL SLIP
Effect of heating on gauges stuck to different materials.
41

o ~ o.o3 z
I 0
W ~0.~ . Z
ul O" ~O'OI I U
I-.--
Z W
o_ 0 - <
FIG.
~f
t ~ 3 4 S 6 7 5 TIME IN ~(3U~S
lga . Zero dr if t of gauge witt~ d u m m y in warming up.
uJ u ZQ'O~
I D
trJ [ Z
h i tgr X . f xa.ol
lJl
<
(3L
FIG. lgb .
/
I0 ~-0
~u RR£NT 30 40 5o
IN q"~ g.
Zero drif t wi th change o~ gauge current .
.I-o¢
+ o 3
z
z
2: 4[ I o -03
..o - 0 4
- 0 5
j /@%o m
' / , ^ j _ - - - ~ r - ~ ~ - ~6@ °
..¢,I@ ° a 3 ¢
$
COM PRE.SSION
r5
1
~EN$10N
FIG. 20. Slip from s t ra in of 20 X 10 -3 a t var ious temperatures .
4 2 - : : ;

ul
D
Z
J J
50
4 0
30
IO
50
TYPES P & A,~ GAVE F'A.L-~NG O~~" LESS THAN I% ~'(~P. CURRENT IgO MA ON BAR ,4. x ~ , ~ l : )
5C
TYPE p aN BAR
~" :',"~" ~. I~'
I ' o ~ J
i '° / /
LO0 I~o O
50
~AU~ES r-.U RRENT
Z o 03 i/}
TYPE A3 ON BAR
o o
FIG. 21.
too I,SO
Mlu- I - A~aP$
Current carrying capacity of gauges.
4c:
3c
P.C
IO
/ /
TYPE A 7 aN BAR oZl.
: ° /
_Z/ ~0 IO0 150
CI
,,9-2 o Z
3 ,,g
id
~ ^ ~ ~ ~ . O
~IX o.s I.o t,,S
i// o.~ \,., i?
~o,~
a .S
o ~ 6~ ~E
Z
t~r z 4 ~ 3~ O
ac i -
u/ N F (3
0'1
~D iJJ isJ
tll ~ a . 3
O. S 1,0 1.5 ~- 'O-//n"" ~AUr~E YA~-TO R L
y // FIG. 22a alld b, Variation of gauge factor and hysteresis immediately after sticking.
43

/ 5
Z
ix t )
o~
C
% STRAIN
I. ADVANCE WIRE GAUGE
w u Z
w
W t~ Z
:E O
~e
/ !
11
c~/O 5TRAIN
2. I S O - E L A S T I C WIRE
FIG. 23.
Ill t) Z
to
t~ ~g
Z
tlJ
z
I t )
/
/
3 % 5TR/~IN
GAUGE 3 . N I C H R O M E WIRE GAUGE
Behaviour of gauges at high strains (in tension).
GAUGE FACTOR S t a 3
LOW 5TP.~LN ~_,14 3'73 ?.'45 mC~H 5TP.~,~N &'14 2"46P."00
FIG. 24.
j4/
_ 2 1 / 0 % STR~,IN
Typical strain v s . resistance curve for gauge ill compression.
44 (51501) W t . 15/680 K .9 10152 Hw. P R I ~ B D IN GREAT BRI]~AIN

R. & M. No. 2 ~ 1 (1~,857)
A.R.C. Technical Rel~or~
Publications of the Aeronautical Research Council
ANNUAL TECHNICAL REPORTS OF T H E AERONAUTICAL RESEARCH COUNCIL (BOUND V O L U M E S ) - -
i934-35 Voi. i. Aerodynamics. Out ofpri#t. Vol. II. Seaplanes, Structures, Engines, Materials, etc. 4os. (4os. 8d.)
I935-36 Vol. I. Aerodynamics. 3oJ. (3os. 7d.) VoL II. Structures, Flutter, Engines, Seaplanes, etc. 3os. (3os. 7d.)
1936 Vol. I. Aerodynamics General, Performance, Airscrews, Flutter and Spinning. 4os. (4os. 9/.)
Vol. II. Stability and Control, Structures, Seaplanes, Engines, etc. 5os. (5os. lOd.)
1937 Vol. I. Aerodynamics General, Perfbrmance, Airscrews, Flutter and Spinning. 4os. (4os. log.)
Vol. II. Stability and Control, Structures, Seaplanes, Engines, etc. (ms. (61s.)
i938 Vol. I. Aerodynamics General, Performance, Airscrews. 5os. (5Is.) Vol. 1I. Stability and Control, Flutter, Structures, Seaplanes, Wind Tunnels,
Materials• 3os. (3os. 9d.)
1939 Vol. I. Aerodynamics General, Performance, Airscrews, Engines. 5o~. (5os. 1In/.) Vol. IL Stability and Control, Flutter and Vibrav_'on, Instruments, Structures,
Seaplanes, etc. 63s. (64s. 2d.)
~94 o Aero and Hydrodynamics, Aerofoils, Airscrews, Engines, Flutter, Icing, Stability and Control, Structures, and a miscellaneous section. 5os. (5 Is.)
Certain otAer reports proper to the ~94 o volume wi l l subsequently be included in a separate volume.
ANNUAL REPORTS OF T H E AERONAUTICAL RESEARCH C O U N C I L ~ 1933-34 is. 6d. (IS. 8d.) I934-35 is. 6d. (is. 8d.)
.4pril 1, 1935 to December 31, 1936. 4s. (4 s. 4d.) 1937 . 2s. (zs. 2/.) 1938 is. 6d. (is. 8,/.)
~939-48 , 3 s. (3 s. 2d.)
INDEX T O ALL REPORTS AND TECHNICAL REPORTS, AND
April, I95O
MEMORANDA PUBLISHED IN T H E ANNUAL SEPARATELY--
R. & M. No. 16oo. zs. 6d. (zs. 7½d.)
INDEXES T O T H E T E C H N I C A L C O U N C I L - -
December I, I 9 3 6 - - J u n e 3 o, I939. ,July 1, I 9 3 9 - - June 3 o, 1945. July I, 1945 - - J u n e 30, I946. july i, i946 N December 3 I, I946. January I, I 9 4 7 - - June 3 o, 1947.
REPORTS OF T H E AERONAUTICAL RESEARCH
IS. 3g. Os. 4°~d.) zs. (zs. i½Z) is. (is i½t.) u. 3d. (is. 4½d.) IS. 3 d. (Is. 4½/.)
R. & M. No. I85o. R. & M. No. 195o. R. & M. No. 2050. R. & M. No. 2I 50. R. & M. No. 2250.
Prices in brackets include postage.
Obtainable from
H E R M A J E S T Y ' S S T A T I O N E R Y O F F I C E 'York House, Kingsway, LONDON, w.c.2 423 Oxford Street, LONDON, W.1
P.O. BOX 569, LONDON, S.E.1 13a Castle Street, EDn'mURGH, 2 1 St. Andrew's Crescent, cArongF 39 King Street, MANCHESTER, 2 Towel" Lane, BmSTOL, 1
2 Edmund Street, mRMINGHAM, 3 80 Chichester Street, BELFAST
or through any bookseller.
S.O. Code No. 23-266I

![J Ë µ] J w J M$] J 8 8 D ] 8 w zw Y §4 $Y } 5T - ¢r O ¢ = ] $Y ... Ë µ] J w J M$] J 8 8 D ] 8 w zw Y 4 $Y } 5T - ¢r O ¢ = ] $Y $L " C) } 5T D) } 5T E) } 5T F) } 5T 2. )3 9p](https://img.dokumen.tips/doc/110x75/5aa8f6487f8b9a86188c24e6/j-j-w-j-m-j-8-8-d-8-w-zw-y-4-y-5t-r-o-y-j-w-j-m-j-8-8-d.jpg)