Embed Size (px)
Citation preview

© Boardworks Ltd 20101 of 13
Advanced Functions and
Charts

© Boardworks Ltd 20102 of 13
Teacher’s notes included in the Notes Page
Flash activity. These activities are not editable. Web addresses
Icons key: For more detailed instructions, see the Getting Started presentation
Functional Skills check
Student task accompanies this slide Printable activity
This lesson will cover:
Using spreadsheet charts to display data.
Some more advanced features of spreadsheets.

© Boardworks Ltd 20103 of 13
Advantages of charts

© Boardworks Ltd 20104 of 13
Graphs
Make sure you choose the most appropriate graph type for your data. Using the wrong graph type can cause confusion.
To create a chart or graph:
Organize and highlight the data you wish to use.Select Chart from the Insert Menu.Follow the instructions of the Chart Wizard.

© Boardworks Ltd 20105 of 13
Graph types

© Boardworks Ltd 20106 of 13
Once you have created your chart you can add titles and data labels. A chart has different menu options depending on where you click your mouse.
Labelling charts
Right-clicking on a blank space within the chart area will allowyou to select chart options. From here you can add a titleand axis labels.
Title
X axis label
Y axis label
Double-clicking on areas of the graph itself will allow you to change its colours and the thickness of its lines.

© Boardworks Ltd 20107 of 13
Legends
A chart is of no value if you do not know what the colours of each section, line or bar represent. Therefore, it is important to create a key or legend which tells the userthe information they need in order to interpret the graph properly.
This does not tell the user what the datameans.
© Boardworks Ltd 20108 of 13
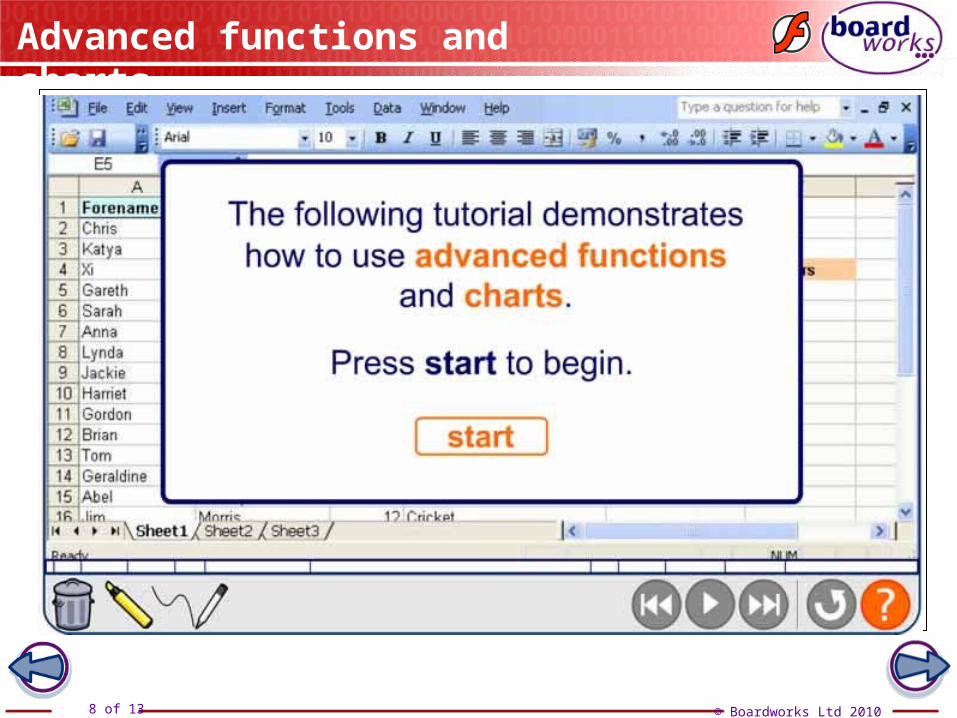
Advanced functions and charts

© Boardworks Ltd 20109 of 13
Adding trend lines
Once a chart has been created in a spreadsheet, you can add a trend line which can be used in forecasting future trends.
To do this you simply select the chart and then click Add
Trendline in the Chart menu.
What are the potential inaccuracies of trend lines?

© Boardworks Ltd 201010 of 13
Advanced features

© Boardworks Ltd 201011 of 13
Forms
Spreadsheets can also be designed to be used in a similar way to database forms.
You can access a FormsMenu by right-clicking on the menu bar.
You could set up a spreadsheet with radio buttons or drop-down lists and use a macro as a submit button which would then store the results in another worksheet.
This could be one way of creating an online survey which would automatically collect responses.

© Boardworks Ltd 201012 of 13
Remember the terms

© Boardworks Ltd 201013 of 13
True or false?