Embed Size (px)
Citation preview

© B. Alan Whitson1
It’s the Money!Corporate Realty, Design & Management Institute
319 SW Washington, Suite 602Portland, OR 97204503-274-7162www.squarefootage.net
B. Alan Whitson, [email protected]

© B. Alan Whitson2
A Little Bit About You?
• Affiliation
AIA, ASID, CABA, IIDA, ASHRAE, BOMA, IFMA, NAESCO, USGBC
• Organization
A&D,
ME&P,
Building Automation - Mfg.,
ESCO,
Corp. End User,
Govt. End User,
Regulatory Body,
Utility

© B. Alan Whitson3
What’s Your Payback Period?
14%15%17%18%20%22%25%29%33%40%50%
67%
100%
200%
847872666054484236302418126
Payback Period in Months
Return on Investment (ROI)
per payback period in months
Annual ReturnInvestmentROI =

© B. Alan Whitson4
Goal: ROI Greater than Cost of Capital
5.07%
18.36%
9.19%
Average Cost of Capital
7,278 Companies 101 Industries
Source: NYU Stern July 2002
MarketAverage

© B. Alan Whitson5
Which Earned More Money?
$0 $75,000 $150,000 $225,000 $300,000
US Treasury 5 yr.
Wilshire 5000
S&P 500
Energy Savings
1/97 to 12/01 1/97 to 12/02
$100,000 Invested 1/’97 - Amounts shown exclude return of initial investment

© B. Alan Whitson6
Income & Expense 2001 - 1985
2001 2000 1995 1990 1985
Total Income $24.03 $22.72 $19.33 $17.26 $14.73
Cleaning 1.20 1.17 1.20 1.15 1.05
Repairs & Maintenance 1.45 1.37 1.55 1.38 1.21
Utilities 2.00 1.86 1.87 1.84 1.85
Roads, Grounds & Security .71 .68 .61 .50 .38
Administrative 1.28 1.18 1.12 .90 .68
Fixed Expenses 3.20 3.14 2.98 2.84 2.17
Total Expenses $9.84 $9.40 $9.33 $8.61 $7.34
Net Operating Income $14.19 $13.32 $10.00 $8.65 $7.39
BOMA Experience Exchange Report, All Buildings

© B. Alan Whitson7
Commercial Electricity Prices
0
1
2
3
4
5
6
7
8
1960 1965 1970 1975 1980 1985 1990 1995 2000
Ce
nts
pe
r k
WH
Source: EIA -DOE -9/02
© B. Alan Whitson8
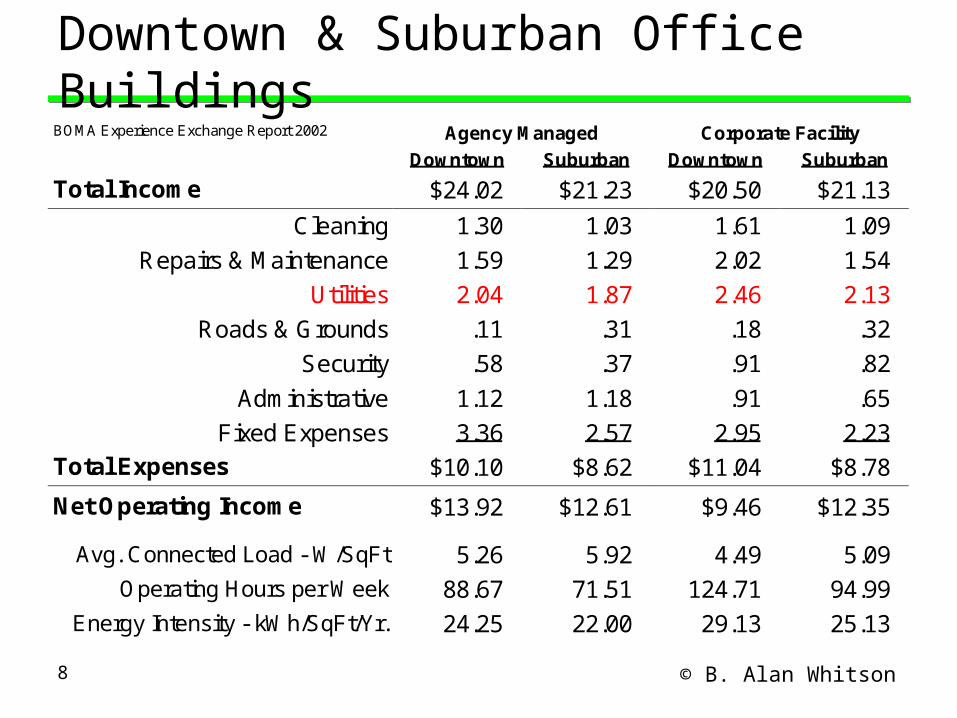
Downtown & Suburban Office BuildingsBOMA Experience Exchange Report 2002 Agency Managed Corporate Facility
Downtown Suburban Downtown Suburban
Total Income $24.02 $21.23 $20.50 $21.13
Cleaning 1.30 1.03 1.61 1.09
Repairs & Maintenance 1.59 1.29 2.02 1.54
Utilities 2.04 1.87 2.46 2.13
Roads & Grounds .11 .31 .18 .32
Security .58 .37 .91 .82
Administrative 1.12 1.18 .91 .65
Fixed Expenses 3.36 2.57 2.95 2.23
Total Expenses $10.10 $8.62 $11.04 $8.78
Net Operating Income $13.92 $12.61 $9.46 $12.35
Avg. Connected Load - W/SqFt 5.26 5.92 4.49 5.09
Operating Hours per Week 88.67 71.51 124.71 94.99
Energy Intensity - kWh/SqFt/Yr. 24.25 22.00 29.13 25.13

© B. Alan Whitson9
Electricity Usage
0% 5% 10% 15% 20% 25% 30%
Misc.
Refrigration & Cooking
Water
Exterior Light
Office Equipment
Ventilation
Heating
Cooling
Interior Light

© B. Alan Whitson10
What’s a Watt Worth?
Electricity Reduction - Lighting 1,637,402 kWh
1W SF x 355,000 SF x 88.7 Hrs Week x 52 Weeks
Less Lights = Less Heat to be Removed 101Tons
355,000W x 3.412 Btu / 12,000 Btu per Ton
Electricity Reduction - Cooling 372,682 kWh
101 Tons x 0.8 kW/ton x 4,612.4 Hours
Total Electricity Reduction - Lighting & Cooling 2,010,084 kWh
Reduction in Annual CO2 Emissions 1,608.1 Tons
2,010,084 kWh x 1.6 lbs CO2 per kWh
© B. Alan Whitson11
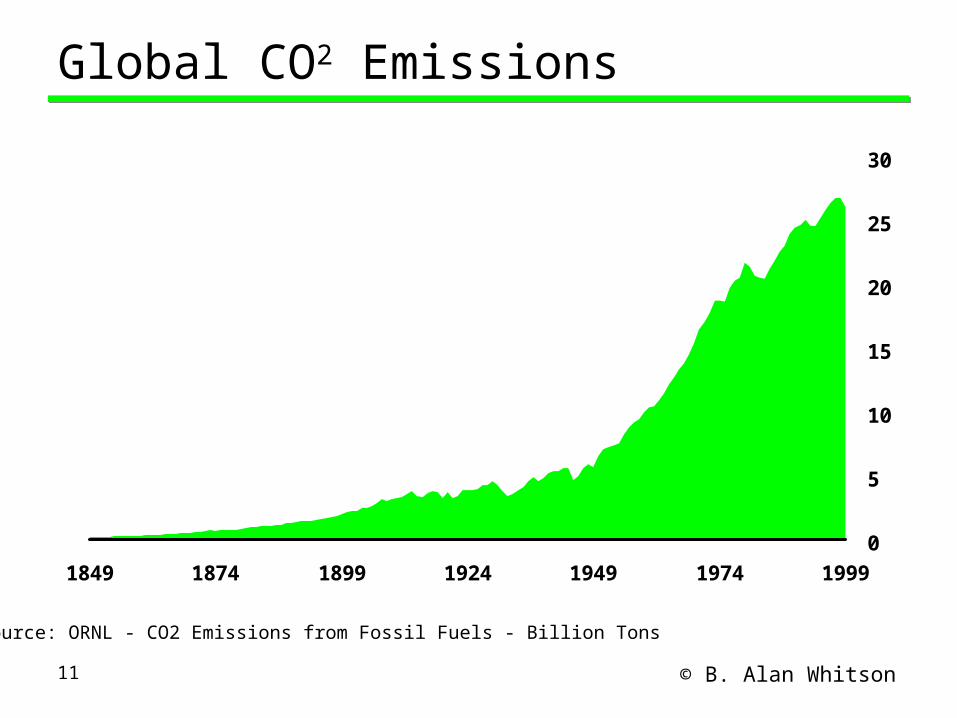
Global CO2 Emissions
0
5
10
15
20
25
30
1849 1874 1899 1924 1949 1974 1999
Source: ORNL - CO2 Emissions from Fossil Fuels - Billion Tons

© B. Alan Whitson12
75% of CO2 Emissions from 17 Nations
22.3
2.5
10.910.1
1.2
10.610.0
15.9
8.19.3
4.3
8.36.7
20.1
8.6 9.0
5.3
53%
75%
USAChina
RussiaJapan
IndiaGermany
UK Canada
ItalyS. Korea
MexicoUkraine
FranceAustralia
S. Africa
PolandIran
CO2 Tons Per Capita Cumulative CO2 Emissions %
Source: ORNL - 1999 CO2 Emissions from Fossil Fuels - Global Per Capita CO2 Emissions 4.45 tons -214 nations

© B. Alan Whitson13
What’s a Watt Worth?
Electricity Reduction - Lighting 1,637,402 kWh
1W SF x 355,000 SF x 88.7 Hrs Week x 52 Weeks
Less Lights = Less Heat to be Removed 101Tons
355,000W x 3.412 Btu / 12,000 Btu per Ton
Electricity Reduction - Cooling 372,682 kWh
101 Tons x 0.8 kW/ton x 4,612.4 Hours
Total Electricity Reduction - Lighting & Cooling 2,010,084 kWh
Reduction in Annual CO2 Emissions 1,608.1 Tons
2,010,084 kWh x 1.6 lbs CO2 per kWh
Savings in Annual Operating Costs $273,371 - $0.77 sf
2,010,084 kWh @ $0.136/kWh
Reduction in HVAC Equipment Costs $252,500 - $0.71 sf
101 Tons X $2,500/Ton
14
Operating Costs & Value
© B. Alan Whitson15
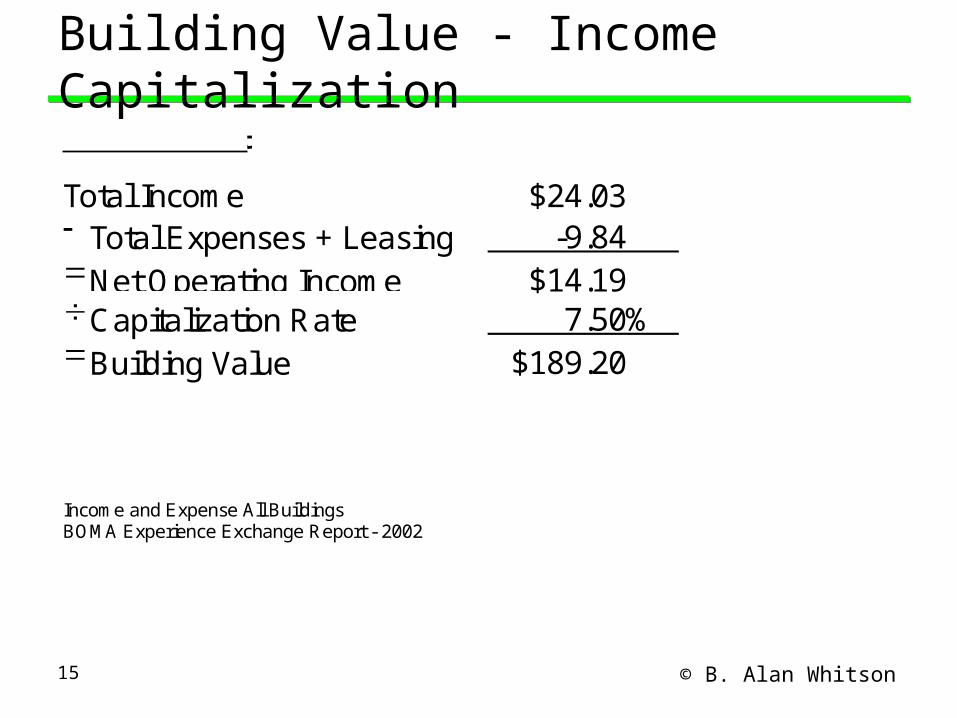
Building Value - Income CapitalizationPer Square Foot
Total Income $24.03 Total Expenses + Leasing -9.84 Net Operating Income $14.19 Capitalization Rate 7.50% Building Value $189.20
Income and Expense All BuildingsBOMA Experience Exchange Report - 2002

© B. Alan Whitson16
Building Value vs. Operating Costs
$189.20
$709.20
Initial Building Value Operating Costs - 40 Years
CPI @ 2.8%
© B. Alan Whitson17
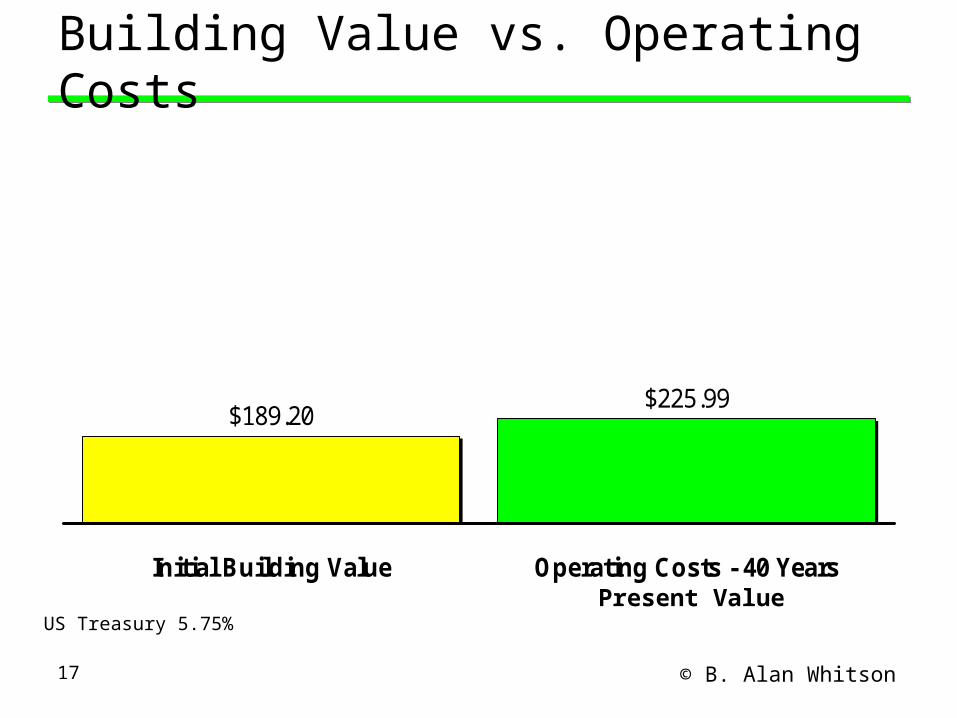
Building Value vs. Operating Costs
$189.20$225.99
Initial Building Value Operating Costs - 40 Years
US Treasury 5.75%Present Value

© B. Alan Whitson18
Reducing Operating Costs Effect ValuePer Square Foot Before
Total Income $24.03 Total Expenses + Leasing -9.84 Net Operating Income $14.19 Capitalization Rate 7.50% Building Value $189.20
Income and Expense All BuildingsBOMA Experience Exchange Report 2002

© B. Alan Whitson19
Reducing Operating Costs Effect ValuePer Square Foot Before After
Total Income $24.03 $24.03 Total Expenses + Leasing -9.84 -9.34 Net Operating Income $14.19 $14.69 Capitalization Rate 7.50% 7.50% Building Value $189.20 $195.87
Income and Expense All BuildingsBOMA Experience Exchange Report 2002

© B. Alan Whitson20
Saving Energy Pays
• Invest $1.25/sq. ft. in an Efficient Lighting Upgrade
• Saves $0.50/sq. ft. in Energy Costs per Year
Payback - 2.5 Years
ROI - 40%• Creates $6.67/sq. ft. in
Building Value
ROI - 533.6%
$1.25
$6.67
Investment Building ValueCreated

© B. Alan Whitson21
Who Gets the Energy Savings...
$1.95 $1.60
$0.15
Before Upgrade After Upgrade
• Total Savings $0.50/Sq. Ft.
Tenant Saves $0.15/Sq. Ft.
Landlord Saves $0.35/Sq. Ft.• Building Value Increases
$0.35 Net Energy Savings
÷ 7.5% Cap Rate
$4.67 Increased Value• Bottom Line - $1,657,850
355,000 SF 19-Story Building

© B. Alan Whitson22
Economic Benefit of Green
Wilshire 5000 Composite CompanyShares Outstanding 18,510,000
Share Price $10.01
Earnings per Share (EPS) $0.32
Price Earnings Ratio (PE)* 31.28
Headquarters BuildingProject Costs ($1.25 SF X 355,000 SF) $443,750
Energy Savings ($0.50 SF X 355,000 SF) $177,500
Economic Benefits to ShareholdersIncrease in Company Value ($177,500 X 31.28) $5,552,200
Increase in Stock Price per Share $0.30
1/31/2002

© B. Alan Whitson23
It’s Hard to Make a Dollar
$15.00$18.12
$30.86
$25.32
1999 2000 2001 2002
Revenue needed to generate $1 in profit
Source: Fortune, Business Week

© B. Alan Whitson24
Show Me the Money!
Building Automation:• Control Building Load
Reduce average connected load one watt per square foot
• Control Operating Hours
12 Hours per Day M-F 6 Hours Sat.66 Hours per Week
© B. Alan Whitson25
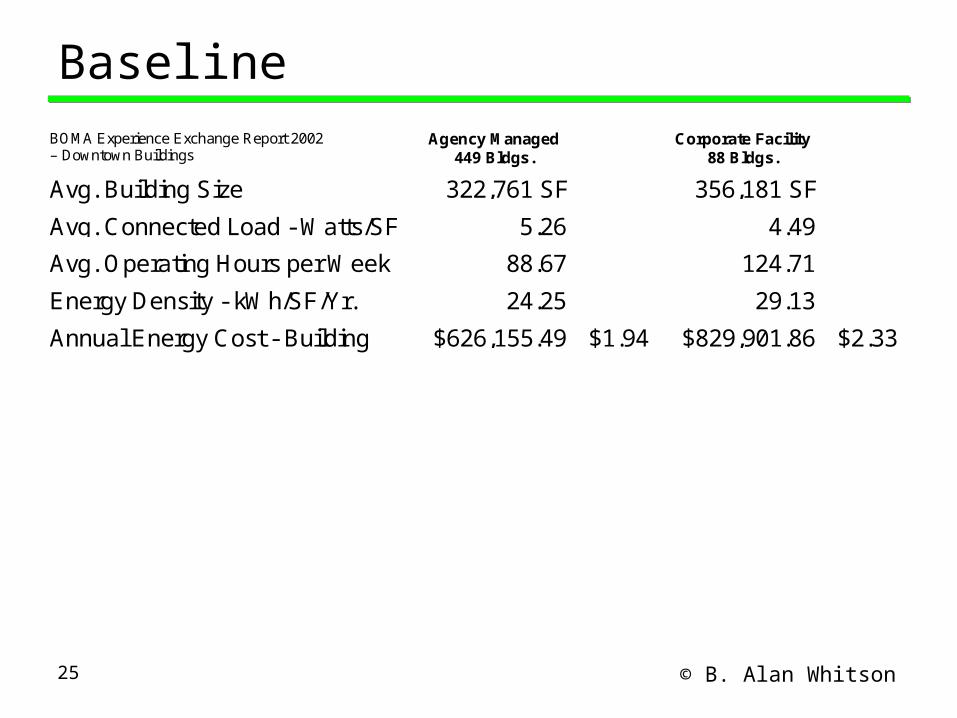
Baseline BOMA Experience Exchange Report 2002– Downtown Buildings
Agency Managed449 Bldgs.
Corporate Facility88 Bldgs.
Avg. Building Size 322,761 SF 356,181 SF
Avg. Connected Load - Watts/SF 5.26 4.49
Avg. Operating Hours per Week 88.67 124.71
Energy Density - kWh/SF/Yr. 24.25 29.13
Annual Energy Cost - Building $626,155.49 $1.94 $829,901.86 $2.33

© B. Alan Whitson26
Reduce LoadBOMA Experience Exchange Report 2002– Downtown Buildings
Agency Managed449 Bldgs.
Corporate Facility88 Bldgs.
Avg. Building Size 322,761 SF 356,181 SF
Avg. Connected Load - Watts/SF 5.26 4.49
Avg. Operating Hours per Week 88.67 124.71
Energy Density - kWh/SF/Yr. 24.25 29.13
Annual Energy Cost - Building $626,155.49 $1.94 $829,901.86 $2.33
Reduce Load 1 Watts/SF $507,099.71 $1.57 $645,117.41 $1.81
© B. Alan Whitson27
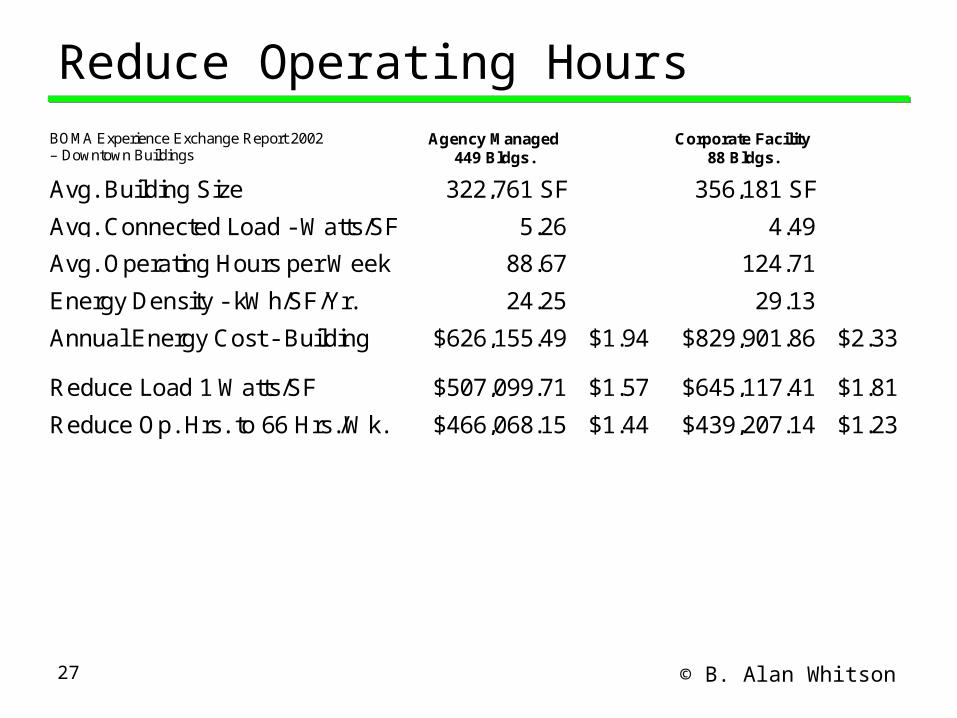
Reduce Operating Hours BOMA Experience Exchange Report 2002– Downtown Buildings
Agency Managed449 Bldgs.
Corporate Facility88 Bldgs.
Avg. Building Size 322,761 SF 356,181 SF
Avg. Connected Load - Watts/SF 5.26 4.49
Avg. Operating Hours per Week 88.67 124.71
Energy Density - kWh/SF/Yr. 24.25 29.13
Annual Energy Cost - Building $626,155.49 $1.94 $829,901.86 $2.33
Reduce Load 1 Watts/SF $507,099.71 $1.57 $645,117.41 $1.81
Reduce Op. Hrs. to 66 Hrs./Wk. $466,068.15 $1.44 $439,207.14 $1.23

© B. Alan Whitson28
Reduce Load & Operating Hours BOMA Experience Exchange Report 2002– Downtown Buildings
Agency Managed449 Bldgs.
Corporate Facility88 Bldgs.
Avg. Building Size 322,761 SF 356,181 SF
Avg. Connected Load - Watts/SF 5.26 4.49
Avg. Operating Hours per Week 88.67 124.71
Energy Density - kWh/SF/Yr. 24.25 29.13
Annual Energy Cost - Building $626,155.49 $1.94 $829,901.86 $2.33
Reduce Load 1 Watts/SF $507,099.71 $1.57 $645,117.41 $1.81
Reduce Op. Hrs. to 66 Hrs./Wk. $466,068.15 $1.44 $439,207.14 $1.23
Reduce Load & Op. Hrs. $377,451.01 $1.17 $341,414.07 $0.96
Savings $248,704.49 $0.77 $488,487.79 $1.37
Energy Density - kWh/SF/Yr. 14.62 11.98
© B. Alan Whitson29
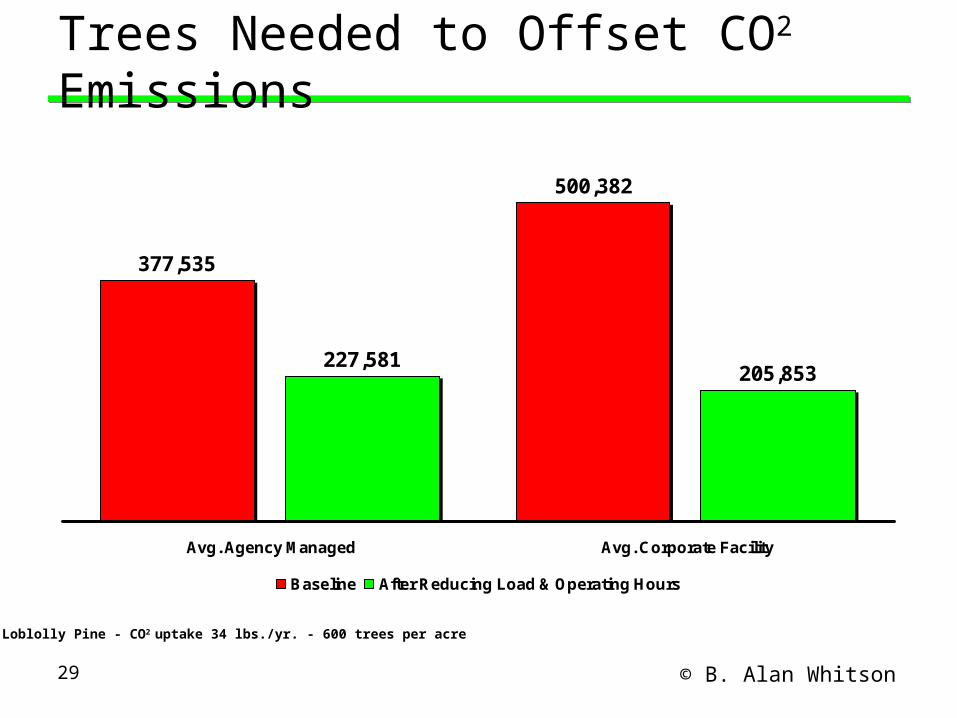
Trees Needed to Offset CO2 Emissions
377,535
500,382
227,581205,853
Avg. Agency Managed Avg. Corporate Facility
Baseline After Reducing Load & Operating Hours
Loblolly Pine - CO2 uptake 34 lbs./yr. - 600 trees per acre

© B. Alan Whitson30
Increased Building Value
$185.60
$190.52$192.21
$195.87
$175
$180
$185
$190
$195
$200
Baseline Reduce Load Reduce Hrs. Reduce Load & Hrs.
Agency Managed Downtown Office Buildings
$ P
er
Sq
. Ft.
$1,587,410 $2,134,498 $3,316,060

© B. Alan Whitson31
Increased Stock Value
$10.01
$10.32
$10.67
$10.84
$9.40
$9.60
$9.80
$10.00
$10.20
$10.40
$10.60
$10.80
$11.00
Baseline Reduce Load Reduce Hrs. Reduce Load & Hrs.
Corporate Facilities - Downtown
$ P
er
Sh
are
$15,279,898$12,220,931$5,780,058

© B. Alan Whitson32
It’s the Money!Corporate Realty, Design & Management Institute
319 SW Washington, Suite 602Portland, OR 97204503-274-7162www.squarefootage.net
B. Alan Whitson, [email protected]