Embed Size (px)
Citation preview

Axia Economicswww.axiaecon.com
Comparing pension systems
MethodologySelected results for OECD countries, Eastern Europe/Central Asia, Latin America/Caribbean
Edward Whitehouse

Comparing pension systems
Fiscal approach: projections of pension expenditure
Institutional approach: describing pension systems’ parameters
Income-distribution analysis: comparing incomes of older people and the
population as a whole

A microeconomic approach
Model of pension entitlements at the individual level Goal: quantitative indicators of pension-system parameters
for cross-country monitoring of retirement-income systems Consistent across a broad range of countries Covers all mandatory pensions
resource-tested schemes (including social assistance) basic schemes minimum pensions earnings-related public and mandatory private schemes mandatory defined-contribution plans
Includes effect of personal income tax and social security contributions

A microeconomic approach
Full-career workers contribute every year from age 20 (or standard entry age) to
normal pension eligibility age Across the earnings distribution: (0.3 to 5 times average
pay) All currently legislated reforms fully in place
‘steady-state’ assumption new labour-market entrants
Macroeconomic assumptions earnings growth (individual and economy): 2% real rate of return (on funded pensions): 3.5% discount rate (for actuarial calculations): 2% mortality rates: latest data for individual countries and
regional averages

Results
Relative pension value pension entitlement as a proportion of
economy-wide average earnings
Indicators of redistributive power of pension systems overall generosity of schemes: average
pension value potential resource transfer to pensioners:
average pension wealth

Pension values0
.25
.5.7
51
1.2
51
.51
.75
2G
ross
pe
nsio
n va
lue
0 .5 1 1.5 2 2.5Earnings

Pension values: OECD0
.25
.5.7
51
1.25
1.5
1.75
2G
ross
pen
sion
val
ue
0 .5 1 1.5 2 2.5Earnings
Ireland
Canada
UK
NZ
Czech R

Pension values: OECD0
.25
.5.7
51
1.2
51
.51
.75
2G
ross
pe
nsio
n v
alu
e
0 .5 1 1.5 2 2.5Earnings
Finland
Spain
Austria
Hungary
Netherlands
Italy
Sweden
Poland

Pension values: OECD0
.25
.5.7
51
1.25
1.5
1.75
2G
ross
pen
sion
val
ue
0 .5 1 1.5 2 2.5Earnings
Switzerland
Norway
Belgium

Pension values: OECD0
.25
.5.7
51
1.2
51
.51
.75
2G
ross
pe
nsio
n va
lue
0 .5 1 1.5 2 2.5Earnings
Luxembourg
Mexico
Iceland
Australia

Pension values: OECD0
.25
.5.7
51
1.2
51
.51
.75
2G
ross
pe
nsio
n v
alue
0 .5 1 1.5 2 2.5Earnings
France
Korea
Germany
Slovak RUS
Japan

Pension values: OECD0
.25
.5.7
51
1.25
1.5
1.75
2G
ross
pen
sion
val
ue
0 .5 1 1.5 2 2.5Earnings
Pension values: ECA0
.25
.5.7
51
1.25
1.5
1.75
2G
ross
pen
sion
val
ue
0 .5 1 1.5 2 2.5Earnings
Bulgaria
Lithuania
Croatia

Pension values: ECA0
.25
.5.7
51
1.2
51
.51
.75
2G
ross
pe
nsio
n v
alu
e
0 .5 1 1.5 2 2.5Earnings
Hungary
Bulgaria
Macedonia
Latvia Poland
EstoniaKazakhstan
Lithuania
Croatia

Pension values: LAC0
.25
.5.7
51
1.2
51
.51
.75
2G
ross
pe
nsi
on
va
lue
0 .5 1 1.5 2 2.5Earnings
Costa Rica
Dominican R

Pension values: LAC0
.25
.5.7
51
1.2
51
.51
.75
2G
ross
pe
nsi
on
va
lue
0 .5 1 1.5 2 2.5Earnings
Costa Rica
Peru
Colombia
Dominican R
Mexico
El Salvador
Chile

Pension values: LAC0
.25
.5.7
51
1.2
51
.51
.75
2G
ross
pe
nsi
on
va
lue
0 .5 1 1.5 2 2.5Earnings
Costa Rica
Peru
Colombia
Argentina
Dominican R
Mexico
El Salvador
Chile

Pension values: LAC0
.25
.5.7
51
1.2
51
.51
.75
2G
ross
pe
nsi
on
va
lue
0 .5 1 1.5 2 2.5Earnings
Costa Rica
Uruguay
Peru
Colombia
Argentina
Dominican R
Mexico
El Salvador
Chile

Redistributive power
All pension systems redistribute income in many complex ways both between and within generations
Focus on one aspect: pension benefits of workers at different earnings levels
An ‘index of redistributive power’ of pension systems that is zero if rich and poor workers get the same replacement rate
(e.g., most funded plans, some public, defined-benefit schemes) is one if rich and poor workers get the same pension amount
(e.g., a universal, flat-rate ‘citizens pension’)
)(, xy
y
y
x
PV
PVI
y
xyx

Role of the tax system
Personal income tax systems are progressive so average effective tax rates are lower for people when
they are retired than when they were working (if replacement rates are less than 100 per cent)
Most countries have concessions for older people in their personal income taxes favourable treatment of pensioners (e.g., extra allowances) favourable treatment of pension income
Pensioners usually not liable for social security contributions (or pay at a much reduced rate)
Therefore, net replacement rates are higher than gross the personal tax system plays an important role in old-age
support

Difference in taxes paid by workers and pensioners
0 .5 1 1.5 2 2.5
-.05
0
.05
.1
.15
.2
.25
.3 Difference in average effective tax rate, percentage points
earnings/income, proportion of average
Germany
Canada
Australia
Finland
France

Difference in taxes paid by workers and pensioners
0 .5 1 1.5 2 2.5
-.05
0
.05
.1
.15
.2
.25
.3 Difference in average effective tax rate, percentage points
Norway
Japan
Netherlands
Italy
Korea
earnings/income, proportion of average

Difference in taxes paid by workers and pensioners
0 .5 1 1.5 2 2.5
-.05
0
.05
.1
.15
.2
.25
.3 Difference in average effective tax rate, percentage points
earnings/income, proportion of average
Sweden
United States
United KingdomSwitzerland
Spain

Gross and net replacement rates: Germany
0
0.25
0.5
0.75
1
1.25
0 0.5 1 1.5 2 2.5 3
Replacement rate,per cent of individual earnings
Individual earnings, proportion of average
Net
Gross
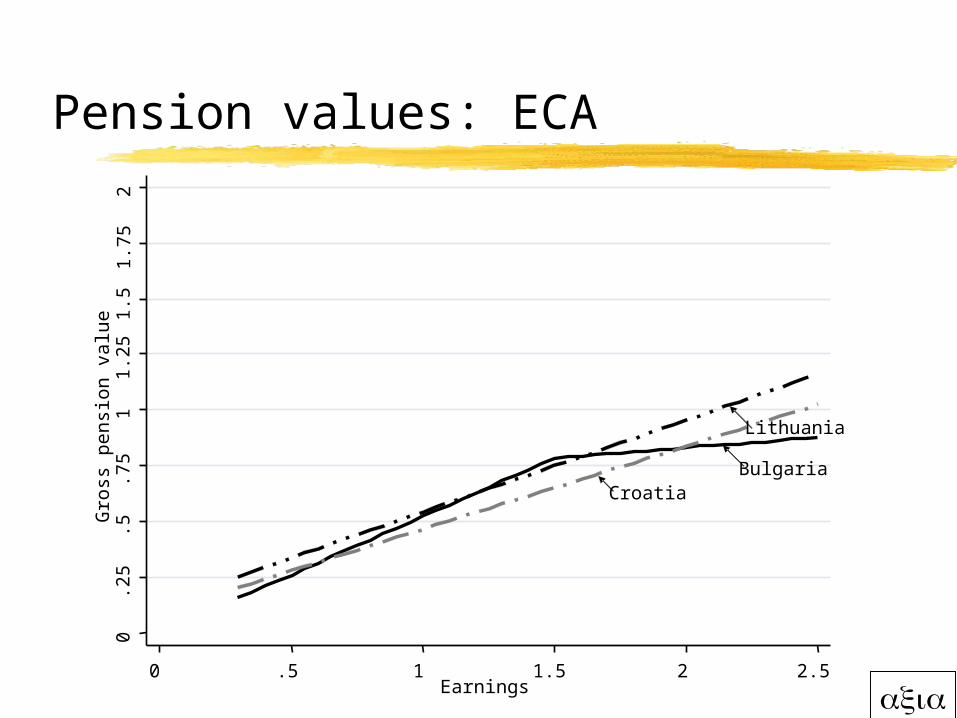
Structure of net replacement rate: Germany
0
0.25
0.5
0.75
1
0.3 0.5 1 1.5 2 2.5 3Individual earnings, proportion of average
Public pension
Taxation and social security contributions

System generosity
Calculate average pension value relative to economy-wide average earnings
Use same synthetic earnings distribution for all countries

System generosity
Calculate average pension value relative to economy-wide average earnings
Use same synthetic earnings distribution for all countries
0 1 2 3 4 5Earnings, multiple of average
Proportion of contributors

Potential resource transfer
Convert weighted average of relative pension value into pension wealth
Relationship between pension value at retirement and pension wealth depends on: indexation of pensions in payment pension eligibility age country-specific mortality

Calculating pension wealth
Pension eligibility age
Age 57 60 63 64 65 67 Value +27.0% +15.4% +3.8% 0 -3.8% -11.3%

Calculating pension wealth
Indexation
Indexing Prices Earnings 50:50 80:20 Value 0 +19.0% +8.9% +3.4%

Calculating pension wealth
Country-specific mortality e.g., life expectancy of Hungarian men is six
years below OECD average this reduces value of pension wealth by 19 per
cent in Australia, France, Japan, New Zealand and
Switzerland, life expectancy is two years above OECD average
this increases value of pension wealth by 7-8 per cent

Structure of pension systems: role of basic schemes
0 25 50 75 100
Estonia
Czech Republic
Lithuania
Canada
Norway
Japan
Netherlands
United Kingdom
Argentina
Ireland
New Zealand
Basic Means-tested DB DC
Per cent of weighted average of total pension wealth by source

Structure of pension systems: role of targeted schemes
0 25 50 75 100
Colombia
Iceland
Australia
Canada
Dominican R
Per cent of weighted average of total pension wealth by source

Structure of pension systems: role of DC schemes
0 25 50 75 100
Costa RicaUruguay
Argentina
Dominican R
ColombiaEl Salvador
ChileMexico
Peru
Per cent of weighted average of total pension wealth from DC scheme

Structure of pension systems: role of DC schemes
0 25 50 75 100
SwedenBulgaria
Costa RicaUruguayHungary
ArgentinaLithuania
EstoniaMacedonia
PolandLatvia
Dominican RCroatia
AustraliaColombia
El SalvadorChile
MexicoKazakhstan
Peru
Per cent of weighted average of total pension wealth from DC scheme

Conclusions
Microeconomic modelling of individual pension entitlements is a useful tool consistent approach across countries with very different
retirement-income systems forward-looking comprehensive: covering all mandatory sources of
retirement income incorporates effect of tax system can isolate the impact of pension policy choices from
the effects of earnings distribution, macroeconomic performance and demographics on the retirement-income system

Future
Gender Disability and survivors’ benefits Pension entitlements and age of retirement Sensitivity analysis Partial careers Special schemes (e.g., public-sector workers) Voluntary schemes (e.g., occupational plans) Incorporate financing of benefits Extend to other regions Regular updates