Embed Size (px)
Citation preview

อัตราค่าระวางในสัปดาห์ที่ 36/2564 วันที ่3-9 กันยายน 2564
_______________________________________________________________________________ โดย สภาผูส้่งสินค้าทางเรือแห่งประเทศไทย (สรท.) 1

อัตราค่าระวางในสัปดาห์ที่ 36/2564 วันที ่3-9 กันยายน 2564
_______________________________________________________________________________ โดย สภาผูส้่งสินค้าทางเรือแห่งประเทศไทย (สรท.) 2
การอัพเดทค่าระวางเรือประจำสัปดาห์
สัปดาห์ที่ 36 พ.ศ. 2564
อัตราค่าระวางในสัปดาห์ที่ 36/2564 วันที ่3-9 กันยายน 2564
_______________________________________________________________________________ โดย สภาผูส้่งสินค้าทางเรือแห่งประเทศไทย (สรท.) 3
สรุปค่าระวางเรือประจำสัปดาห์ "หมายเหตุ: อัตราค่าระวางที่ปรากฎเป็นอัตราฐานของสายเรือที่ประกาศเป็นทางการ ซึ่งอาจต่ำกว่าอัตราที่มีการเรียกเก็บจริงจากผู้ส่งออก" CONTAINER ALL IN FREIGHT RATE (DRY)
ROUTE SIZE
Low Sulphur Surcharge (LSS) Remark USD/20’ USD/40’
Thailand - Shanghai 500 900
Subject to ISOCC USD 57/TEU, USD 115/FEU
Effective till 30-Sep-2021
Thailand - Qingdao 550 950 Thailand - Hong Kong 400 700 Thailand - Japan (Main Port) 500 900 Thailand - Kaohsiung 400 800 Thailand - Klang 400 800
Subject to ISOCC USD 33/TEU, USD 67/FEU
Thailand - Jakarta 400 800 Thailand - Ho Chi Minh (Cat Lai) 350 650 Thailand - Singapore 400 800 Thailand - Manila (North & South)
600 1,400 Subject to CIC at destination
Thailand - Jebel Ali 3,200 5,400 Subject to ISOCC
USD 56/TEU, USD 112/FEU Thailand - South Korea (Busan) 300 600
LSS: USD 60/TEU, USD 120/FEU Thailand - South Korea (Incheon) 350 700 Thailand - Nhava Sheva 3,000 4,200 ISOCC: USD 45/TEU, USD 90/FEU Thailand - Melbourne
3,050-3,150 6,100-6,250 FAF: USD 108/TEU, USD 216/FEU Effective till 14-Sep-2021 Thailand - Sydney
Thailand – Durban / Cape Town 4,000 7,000 Subject to ISOCC
USD 94/TEU, USD 188/FEU Effective till 30-Sep-2021
Subject to SCMC USD 30/BL
Thailand – Europe (Main Port) 7,400 13,200 ISOCC: USD 88/TEU, USD 176/FEU
PSS: USD500/TEU, USD1,000/FEU Subject to ENS USD 30/BL
Thailand - US West Coast Standard Rate:
10,160
Standard Rate: 11,950/12,100
Effective till 14-Sep-2021
Thailand - US East Coast
Standard Rate: 11,160
Premium Rate: 13,000
Standard Rate: 13,200/13,500 Premium Rate:
16,000 Subject to Panama Low Water
USD 30-60/Container หมายเหต:ุ SCMC คือ Security Compliance Management Charge // ISOCC คือ IMO Sox Compliance Charge
สถานการณ์ค่าระวางในช่วงเดือนกันยายน 2564 ค่าระวางในเส้นทางเอเชียส่วนใหญ่คงที่ โดยเส้นทาง Shanghai ค่าระวางคงที่อยู ่ที ่ 500 USD/TEU และ 900 USD/FEU เส้นทาง Hong Kong ค่าระวางคงที่อยู ่ที ่ 400 USD/TEU และ 700 USD/FEU เส้นทาง Klang ค่าระวางคงที่อยู่ที่ 400 USD/TEU และ 800 USD/FEU และเส้นทาง Japan ค่าระวางคงที่อยู่ที่ 500

อัตราค่าระวางในสัปดาห์ที่ 36/2564 วันที ่3-9 กันยายน 2564
_______________________________________________________________________________ โดย สภาผูส้่งสินค้าทางเรือแห่งประเทศไทย (สรท.) 4
USD/TEU และ 900 USD/FEU ซึ่งขณะนี้ยังคงพบปัญหาระวางเรือที่ค่อนข้างแน่น และตู้สินค้าไม่เพียงพอ สำหรับเส้นทาง Durban ค่าระวางคงทีอ่ยู่ท่ี 4,000 USD/TEU และ 7,000 USD/FEU
ส่วนเส้นทางออสเตรเลีย พบว่าค่าระวางปรับเพิ่มขึ้น 700 USD/TEU และ 1,400 USD/FEU โดยเรียกเก็บอยู่ระหว่าง 3,050-3,150 USD/TEU และ 6,100-6,250 USD/FEU และมีการปรับเพิ่มขึ้นของค่า FAF ในขณะที่ เส้นทาง Europe ค่าระวางช่วงครึ ่งเดือนหลังของเดือนกันยายน ค่าระวางปรับเพิ่มขึ ้น 375 USD/TEU และ 250 USD/FEU โดยค่าระวางอยู่ที่ 7,400 USD/TEU และ 13,200 USD/FEU โดยขณะนี้ยังคงพบปัญหาตู้ไม่เพียงพอ และระวางเรือเต็ม ต้องทำการจองล่วงหน้า
ส่วนเส้นทางสหรัฐอเมริกา ช่วงครึ่งเดือนแรกของเดือนกันยายน ค่าระวางปรับเพิ่มขึ้น 1,000 USD/ตู้ ทั้งฝั่ง West Coast และ East Coast โดยค่าระวางที่เป็น Standard Rate ฝั่ง West Coast อยู่ท่ี 10,160 USD/TEU และ 11,950 USD/40’, 12,100 USD/40’HQ และฝั่ง East Coast ค่าระวางอยู่ที ่11,160 USD/TEU และ 13,200 USD/40’, 13,500 USD/40’HQ ส่วนค่าระวางที่เป็น Premium Rate อาจสามารถ Apply ได้เฉพาะเรือบางลำ ซึ่งราคา Premium Rate ของฝั่ง East Coast อยู่ที่ 13,000 USD/TEU และ 16,000 USD/FEU ซึ่งสถานการณ์ปัจจุบันยังคงพบปัญหาระวางเรือเต็ม ขอให้วางแผนการจองล่วงหน้า
CONTAINER FREIGHT RATE (REEFER)
ROUTE SIZE Bunker Surcharge / Low
Sulphur Surcharge Remark USD/20’ USD/40’
Thailand-Hong Kong 1,200 1,300 USD 86/TEU, USD 173/FEU
Effective till 30-Sep-2021 Thailand-Shanghai Thailand-Japan (Tokyo, Yokohama)
1,300-1,400 1,500-1,700 USD 27/TEU, USD 54/FEU
Thailand-EU (Main Ports) (DEHAM, NLRTM, FRLEH)
9,000 13,000 OBS: USD 243/TEU, USD 486/FEU +
PSS: USD 500/TEU, USD 1,000/FEU Effective till 15-Sep-2021
London Gateway / Southampton
10,000 14,000

อัตราค่าระวางในสัปดาห์ที่ 36/2564 วันที ่3-9 กันยายน 2564
_______________________________________________________________________________ โดย สภาผูส้่งสินค้าทางเรือแห่งประเทศไทย (สรท.) 5
กราฟเปรียบเทียบอัตราค่าระวางเรือตู้ 20 และ 40 ฟุต ในเส้นทาง ไทย-ญี่ปุ่น เดือน ก.ค. ถึง ก.ย. ปี 2564
Subject to Low Sulphur Surcharge (Jul. 21): USD 34/TEU และ USD 69/FEU
(Aug.-Sep.21): USD 57/TEU และ USD 115/FEU
กราฟเปรียบเทียบอัตราค่าระวางเรือตู้ 20 และ 40 ฟุต ในเส้นทาง ไทย-Jebel Ali เดือน ก.ค. ถึง ก.ย. ปี 2564
Subject to
- Low Sulphur Surcharge (Jul.-Sep 21): USD56/TEU และ USD112/FEU
0
100
200
300
400
500
600
700
800
900
31 Jul 21 31 Aug 21 30 Sep 21
500 500 500
900 900 900
FREI
GH
T (U
SD)
JAPAN
20'DC
40'DC
1000
1500
2000
2500
3000
3500
4000
31 Jul 21 31 Aug 21 30 Sep 21
2150
2700
3200
38004700 5400
FREIG
HT (U
SD)
JEBEL ALI
20'DC
40'DC

อัตราค่าระวางในสัปดาห์ที่ 36/2564 วันที ่3-9 กันยายน 2564
_______________________________________________________________________________ โดย สภาผูส้่งสินค้าทางเรือแห่งประเทศไทย (สรท.) 6
กราฟเปรียบเทียบอัตราค่าระวางเรือตู้ 20 และ 40 ฟุต ในเส้นทาง ไทย-ยุโรป เดือน ก.ค. ถึง ก.ย. ปี 2564
Subject to - ISOCC (Jul.-Sep. 21): USD88/TEU, USD176/FEU - ENS: USD30/BL - PSS: USD500/TEU, USD1,000/FEU
กราฟเปรียบเทียบอัตราค่าระวางเรือตู้ 20 และ 40 ฟุต ในเส้นทาง ไทย-สหรัฐอเมริกา West Coast เดือน ก.ค. ถึง ก.ย. ปี 2564
2000
3000
4000
5000
6000
7000
8000
9000
10000
11000
12000
13000
31 Jul 21 31 Aug 21 30 Sep 21
6825 70257400
12750 12950 13200
FREIG
HT (U
SD)
EUROPE
20'DC
40'DC
0
2000
4000
6000
8000
10000
12000
14000
31 Jul 21 31 Aug 21 14 Sep 21
80009160 1016010000
1110012100
FREIG
HT (U
SD)
US WEST COAST
20'DC
40'DC

อัตราค่าระวางในสัปดาห์ที่ 36/2564 วันที ่3-9 กันยายน 2564
_______________________________________________________________________________ โดย สภาผูส้่งสินค้าทางเรือแห่งประเทศไทย (สรท.) 7
กราฟเปรียบเทียบอัตราค่าระวางเรือตู้ 20 และ 40 ฟุต ในเส้นทาง ไทย-สหรัฐอเมริกา East Coast เดือน ก.ค. ถึง ก.ย. ปี 2564
Subject to Panama Low Water Surcharge: USD 30-60/Container
➢ รวบรวมประกาศสำคัญจากสายเรือ สายเรือ Zim Line
• ประกาศแจ้งปรับการเรียกเก็บค่า New Bunker Factor (NBF) โดยมีรายละเอยีดปรากฎดังตาราง
US west coast laden container exports fall again in July In contrast, exports of empty containers have been at a record high level this year, as lines prioritize empty box repositioning. Exports from the major US west coast container ports took another hit in July, falling to their lowest level since at least 2010, the earliest BIMCO has data for, the shipping association reported today, as lines continue to prioritise empty box repositioning.
BIMCO reported that “just 327,417 TEU have been exported with goods” in July. “In contrast, exports of empty containers have been (at a) record high (level) this year with July seeing 770,475 empty TEU exported. Still, this marks a decrease from May when they totalled 876,506 TEU. In the first seven months of the year have totalled 5.3m TEU, up 57.6% from 2020.”
BIMCO added that laden container exports “have been under pressure not only from lower exports from the US manufacturers as a direct result of the pandemic and the weak recovery of the sector, but also because of the pressure the container shipping industry is currently facing. Carriers are desperate to get containers back to the Far East as fast as possible for their next fronthaul load, even if this means sacrificing a backhaul load. “Full warehouses and delays in hinterland transport all make it harder for exporters to secure the containers they need for their exports.”
0
2000
4000
6000
8000
10000
12000
14000
31 Jul 21 31 Aug 21 14 Sep 21
8800
10160 111601100012500 13500
FREI
GH
T (U
SD)
US EAST COAST
20'DC
40'DC
Effective 1 -Sep- 2021 Effective 1 -Oct- 2021Far East to Mediterranean/Black Sea & Europe USD 341/TEU USD 331/TEUMediterranean/Black Sea & Europe to Far East USD 184/TEU USD 179/TEU
RoutingNew Bunker Factor (NBF)
อัตราค่าระวางในสัปดาห์ที่ 36/2564 วันที ่3-9 กันยายน 2564
_______________________________________________________________________________ โดย สภาผูส้่งสินค้าทางเรือแห่งประเทศไทย (สรท.) 8
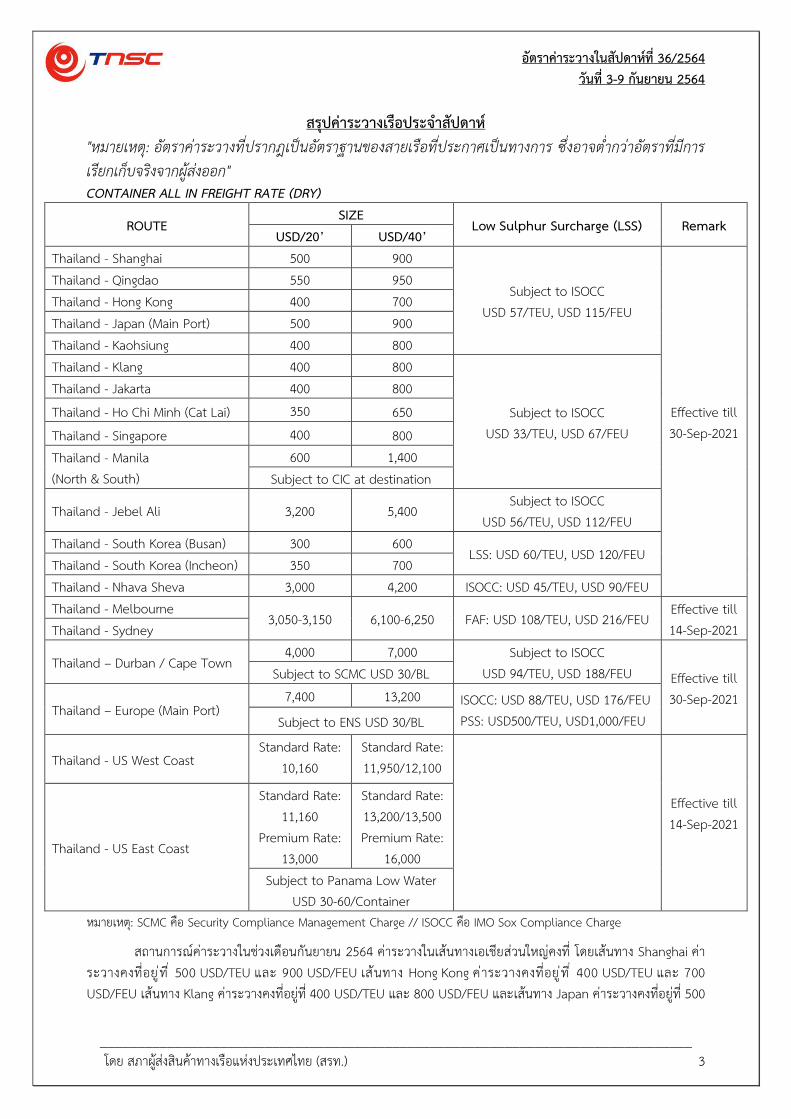
Pandemic has accelerated years of decline
So far this year, a total of 2.6m TEU of laden containers have been exported by USWC ports, a 7% drop from the same period in 2020, which was itself down 7.8% from the first seven months of 2020, BOMCO noted. “USWC exports of laden containers had already been falling before the pandemic and the current disruption,” it added. “The last time there was any meaningful growth was in 2016 when laden exports rose 7.3%. Since then, laden container exports have fallen year-on-year in every year except for 2018 when they grew by a measly 0.3%.
Peter Sand BIMCO’s Chief Shipping Analyst, commented: “The 7% year-on-year drop in accumulated laden container exports from the US West Coast is just another example of how disruptions to the container shipping market over the past twelve months are affecting trade. Laden exports have been on a downward trend since March and as congestion, port waiting times and the container shortage remains high, exporters may continue to struggle finding containers for their goods, even as US manufacturing, and thereby potentially also exports recover from their pandemic slump.”
Source: https://www.lloydsloadinglist.com/
Congestion worsens at US west coast ports Various reports indicate that the numbers of containerships waiting at LA and Long Beach have risen again to more than 40 vessels, with no expectation of improvements in the near term. Congestion has worsened again in recent days at US west coast ports, leaving some experts to conclude that the disruptions to US and global supply chains caused by the current ocean freight bottlenecks will take at least a further six months to unravel.
Recent reports indicate that the numbers of vessels waiting at the ports of LA and Long Beach (LAX/LGB) had risen again to an historic high of more than 40 vessels queueing, “with no expectation to improve in the near term”, freight forwarder Flexport noted. A senior freight executive at another freight forwarder this week said the ocean freight backlog was building again to the extent that on the west coast of the US the situation is now worse than during the most extreme congestion several months ago, noting: “In Long Beach, we are now up to 42 ships sitting off the coast and more than 80 ships along the West Coast, so it has not improved at all – which leads us to believe that this will continue for at least another six months.”

อัตราค่าระวางในสัปดาห์ที่ 36/2564 วันที ่3-9 กันยายน 2564
_______________________________________________________________________________ โดย สภาผูส้่งสินค้าทางเรือแห่งประเทศไทย (สรท.) 9
Container shipping analyst Lars Jensen, CEO of Vespucci Maritime, observed that in the last two weeks, “freight rates continue to stay high, space remains scarce, vessel charter rates continue to soar and bottlenecks remain stubbornly present” – exemplified by data today indicating there are “44 vessels waiting outside Los Angeles/Long Beach”. Demand has stalled
He highlighted new data from two days ago from Container Trade Statistics (CTS) which highlighted that “demand is not the culprit here”, adding: “For all intents and purposes, global demand has now stalled. Global demand in July 2021 is up only slightly more than 1% compared to the pre-pandemic market 2 years ago in 2019. In terms of regional imports, only North America has shown genuine growth in July compared to 2019.”
As previous analysis has also indicated in recent months, it is the high levels of delays, not growth in demand, that is the main cause of the current shortages in container shipping capacity, with estimates indicating that as much as 25% of container shipping capacity is currently tied up in vessel and port congestion delays. “Of course, this only measures demand which has actually moved – there are no statistics to show how much cargo has potentially been left behind and is not yet moved,” Jensen highlighted. “But it clearly shows that the tight market is exclusively driven by capacity-side issues. The bottlenecks remain the problem and appear no closer to a resolution than they were two weeks ago.” Landside issues
But he added that the problems are not just due to pressure on carrier capacity, noting: “Let us not forget that a part of the problem in the ports is not related to the vessels, but is related to the processes surrounding getting cargo to and from the port from the landside – an issue which in itself has numerous different components and they are not necessarily related to the port itself but to elements such as trucking, chassis or rail shortages or to elements such as shippers for a variety of reasons picking up their cargo later than usual.”
In its latest Freight Market Update, Flexport said capacity on Asia to North America (TPEB) services “remains constrained, relative to peak-season demand, as shippers and importers look to pay all-time high premium prices to get urgent cargo out from origins as soon as possible. Labour strains, extreme congestion, and Covid-19 related disruptions are expected to place additional pressure on capacity as we head into the fall and winter.” Rates remain at record highs
Spot rates remain at record highs, with a 1 September GRI implemented and a 15 September GRI expected. With space “critical”, and equipment facing “severe undercapacity”, it recomments shippers to “continue to book well in advance (at least 4 to 6 weeks) prior to CRD for best chance of hitting it. Encourage suppliers to support departures from different origin ports. Consider terminating cargo at destination coastal ports to prevent intermodal delays.”
On Asia to Europe (FEWB) trades, the picture is similar, with Flexport noting: “Space and equipment crunches continue. Market demand exceeds supply as rates skyrocket. The situation is worsened by blank sailings and poor equipment availability. Carriers are overcommitted and are limiting booking acceptance or rolling shipments. Schedule reliability is low.”
The forwarder continued: “Rates remain at a record high level but are stable going into September. Rates may increase further due upcoming Golden Week blank sailings.” With an “extremely critical space situation” and “severe equipment shortage across all Asia origins”, it recommends that customers “book at

อัตราค่าระวางในสัปดาห์ที่ 36/2564 วันที ่3-9 กันยายน 2564
_______________________________________________________________________________ โดย สภาผูส้่งสินค้าทางเรือแห่งประเทศไทย (สรท.) 10
least 4 to 5 weeks prior to CRD. Consider premium options, which may be limited. Be flexible in regard to equipment.”
Source: https://www.lloydsloadinglist.com/
US retailers boost Q4 import forecast amid supply chain bottlenecks US retailers Thursday upped their projections for import volumes in the fourth quarter, saying some holiday merchandise that was due to land over the summer months has been delayed by the congestion in global supply chains and will not arrive until at least October.
Year-over-year growth in trans-Pacific volumes is slowing in August and September from earlier projections made by the Global Port Tracker, which is published monthly by the National Retail Federation (NRF) and Hackett Associates. In the current issue released Thursday, retailers said they expect port congestion in Asia and the US, and inland supply chain bottlenecks due to rail and trucking issues, to continue to delay shipments, in effect pushing the traditional August-October peak season into November and December. Retailers project that September imports will increase 5.1 percent year over year, up from the 4.9 percent projection in the August Global Port Tracker. October imports are projected to be down 1.3 percent from October 2020; last month, retailers projected a 3 percent drop. November imports are projected to increase 1.4 percent compared with the projection of a drop of 1.5 percent last month. December imports are projected to be down 1.8 percent; retailers last month projected a drop of 4.1 percent. Monthly comparisons this year are skewed by bottlenecks that have delayed merchandise from leaving congested Asian ports as a rise in COVID-19 cases in China and Southeast Asia disrupted operations in Yantian, Ningbo, and Vietnam. When the ships arrived at US ports, vessel bunching and congestion at inland rail hubs further delayed delivery of the products to warehouses and store shelves.
The extent of vessel bunching in US ports is shown in the daily anchorage reports from the Marine Exchange of Southern California. Los Angeles-Long Beach is the largest US port complex and handles about 50 percent of US imports from Asia, according to PIERS, a sister company of JOC.com within IHS Markit. The Marine Exchange reported on Wednesday that there were 43 container ships at anchor awaiting berthing space, with another 32 container ships at berth.
Although US imports are expected to remain at near-record levels during the remainder of the year, monthly year-over-year increases will be in the low single digits. That’s because imports will be benchmarked from huge import volumes in the second half of 2020 as the US economy recovered rapidly from the COVID-19 lockdowns in the first half of 2020. Retailers expect supply chains to be challenged through the end of the year
“We’re seeing issues ranging from port closures in Asia to ships lined up waiting to dock at US ports. That’s creating continuing challenges as retailers work to supply enough inventory to meet demand,” Jonathan Gold, vice president for supply chain and customs policy at the NRF, said in Thursday’s Global Port Tracker.

อัตราค่าระวางในสัปดาห์ที่ 36/2564 วันที ่3-9 กันยายน 2564
_______________________________________________________________________________ โดย สภาผูส้่งสินค้าทางเรือแห่งประเทศไทย (สรท.) 11
According to PIERS, which Thursday released actual numbers for August, total US imports last month edged up 1.9 percent from August 2020. No immediate recovery from bottlenecks is expected. No matter if the year-over-year import volumes will be up slightly or down slightly each month for the rest of the year, the US and international supply chains will be struggling to handle near-record volumes, so the logistics problems that retailers have faced for much of 2021 will continue, said Ben Hackett, founder of Hackett Associates.
“Supply chain logistics management is facing acute problems as disruptions make it difficult for both importers and exporters to transact their business. We are facing shortages in all sectors of the chain: a lack of sufficient shipping capacity, which leads to increases in the cost of shipment; lack of warehousing; lack of truck and rail capacity; and a shortage of labor across the board,” Hackett said.
Source: https://www.joc.com/

อัตราค่าระวางในสัปดาห์ที่ 36/2564 วันที ่3-9 กันยายน 2564
_______________________________________________________________________________ โดย สภาผูส้่งสินค้าทางเรือแห่งประเทศไทย (สรท.) 12
ตารางสรุปอัตราค่าระวางจากเอเชียไปเส้นทางต่างๆ อ้างอิงจาก Shanghai Containerized Freight Index (SCFI) Source: http://en.sse.net.cn/indices/scfinew.jsp
Shanghai Containerized Freight Index (SCFI)
Description Unit Weighting Previous Index
3 Sep 2021 Current Index 10 Sep 2021
Comprehensive Index 4502.65 4568.16 Service Routes Europe (Base port) USD/TEU 20% 7443 7491 Mediterranean (Base port) USD/TEU 10% 7289 7365 USWC (Base port) USD/FEU 20% 6266 6322 USEC (Base port) USD/FEU 7.50% 11648 11731 Persian Gulf and Red Sea (Dubai) USD/TEU 7.50% 3830 3941 Australia/New Zealand (Melbourne) USD/TEU 5.00% 4154 4198 East/West Africa (Lagos) USD/TEU 2.50% 8340 8359 South Africa (Durban) USD/TEU 2.50% 6624 6732 South America (Santos) USD/TEU 5.00% 10012 10148 West Japan (Base port) USD/TEU 5.00% 281 303 East Japan (Base port) USD/TEU 5.00% 282 305 Southeast Asia (Singapore) USD/TEU 7.50% 883 921 Korea (Pusan) USD/TEU 2.50% 271 273
สรุปรายงานประจำสัปดาห์ ความต้องการขนส่งอยู่ในปริมาณสูง โดยที่ค่าระวางยังคงปรับเพิ่มสูงขึ้น และจากมาตรการควบคุมไวรัสที่ได้ผลดีในประเทศจีน ทำให้ท่าเรือหลายแห่งกลับมาดำเนินการได้ตามปกติภายหลังจากท่ีมีการล็อคดาวน์ไปบางสว่น ทำให้ปริมาณการส่งออกสินค้าเพิ่มสูงขึ้น โดยที่ความหนาแน่นของท่าเรือเริ่มดีขึ้น สำหรับเส้นทางยุโรป พบว่ามีความต้องการสินค้านำเข้าหลายประเภทในปริมาณสูง โดยที่ยังคงพบปัญหาความหนาแน่นในบางท่าเรือ สำหรับเส้นทางสหรัฐอเมริกา พบว่ามีความต้องการสินค้านำเข้าสำหรับต้านไวรัสในปริมาณสูง ซึ่งปัญหาประสิทธิภาพการทำงานในท่าเรือ และปัญหาความหนาแน่นภายในท่าเรือ ยังคงเป็นปัจจัยลบในเส้นทาง ในขณะที่เส้นทางออสเตรเลีย หลายพื้นที่มีการล็อคดาวน์ ทำให้ความต้องการนำเข้าสินค้ามีปริมาณสูง และอัตราค่างระวางยังอยู่ในทิศทางขาข้ึน ส่วนเส้นทางญี่ปุ่นพบว่า Demand และ Supply รวมถึงค่าระวางยังอยู่ในระดับคงที่ และสุดท้ายเส้นทางอเมริกาใต้ ยังคงมีปริมาณความต้องการนำเข้าสินค้าจำเป็นในการดำรงชีพ และอุปกรณ์ทางการแพทย์ในระดับสูง ทำให้ระวางเรือในเส้นทางยังคงค่อนข้างแน่น
----------------------------------