Embed Size (px)
Citation preview
Glo
bal C
hem
ical
s an
d W
aste
Rev
iew
Doc
umen
t
| 2
021
|
2021
Global Chemicals and Waste Indicator Review Document
United Nations Environment Programme
P.O. Box 30552-00100, Nairobi, KENYA
E-mail: [email protected]
© D
rew
Sul
ock
| Shu
tters
tock
© D
rew
Sul
ock
| Shu
tters
tock

Copyright © United Nations Environment Programme, 2021
ISBN No: 978-92-807-3873-5
Job No: DEW/2371/NA
This publication may be reproduced in whole or in part and in any form for educational or non-profit purposes without
special permission from the copyright holder, provided acknowledgement of the source is made. The United Nations
Environment Programme would appreciate receiving a copy of any publication that uses this publication as a source.
No use of this publication may be made for resale or for any other commercial purpose whatsoever without prior
permission in writing from the United Nations Environment Programme. Applications for such permission, with a
statement of the purpose and extent of the reproduction, should be addressed to the Director, Communication Division,
UNEP, P. O. Box: 30552, Nairobi 00100, Kenya.
The use of information from this document for publicity or advertising is not permitted. Trademark names and symbols
are used in an editorial fashion with no intention on infringement of trademark or copyright laws.
Disclaimers
The designations employed and the presentation of the material in this publication do not imply the expression of any
opinion whatsoever on the part of the United Nations Environment Programme and UN-Habitat concerning the legal
status of any country, territory, city or area or of its authorities, or concerning delimitation of its frontiers or boundaries.
The views expressed do not necessarily represent the decision or the stated policy of the United Nations Environment
Programme and UN-Habitat, nor does citing of trade names or commercial processes constitute endorsement.
Recommended Citation
United Nations Environment Programme (2021). Global Chemicals and Waste Indicator Review Document. Nairobi.
UNEP promotes environmentally sound practices
globally and its own activities. This report is printed on paper from
sustainable forests including recycled fibre. The paper is chlorine free and the inks vegetable-based. Our distribution
policy aims to reduce UNEP’s carbon footprint.

Global Chemicals and Waste Indicator Review Document

2Global Chemicals and Waste Indicator Review Document
Table of contents
Acronyms ...............................................................................................................................3
Acknowledgments ..................................................................................................................5
Background ............................................................................................................................7
1. Introduction ......................................................................................................................11
2. Links with existing initiatives ............................................................................................15
3. Definitions ........................................................................................................................18
4. Methodology for Indicator 11.6.1 .....................................................................31I. Proposed Approach................................................................................................................ 33II. Step-by-step guide ................................................................................................................ 35III. Disaggregation ..................................................................................................................... 39IV. Data Sources, availability and production ........................................................................... 39V. Discussion: opportunities and limitations ........................................................................... 40
5. Methodology for Indicator 12.3.1b ...................................................................44I. Proposed approach ................................................................................................................ 46II. Step-by-step guide ................................................................................................................ 46III. Disaggregation ..................................................................................................................... 53IV. Data sources, availability and production ........................................................................... 54V. Discussion: opportunities and limitations ........................................................................... 56
6. Methodology for Indicator 12.4.2 ....................................................................60I. Proposed approach ................................................................................................................ 60II. Step-by-step guide ................................................................................................................ 61III. Disaggregation ..................................................................................................................... 72IV. Data Sources, availability and production ........................................................................... 73V. Discussion: opportunities and limitations ........................................................................... 74
7. Methodology for Indicator 12.5.1 ....................................................................78I.Proposed approach ................................................................................................................. 78II. Step-by-step guide ................................................................................................................ 79III. Disaggregation ..................................................................................................................... 86IV. Data sources, availability and production ........................................................................... 87V. Discussion: opportunities and limitations ........................................................................... 87
8. Data assessment tool ........................................................................................................95
References ...........................................................................................................................96
Annex I: Linkages with Multilateral Environment agreements and existing reporting ..............99A. Initiatives ................................................................................................................................................... 99B. Current status of reporting ..................................................................................................................... 118
Annex II: Methods appropriate for each food chain stage .....................................................126
Annex III: Data Assessment Tool .........................................................................................131

3Global Chemicals and Waste Indicator Review Document
Table of contents
Acronyms
ADB Asian Development Bank
AfDB African Development Bank
BRS Secretariat Secretariat of the Basel, Rotterdam and Stockholm Conventions
COP Conference of the Parties
DMC Domestic Material Consumption
DMI Direct Material Inputs
DNA Designated National Authorities
EBRD European Bank for Reconstruction and Development
EC European Commission
EEA European Environment Agency
EEA/EFTA European Economic Area/European Free Trade Association
EPA Environmental Protection Agency
EPR Extended Producer Responsibility
ERS Electronic Reporting System
EU European Union
EUROSTAT European Union statistics
EW-MFA Economy-Wide Material Flow Accounts
FLI Food Loss Index
FLW Food Loss and Waste
FLWP Food Loss and Waste Protocol, multi-stakeholder partnership which developed the FLWS
FLWS Food Loss and Waste Accounting and Reporting Standard
FWI Food Waste Index
GDP Gross Domestic Product
GFLI Global Food Loss Index
GIZ Deutsche Gesellschaft für Internationale Zusammenarbeit – German development agency
IAEG UN Inter-agency and Expert Group on SDG Indicators
ICCM International Conference on Chemicals Management
IPCC Intergovernmental Panel on Climate Change
ISIC International Standard Industrial Classification of all Economic Activities
ISWA International Solid Waste Association
JICA Japan International Cooperation Agency
LAFA Loss-Adjusted Food Availability
MBT Mechanical-Biological Treatment
MEA Multilateral Environment Agreement
MF Material Footprint
MFA Material Flow Analysis/Material Flow Accounts
MSW Municipal Solid Waste
NACE Statistical Classification of Economic Activities in the European Community

4Global Chemicals and Waste Indicator Review Document
Table of contents
NFP National Focal Point
NIP National Implementation Plan
ODSs Ozone Depleting Substances
OECD Organisation for Economic Cooperation and Development
PAHO Pan American Health Organization
PIC Procedure Prior Informed Consent Procedure (Basel and Rotterdam Conventions)
POPs Persistent Organic Pollutants
RWA Resources and Waste Advisory Group
SAICM Strategic Approach to International Chemicals Management
SDG Sustainable Development Goal
SDI Sustainable Development Indicator
SEEA System of Environmental-Economic Accounting
UK United Kingdom
UN United Nations
UNECE United Nations Economic Commission for Europe
UNEP United Nations Environment Programme
UNSD United Nations Statistics Division
UNU United Nations University
USAID United States Agency for International Development
USDA United States Department of Agriculture
WACS Waste Amounts and Composition Survey
WaCT Waste Wise Cities Tool
WaW What a Waste
WB World Bank
WFA Waste Flow Account
5Global Chemicals and Waste Indicator Review Document
Table of contents
Acknowledgments
This review document was jointly prepared by the
United Nations Environment Programme (UNEP)
and UN-Habitat.
The United Nations Statistics Division (UNSD)
provided inputs to this document.
UN-Habitat and UNSD are co-custodians for
SDG indicator 11.6.1.
UNEP and UNSD are co-custodians for indicators
12.4.2 and 12.5.1.
Under the overall guidance of Mr. Jian Liu, Director of
the Science Division at UNEP, the review document
was drafted by a core team of authors consisting
of Diana Gheorghiu (RWA), Reka Soos (RWA), Sam
Gillick-Daniels (WRAP), Nao Takeuchi (UN-Habitat),
James Lomax (UNEP), Clementine O’Connor (UNEP),
Gabriela Gavgas (RWA), Tom Quested (WRAP),
David Marquis (UNEP) and Jillian Campbell (UNEP).
The process of developing this review document
also involved consultations with a broad group of
experts on environment and waste statistics, who
provided advice on the methodology and on the
operationalization of the indicators proposed herein.
The authors wish to sincerely thank the following
experts who provided their input through the Expert
Consultations held on this subject (in alphabetical
order of surname): Reffouh Abdelhafid, Ministere
d’Interieur-Morocco; Mr. Mahman Coulibaly
Adamou, Ministry of Environment, Urban Sanitation
and Sustainable Development-Niger; Mr. Graham
Alabaster, UN-Habitat; Mr. Elio Alvarenga, Center for
the Study and Control of Contaminants (CESCCO),
Honduras; Douguegar Masra Arsene, Ministere
de l’Environnement de l’Eau et de la Peche-Chad;
Ms. Elma Babic, Zeos Roodradeo Bhugwant
Ramarosandratana, Ministry of Social Security
National Solidarity Environment and Sustainable
Development-Mauritius; Mr. Kees Balde, United
Nations University; Ms. Senka Mutabdzija Becirovic,
UNDP Bosnia; Alix Bertille, Mairie de Libreville-
Gabon; Mr. Steffen Blume, GIZ; Mr. Hamadjoda,
Ministry of Environment, Protection of Nature, and
Sustainable Development of Cameroon; Kamaria
Hassane, INRAPE (Institut National de Recherche
pour l'Agriculture la Pêche et l'Environnement)-
Comoros; Sory Camara, L'Agence Nationale de
l'Assainissement et de la Salubrité Publique-
Guinea; Joao Augusto Cipriano, Ministry of Land,
Environment-Mozambique; Amin Okello Ayen Daniel,
Kampala Capital City Authority-Uganda; Idrissa
Diatta, Unite de Coordination de la Gestion des
Dechets Solides (UCG)-Senegal; Netsanet Shimels
Bekele Diseremo, Ministry of Urban Development
and Construction-Ethiopia; Mr. Constantino Bruno
Domingos Dundao, National Waste Agency-
Angola; Leyono Borel Hermann, Mairie Centrale de
Brazzaville-Republic of the Congo; Mr. Juan Carlos
Oreamuno Hernandez, Ministerio de Salud de Costa
Rica; Ms. Amela Hrbat, ECOPAK; Mr. Mohamed
Hossameldin Mostafa Ibrahim, Waste Management
Regulation Agency, Ministry of Environment-
Egypt; Mr. Edwin Janssen, The Natural Step
Germany; Mukunu Ngeabog Kandolo Jean, Régie
d'Assainissement de Kinshasa (RASKIN)-Democratic
Republic of the Congo; Abderamane Jean-Bosco,
Mairie de Bangui-Central Africa; Sebit John, Juba
City Council, Jubek State-South Sudan; Erica Jones,
Ministry of Local Government, Public Works and
National Housing-Zimbabwe; Mr. Velimir Jukic,
Agency for Statistics of Bosnia and Herzegovina; Mr.
Kosuke Kawai, National Institute for Enviornmental
Studies, Japan; Rija Lalaina, Ministère de l'Energie,

6Global Chemicals and Waste Indicator Review Document
Table of contents
de l'Eau et des Hydrocarbures-Madagascar; Adame
Saidou Sougou Latsiere, Minedded-Cameroon; Mr.
Jibrin Lawal, Managing Director's Office, Kaduna
Environmental Protection Agency-Nigeria; Ms.
Constantin Hilma Ligola, Environmental Health
and Safety, Ondangwa Town Council-Namibia; Mr.
Banda William Kachikoti, Public Health Department,
Lusaka City Council-Zambia; Motseki Khuto, Maseru
City Council-Lesotho; Mr. Isaac Muraya Kimani,
Nairobi City County Government; Ms. Eiko Kojima,
Japan International Cooperation Agency (JICA);
Ms. Sevala Korajcevic, Agency for Statistics of
Bosnia and Herzegovina; Mr. Prakash Kowlesser,
Independent Expert; Ouattara Lazeni, Ministère de
l'Assainissement et de la Salubrité-Cote d'Ivoire;
Mr. Setshabelo Mabitso, Environmental Health,
South East District Council-Botswana; Mr. Motha
Andrew Makhiwesizwe, Municipal Waste Support,
Department of Environmental Affairs-South Africa;
Dalla Mamadou, Ministère de l’Environnement de
I 'Economie Verte et du Changement Climatique
(MEVCC) / Direction Générale de la Préservation
de I 'Environnement (DGPE)-Burkina Faso; Mr.
Nyirenda Patrick Medius, Air and Pollution Control,
Envrionmental Affairs Department-Malawi;
Charmarke Youssouf Moussa, Office de la Voirie de
Djibouti (OVD)-Djibouti; Ms. Andrea Muharemovic,
UNDP Bosnia; Ms. Marina Mujezinovic, UNDP
Bosnia; Mr. Michael Nagy, United Nations Economic
Commission for Europe; Mr. Mwangi Samuel Ndungu,
Environment, Nairobi City County Government-
Kenya; Mr. Ijawan Ernest Kwabena Nlason, Waste
Management Department, Tema Metropolitan
Assembly-Ghana; Prince Dagnon Olga, Ministère du
Cadre de Vie et du Développement Durable-Benin;
Aicha-Deka Mohamed Osman, Office de la Voirie
de Djibouti-Djibouti; Ms. Kattya Elizondo Orozco,
Ministerio de Salud de Costa Rica; Ms. Aditi Ramola,
International Solid Waste Association; Hafiz Amadu
Varlee Sannor, Montserrado City Cooperation-
Liberia (ACCP); Ms. Anne Scheinberg, Springloop
Cooperatie; Ms. Reena Shah (UNSD); Mr. Laska
Sophal, Ministry of Environment, Cambodia; Mr.
Seyama Jabulani Thokozani, Environmental Health
Department, Hlangano Town Council-Eswatini; Mr.
Eugenio Androvetto Villalobos, Ministerio de Salud
de Costa Rica; Mr. Andy Whiteman, RWA Group; Mr.
Imanol Zabaleta, Swiss Federal Institute of Aquatic
Science and Technology (EAWAG); Mr. Christian
Zubrugg, Swiss Federal Institute of Aquatic Science
and Technology (EAWAG).
The review document was edited by Therese
El Gemayel (UNEP) and David Berman (UNEP)
UNEP publication support team – Angeline Djampou,
Science Division, UNEP (library), Ralf Heidrich,
Science Division, UNEP (data updating); Audrey
Ringler, Science Division, UNEP (cover design).
Publication design and layout – Estudio Relativo

7Global Chemicals and Waste Indicator Review Document
Table of contents
Background
In September 2015, the United Nations Sustainable
Development Summit adopted a new framework to
guide development efforts between 2015 and 2030,
entitled “Transforming our world: the 2030 Agenda
for sustainable development”. The 2030 Agenda
contains 17 Sustainable Development Goals (SDGs),
divided into 169 targets, which are informed by
247 indicators.
Sustainable Development Goal 11, Make cities
and human settlements inclusive, safe, resilient
and sustainable, promotes sustainable urban
development through intelligent urban planning and
basic service provision that creates safe, affordable,
resilient, green cities with equitable access to basic
services and healthy living condition. The SDG
11 targets cover different areas of basic service
provision and environment impact reduction in cities
and one of them is measured by indicator 11.6.1 on
municipal solid waste management.
A global data collection and publication system through
the UNSD/UNEP Questionnaire on Environment
Statistics has collected data on municipal solid waste
(MSW) collection and treatment since 1999. Data
has been received from about 160 to 170 countries,
covering both national and city levels. However, the
response rate for the UNSD/UNEP Questionnaire is
hovering around 50% and data completeness and
quality remain a challenge, especially for developing
countries. This indicates that it is critical to improve
the availability and accessibility of waste statistics
and increase training for collection of data and
capacity development on the ground.
This paucity of evidence-based data hinders the
development of waste management strategies
and constrains investment decision-making in
infrastructure and service expansion, leading in
many countries to insufficient or absent MSW
management services. Poor MSW collection and
management trigger severe threats to public
health and pollute air and water. Furthermore,
uncollected, and mismanaged waste is the main
source of marine plastic pollution. SDG indicator
11.6.1 quantifies parameters that will help cities and
countries to better manage resources, mitigate and
prevent environmental pollution, create business,
employment and livelihood opportunities, and shift
towards a circular economy. The methodology to
monitor SDG indicator 11.6.1 provides guidelines
for ladders for MSW collection services and control
level of waste management facilities, and aims to
bring standardized definitions, nomenclature and
techniques to MSW data collection.
Waste management concerns various
socioeconomic and environmental aspects by
addressing a plethora of challenges linked to health,
poverty, food security, resource management, climate
change and equal participation. The waste sector
is widely and mistakenly assumed to be gender-
neutral, and impacts of exposure to hazardous waste
and chemicals affect humans differently depending
on their sex, age and gender role. According to
UNEP´s “Gender and Waste Nexus” report (UNEP,
2019), gender inequalities are embedded in almost
all aspects of waste management and overcoming
the presumption of gender neutrality is the first
step to mainstreaming gender in the waste sector.
To do so, it is essential to collect and report data
disaggregated by sex, age and gender role to ensure
progress towards gender equity and equality.
Sustainable Development Goal 12, Ensure
sustainable consumption and production patterns,
8Global Chemicals and Waste Indicator Review Document
Table of contents
promotes increased human well-being while
decoupling economic growth from resource use
and environmental degradation. The SDG 12
targets cover a range of entry points and actors for
promoting responsible consumption and production.
This includes a series of indicators related to waste
generation and management, including Indicators
12.4.2 on hazardous waste, 12.5.1 on recycling and
12.3.1a on food waste.
Food security is becoming an increasingly serious
concern to countries across the planet as the
population increases yet the capacity of the
agricultural sector has not been able to keep up.
One of the lowest hanging fruits to increase out food
capacity to by limiting food waste. Furthermore,
food production is particularly resource intensive. In
order to create a sustainable production as stated in
goal 12, we must look beyond the specific process
and understand whether they are effectively being
consumed. In all, food waste is important to
prevent, because these wasted resources could
have been used purposefully, i.e. for feeding further
wanting persons.
By incorporating studies concerning food waste
through the steps described in this document,
member states can make strides in understanding
how they compare to their peers in terms of food
waste and potentially find significant gains in their
own capacity to feed their populations and reduce
waste throughout the food value chain.
Another vital indicator is the management of
hazardous materials (12.4.2). While the Basel
Convention exists to create rules related to the
transportation of hazardous waste, it is vital for
states to be informed on the state and developments
within their own borders. It is particularly important
to have robust statistics for hazardous waste
compared to other forms of waste because of its
potential impact on human and environmental
health. Available adequate and reliable records for
hazardous waste allow states to identify potential
challenges earlier, and in turn, to coordinate a more
timely and thorough response.
The entire surrounding world and our way of life
are founded on daily used chemicals . While these
chemicals enable substantial achievements, many
are harmful to people and planet; and the impacts
from exposure dependon one’s age, sex, and gender
role. It is of vital importance for human health in the
long-term that there is a system in place to record
and understand how these chemicals move through
our economies, so we can properly regulate and
control them to our greatest advantage before more
drastic actions are needed, which in turn would
affect the quality of life.
Another indicator that is addressed in this document
is recycling (12.5.1). Recycling is a central pillar in
the transition which countries, as well as companies
in the private sector, must go through in order to
create long term and sustainable economies. In
many ways, recycling is seen as a final effort to
effectively utilize finite resources after reducing
their consumption and finding more efficient
processes in production. Recycling is a vital solution
towards reducing environmental impacts, since
mining is responsible for a dramatic impact on
the environment, be it through destructing natural
landscapes or discharging hazardous chemicals
used in the process. By investing in recycling
and transforming already extracted resources,
economies can make significant progress towards
decoupling economic growth from the resources
they need.
Generally, waste is by definition “any materials that
are not prime products (i.e., products produced for the
market) for which the generator has no further use

9Global Chemicals and Waste Indicator Review Document
Table of contents
for his own purpose of production, transformation
or consumption, and which he discards, or intends
or is required to discard. It excludes material directly
recycled or reused at the place of generation (i.e.
establishment), and waste materials that are directly
discharged into ambient water or air as wastewater
or air pollution” (UNSD/UNEP Questionnaire 2020
on Environment Statistics). This has traditionally
meant that waste was left in a landfill without further
consideration. As humanity reaches permanently
closer to the limits of the planet’s capacity for the
former’s own consumption, we must re-think and
understand that what was once considered trash,
presents now valuable resources which could be
used more effectivelyand efficiently. Additionally,
as the planet’s limited resources are being further
consumed, fewer places remain for storing waste
for an indefinite period. In order to ensure that the
planet is habitable for the next generations, we must
look at the waste we produce, maintain knowledge
of how much exists and and use it, as far as possible,
as a source of valuable raw materials instead of
consuming further primary resources.

10Global Chemicals and Waste Indicator Review Document
Introduction
1 Table of contents

11Global Chemicals and Waste Indicator Review Document
Table of contents
1Introduction
The “Global chemicals and waste indicator review
document” aims to strengthen the knowledge base
of chemicals and hazardous waste and enhance
the capacity of selected countries to track progress
towards related SDGs indicators across sectors in
order to strengthen the evidence base for policy
making and stakeholder action.
By strengthening the evidence base as well as the
science policy interface, the project responds to the
need for better information to empower decision
makers and stakeholders to act and support policy
making aimed at sound management of waste to
minimize risks to public health and the environment
associated with chemicals and hazardous waste.
This document aims to provide a coherent
methodology for measuring the SDG indicators
related to municipal and food waste, hazardous
waste and recycling rate.
SDG 11.6.1 Municipal solid waste collected and managed in controlled facilities, out of total
municipal solid waste generated, by the city
SDG 12.3.1 (a) Food loss index1 and (b) food waste index
SDG 12.4.2 Hazardous waste generated per capita and proportion of hazardous waste treated,
by type of treatment
SDG 12.5.1 National recycling rate, tons of material recycled
1 Note that this document only covers Food Waste as Food Loss has an existing methodology and is under the custodianship
of FAO.

12Global Chemicals and Waste Indicator Review Document
Table of contents
Closely related indicators and targets include:
GOAL 12: SUSTAINABLE CONSUMPTION AND PRODUCTION
Target 12.4 By 2020, achieve the environmentally sound management of chemicals and all wastes throughout their life cycle, in accordance with agreed international frameworks, and significantly reduce their release to air, water and soil in order to minimize their adverse impacts on human health and the environment
Indicator 12.4.1 Number of parties to international multilateral environmental agreements on hazardous waste, and other chemicals that meet their commitments and obligations in transmitting information as required by each relevant agreement
GOAL 14: CONSERVE AND SUSTAINABILY USE THE OCEANS, SEAS
AND MARINE RESOURCES FOR SUSTAINABLE DEVELOPMENT
Target 14.1 By 2025, prevent and significantly reduce marine pollution of all kinds, in particular from land-based activities, including marine debris and nutrient pollution
Indicator 14.1.1 Index of coastal eutrophication and floating plastic debris density
The objective of this document is to provide
guidance and training on how to measure and use
national chemicals and waste indicators, including
data disaggregation (including by sex and age),
statistical standards and methodologies, in order to
improve the level and quality of reporting.
It includes a literature review and current reporting
status on related data (Annex I), as well as a first
methodology on how to measure these indicators.
In addition, UN-Habitat developed a complementary
document Waste Wise Cities Tool - Step by Step
Guide to Assess a City’s MSWM Performance through
SDG indicator 11.6.1 Monitoring (WaCT) which
provides detailed methodology for on the ground
data collection.
Annex III also provides a data assessment tool
which can be used by countries interested in
conducting a self-assessment of the priorities and
gaps in developing a system for national monitoring
of waste. For all the indicators in this document, a
progressive monitoring approach is proposed. The
progressive monitoring approach will use three
levels of indicators:
• Level I: accessible to all countries, based on
global modelling of existing data which can be
used in order to estimate data for all countries.
• Level II: core indicators which are recommended
for all countries to compile nationally, this will be
globally collected for SDG reporting.
• Level III: includes proposed supplementary
indicators and disaggregation which are useful
for informing national policy and decision-
making; however, will not be part of the core data
reporting at the global level.
13Global Chemicals and Waste Indicator Review Document
Table of contents
Note that in the context of the SDGs, level I global
monitoring approach is introduced to fill in the
data gap for some of the SDG indicators2. All data
for level I estimated indicators will be shared with
countries to (i) request national data that will
replace the estimation; and (ii) if national data is not
2 In this document, SDG indicators that use level I global estimated indicators are 11.6.1, 12.3.1b and 12.5.1 for e-waste
recycling rate.
available, request countries to verify and approve
the dissemination of the estimated data until
nationally produced data becomes available. In the
event where countries do not wish to disseminate
the data for level I estimated indicators, indicators
will not be published.

14Global Chemicals and Waste Indicator Review Document
Table of contents
Links with existing initiatives
2

15Global Chemicals and Waste Indicator Review Document
Table of contents
2Links with existing initiatives
A significant number of international Conventions,
complemented by existing metadata and statistical
standards and other initiatives from international
organizations, are presented in this section to
provide input on the impact of chemicals and waste
on the environment and human health.
BOX 1: Existing international Conventions and statistical standards
Indicator for the impact of chemicals and waste on the Environment
Multilateral Environmental Agreements
• Basel Convention on the Control of Transboundary Movements of Hazardous Waste and their Disposal
• Stockholm Convention on Persistent Organic Pollutants (POPs)
• Rotterdam Convention on the Prior Informed Consent Procedure for Certain Hazardous Chemicals and Pesticides in International Trade
• Montreal Protocol on Substances that Deplete the Ozone Layer
• Minamata Convention on Mercury Strategic Approach to International Chemicals Management (SAICM)
Existing metadata and statistical standards
• EUROSTAT• UNSD• UNECE• OECD• Material Flow Accounts (MFA)
Other Initiatives
• World Bank – What a Waste (WaW) publication
• Waste Atlas

16Global Chemicals and Waste Indicator Review Document
Table of contents
Information on the main provisions of the above-
mentioned initiatives and current status of reporting
on international level indicators on chemicals and
waste, which are relevant for developing the SDG
indicators, can be found in Annex I.
Almost all United Nations Member States are party
to at least one of these Conventions. Under the
current MEAs’ obligations, countries are requested
to regularly report data and information related to
hazardous waste, persistent organic pollutants
(POPs) and ozone depleting substances (ODS). The
frequency of reporting differs between Conventions
and national reports are usually submitted through
an electronic reporting system. Reporting to the
Conventions and relevant international initiatives are
a major source of data and information relevant to the
follow-up and review of the environmental section of
the 2030 Agenda on Sustainable Development.
Unfortunately, many countries still fail to fully meet
their reporting commitments under the key global
MEAs on chemical and hazardous waste. Between
2010 and 2014, only 51% of Parties to the Stockholm
Conventions, 57% of Parties to the Basel Convention
and 71% of Parties to the Rotterdam Convention
provided the requested data and information.
While all Parties reported to the Montreal Protocol,
the majority had difficulties in providing complete
national reports and/or provided data that was
clearly erroneous or inconsistent.
The reduced number of reports submitted by
countries and inconsistent data provided can be
partly explained by the difficulties in accessing
and using the electronic reporting tool; reporting
format; national circumstances; lack of data
availability (including sex-disaggregated data) or
scattered among different institutions; shortage of
skilled personnel; financial constraints and lack of
perceived benefits of reporting or consequences
of lack of reporting. Currently, a framework for
ensuring collaboration between relevant institutions
(Ministries of Environment, National Statistical
Offices, Ministries of Finance and Planning,
Ministries of Industry, Agriculture or Health, and
others) is not present in many countries.

17Global Chemicals and Waste Indicator Review Document
Table of contents
Definitions
3
18Global Chemicals and Waste Indicator Review Document
Table of contents
3Definitions
3 Technical Guidelines on the sound management of hazardous waste, Basel Convention website:
http://www.basel.int/Implementation/Publications/LatestTechnicalGuidelines/tabid/5875/Default.aspx#, last accessed
February 18th 2018.
Definitions presented in this manual are included
below in alphabetical order.
Apex traders “receive materials from intermediate
traders or directly from both formal and informal
recyclable collection systems (including waste
pickers), store and prepare these materials for
onward trading to end-of-chain recyclers/recoverers”
(UN-Habitat, 2021).
Composting is a “biological process that submits
biodegradable waste to anaerobic or aerobic
decomposition, and that results in a product that
is recovered and can be used to increase soil
fertility” (UNSD/UNEP Questionnaire 2020 on
Environment Statistics).
Disposal means “any operation whose main
purpose is not the recovery of materials or
energy even if the operation has as a secondary
consequence the reclamation of substances or
energy” (UN-Habitat, 2021).
Disposal facilities refer to “sites which are regularly
used by the public authorities and private collectors,
regardless of their level of control and legality,
for the disposal of waste. Such sites may or may
not have an official recognition, a permit or a
license. Disposal sites may be managed in either
a controlled or uncontrolled manner. The definition
excludes unrecognized places where waste is
deposited occasionally in small amounts which
public authorities may clean up from time to time”
(UN-Habitat, 2021).
Domestic Material Consumption (DMC) is a
“standard material flow accounting (MFA) indicator
and reports the apparent consumption of materials
in a national economy” (UN Metadata 2020).
Environmentally sound management (ESM) of
hazardous waste is described within the Basel
Convention as “taking all practicable steps to ensure
that hazardous waste or other waste are managed
in a manner which will protect human health and
the environment against the adverse effects which
may result from such waste”. The Conference
of the Parties (COP) to the Basel Convention
develops and adopts technical guidelines3 for the
environmentally sound management of various
types of waste as grouped into ‘disposal’ and
‘recovery’ operations. Although not legally-binding,
those technical guidelines provide the foundation
upon which countries can operate at a standard
19Global Chemicals and Waste Indicator Review Document
Table of contents
that is not less environmentally sound than that
required by the Basel Convention. The concept of
ESM encompasses all the management steps from
inventorying, sampling, analysing and monitoring
to handling, collecting, packaging, labelling,
transporting, storing and environmentally sound
disposal. The technical guidelines adopted by the
COP provide guidance on all mentioned steps. As
per the Basel Convention, countries may define their
own standards for sound treatment of hazardous
waste, based on their national context.
End-of-chain recycler/recoverer “receives materials
from apex traders or direct from both formal and
informal MSW collection systems and processes
them into materials and products that have value in
the economy either through recycling, incineration
with energy recovery, or other recovery process”
(UN-Habitat, 2021).
Extended Producer Responsibility (EPR) is
an environmental policy approach in which a
producer’s responsibility for a product is extended
to the post-consumer stage of a product’s life cycle
(OECD, 2001).
Food: according to the UN SDG Global Metadata
repository, food is defined as “any substance—
whether processed, semi-processed, or raw—that is
intended for human consumption. “Food” includes
drink, and any substance that has been used in the
manufacturing, preparation, or treatment of food.
“Food” also includes material that has spoiled and
is therefore no longer fit for human consumption. It
does not include cosmetics, tobacco, or substances
used only as drugs. It does not include processing
4 UNEP, Basel Convention on the control of transboundary movements of hazardous wastes and their disposal, texts and Annexes,
available online at http://www.basel.int/TheConvention/Overview/TextoftheConvention/tabid/1275/Default.aspx, accessed
January 2018
agents used along the food supply chain, for example,
water to clean or cook raw materials in factories or
at home” (UN Metadata, 2019a).
Formal waste management “relates to waste
management activities undertaken by units working
within the context of the formal governmental or
non-state actors regulating and operating waste
management; that is, organisations or individuals
registered as economic units with government
authorities and assumed to generally abide by local
laws and regulations related to wastes and their
management” (UN-Habitat, 2021).
Hazardous waste is waste with properties capable
of having a harmful effect on human health or the
environment and is regulated and controlled by law.
Hazardous waste is generated from many sources,
ranging from industrial manufacturing processes
waste to domestic items such as batteries. It may
come in many forms, including liquids, solids, gases
and sludge. It can be discarded as commercial
products, like cleaning fluids or pesticides or the by-
products of manufacturing processes.
In developing Indicator 12.4.2, the definition of
Hazardous waste will be based on the one defined
in the Basel Convention4 (Article 1, paragraph
1(a)). Waste listed in Annex VIII of the Basel
Convention are presumed to be hazardous, while
waste listed in Annex IX are presumed not to be
hazardous. For the purpose of this indicator, due to
comparability reasons, we exclude additional waste
considered hazardous as per national definitions, as
provided by the Basel Convention under Article 1,
paragraph 1 (b) (UN Metadata, 2019b).

20Global Chemicals and Waste Indicator Review Document
Table of contents
Hazardous waste generated “refers to the quantity
of hazardous waste generated within the country
during the reported year, prior to any activity such
as collection, preparation for reuse, treatment,
recovery, including recycling, or export, no matter
the destination of this waste” (UN Metadata,
2019b). In case hazardous waste identified as such
in national context is not part of the definition of
hazardous waste used in this manual, the amounts
is also included with noting the type of hazardous
waste and specific amounts. Hazardous waste
generated should be aggregated by households; and
per the following breakdowns of the International
Standard Industrial Classification of all Economic
Activities (ISIC rev. 4)5: agriculture, forestry and
fishing (ISIC 01-03); mining and quarrying (ISIC
05-09); manufacturing (ISIC 10-33); electricity,
gas, steam and air conditioning supply (ISIC 35);
construction (ISIC 41-43), and other economic
activities excluding ISIC 38.
Since not all hazardous waste generated is
immediately treated or disposed of under other
economic activities excluding ISIC 386, the stock of
hazardous waste should also be reported, as per the
categories and indications in Table R2 of the UNSD/
UNEP Questionnaire on Environment Statistics7
(waste section) (UN Metadata, 2019b).
Incineration is defined as the controlled combustion
of waste, with or without energy recovery. During
incineration, the chemically fixed energy of
combusted matter is transformed into thermal
energy. Incineration results in combustion gases
5 United Nations, International Standard Industrial Classification of all Economic Activities (ISIC rev. 4), available online at
https://unstats.un.org/unsd/publication/seriesm/seriesm_4rev4e.pdf, accessed 17 March 2021
6 ISIC 38 is waste management activities, and therefore including ISIC 38 would represent double counting, as waste is first counted
when entering management or treatment facilities.
7 https://unstats.un.org/unsd/envstats/questionnaire
leaving the system as flue gases, while incombustible
material remains in the form of slag and fly ash.
Provided it is carried out under the conditions of
the legally approved standards and respectively
controlled, incineration is often employed as a form
of treatment for hazardous waste, for example the
incineration of medical waste in cement kilns, which
can be considered environmentally sound, according
to the Basel Convention’s Technical Guidelines
on the Environmentally Sound Co-processing of
Hazardous Wastes in Cement Kilns.
For the purpose of Indicator 12.4.2, operations
defined in Annex IV of Basel Convention as R1 (use
as fuel (other than direct incineration) or other means
to generate energy) will be considered incineration
with energy recovery, while Incineration without
energy recovery will be considered as operations
under D10 and D11 in the Basel Convention Annex IV.
Inedible (or non-edible) parts: “Components
associated with a food that, in a particular food
supply chain, are not intended to be consumed by
humans. Examples of inedible parts associated
with food could include bones, rinds, and pits/
stones. “Inedible parts” do not include packaging.
What is considered inedible varies among users
(e.g., chicken feet are consumed in some food
supply chains but not others), changes over time,
and is influenced by a range of variables including
culture, socio-economic factors, availability, price,
technological advances, international trade, and
geography” (UN Metadata, 2019a).

21Global Chemicals and Waste Indicator Review Document
Table of contents
Intermediate traders “receive materials from both
formal and informal recyclable collection systems
(including waste pickers), store and prepare these
materials for onward trading to apex traders”
(UN-Habitat, 2021).
Landfill is the “deposit of waste into or onto land.
It includes specially engineered landfill sites and
temporary storage of over one year on permanent
sites. The definition covers both landfills at internal
sites, i.e. where a generator of waste is carrying out
its own waste disposal at the place of generation,
and at external sites” (UN-Habitat, 2021).
For the purpose of this indicator, additional details
related to the type of landfills should be provided.
Separate categories should include:
Amounts going to Landfills:
• Out of which amounts going to controlled
landfills/cells for hazardous waste
8 Basel Convention’s technical guidelines on specially engineered landfilling (D5) provide general guidance on this waste disposal
method and safe landfill management practices.
• Out of which amounts going to controlled landfills
for Industrial waste
• Out of which amounts going to controlled
landfills, for Municipal Solid Waste
• Out of which amounts going to
uncontrolled landfills.
A waste disposal site that is authorized and
operates under applicable national or international
legal requirements is considered to be a “controlled”
landfill.8 For MSW, a specific assessment ladder for
the level of control (Table 1) has been developed
under SDG 11.6.1.
For ease of use, the above mentioned linkages
between operations included in the UNSD/UNEP
Questionnaire 2020 on Environment Statistics
and Basel Convention Annex IV are included in
the table below.
TABLE 1: Matching the UNSD/UNEP Questionnaire 2020 on Environment Statistics and Basel Convention
OPERATIONS IN THE UNSD/UNEP QUESTIONNAIRE
2020 ON ENVIRONMENT STATISTICS OPERATIONS UNDER BASEL CONVENTION ANNEX IV
Recycling R2 – R12
Incineration with energy recovery R1
Incineration without energy recovery D10, D11
Amounts going to controlled landfills/cells for hazardous waste
D5

22Global Chemicals and Waste Indicator Review Document
Table of contents
Mass balance: A calculation involving subtracting
the output from the input to find the material lost
in the process. In practice, the amount of material
in the calculation may be expressed in units other
than mass.
Material exported intended for recycling: Expressed
in tonnes, reported based on customs data, during the
course of the year; the materials exported destined for
recycling are considered to be recycled and checking
final destination of these materials is not part of the
reporting exercise (UN Metadata, 2019c).
Material Flow Accounting (MFA) is “a monitoring
system for national economies based on methodically
organised accounts and denoting the total amounts of
materials used in the economy” (Eurostat, 2001,p.73).
MFA enables the monitoring of total consumption of
natural resources and the associated indirect flows
as well as calculation of indicators.
Material Footprint (MF) “is the attribution of global
material extraction to domestic final demand of a
country. The total MF is the sum of material footprint
for biomass, fossil fuels, metal ores and non-metal
ores” (UN Metadata, 2020).
Material imported intended for recycling: Expressed
in tonnes, reported based on customs data, during
the course of the year (UN Metadata, 2019c).
Material recycled: Expressed in tonnes, reported at
the last entity in the recycling chain, preferably when
tonnes of material is bought as secondary resource
to be used in production facilities during the course
of the reporting year; Secondary mineral materials
used in the construction sector are excluded;
composting is considered recycling for the purposes
of this indicator (UN Metadata, 2019c).
Materials Recovery Facility “(MRF; or materials
reclamation facility, materials recycling facility,
multi re-use facility) is a specialized recovery facility
that receives, separates and prepares recyclable
materials for marketing to further processors or
end-user manufacturers” (UN-Habitat, 2021).
Mechanical Biological Treatment (MBT) system is “a
type of recovery facility that combines an MRF with
a form of biological treatment such as composting
or anaerobic digestion” (UN-Habitat, 2021).
Municipal Solid Waste (MSW) “includes waste
originating from households, commerce and trade,
small businesses, office buildings and institutions
(schools, hospitals, government buildings). It also
includes bulky waste (e.g., old furniture, mattresses)
and waste from selected municipal services, e.g.
waste from parks and gardens maintenance, waste
from street cleaning services (street sweepings,
litter containers content, market cleansing waste), if
managed as waste” (UN Metadata, 2019c).
MSW managed in controlled facilities “refers to
MSW collected and transported to recovery and
disposal facilities that are operated under basic,
improved or full control according to the Ladder of
waste management facilities’ control level (Table 2).
The Ladder can be used as a checklist for assessing
the level of control of a particular recovery or
disposal facility. The facility should be classified by
going through the decision-making tree, available
in the Waste Wise Cities Tool (UN-Habitat, 2021).
Note that the emphasis is on operational control
rather than engineering/design. A facility that is
constructed to a high standard, but not operated in
compliance with Level III (or above) standard is not
regarded as a controlled facility” (UN-Habitat, 2021).

23Global Chemicals and Waste Indicator Review Document
Table of contents
TABLE 2: Ladder of control level for landfill sites9
9 UN Habitat, 2021
CONTROL LEVEL LANDFILL SITE
Full Control
• Waste daily covered• Waste compacted• Site fenced and full 24-hour control of access• Properly sited, designed and functional sanitary landfill• Leachate containment and treatment (naturally consolidated clay on the site or
constructed liner)• Landfill gas collection and flaring and/or utilization• Site staffed• Post closure plan• Weighing and recording conducted• Protection of workers’ health and safety
Improved Control
• Waste periodically covered• Waste compacted• Site fenced and control of access• Leachate containment and treatment• Landfill gas collection (depending on landfill technology)• Site staffed• Weighing and recording conducted • Protection of workers’ health and safety
Basic Control
• Some use of cover• Waste compacted• Sufficient equipment for compaction• Site fenced and control of access • No fire/smoke existence• Site staffed • Weighing and recording conducted • The slope of the landfill is stable, landslides not possible • Protection of workers’ health and safety
Limited Control
• No cover • Some compaction • Some equipment for compaction • Some level of access control/fencing • No leachate control • Some fire/smoke existence • Site staffed • Weighing and recording conducted • The slope of the landfill is unstable with high possibility of a landslide
No Control
• No cover • No compaction • No/ limited equipment • No fencing • No leachate control • Fire/smoke existence • No staff• The slope of the landfill is unstable with high possibility of a landslide

24Global Chemicals and Waste Indicator Review Document
Table of contents
TABLE 3: Ladder of control level for incineration10
10 UN Habitat, 2021
CONTROL LEVEL INCINERATION (WITH OR WITHOUT ENERGY RECOVERY)
Full Control
• Built to and operating in compliance with current national laws and standards including stringent stack and GHG emission criteria
• Emission controls are conducted compliant to environmental standards and results of tests are accessible and transparent to citizens/users
• Fly ash managed as a hazardous waste using the best appropriate technology • Weighing and recording conducted • A strong and robust environmental regulator inspects and monitors emissions • Protection of workers’ health and safety
Improved Control N/A
Basic Control
• Emission controls to capture particulates • Trained staff follow set operating procedures • Equipment maintained • Ash management carried out • Weighing and recording conducted
Limited Control N/A
No Control • Uncontrolled burning • No air/water pollution control
25Global Chemicals and Waste Indicator Review Document
Table of contents
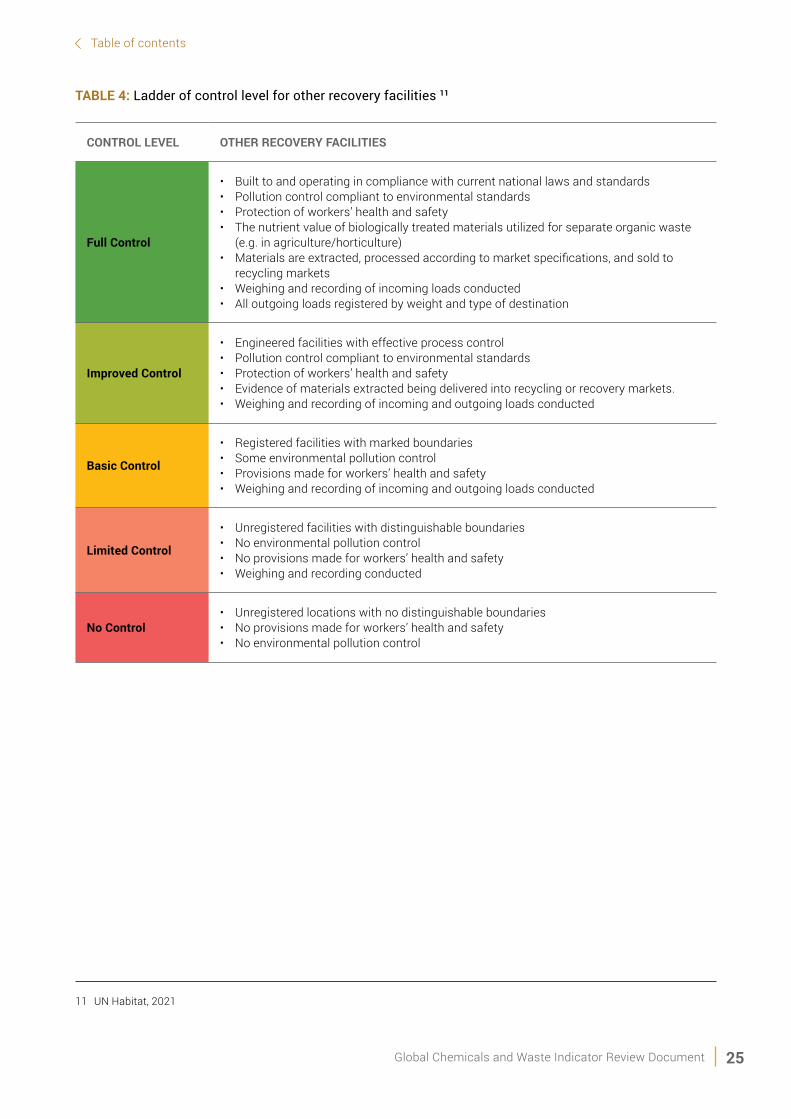
TABLE 4: Ladder of control level for other recovery facilities 11
11 UN Habitat, 2021
CONTROL LEVEL OTHER RECOVERY FACILITIES
Full Control
• Built to and operating in compliance with current national laws and standards • Pollution control compliant to environmental standards • Protection of workers’ health and safety • The nutrient value of biologically treated materials utilized for separate organic waste
(e.g. in agriculture/horticulture) • Materials are extracted, processed according to market specifications, and sold to
recycling markets • Weighing and recording of incoming loads conducted • All outgoing loads registered by weight and type of destination
Improved Control
• Engineered facilities with effective process control • Pollution control compliant to environmental standards • Protection of workers’ health and safety • Evidence of materials extracted being delivered into recycling or recovery markets. • Weighing and recording of incoming and outgoing loads conducted
Basic Control
• Registered facilities with marked boundaries • Some environmental pollution control • Provisions made for workers’ health and safety • Weighing and recording of incoming and outgoing loads conducted
Limited Control
• Unregistered facilities with distinguishable boundaries • No environmental pollution control • No provisions made for workers’ health and safety • Weighing and recording conducted
No Control• Unregistered locations with no distinguishable boundaries • No provisions made for workers’ health and safety • No environmental pollution control

26Global Chemicals and Waste Indicator Review Document
Table of contents
National Recycling Rate is defined as the quantity
of material recycled in the country plus quantities
exported for recycling minus material imported
intended for recycling out of total waste generated
in the country.
Non-metallic minerals (industrial and construction
minerals) “comprise two subgroups, industrial
minerals and construction minerals. They are
clearly differentiated from minerals for production
of metals (metal ores) and from minerals for
the generation of energy (fossil fuels). However,
the distinction between industrial minerals and
construction minerals is not always clear, especially
because one type of mineral may be used in an
industrial process (e.g. limestone for the production
of fertiliser by the chemical industry) or for
construction purposes (e.g. limestone used as an
aggregate directly for construction or used for the
production of cement). A pragmatic approach is
to consider industrial minerals as those, which are
not bulk materials for construction purposes. It is
worth noting that minerals grouped under industrial
minerals are not double counted under construction
minerals (e.g. basaltic lava under natural stones,
clay for pottery under clay for bricks, and limestone
for fertiliser under limestone for construction).
Construction minerals are bulk materials, used
directly or indirectly for structural and civil
engineering. For pragmatic reasons, only the bulk
material flows for construction are counted in this
group. These are mainly natural stones (including
limestone for cement making), sand and gravel, and
clay for bricks. Information on the use of sand and
gravel, crushed stone, dimension stone or clay for
construction purposes versus other uses is often
not available” (Eurostat, 2001, p.48).
The proportion of population with access to basic
MSW collection services is “the proportion of
population who receive waste collection services
that are either basic, improved or full, defined by the
service ladder of MSW collection service. It considers
aspects of frequency, regularity and proximity of the
collection points (Table 5). This aspect is measured
under the SDG indicator 11.6.1 assessment but it is
reported through a different indicator, SDG 1.4.1. on
access to basic services” (UN-Habitat, 2021).

27Global Chemicals and Waste Indicator Review Document
Table of contents
TABLE 5: Ladder of MSW collection service that household receives12
12 UN Habitat, 2021
SERVICE LEVEL DEFINITION
Full
• Receiving door-to-door MSW collection service with basic frequency and consistency and MSW is collected in three or more separate fractions; or
• Having a designated collection point within 200m distance served with basic frequency and consistency and without major littering and MSW is collected in three or more separate fractions
Improved
• Receiving door-to-door MSW collection service with basic frequency and consistency and MSW is collected in a minimum of two, separate fractions (e.g. wet and dry fractions)
• Having a designated collection point within 200m distance served with basic frequency and consistency without major littering and MSW is collected in a minimum of two, separate fractions (e.g. wet and dry fractions)
Basic• Receiving door-to-door MSW collection service with basic frequency and consistency or • Having designated collection point within 200m distance served with basic frequency
and consistency
Limited
• Receiving door-to-door MSW collection service without basic frequency and consistency;
• Having a designated collection point within 200m distance but not served with basic frequency and consistency; or
• Having designated collection point in further than 200m distance.
No • Receiving no waste collection service
Note | “Basic frequency and consistency”: refers to services received at least once per week for at least one year
Recovery “means any operation the principal result
of which is waste serving a useful purpose by
replacing other materials which would otherwise
have been used to fulfil a particular function, or
waste being prepared to fulfil that function, in the
facilityor in the wider economy” (UN-Habitat, 2021).
Recovery facilities include “any facilities with
recovery activities defined above including recycling,
composting, incineration with energy recovery,
materials recovery facility (MRF), mechanical
biological treatment (MBT), etc.” (UN-Habitat, 2021).
Recycling is defined under the UNSD/UNEP
Questionnaire 2020 on Environment Statistics and
further for the purpose of these indicators as “Any
reprocessing of waste material […] that diverts it from the
waste stream, except reuse as fuel. Both reprocessing
as the same type of product, and for different purposes
should be included. Recycling within industrial plants
i.e., at the place of generation should be excluded.”
(UNSD, n.d.). For the purpose of consistency with the
Basel Convention reporting and correspondence with
EUROSTAT reporting system, Recovery operations
R2 to R12 listed in Basel Convention Annex IV, are to
28Global Chemicals and Waste Indicator Review Document
Table of contents
be considered as ‘Recycling’ under the UNSD/UNEP
Questionnaire reporting for hazardous waste.
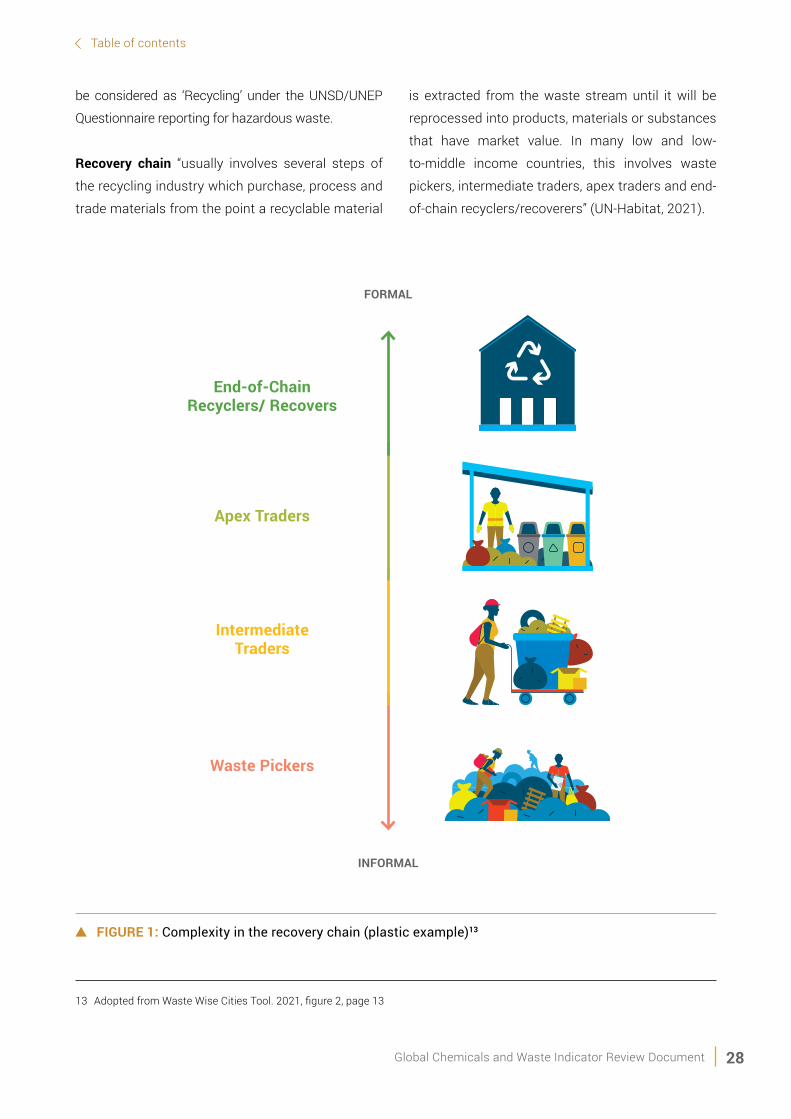
Recovery chain “usually involves several steps of
the recycling industry which purchase, process and
trade materials from the point a recyclable material
is extracted from the waste stream until it will be
reprocessed into products, materials or substances
that have market value. In many low and low-
to-middle income countries, this involves waste
pickers, intermediate traders, apex traders and end-
of-chain recyclers/recoverers” (UN-Habitat, 2021).
FIGURE 1: Complexity in the recovery chain (plastic example)13
13 Adopted from Waste Wise Cities Tool. 2021, figure 2, page 13
Waste Pickers
Intermediate Traders
Apex Traders
End-of-Chain Recyclers/ Recovers
FORMAL
INFORMAL

29Global Chemicals and Waste Indicator Review Document
Table of contents
Total waste generated is “the total amount of waste
(both hazardous and non-hazardous) generated in
the country during the year” (UN Metadata, 2019c)
Total waste generated (excluding construction,
demolition and agriculture) is “the total amount
of waste (both hazardous and non-hazardous)
generated in the country during the year. For the
purpose of this indicator, total waste generated
will include municipal solid waste, non-hazardous
industrial waste, hazardous waste and exclude
non-metallic minerals (industrial and construction
minerals), construction and demolition waste and
agricultural waste. Expressed in tonnes, reported
as the sum of waste generated during the course
of the reporting year in sectors following the UNSD/
UNEP Questionnaire table R1: Generation of Waste
by Source with certain modifications, excluding
Construction waste (ISIC 41- 43), Agricultural
waste (ISIC 01-03) and quarrying and mining waste
(ISIC 05-09)” (UN Metadata, 2019c).
Total MSW generated “by the City is the total MSW
generated by the population and their economic
activities within the defined system boundary”
(UN-Habitat, 2021).
14 Other types of treatment could be: physical-chemical treatment, biological treatment, thermal treatment other than
incineration such as autoclave, and stabilization and solidification, interim storage, etc. (UNSD/UNEP Questionnaire 2020 on
Environment Statistics)
Total MSW collected “refers to the amount of
MSW generated that is moved from the point of
generation, such as specific addresses or designated
collection points, to facilities where the waste is
recovered or disposed, regardless of collection
modality (e.g., by municipal governments, non-state
actors or informal sectors). The remaining share
of MSW generated is considered “uncollected””
(UN-Habitat, 2021).
Treatment of hazardous waste: “Waste treated”
and “type of treatment” are not defined in the Basel
Convention. In this context, “treatment” will include
all operations included under Annex IV of the Basel
Convention, namely “Disposal” operations D1 to D15
and “Recovery” operations R1 to R13. This is also
linked to the definitions of “Recycling, Incineration,
Incineration with energy recovery, Landfilling and
other types of treatment or disposal”14
Waste pickers “extract recyclable materials from
the waste stream to support their livelihood,
selling materials into the recovery system”
(UN-Habitat, 2021).

30Global Chemicals and Waste Indicator Review Document
Table of contents
Methodology for Indicator 11.6.1
4

31Global Chemicals and Waste Indicator Review Document
Table of contents
4Methodology for Indicator 11.6.115
15 The methodology follows the published metadata for SDG indicator 11.6.1, obtained from:
https://unstats.un.org/sdgs/metadata/files/Metadata-11-06-01.pdf
Target 11.6: By 2030, reduce the adverse per capita environmental impact of
cities, including by paying special attention to air quality, municipal and other
waste management.
Indicator 11.6.1: Proportion of MSW collected and manged in controlled facilities out
of total MSW generated, by the city
Assessing and monitoring SDG indicator 11.6.1
“Proportion of municipal solid waste collected and
managed in controlled facilities out of total municipal
solid waste generated, by the city”, provides critical
information for cities and countries to establish
better waste and resource management strategies
and transition towards a circular economy.
The methodology to monitor SDG indicator 11.6.1
provides a ladder system for MSW collection
services and control level of waste management
facilities, and aims to bring standardized
definitions, nomenclature and techniques to MSW
data collection.
Figure 2 summarizes the elements measured by
SDG indicator 11.6.1. The MSW generated by the city
is either collected or uncollected, and the collected
MSW is delivered to recovery or disposal facilities.
Recovery facilities generate residue that are sent
to disposal facilities. In many cities, recyclables are
also recovered from disposal facilities and brought
back into the recycling value chain.
Recovery or disposal facilities can be categorized as
either ‘controlled’ or ‘uncontrolled’ depending on the
operational measures put in place to minimize the
environmental, health and safety impacts from the
facilities. When both recovery and disposal occur
within the same facility, it is necessary to evaluate the
control level of the recovery and disposal operations
independently of each other.

32Global Chemicals and Waste Indicator Review Document
Table of contents
Uncollected waste
FIGURE 2: Concept figure of SDG indicator 11.6.116
16 Adopted from Waste Wise Cities Tool. 2021, figure 3, page 18
MSW received by CONTROLLED disposal facilities
(Dcon)
MSW received by UNCONTROLLED disposal facilities
MSW received by CONTROLLED recovery facilities
(Rcon)
MSW received by UNCONTROLLED recovery facilities
Total MSW Generated by the city
Tota
l MSW
Col
lect
ed
Residue
Residue
Recyclables recovered from disposal facilities
MSW Received by Recovery Facilities
Recyclables recovered from disposal facilities
MSW Received by Disposal Facilities

33Global Chemicals and Waste Indicator Review Document
Table of contents
I. Proposed Approach
SDG indicator 11.6.1 is a multi-level indicator.
Depending on the status of data availability
and collection nationally, countries can develop
the 3 levels of this indicator as per the below table.
LEVEL I INDICATORS
Proportion of MSW collected and managed in controlled facilities out of total MSW generated, by the city
Modelled data based on global available data (e.g. What a Waste 2.0, UNSD/UNEP Questionnaire on Environment Statistics , Wasteaware benchmark indicators, etc.).
LEVEL II INDICATORS
Proportion of MSW collected and managed in controlled facilities out of total MSW generated, by the city
Reported data in line with the concepts and definitions provided by UN-Habitat’s Waste Wise Cities Tool – Step by Step Guide to Assess a City’s MSWM Performance through SDG indicator 11.6.1 Monitoring
LEVEL III INDICATORS
Proportion of MSW collected out of total MSW generated, by the city
City Plastic Leakage
Proportion of MSW collected out of total MSW generated by the city is disaggregated from the level II indicator
City Plastic Leakage can be obtained through the application of Waste Flow Diagram (GIZ, 2020), a rapid and observation-based assessment tool which visualizes the MSW flows and quantifies plastic leakage to the water system.
Level I indicator can be calculated as follows:
SDG 11.6.1 = Total MSW collected and managed in controlled facilities (t/day)
x 100 (%)
Total MSW generated (t/day)
For the Level I indicator, global modeling based on the
available data (e.g. World Bank’s What a Waste 2.0,
UNSD/UNEP Questionnaire 2020 on Environment
Statistics, Wasteaware Benchmark Indicators, etc.)
can be conducted and made available for countries
and cities who have neither reliable data nor resources
to conduct the survey on the ground as guided by the
Waste Wise Cities Tool (UN-Habitat, 2021).

34Global Chemicals and Waste Indicator Review Document
Table of contents
For Level II indicator, it is recommended to report the
data according to the SDG 11.6.1 definitions if reliable
data is available. When reliable data is unavailable,
cities and countries are recommended to conduct a
survey to measure this indicator, along with the steps
provided by the Waste Wise Cities Tool.
Two sub-indicators can be used for level III indicator:
SDG 11.6.1.a = Total MSW collected (t/day)
x 100 (%)
Total MSW generated (t/day)
SDG 11.6.1.b = Total MSW collected and managed in controlled facilities (t/day)
x 100 (%)
Total MSW generated (t/day)
Data collected for SDG indicator 11.6.1 can also
be used to estimate a city’s plastic leakage when
combined with additional field observations, guided
by the Waste Flow Diagram (WFD) (GIZ, 2020).
These advanced calculations are considered to be a
Level III indicator as per the following formula:
City's Plastic Leakage = Total plastic leakage to water systems (kg/year)
Total population
Data collected for the assessment of SDG
indicator 11.6.1 can contribute to estimate SDG
indicator 12.3.1b Food Waste Index, by providing
household food waste generation per capita through
the below formula.
per capita MSW generation rate (kg/cap/d) x proportion of food wastePer capita household food waste generation
=
Step 4 of Waste Wise Cities Tool, which collects data
on the quantity of materials entering the recovery
system through interviews with recovery facilities,
can provide data necessary for SDG indicator
12.5.1 National Recycling Rate. For the purpose of
consistency with the Basel Convention reporting

35Global Chemicals and Waste Indicator Review Document
Table of contents
and correspondence with EUROSTAT reporting
system, Recovery operations R2 to R12 listed in
Basel Convention Annex IV, are to be considered
as ‘Recycling’. The questionnaire for recovery
facilities in the Annex 6 can be integrated into
national recycling monitoring system by national
government, which can in turn to be used to report
on SDG 12.5.1, by providing city recovery rate.
City Recovery Rate = Total recovered materials (t/day)
x 100 (%)
Total MSW generated (t/day)
Quantity of material recycled from MSW stream = ∑ Amount of recycled products sold by each of the recovery facilities
II. Step-by-step guide
II.1 Waste Wise Cities Tool’s 7 Steps
The Waste Wise Cities Tool consists of seven steps
to guide cities on how to collect data on MSW
generated, collected, and managed in controlled
facilities. The tool provides a household survey guide
for estimating total MSW generation, a questionnaire
to investigate the MSW recovery chain and criteria
to check the environmental control level of waste
management facilities in the city. In the last step, the
link to other waste related SDGs and the Waste Flow
Diagram methodology to estimate potential plastic
leakage from a city’s MSWM system is highlighted.
The steps a city needs to implement can be determined
depending on the data available. UN-Habitat
recommends that cities go through all the steps, if
the city has large amounts of uncollected waste or
illegal dumping and has never done a Waste Amounts
and Composition Survey (WACS) from households
to estimate waste generation per capita, or if such
a survey is more than 5 years old. In this context, it
is important to understand that the waste received
at recovery and disposal facilities sometimes does
not represent the total MSW generated, especially in
cities with large amount of uncollected waste.
Cities that are confident about the accuracy of their
total MSW generation data, are recommended to go
through Steps 4 and 5 to identify the environmental
and operational control level of their waste
management facilities. Detailed methodological
steps and sub-steps are represented in the
Waste Wise Cities Tool.

36Global Chemicals and Waste Indicator Review Document
Table of contents
FIGURE 3: Waste Wise Cities Tool’s 7 Steps17
17 Adopted from Waste Wise Cities Tool. 2021, figure 4, page 23
II.2 Data points
The data points required to calculate SDG indicator
11.6.1 include:
A. Total MSW generated by the city
B. Total MSW collected
C. Total MSW managed in controlled facilities
These data also help cities to identify the proportion
of MSW that remains uncollected.
A. Total MSW generated by the cityAs previously defined in the Definitions section,
MSW data for this indicator covers city level data
pertaining to the same entities identified in the
above definition. MSW does not include waste from
municipal sewage networks and treatment facilities,
as well as construction and demolition waste from
commercial building contractors.
For cities that do not have reliable data yet on MSW
generation from households, data can be estimated
Getting Started
MSW Recovery
MSW Generation
MSW Disposal
Linkages with Other Important Indicators
Step 1: Preparation
Step 4: MSW Received by Recovery Facilities and Control Level of Recovery Facilities
Step 2: Household MSW Generation and Composition
Step 5: MSW Received by Disposal Facilities and Control Level of Disposal Facilities
Step 3: Non-Household MSW Generation
Step 6: Waste Composition at Disposal Facilities
Step 7: Calculating Food Waste, Recycling, and Plastic Leakage

37Global Chemicals and Waste Indicator Review Document
MSW Collected
MSW received by
disposal facilities
MSW received by
recovery facilities
Recyclables recovered
from disposal facilities
Residue from
recovery facilities
MSW Generated
Per Capita MSW
Generation from HH
Total Population
Non- household
MSW generation
Table of contents
through the multiplication of the total population
by per capita MSW generation from households.
Non-household MSW generation also needs to
be estimated. The detailed methodology for doing
estimation is provided in Steps 1, 2 and 3.
EQUATION 1: Total MSW Generated
B. Total MSW collectedTotal MSW collected is the amount of MSW
generated that is moved from the point of generation,
such as specific addresses or designated collection
points, to facilities where the waste is recovered
or disposed.
When measuring total MSW collected there is a risk
of double counting concerning the residue or rejects
from recovery facilities, and the amount of waste
recovered from disposal facilities going to recovery.
Therefore, these amounts need to be deducted
from the sum of waste received by both recovery
and disposal facilities. The residue from recovery
facilities is assumed to either go to disposal facilities
or other recovery facilities. Steps 4 and 5 provide
detailed methodology on the collection of this data.
EQUATION 2: Total MSW18 collected
18 Note that MSW collected for recovery includes mixed MSW, commingled recyclables or recoverable fractions extracted from MSW
C. Total MSW managed in controlled facilitiesMSW managed in controlled facilities refers to
MSW collected and transported to recovery and
disposal facilities with basic, improved or full control
according to the Ladder of waste management
facilities’ control level presented in the definition
section. The Ladder can be used as a checklist
for assessing the level of control of a particular
recovery or disposal facility. The facility’s control

38Global Chemicals and Waste Indicator Review Document
MSW Managed in Controlled Facilities
MSW received by controlled disposal facilities
MSW received by controlled recovery facilities
Recyclables recovered
from controlled disposal facilities
Residue from
controlled recovery facilities
Table of contents
level is the category where it checks the most boxes
(full, improved, basic, limited and none). Note that
the emphasis is on operational controls rather
than engineering/design control. A facility that is
engineered and constructed to a high standard, but
not operated in compliance with Level III (or above)
standard is not regarded as a controlled facility.
Steps 4 and 5 provide detailed methodology on the
collection of this data.
EQUATION 3: Total MSW managed in controlled facilities
II.3 Additional data points
The SDG 11.6.1 indicator assessment provides three
further MSWM data points:
D. Per capita MSW generation rate
E. MSW composition
F. Uncollected waste
Although they are not necessary for the calculation
of the SDG indicator values, these figures are
of particular importance for the identification
of service/infrastructure gaps, and formulation
of strategies.
D. Per capita MSW generation rateA very relevant parameter that can be derived
from the previous formula is the “total per capita
MSW generation rate”. Steps 2 and 3 explain how
to calculate this through waste sampling from
households for cities, if no reliable or updated data
is available.
This is especially recommended for cities where
a large amount of MSW remains uncollected.
Data on per capita waste generation also enables
optimization of collection system performance, an
exercise that can potentially generate significant
budgetary savings for the city.
E. MSW CompositionThe WaCT assessment characterizes waste
composition at the point of generation
(i.e. households) and at the point of disposal.
Understanding MSW composition at the beginning
and end of the MSW service chain is a useful exercise
for several reasons: understanding composition
helps identify how the existing recovery/recycling
sector is functioning, it enables further recovery
facilities to be identified and planned, and overall
helps to triangulate (i.e. test validity and reliability)
of the collected data.
Note that MSW also includes waste from non-
household sources. In Step 3, the quantities of
MSW generated from commercial and institutional
sources, as well as from public spaces, is estimated.
However, specific composition analysis on MSW
from non-household sources is beyond the scope of
this tool as it is complex and resource intensive.

39Global Chemicals and Waste Indicator Review Document
Total Uncollected
MSW
Total MSW Collected
Total MSW Generated
Table of contents
F. Total uncollected wasteTotal uncollected MSW can be calculated by
subtracting the total MSW regularly collected from
the total MSW generated.
EQUATION 4: Total uncollected MSW
III. Disaggregation
Data for this indicator can be disaggregated at
various levels in accordance with the country’s
policy information needs. For instance:
• MSW generation rate of different income level
(high, middle, low)
• Amount of different MSW material received by
recovery facilities
• MSW generation rate in different cities
IV. Data Sources, availability and production
MSW data is available through What a Waste 2.0 by
the World Bank and the UNSD/UNEP Questionnaire on
Environment Statistics. The UNSD/UNEP Questionnaire
on Environment Statistics has collected data on
municipal waste collection and treatment since 1999.
Data has been received from about 160 to 170 countries,
covering both national and city levels. However, the
response rate for the questionnaire is hovering around
50% and data completeness and quality remain a
challenge, especially for developing countries.
Both data sources have key MSW data such as
MSW generation, MSW generation rate, MSW
collection rate, etc., but lack the aspect of ‘controlled
management’, except for the case of controlled
landfilling. It is recommended that the UNSD/UNEP
Questionnaire on Environment Statistics establish
a data outlet for countries and cities can report on
parameters of SDG indicator 11.6.1.
In parallel with the effort to establish a global data
reporting according to the SDG indicator 11.6.1,
training and capacity development on data production
and data quality improvement for national and local
government is essential to accelerate the progress
towards the achievement of this SDG goal. UN-Habitat
offers capacity development and trainings both
offline and online for cities to apply the Waste Wise
Cities Tool, generate the SDG indicator 11.6.1 and
associated data, as well as use this data to identify
the policy, infrastructure and service provision gaps
to improve MSWM systems.
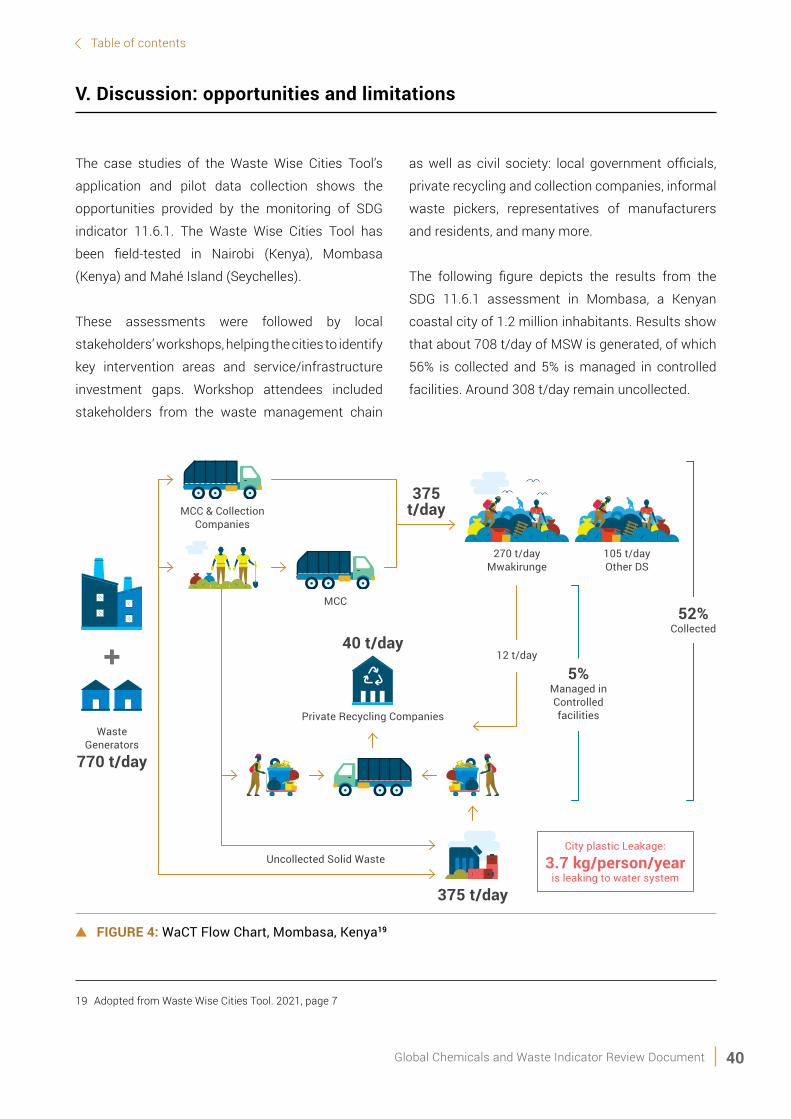
40Global Chemicals and Waste Indicator Review Document
Uncollected Solid Waste
MCC & Collection Companies
Waste Generators
770 t/day
Private Recycling Companies
MCC
270 t/day Mwakirunge
105 t/day Other DS
375 t/day
40 t/day12 t/day
City plastic Leakage:
3.7 kg/person/yearis leaking to water system
375 t/day
52%Collected
5%Managed in Controlled facilities
Table of contents
V. Discussion: opportunities and limitations
The case studies of the Waste Wise Cities Tool’s
application and pilot data collection shows the
opportunities provided by the monitoring of SDG
indicator 11.6.1. The Waste Wise Cities Tool has
been field-tested in Nairobi (Kenya), Mombasa
(Kenya) and Mahé Island (Seychelles).
These assessments were followed by local
stakeholders’ workshops, helping the cities to identify
key intervention areas and service/infrastructure
investment gaps. Workshop attendees included
stakeholders from the waste management chain
as well as civil society: local government officials,
private recycling and collection companies, informal
waste pickers, representatives of manufacturers
and residents, and many more.
The following figure depicts the results from the
SDG 11.6.1 assessment in Mombasa, a Kenyan
coastal city of 1.2 million inhabitants. Results show
that about 708 t/day of MSW is generated, of which
56% is collected and 5% is managed in controlled
facilities. Around 308 t/day remain uncollected.
FIGURE 4: WaCT Flow Chart, Mombasa, Kenya19
19 Adopted from Waste Wise Cities Tool. 2021, page 7

41Global Chemicals and Waste Indicator Review Document
8
Waste Wise Cities Tool
The assessment was followed by a local stakeholders workshop, which identified key intervention areas and service/infrastructure investment gaps. Workshop attendees included stakeholders from the waste management chain such as local government officials, environmental regulators, collection service operators, disposal facility managers, formal and informal recyclers, representatives of manufacturers and residents, and many more. The following figure shows the future waste flow envisioned by participants during the workshop in Mombasa.
Future Waste Flow in Mombasa
Waste Generators
880 t/day
Wet Waste
Dry WastePrivate Recycling
Companies
Material Recovery Facilities
Composting or anaerobic digestion
Refuse Derived Fuel Factory
Mombasa County & Private Collection Companies
Cleaning CBOs
Cement Companies
Fuel
Products and raw material
Soil Improvement and gas
Un-recoverable fraction of MSW 60% (530t)
40% (350t)
300t
50t
100t
Source Separation and Environmental Awareness
Raising and Education
Collection capacity expansion (more vehicles
and introduction of transfer stations)Licensing of CBOs
Infrastructure Investment (composting, MRFs, RDFs, etc) Disposal operation improvement
Plas�c Waste Genera�on60 T/day(100%)
Collected by service providers32%
Informal value-chain collec�on18%
Uncollected50% Unmanaged
53%
Sorted for recovery18%
Landfill / dumpsite30%
Retained on land 25%
Water 21%
Burnt 6%Drains 1%
All %’s are in reference to the total Plastic Waste generated
Table of contents
From this data an estimate can be made using
the Waste Flow Diagram (GIZ, 2020) of the City’s
Plastic Leakage. In the case of Mombasa (2019),
estimated plastic leakage is 3.7 kg per person/year.
In addition, the assessment helped to break down
and categorise the sources and pathways of plastic
waste in Mombasa identified with the two tools.
FIGURE 5: Plastic Waste Flow Diagram for Mombasa, Kenya20
20 Waste Wise Cities Tool. 2021, page 8
Following a city assessment using the Waste
Wise Cities Tool and Waste Flow Diagram, a local
stakeholder workshop identified key intervention
areas and service/infrasructure investment gaps.
Workshop attendees included stakeholders from the
waste management chain such as local government
officials, environmental regulators, collection
service operators, disposal facility managers,
formal and informal recyclers, representatives of
manufacturers and residents, and many more.
The following figure 6 shows the future waste flow
envisioned by participants during the workshop
in Mombasa.

42Global Chemicals and Waste Indicator Review Document
Mombasa County & Private Collection
Companies
Cleaning CBOs
Waste Generators
880 t/day
Cement Companies
Source Separation and Environmental Awareness Raising
and EducationDisposal operation
improvementInfrastructure Investment
(composting, MRFs, RDFs, etc)
Collection capacity expansion
(more vehicles and introduction of
transfer stations) Licensing of CBOs
Wet Waste
60% (530t)
Dry Waste
40% (350t)
Composting or anaerobic
digestion
SOIL IMPROVEMENT AND GAS
Material Recovery Facilities
UN-RECOVERABLE FRACTION OF MSW 100t
FUEL
PRODUCTS AND RAW MATERIAL
Refuse Derived Fuel Factory
300t
Private Recycling Companies
50t
Table of contents
FIGURE 6: Proposed waste flow by Mombasa workshop participants, Kenya21
21 Adopted from Waste Wise Cities Tool. 2021, page 8

43Global Chemicals and Waste Indicator Review Document
Table of contents
Methodology for Indicator 12.3.1b
5

44Global Chemicals and Waste Indicator Review Document
Table of contents
5Methodology for Indicator 12.3.1b22
22 The methodology follows the published metadata for SDG indicator 12.3.1b, adopted in the Food Waste Index Report 2021,
obtained from: https://www.unep.org/resources/report/unep-food-waste-index-report-2021
SDG indicator 12.3.1 comprises two sub-indicators:
12.3.1a Food loss index and 12.3.1b food waste
index. Food Loss is under the custodianship of FAO
and will not be discussed in detail in this document.
It is however important to discuss the potential
overlaps between the methodologies of these
two sub-indicators. The two sub-indicators cover
discrete food value chain stages, but some overlap
is possible at the interface of the manufacturing and
retail stages, as outlined in the below graphic.
Target 12.3: By 2030, halve per capita global food waste at the retail and
consumer levels and reduce food losses along production and supply chains,
including post-harvest losses.
Indicator 12.3.1b: Food waste

45Global Chemicals and Waste Indicator Review Document
Table of contents
Overlap
Data may overlap here
FIGURE 7: Theoretical best-case interaction between SDG 12.3.1a and 12.3.1b23
23 Adapted from UNEP, 2019, slide 12
Food Loss Index: SUPPLY-SIDE
FLI Covers:• 10 top commodities/country• From product maturity up to but excluding retail• Provides an average
Limitations:• Loss dynamics of less important commodities is
not included• Only primary processing losses are included
Food Waste Index: DEMAND-SIDE
FWI Covers:• Retail• Out-of-home
consumption (e.g., restaurants, hotels, canteens in schools, offices, prisons, hospitals, etc.)
• Household
All p
ossi
ble
food
loss
and
was
te in
a n
atio
n
During or immediately after
harvesting on the farm
(plant harvesting, livestock slaughter,
fisheries catch)
After leaving the farm for
handling, storage, and transport (warehouses, silos, shipping
containers)
In the home or business of the consumer
(including restaurants, hotels,
and caterers)
Consumption
During distribution to markets (including
wholesale and retail markets)
Distribution & Market
During industrial or domestic processing,
manufacturing, and packaging
Processing & Packaging
Handling & StorageProduction
Indices Do Not Cover: Less important commodities from “production up to but excluding retail”
Options for Covering This Gap: Using modelling or other methods to gather additional data to calculate losses for other commodities, starting at the point of product maturity

46Global Chemicals and Waste Indicator Review Document
Table of contents
I. Proposed approach
SDG 12.3 calls for a halving of food waste at retail
and consumer level. The proposed approach
endeavours to balance fitness for purpose, in
tracking progress at retail and consumer level, with
feasibility of implementation in as many UN member
countries as possible. Three levels of measurement
are envisaged, to enable flexibility in respect for
different policy priorities and capacities for data
collection among countries, summarised below:
LEVEL I INDICATORS
Food waste estimates for each sector
Existing data and extrapolation to other countries
LEVEL II INDICATORS
Food waste generation tracked at a national level
Direct measurement of food waste in retail, food service and households. Sufficiently accurate for tracking.
LEVEL III INDICATORS
Additional information and disaggregation of food waste data
Additional information to inform policy and other interventions. This includes disaggregated data by destination, edible/inedible parts, and also captures manufacturing food loss not covered by the Food Loss Index (e.g. where more than one commodity is combined to produce complex food products).
II. Step-by-step guide
This section outlines the three levels of the proposed
approach. Level I proposes a method to estimate food
waste for member states not able to undertake their
own measurement in the short term, using existing
data and modelled data through extrapolation.
Country-level food waste estimates provide a case
for action, while governments work towards putting
in place the necessary arrangements to begin their
own quantification. The method involves a model
and some other basic calculations. This modelled
data is useful in providing a snapshot of food waste
generation at country level for the first time. It is
not adequate for tracking changes at time intervals
towards 2030. UNEP calculates estimates for Level
I on behalf of countries.
Level II fulfils the requirement for tracking national
data at retail and consumer level, in line with the
SDG 12.3 methodology. It generates primary data
on actual food waste generation that will show
progress (or lack thereof) over time. For European
countries, the reporting under level II will include
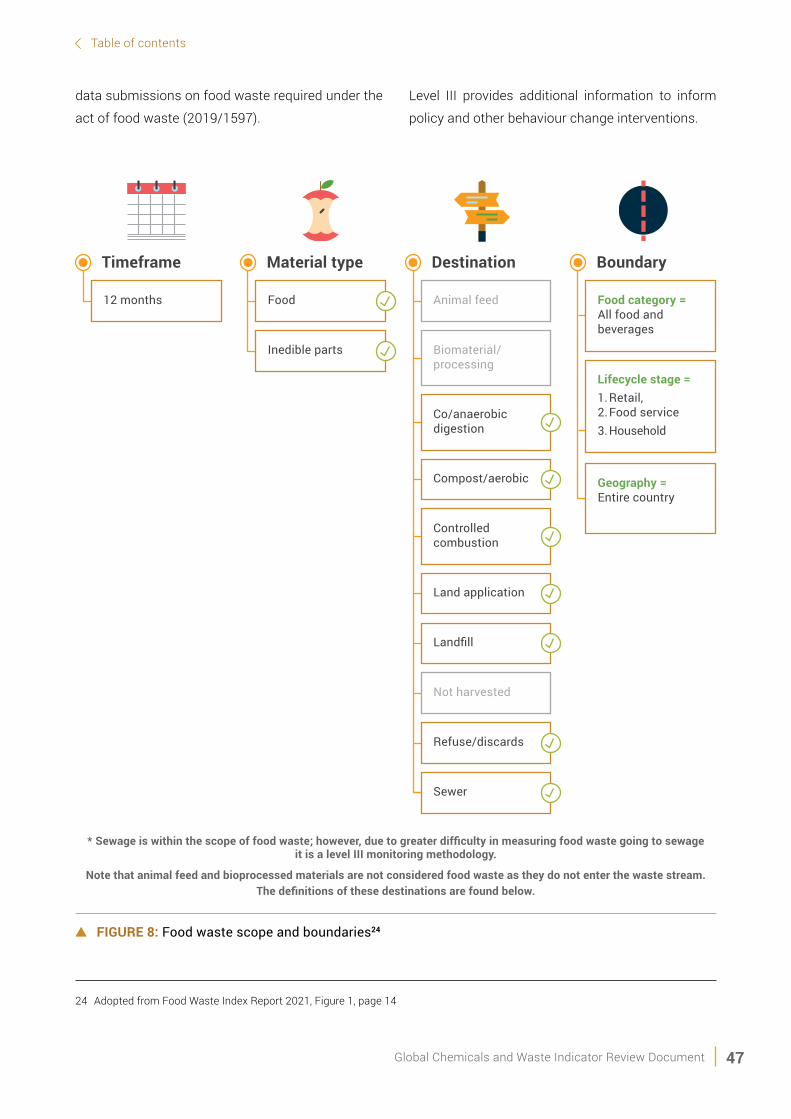
47Global Chemicals and Waste Indicator Review Document
Table of contents
data submissions on food waste required under the
act of food waste (2019/1597).
Level III provides additional information to inform
policy and other behaviour change interventions.
FIGURE 8: Food waste scope and boundaries24
24 Adopted from Food Waste Index Report 2021, Figure 1, page 14
* Sewage is within the scope of food waste; however, due to greater difficulty in measuring food waste going to sewage it is a level III monitoring methodology.
Note that animal feed and bioprocessed materials are not considered food waste as they do not enter the waste stream. The definitions of these destinations are found below.
Timeframe Material type
Animal feed
Destination Boundary
Biomaterial/processing
Co/anaerobic digestion
Compost/aerobic
Controlled combustion
Land application
Landfill
Not harvested
Refuse/discards
Sewer
12 months
Inedible parts
Food Food category = All food and beverages
Lifecycle stage = 1. Retail,2. Food service3. Household
Geography = Entire country

48Global Chemicals and Waste Indicator Review Document
Table of contents
TABLE 6: Definitions of food-waste destinations25
25 Food Waste Index Report 2021- Appendix 6, Table 19
DESTINATION DEFINITION
Animal feed Diverting material from the food supply chain* (directly or after processing) to animals
Bio-based
materials/
biochemical
processing
Converting material into industrial products for food and non-food purposes. Examples include creating fibers for packaging material; creating bioplastics (e.g., polyactic acid); making “traditional” materials such as leather or feathers (e.g., for pillows); and rendering fat, oil, or grease into raw material to make products such as soaps, biodiesel, or cosmetics. “Biochemical processing” does not refer to anaerobic digestion or production of bioethanol through fermentation
Codigestion/
anaerobic digestion
Breaking down material via bacteria in the absence of oxygen. This process generates biogas and nutrient-rich matter. Codigestion refers to the simultaneous anaerobic digestion of FLW and other organic material in one digester. This destination includes fermentation (converting carbohydrates—such as glucose, fructose, and sucrose—via microbes into alcohols in the absence of oxygen to create products such as biofuels)
Composting/
aerobic processes
Breaking down material via bacteria in oxygen-rich environments. Composting refers to the production of organic material (via aerobic processes) that can be used as a soil amendment
Controlled
combustion
Sending material to a facility that is specifically designed for combustion in a controlled manner, which may include some form of energy recovery (this may also be referred to as incineration or thermal treatment)
Land application Spreading, spraying, injecting, or incorporating organic material onto or below the surface of the land to enhance soil quality
Landfill Sending material to an area of land or an excavated site that is specifically designed and built to receive wastes
Not harvested/
plowed-in
Leaving crops that were ready for harvest in the field or tilling them into the soil
Refuse/discards/
litter
Abandoning material on land or disposing of it in the sea. This includes open dumps (i.e., uncovered, unlined), open burn (i.e., not in a controlled facility), the portion of harvested crops eaten by pests, and fish discards (the portion of total catch that is thrown away or slipped)
Sewer/wastewater
treatment
Sending material down the sewer (with or without prior treatment), including that which may go to a facility designed to treat wastewater
Other Sending material to a destination that is different from the 10 listed above. This destination should be described
* | Excludes crops intentionally grown for bioenergy, animal feed, seed, or industrial use

49Global Chemicals and Waste Indicator Review Document
Table of contents
II.1 Level I - Estimates of food waste for each sector
Initial Level I food waste estimatesEstimates are made for countries not yet publishing
their own food waste data. The approach uses
existing country data, studies carried out by
member states and extrapolations based upon the
estimates observed in other countries for countries
where no estimates are available. Lastly, confidence
ratings are assigned to the estimates. This work
builds on existing efforts to compile information
for SDG 11.6.1 on MSWM and will utilize existing
data on global waste, including data from UN-
Habitat on SDG 11.6.1 and from other available
sources (such as the UNSD/UNEP Questionnaire
on Environment Statistics). Most of the Level I
estimates are approximate and not sufficiently
accurate for observing and tracking changes over
time. However, they are sufficient to provide insight
into the scale of the problem and make a case for
action. They are intended as a short-term support
while governments develop capacity for national
measurement (consistent with Level II).
II.2 Level II – Food waste generation by supply chain stage
Level II provides a framework for countries to
measure and report food waste, enabling the tracking
of progress in line with the SDG 12.3 objective. It
covers studies on food waste generation at the
retail, household and food service stages of the food
supply chain and provides guidance on accepted
methodologies. If food waste is not yet measured
or the information is not shared, conducting new
measurement studies for all three sectors can be
challenging and require a higher level of resources.
Countries can therefore begin with one nationally
relevant stage and complete all sectors over time.
However, household food waste is recommended
to be measured as a first step, as household food
waste is suggested to be the largest source of food
waste in most countries. The manufacturing sector
as a possible fourth supply chain stage is included
in the level III framework (see II.3).
Methodology for food waste measurement The amount of food waste within a stage of the
food supply chain shall be established by measuring
food waste generated by a sample of food business
operators or households using any of the following
methods or a combination of those methods or
any other method equivalent in terms of relevance,
representativeness, and reliability.
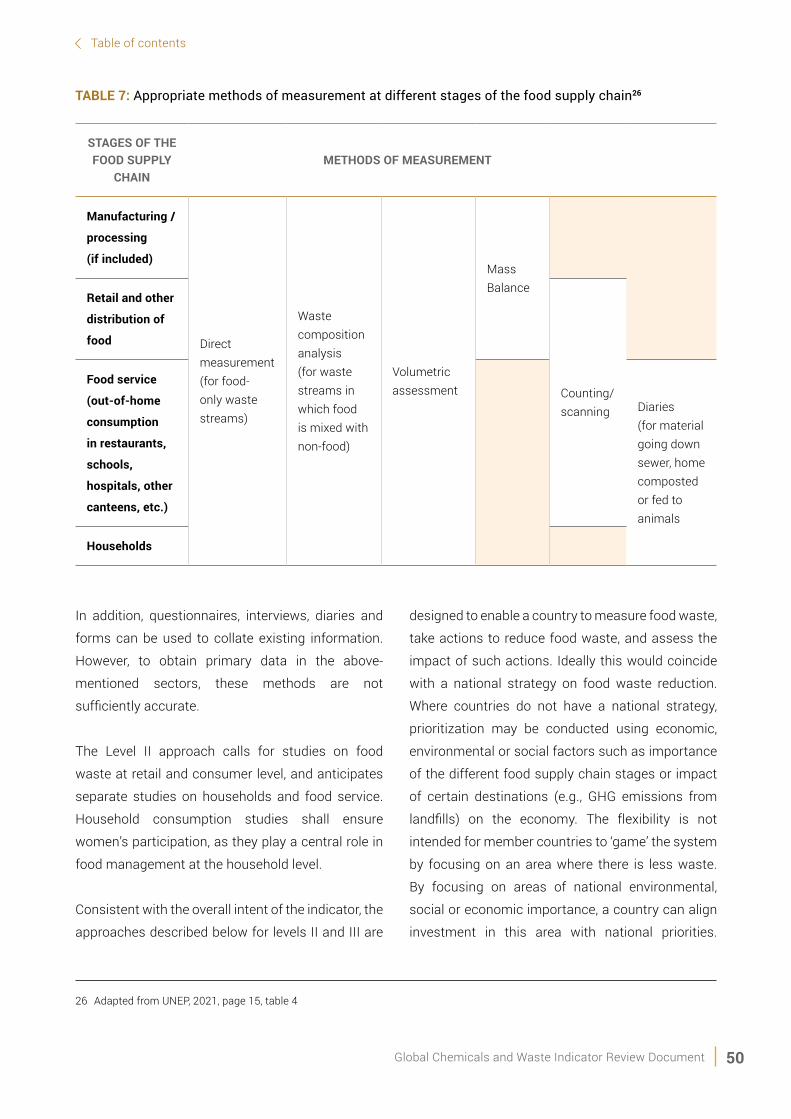
50Global Chemicals and Waste Indicator Review Document
Table of contents
TABLE 7: Appropriate methods of measurement at different stages of the food supply chain26
26 Adapted from UNEP, 2021, page 15, table 4
STAGES OF THE FOOD SUPPLY
CHAINMETHODS OF MEASUREMENT
Manufacturing /
processing
(if included)
Direct measurement (for food-only waste streams)
Waste composition analysis (for waste streams in which food is mixed with non-food)
Volumetric assessment
Mass Balance
Retail and other
distribution of
food
Counting/ scanning
Food service
(out-of-home
consumption
in restaurants,
schools,
hospitals, other
canteens, etc.)
Diaries (for material going down sewer, home composted or fed to animals
Households
In addition, questionnaires, interviews, diaries and
forms can be used to collate existing information.
However, to obtain primary data in the above-
mentioned sectors, these methods are not
sufficiently accurate.
The Level II approach calls for studies on food
waste at retail and consumer level, and anticipates
separate studies on households and food service.
Household consumption studies shall ensure
women’s participation, as they play a central role in
food management at the household level.
Consistent with the overall intent of the indicator, the
approaches described below for levels II and III are
designed to enable a country to measure food waste,
take actions to reduce food waste, and assess the
impact of such actions. Ideally this would coincide
with a national strategy on food waste reduction.
Where countries do not have a national strategy,
prioritization may be conducted using economic,
environmental or social factors such as importance
of the different food supply chain stages or impact
of certain destinations (e.g., GHG emissions from
landfills) on the economy. The flexibility is not
intended for member countries to ‘game’ the system
by focusing on an area where there is less waste.
By focusing on areas of national environmental,
social or economic importance, a country can align
investment in this area with national priorities.

51Global Chemicals and Waste Indicator Review Document
Table of contents
Comparability between countries would depend on
the scope selected.
The Level II approach requires a reporting member
country to:
1. Define a scope – i.e., select the sector(s) they
are going to report;
2. Pick suitable method(s) to measure and report
food waste within the sector(s);
3. Conduct a study(ies) using the chosen
method(s);
4. Report food waste for the Food Waste Index;
5. Repeat studies regularly using a consistent
methodology.
Choosing a scopeThe process for defining a scope for Level II reporting
against SDG 12.3.1b is similarly important to the
method used to quantify food waste within that
scope. In addition, once a broad scope is chosen
(e.g. household waste only), specific techniques for
data collection may be employed (these are included
in Annex II).
Relevant measures for other purposes might
already exist in a reporting country, such as for SDG
indicator 11.6.1. Under this indicator, the proportion
of municipal solid waste (MSW) collected and
managed in controlled facilities out of the total
municipal waste generated, by cities, is tracked.
Data for this indicator can be provided by tracking
the amount and composition of urban solid waste
by compositional analysis of a range of sectors,
including households, food retail and food service.
The amount of food waste included in this data can
be repurposed for the Food Waste Index.
It needs to be noted that the two indicators differ
in geographic bounds: 12.3.1b (the Food Waste
Index) covers the entirety of a country, while 11.6.1
solely covers cities. Introducing additional studies
for rural areas or extending city-based studies to
surrounding areas could be methods to overcome
this difference.
In certain situations, it might be possible to report
both SDG indicators with one set of fieldwork.
Nevertheless, additional measurement is required if
a considerable amount of food waste is not collected
as part of the MSW collection system.
Boundaries
A member country will need to specify which of the
following stages are included within their Level II
estimate:
• Retail
• Households
• Food service
The inclusion of more than one stage within the
scope’s boundaries may necessitate multiple studies
and different methods for each stage chosen.
The UN Statistics Division-UNEP Questionnaire on
Environment Statistics: Waste Section will be used
to collect food waste data under SDG 12.3 and is
sent out every two years to National Statistical
Offices and Ministries of Environment. For
each country, these will nominate a single food
waste focal point to coordinate data collection
and reporting. The SDG Global Database, UNSD
Environmental Indicators and UNEP’s Food Waste
Index, which will be published at regular intervals
up to 2030, will function as media to make the data
publicly available. In September 2022, the next
questionnaire will be forwarded to member states.
By February 2023, the results will be reported to
the SDG Global Database. It is recommended for
countries to measure each sector at least once
every four years. It is not necessary to conduct new
52Global Chemicals and Waste Indicator Review Document
Table of contents
measurements every two years or measure every
sector simultaneously.
Choosing a methodAs shown in Table 6 above, appropriate
measurement methods vary between sectors. The
advantages and disadvantages of different methods
are well documented in the Food Loss and Waste
Accounting and Reporting Standard (Hanson et al.,
2016). Up-to-date data that are accurate enough to
allow tracking of food waste over time should be
generated by the chosen measurement method(s).
Obtaining other information at the same time can
also help to reduce food waste in a country (e.g., on
the types of food that are most frequently thrown
away and the principal causes). More details on the
most appropriate methods for each food supply
chain stage is found in Annex II.
It may be necessary to conduct multiple studies
applying different methods if more than one
sector is included within the scope’s boundaries.
The methods presented in Table 6 are not only
appropriate for government-funded studies, but
also for individual businesses. In some situations, it
might be necessary to apply more than one method
in the same sector, for example if a business has
food waste in two solid waste streams (one food
waste only and one mixed residual).
To estimate the amount of food waste within a sector
in a country, measurements shall be generated by a
sample of businesses or households, which needs
to be adequate in size and representativeness.
Moreover, scaling will be required to obtain the
estimate. Food waste agreements (or legislations)
that require businesses to share data on the amount
27 For more detail, please refer to page 40 of the FLWS (Hanson et al. 2016). Ploughed in/not harvested is a destination not applicable
to food waste as it is only relevant at the production stage of the food chain.
of generated food waste exist in some countries.
These data can then be used for tracking purposes
if the respective agreement allows. .
II.3 Level III – Food waste and reuse by destination
Information for Level III includes supplementary
indicators which are useful for informing national
policy and decision-making. These will not be
part of the core data reporting at the global level,
but may provide useful information for national
decision making.
Measuring both food waste and reuse by destination
is important for understanding the best way to
optimize food waste or food used for composting.
The preferred scope would be the below and it would
be useful to disaggregate the total food waste by
these categories:
• Codigestion/anaerobic digestion,
• Composting/aerobic process,
• Controlled combustion,
• Land application,
• Landfill,
• Refuse/discards/litter,
• Sewer*27,
• Home composted,
• Animal feed,
• Bio-material/biochemical processing.
Sewer/wastewater provides useful information for
understanding food destinations. Countries may
wish to include food discarded to sewer if this is an
important destination in the country. As an example,
the amount discarded to sewer (down the sink) can

53Global Chemicals and Waste Indicator Review Document
Table of contents
vary depending on disposal culture. In the UK, 23%
of household food and drink waste in 2015 was
discarded to sink or sewer (WRAP 2018).
Additionally, the food “surplus” destinations animal
feed and biochemical processing are out of the scope
of waste, but would capture food reuse and provide
information which would be useful to understand
the food system. The total amount of food waste
and reuse will be greater than food waste measured
under level II.
A reporting member country should include in
its scope both material types that leave the food
supply chain (i.e., food and its associated inedible
parts). It is recommended where possible that food
waste is disaggregated by edible parts (intended for
human consumption) and inedible parts. Note that
assumptions on what constitutes inedible parts
varies across and within countries (sometimes
even within households). Nicholes et al. provides
a methodology that could be applied in different
countries taking into account cultural differences28.
The disaggregation by edible and inedible parts
associated with food (e.g. animal bones, egg shells,
fruit stones or pips) helps understand the amount
of food waste which is unavoidable (e.g. if fresh
eggs are purchased, then egg shells will need to
28 Nicholes et al. Surely you don’t eat parsnip skins? Categorising the edibility of food waste Resources, Conservation & Recycling
147 (2019) 179–188
be discarded), and how much is avoidable, in that
it could have been prevented if better managed in
the supply chain or the home. Definitions for wasted
food and inedible parts are given in the Food Loss
and Waste Accounting and Reporting Standard.
Finally, the level III framework also captures food
waste in the manufacturing sector that is not
covered by the Food Loss Index, e.g., where more
than one commodity is combined to produce
processed/complex food products.
The choice of destinations may be influenced by the
data available. For example, a hypothetical country
wishes to report food waste comprising both food
and inedible parts for the retail sector and has
determined that the formal retail sector can provide
records from stock and sales data. Using ‘inventory’
records however are unlikely to provide insight to
determine where the material is sent. If information
(whether through records or other means) does not
exist about where material is sent by the retail sector,
it may need to be removed from the two excluded
destinations from the scope before reporting.
Another factor to consider is that some destinations
may not exist in the reporting member country e.g.
codigestion/anaerobic digestion.
III. Additional Disaggregation
In global reporting, the disaggregation will include
the supply chain stages: households, food service,
and retail. Additionally, for level III, disaggregation by
destination, by edible and inedible food waste and
by manufacturing as a fourth sector is proposed.

54Global Chemicals and Waste Indicator Review Document
Table of contents
The following disaggregation will not be included
in the global reporting but are proposed for
national consideration.
The types of food thrown away provides useful
insight for focusing effort and developing solutions
to prevent waste. This can be performed at a high-
level using categories such as fruit, vegetables,
bakery. More detailed information can be obtained
by studying e.g., the type of fruit wasted. Either level
of details can be achieved via waste compositional
analysis. In retail and food service settings, the use
of scanning systems and / or smart bins can also
provide this level of detail. Disaggregation may also
be useful based on geography, e.g., obtaining data
for individual states, provinces, cities, or other areas
within a country. This will help understand where
efforts to reduce food waste need to be focused. For
similar purposes, countries may wish to undertake
studies to understand the groups of businesses or
people that waste disproportionately high or low
levels of food waste or particular types of food.
Taking household food waste as an example, this
disaggregation may include understanding the
variation by age, gender, income, levels, region,
household composition, employment status, etc.
Qualitative research, including interviews and
observation, can be a useful measurement method.
This additional disaggregation creates a more
complete picture of the food waste and food surplus
status within a country, and the data can contribute
to a national food waste prevention strategy.
IV. Data sources, availability and production
The following data collection tools, measurement
techniques and leveraging of existing data sources
applies to both level II and level III. As described
above, level II covers food waste generation at
retail and consumer level, whereas level III allows
countries to report additionally at the manufacturing
level and to gather disaggregated data on causes,
types of foods wasted and destinations, to better
inform policymaking.
Data collection tools The following methods request data from others in
varying forms and will require collation at least and
potentially scaling to represent the total population/
food chain stage. If it is of appropriate quality and
coverage, using existing data is generally more
cost-effective for a country than to undertake
new measurements.
• Diaries – a type of log where quantities of food
discarded are recorded on a case by case basis
daily. This can involve weighing or estimation/
approximation by the person filling in the log. For
example, in a household setting, a respondent in
a Mexican study may log discarding 3 tortillas on
the first day or a respondent in Tanzania may log
‘a handful’ of ugali (staple foods in each country).
The average mass of items for such reported
measures would need to be used to convert the
measure into grams.
• Surveys – a structured questionnaire to gather
information from a large number of individuals
or entities. A survey is most appropriate when
the commissioner of such a method is confident
in the ability of the respondent to accurately
provide the data requested. This means that
the respondent has already recorded the data

55Global Chemicals and Waste Indicator Review Document
Table of contents
and the survey is gathering it, rather than
asking for a recollection or opinion. Practically,
this invalidates surveying as a useful method
for household food waste quantification as
respondents are unlikely to have measured their
waste and remember it accurately at time of
asking. It is more appropriate for formal retailers,
food service companies (restaurants etc.) and
food manufacturing who may collect waste data
as part of record-keeping activities (see below).
• Records – a collection of data that have been
recorded and saved physically or virtually.
These are often collected for reasons other than
quantifying food waste (e.g. warehouse record
books). For specific food chain stages, these
may provide a relatively accurate picture of an
organisation’s food waste. A non-perishable food
wholesaler may keep records of any unsold stock
that is discarded, representing its food waste if
the stock records can be matched to weight of
food for each item in question.
Existing Data sourcesIt is possible that some of the data required to
produce estimates of quantities of food waste
already exist and are collected for other reasons.
These will likely be related and useful data but often
do not include information about the quantities of
food waste. For example, registration of companies
with the government can give an indication of
number, size and type of business (e.g. restaurant
vs. street vendor) to scale other data with.
• Manufacturing/processing: company registration
data, factory records, stock keeping, purchase
and sales ledgers, and waste management
records/receipts (where charged by volume).
• Retail: (formal) company registration data,
company records, stock keeping, purchase and
sales records, waste contractor data; (informal)
government surveys, academic surveys
and studies.
• Food service: (formal) company registration data
of restaurants, hospitals, schools etc., company
records, purchase and sales records, waste
contractor data; (informal) government surveys,
academic surveys and studies.
• Households: household income and expenditure
surveys on purchases, census data for population,
number and type of household, waste collection
company data, academic studies on generation
and composition.
• Municipal Solid Waste: covering waste originating
from households, commerce, and trade, food
service, small businesses, office buildings and
institutions (schools, hospitals, government
buildings), as well as waste from park and garden
maintenance and street cleaning services. This is
consistent with the definition used in SDG 11.6.1.
Direct measurement and scalingThese methods are most useful for a reporting
country which has decided to conduct a study
into food waste within the set scope, usually for a
representative sample, that can then be scaled to
estimate the total quantity for that scope.
• Direct weighing - using a measuring device to
determine the mass of food wasted. This could
involve weighbridges for collection vehicles or
simple scales in a household setting.
• Counting - assessing the number of discrete food
items that have been discarded and using the
result to determine the mass. This could include
scanner data or simply counting bags of waste.
• Assessing volume - assessing the physical space
occupied by the food waste and using the result
to determine the mass. In a situation where the
entire quantity of food waste is likely to have the
same composition, for example a waste stream
from commodity processing, the density of that

56Global Chemicals and Waste Indicator Review Document
Table of contents
waste is likely to be consistent. Therefore, a value
for mass can be determined by applying the
density of the waste to the volume it occupies,
potentially something like a residue collection vat.
• Waste composition analysis - physically
separating food waste from other material
to determine its mass and composition. This
can be the most accurate way to gain deeper
understanding into the differences in material
type (wasted food against inedible parts) and
types or categories of food wasted. Thus, even
in a separate food waste stream, this method
has some utility to achieve a narrower scope or
provide greater detail.
At the subnational level, these methods could be
used by the subjects of interest to quantify their
own waste, ready for collating using methods
above. For example, a member country may work
with a few formal retailers and a research partner
29 A number of large international food retailers have recently published data publicly on The Food Waste Atlas
(https://www.thefoodwasteatlas.org).
to conduct a month-long study of recording retail
waste using scanner data which is then scaled to
the whole sector (direct measurement and scaling).
Conversely, a country legislates a requirement
for all formal retailers to start collecting the data
(potentially through scanners) and report in an
annual survey.
A combination of methods may be suitable for
certain scopes. For example, if household waste
collection is very close to generation, direct weighing
of waste and applying a weighted average of the
composition can arrive at percentage that is food
and/or inedible parts. However, this scope would
exclude food composted at home and discarded via
the sink or to a sewer system.
A full elaboration of data sources for each stage of
the supply chain is described in Annex II.
V. Discussion: opportunities and limitations
Accurate food waste measurement takes time and
resources, but adequate data collection is possible
with sufficient commitment, and tailored and
targeted communication. For example, countries
with confidence in their household waste collection
infrastructure and statistics, such as the UK and
Denmark, have commissioned specific food waste
studies for that food chain stage. Retail food waste
may require a trusted confidential reporting system
for formal retailers to feel comfortable sharing
information. However, many companies are already
publicly sharing data on food waste29. Informal
sectors (in the food supply chain but also in the waste
management industry) are more difficult to quantify
and food waste estimates would require some idea
of their size (e.g. number of informal food retailers
and the quantity of food sold by them) alongside
estimates of the proportion of food handled that is
wasted, potentially a separate piece of work.
Food waste data is often based on calculations using
existing related data. It could involve deducing the
amount of food waste from quantities of related
data (e.g. calculating the difference between food

57Global Chemicals and Waste Indicator Review Document
Table of contents
inputs and food outputs in a process such as food
manufacturing) or using models (e.g. applying
percentages to quantities of purchased food or by
applying a series of coefficients to sociodemographic
variables). The related data may have been
sourced from a measurement activity to help form
assumptions. Modelled data can provide high-level
insight for tracking SDG 12.3.1b; however, this will
be less useful for informing specific interventions
or actions. As a rule, food waste models based on
indirectly correlated data are not a replacement for
measurement/tracking progress against a target;
they can provide valuable information in a first
instance about indicative amounts and areas of
interest to help prioritise action.
The causes of food waste could also be collected
to help develop solutions to tackle food waste. At
home, kitchen diaries that allow people to record why
they threw away an item can be undertaken. This
can be supplemented with in-home observation and
interviews (ethnography) to help understand the root
causes. In business settings, quantitative information
can be recorded with smart-bin technology or by
scanning systems. Diaries can also be used. These
can also be supplemented by observation, interviews,
and on-site assessments / audits.
It would be useful to understand the food that
enters a chain element (i.e. households) compared
to the food waste from that supply chain element.
For example, this would enable the analysis of the
amount of food brought into the home (purchase
data) and the percentage of food purchases that
are wasted in the home. Similarly, for businesses,
the amount of food waste could be compared to the
amount of food entering the business. Adjustments
may need to be made if the mass of items changes
within the business (e.g. if chickpeas are dried, or
pasta is cooked and absorbs water).
V.1 Limitations
The challenge resulting from the flexible three-
level approach to presenting a methodology is one
of consistency and comparability. Level I cannot
be compared directly with Levels II and III without
caveats, as the methodologies differ substantially.
Level I data is not designed to track food waste over
time in a country and should not be used to compare
countries, as the data often originates from a few
years ago or from other countries. Level II and
III data however should enable comparison over
time for a specific country, as well as comparison
between countries with care, as the measurement
of food waste becomes more established. Moreover,
when good country coverage exists, levels II and III
data can be aggregated to regional level.
Naturally, food waste data reported by countries
entails uncertainties. These can come from random
errors and systematic errors. Random errors can for
example be sampling errors and are relatively easy
to estimate, whereas systematic errors are harder to
estimate and can arise by e.g. using a measurement
method that systematically over-or under-estimate
food waste. Countries should report the total
estimated uncertainty related to their levels II and III
food waste data, as a good practice and to ensure
that comparisons between countries are only made
when the degree of uncertainty is sufficiently small.
Additionally, there are a number of challenges
related to the following:
• Variations in waste over time can have a significant
impact on estimated quantities of waste when
short studies (e.g. a week) are used to represent a
longer time period (a year), either due to:
- The specific time of year when a study takes
place which may affect the waste produced

58Global Chemicals and Waste Indicator Review Document
Table of contents
and contributes to a systematic error (it is
useful to collect data during two different
seasons e.g. rainy and dry seasons during
one year, or to adjust to account for known
variations if a study has been conducted at
one time of the year);
- Natural variation over time in amounts of
waste generated by single entities (e.g.
households or restaurants), which contributes
to random sampling error (it is useful to
include a sufficient number of entities and
measure over a sufficient length of time) .
• Different methods of quantification can also be
used for other relevant and related purposes (for
example, “where are the greatest opportunities
within the waste that is produced to reduce it?”).
Taking households consumption as an example,
it is difficult to obtain reasons for discarding food
(and therefore the opportunities for influencing
citizen behaviour) without the use of diaries
or ethnography. However, direct weighing of
waste volumes could give a significantly more
accurate quantity.
• At a national level, countries may have to rely
on other entities (e.g. waste management
companies, municipalities, businesses
generating food waste) to measure their own
waste and report to the government, which would
then be collated and analysed to estimate the
total amount. How the data is collected would
vary by food chain stage as the way food waste
is generated in each stage varies. For example,
a large formal retailer (supermarket chain) may
keep records of stock unsold and discarded
which could be reported. This effort can be
supported by establishing clear guidance for
these entities. On the other hand, a government
requesting reporting from households may have
to issue guidance to local municipalities and
prescribe a quantification method, e.g. a food
waste diary. The reported quantities may require
scaling if a government cannot obtain reports
from the entire population of the food chain
stage, i.e. it is unlikely that every household in the
country would report.
59Global Chemicals and Waste Indicator Review Document
Table of contents
Methodology for Indicator 12.4.2
6
60Global Chemicals and Waste Indicator Review Document
Table of contents
6Methodology for Indicator 12.4.230
30 The methodology follows the published metadata for SDG indicator 12.4.2, obtained from:
https://unstats.un.org/sdgs/metadata/files/Metadata-12-04-02.pdf
Target 12.4: By 2020, achieve the environmentally sound management of
chemicals and all wastes throughout their life cycle, in accordance with agreed
international frameworks, and significantly reduce their release to air, water
and soil in order to minimize their adverse impacts on human health and
the environment
Indicator 12.4.2: Hazardous waste generated per capita and proportion of hazardous
waste treated, by type of treatment
SDG target 12.4 calls for achieving the
environmentally sound management of chemicals
and waste through their life cycle and significantly
reduce their release to air, water and soil with the
purpose of minimizing their adverse effects on
human health and the environment. The proposed
approach relies on country specific data since
hazardous waste generated is highly dependent on
national factors. Hence, indicator 12.4.2 entails only
levels II and III indicators.
I. Proposed approach
The indicators’ calculation using gap fillers and
country specific data are based on the definition
of the indicator and constitute the minimum level
of reporting which the countries should achieve. In
case of lack of robust country-specific data based
on measurements, gap fillers should be used (such
as sector-based estimations of quantities based
on industry standards, data extrapolation, use of
values from internationally accepted publications
or databases, etc.). Whenever using gap fillers, the

61Global Chemicals and Waste Indicator Review Document
Table of contents
employed method for calculating/estimating should
be indicated. It is important to note that there is no
possibility to report data on hazardous waste using
only gap fillers, as hazardous waste generation
is extremely country-specific and depends on
several factors, such as the type of economic
activities performed in the country, level of industry
development, and others. There are no known
international benchmarks for general hazardous
waste generation rate. Therefore, the employed
method for indicators calculation/estimation should
always strive towards using country specific data
or a combination of gap fillers and country specific
data. Therefore, there are no Level I indicators for
this indicator.
LEVEL II INDICATORS
Hazardous waste generated
(in tonnes, per km sq. of land area and per
capita)
Hazardous waste collected + Hazardous waste given by generator to treatment or disposal facilities + Estimation of Unaccounted for hazardous waste
Hazardous waste generated by type,
including e-waste
A breakdown of hazardous waste generated by key type of waste, including e-waste
Proportion of hazardous waste treated Quantity of hazardous waste treated during reporting year / quantity of hazardous waste generated x 100
LEVEL III INDICATORS
Environmentally sound treatment of own
generated hazardous waste
Related to the country capacity for sound treatment of own hazardous waste within the country and the capacity for treatment of hazardous waste from other countries
Hazardous waste intensity of production Quantity of hazardous waste generated during the reporting year / DMC in the reporting year
II. Step-by-step guide
II.1 Level II - Hazardous waste generated
Hazardous waste generated should include
collected hazardous waste (either by specialized
companies or by municipal services), hazardous
waste which is given by the generator directly
to the treatment or disposal facility, as well as
an estimation of hazardous waste which is
unaccounted for. Generated hazardous waste
includes exported hazardous waste and excludes
imports of hazardous waste.
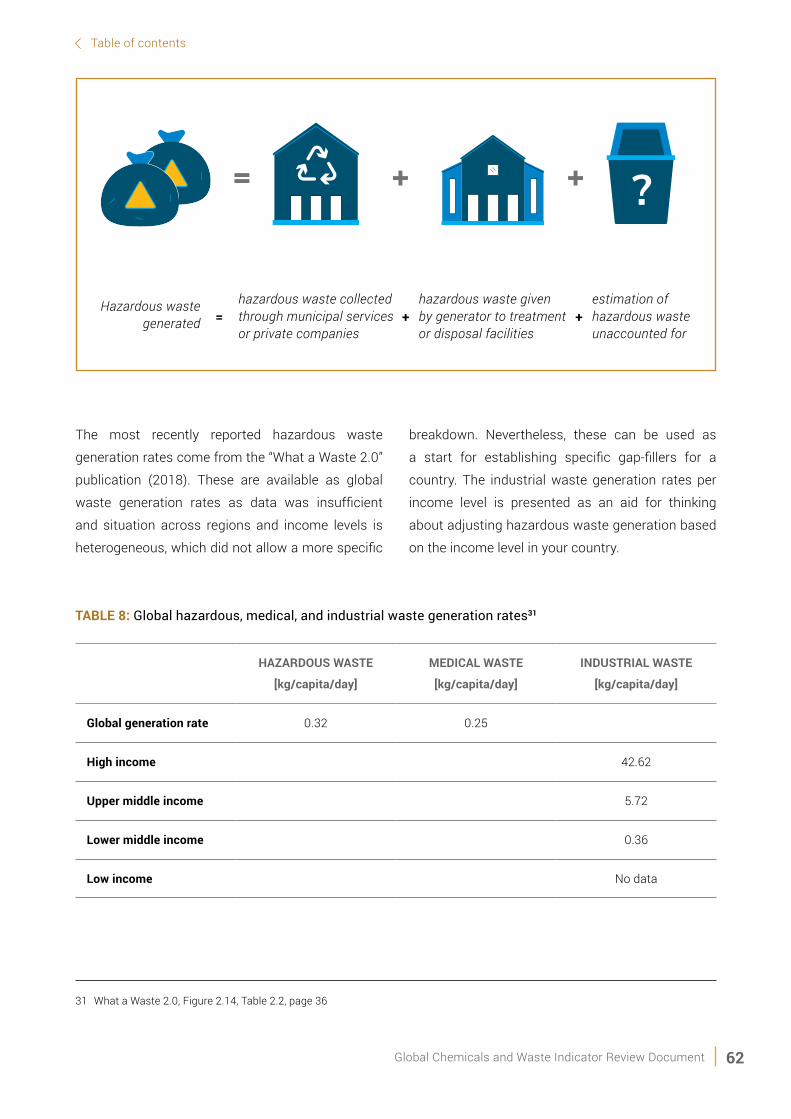
62Global Chemicals and Waste Indicator Review Document
Table of contents
The most recently reported hazardous waste
generation rates come from the “What a Waste 2.0”
publication (2018). These are available as global
waste generation rates as data was insufficient
and situation across regions and income levels is
heterogeneous, which did not allow a more specific
breakdown. Nevertheless, these can be used as
a start for establishing specific gap-fillers for a
country. The industrial waste generation rates per
income level is presented as an aid for thinking
about adjusting hazardous waste generation based
on the income level in your country.
Hazardous waste generated =
TABLE 8: Global hazardous, medical, and industrial waste generation rates31
31 What a Waste 2.0, Figure 2.14, Table 2.2, page 36
HAZARDOUS WASTE
[kg/capita/day]
MEDICAL WASTE
[kg/capita/day]
INDUSTRIAL WASTE
[kg/capita/day]
Global generation rate 0.32 0.25
High income 42.62
Upper middle income 5.72
Lower middle income 0.36
Low income No data
hazardous waste collected through municipal services or private companies
hazardous waste given by generator to treatment or disposal facilities
estimation of hazardous waste unaccounted for
+ +
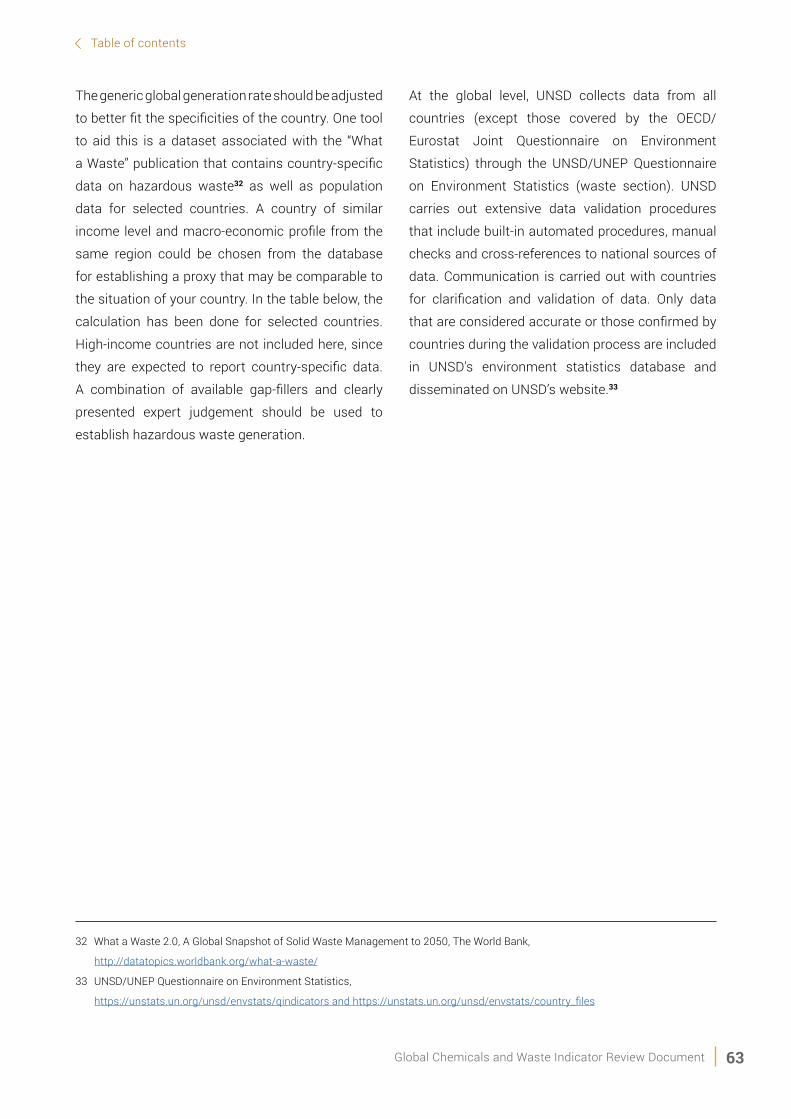
63Global Chemicals and Waste Indicator Review Document
Table of contents
The generic global generation rate should be adjusted
to better fit the specificities of the country. One tool
to aid this is a dataset associated with the “What
a Waste” publication that contains country-specific
data on hazardous waste32 as well as population
data for selected countries. A country of similar
income level and macro-economic profile from the
same region could be chosen from the database
for establishing a proxy that may be comparable to
the situation of your country. In the table below, the
calculation has been done for selected countries.
High-income countries are not included here, since
they are expected to report country-specific data.
A combination of available gap-fillers and clearly
presented expert judgement should be used to
establish hazardous waste generation.
32 What a Waste 2.0, A Global Snapshot of Solid Waste Management to 2050, The World Bank,
http://datatopics.worldbank.org/what-a-waste/
33 UNSD/UNEP Questionnaire on Environment Statistics,
https://unstats.un.org/unsd/envstats/qindicators and https://unstats.un.org/unsd/envstats/country_files
At the global level, UNSD collects data from all
countries (except those covered by the OECD/
Eurostat Joint Questionnaire on Environment
Statistics) through the UNSD/UNEP Questionnaire
on Environment Statistics (waste section). UNSD
carries out extensive data validation procedures
that include built-in automated procedures, manual
checks and cross-references to national sources of
data. Communication is carried out with countries
for clarification and validation of data. Only data
that are considered accurate or those confirmed by
countries during the validation process are included
in UNSD’s environment statistics database and
disseminated on UNSD’s website.33

64Global Chemicals and Waste Indicator Review Document
Table of contents
TABLE 9: Hazardous waste generation rate in selected countries34
34 What a Waste 2.0, own calculation based on downloadable database
COUNTRYHAZARDOUS WASTE GENERATION RATE
[kg/capita/day]COUNTRY
HAZARDOUS WASTE GENERATION RATE
[kg/capita/day]
Albania 0.01 Malaysia 0.26
Barbados 0.09 West Bank and Gaza 0.04
Chile 0.04 Thailand 0.14
Dominica 0.02 Tunisia 0.04
Hungary 0.17 Turkey 0.12
Indonesia 0.24 Vietnam 0.09
India 0.02 South Africa 0.07
Kuwait 0.19 Zambia 0.02
Madagascar 0.01
Estimation of unaccounted for hazardous wasteHazardous waste which is unaccounted for
may come from, inter alia, households, small
businesses and farms. Due to the small quantities
of hazardous waste generated per entity, and a
lack of or difficulty to access hazardous waste
collection services, weak or weakly enforced
environmental protection regulations, hazardous
waste may be mixed with municipal waste and/
or disposed of in an uncontrolled manner (e.g.
illegal dumping, open burning). In the case of
some lower-income countries, due to insufficient
environmental protection regulations or monitoring
of implementation, hazardous waste dumping or
open burning instead of treatment can occur even
in the case of producers of significant quantities,
further increasing the amount of hazardous waste
which is unaccounted for. A significant amount of
unaccounted hazardous waste may also be diverted
into the informal sector, prior or after it enters the
collection system.
Although there is no agreed methodology on the
estimation of unaccounted hazardous waste,
countries should employ the often-used methodology
of following the mass balance principle, using the
Material Flow Analysis (MFA). Input-output analysis
is increasingly applied to estimate and represent
material flows, MFA is a general system approach

65Global Chemicals and Waste Indicator Review Document
Table of contents
that can be used to explore various interfaces
between flows and stocks. For a comprehensive
picture of the material flows, it is vital to have data
on the accumulation and stock of materials in the
economy. There is a direct relationship between the
use of certain products and the amount of hazardous
waste that is created as a result of their production
(e.g. fluorescent lamps, batteries, e-waste, etc.).
Looking at production processes, sampling different
industry sectors to determine the hazardous waste
generation rate over the amount of input materials
and then using the ratio to estimate the total across
all industry sectors is one of the methods that can
be employed for estimating the country specific
hazardous waste generation. Significant information
and guidance on various methods of data collection,
including surveys and sampling, as well as their
shortcomings, are available in the Eurostat Manual
on waste statistics, Chapter 335.
II.2 Level II - Hazardous waste generated by type, including e-waste
In terms of estimating hazardous waste generation
from households, small businesses, offices and
institutions, direct sampling of waste generation is
one of the methods which can be employed. For the
household target group, it is necessary to determine
characterization of a consumption system, which
should include the following: products consumed,
frequency of consumption, levels of consumption,
consumption patterns (social context closely
linked to household location and income class),
consumption preferences (highlight production and
marketing opportunities). Different consumption
patterns of households of various socio-economic
status are needed for sampling to be able to create
35 European Commission, Eurostat Manual on Waste Statistics, 2013, available online at http://ec.europa.eu/eurostat/
documents/3859598/5926045/KS-RA-13-015-EN.PDF/055ad62c-347b-4315-9faa-0a1ebcb1313e, last accessed April 2018
a representative average. Additionally, consumption
patterns typically change across seasons, therefore
it is also necessary to sample waste generation
amount across the year.
It is more challenging to estimate the hazardous
fraction in the total waste generation from
households using the previously-mentioned
methodology (i.e. sampling from households)
because the pattern of the generation of household
hazardous waste is much more irregular than in
the case of industry. Some hazardous waste is
generated infrequently, such as paint, lamps and
electric and electronic waste, other waste such as
household appliances have a long useful life which
mean they take many years until they are no longer
productive and become waste. As a result, other
methods of estimation for hazardous fraction in
household waste can result in more accurate figures
than sampling.
Statistical data on imports and exports, combined
with data on local production allows estimates
to be made on the sale of certain products and
an estimation of the waste generated, after its
use or lifespan. This can be performed following
the steps below:
• Identification of the types of household hazardous
waste: paint, nail polish, cleaning products,
electric and electronic wastes, batteries, car
engine oil, fluorescent lamps, etc.
• Obtain sales data from retailers of those goods
and data on their expected life-time. If this data
is not available, statistical data on imports
and exports, combined with data on domestic
production allows for estimates to be made on

66Global Chemicals and Waste Indicator Review Document
Table of contents
the sale of certain products. Ideally, this would
also comprise historical sales data (the longest
life-time of the goods containing hazardous
substances) to be able to estimate the generation
of hazardous waste amount for the current year.
Paints are a particular case, as presented in
Box 2 below, in that they are applied to objects
which are usually not regarded as hazardous
waste when they reach end of life. Only the
residual unused paint is regarded as hazardous
waste. Assuming that people buy paint to use
it, a consumption pattern needs to be surveyed
or sampled to determine how much percent of
paint is usually discarded. This rate can then
be used to estimate future waste generation in
this category.
These data collection exercises can be laborious,
but once a generation pattern is established, the
rate can be used to estimate waste generation for
many years to come, or until there is a dramatic
change in consumption behaviours and/or
production processes of any product or sector. It is
recommended that a designated research institution
36 UNEP, Basel Convention, Methodological Guide for the Development of Inventories of Hazardous Wastes and Other Wastes under
the Basel Convention, available online at http://www.basel.int/Implementation/Publications/GuidanceManuals/tabid/2364/Default.
aspx, accessed April 2018.
is tasked with this work in a country to gradually
obtain data on waste generation pattern using the
previously mentioned methods.
Specific methodologies for developing inventories
on different types of hazardous waste are included
in The Methodological guide for the development
of inventories of hazardous waste and other waste
under the Basel Convention36. The document
aims to provide guidance to the Basel Convention
compliant authorities and other stakeholders on the
methods of developing national inventories for the
development of annual reports.
Hazardous waste generation rates for selected
waste streams and waste types, selected from
the Guidance document mentioned above, are
provided in the table below. In case of lack of more
accurate country specific data sources based on
measurements or calculations/estimations based
on the above mentioned methodologies, values such
as the ones below and/or values from international
databases can be used as gap fillers, until more
accurate data is produced.

67Global Chemicals and Waste Indicator Review Document
Table of contents
TABLE 10: Selected waste streams and waste types
37 Although e-waste can be either hazardous or non-hazardous, depending on the content of hazardous substances within the specific
EEE, based on the precautionary principle we decided to include e-waste in the 12.4.2 indicator on hazardous waste. In the case of
reliable data on separately collected/treated/disposed of e-waste without hazardous substances content, these quantities can be
excepted from the calculation of the indicator.
38 Baldé, C.P., Forti V., Gray, V., Kuehr, R., Stegmann, P. : The Global E-waste Monitor – 2017, United Nations University (UNU),
International Telecommunication Union (ITU) & International Solid Waste Association (ISWA), Bonn/Geneva/Vienna.
39 Although e-waste can be either hazardous or non-hazardous, depending on the content of hazardous substances within the specific
EEE, based on the precautionary principle we decided to include e-waste in the 12.4.2 indicator on hazardous waste. In the case of
reliable data on separately collected/treated/disposed of e-waste without hazardous substances content, these quantities can be
excepted from the calculation of the indicator.
NO.HAZARDOUS WASTE
STREAM/TYPEWASTE GENERATION RATE COMMENTS
1 E-waste generated37 20 Kg/capita/year, out of which:• 3.1 kg – temperature exchange
equipment• 2.3 kg – screens and laptops • 0.2 kg – lamps • 6.5 kg – large household equipment • 6.1 kg – small household equipment • 1.6 kg – small IT equipment
Data valid for EU countries, year 2016.38
1 E-WASTE generated from households39
15 Kg/capita/year, out of which: • 7.5 kg – large household appliances • 1.5 kg – small household appliances • 3 kg – ICT devices • 3 kg – Other consumer electronic
waste
Data valid for EU countries, year 2009
1 E-waste generation rate • 0.05 kg/capita/day in high income countries
• 0.02 kg/capita/day in upper middle-income countries
• 0.01 kg/capita/day in lower middle-income countries
• <0.01 in low income countries
What a waste 2.0, generation rates per income level
2 Waste engine oils Data in litres/year/vehicle • 4.25 for automobile • 31.5 for minibus • 425 for bus • 92.5 for truck or pickup truck • 31 for tractor
Inventory from Turkey, year 2006

68Global Chemicals and Waste Indicator Review Document
Table of contents
NO.HAZARDOUS WASTE
STREAM/TYPEWASTE GENERATION RATE COMMENTS
3 Hazardous household waste
• 3 – 5 kg/capita/year Usually estimated based on the quantities of waste collected at designated collection points.
4 Healthcare waste • 10-25% of generated healthcare waste is hazardous
High income countries40 • Total waste generated 0.9 – 10.7 kg/
occupied bed/day • Out of which infectious waste 0.038 –
2.79 kg/occupied bed/day
Estimation of World Health Organization Depends on type of healthcare facility WHO reference includes additional estimates for low-income countries
40 WHO, Safe management of wastes from health-care activities, 2nd edition, 2014, Available online at http://apps.who.int/iris/
bitstream/handle/10665/85349/9789241548564_eng.pdf;jsessionid=2743A11E1925DBB6A180C868456B1D01?sequence=1
TABLE 10: Selected waste streams and waste types (cont.)

69Global Chemicals and Waste Indicator Review Document
Table of contents
As previously mentioned, the global level data
is collected by UNSD through the UNSD/UNEP
Questionnaire on Environment Statistics that
contains data from all countries (except those
41 WHO, Safe management of wastes from health-care activities, 2nd edition, 2014, Available online at http://apps.who.int/iris/
bitstream/handle/10665/85349/9789241548564_eng.pdf;jsessionid=2743A11E1925DBB6A180C868456B1D01?sequence=1
covered by the OECD/Eurostat Joint Questionnaire on
Environment Statistics). Data on e-waste generated
and collected, hazardous waste generated per
capita are also disseminated on UNSD’s website41.
BOX 2. Tool for estimating E-waste generation
42 E-WASTE calculation tool, available online http://ec.europa.eu/environment/waste/weee/data_en.htm
43 Baldé, C.P. et al.,The global E-waste monitor 2017, Quantities Flows and Resources, United Nations University
44 Magalini, F. Study on collection rates on Waste Electrical and Electronic Equipment (WEEE), European Commission, 2015
45 Manual for the use of the WEEE calculation tool. European Commission 2017. Available online
http://ec.europa.eu/environment/waste/weee/pdf/WEEE%20calculation%20tools/WEEE_calculation_tool__manual.pdf
The E-waste calculation tool42 made available by the European Commission, calculates the quantity of E-waste generated in each EU Member State based on the quantity of electrical and electronic equipment (EEE) placed on the market. The average lifespan of each type of EEE is taken into consideration in the calculation of E-waste quantities. This tool is based on an elaborate research study that was established for 54 homogeneous electric or electronic equipment product types and linking the over 600 products to these keys. The keys were developed by the United Nations University (UNU) and are called UNU keys.43 The EU commissioned a study to establish typical
life-span of E-waste and collection rates across the EU building on the 54 UNU key categories.44 The two studies together generated sufficient information to develop the E-waste estimation tool. In practice, there are 28 E-waste calculation tools, which are developed on the basis of the same methodology but are filled in with the data of each Member State. This tool comes with a user manual45 and can be used to generate better estimated E-waste quantities based on quantities put on the market, life span estimations based on the UNU key categories and estimations regarding collection rates. (Also relevant for level II recycling indicators per material type).
Based on the above, the Hazardous waste generated
per capita indicator is calculated by dividing the
quantity of hazardous waste generated during
the reporting year to the population of the
generating country.
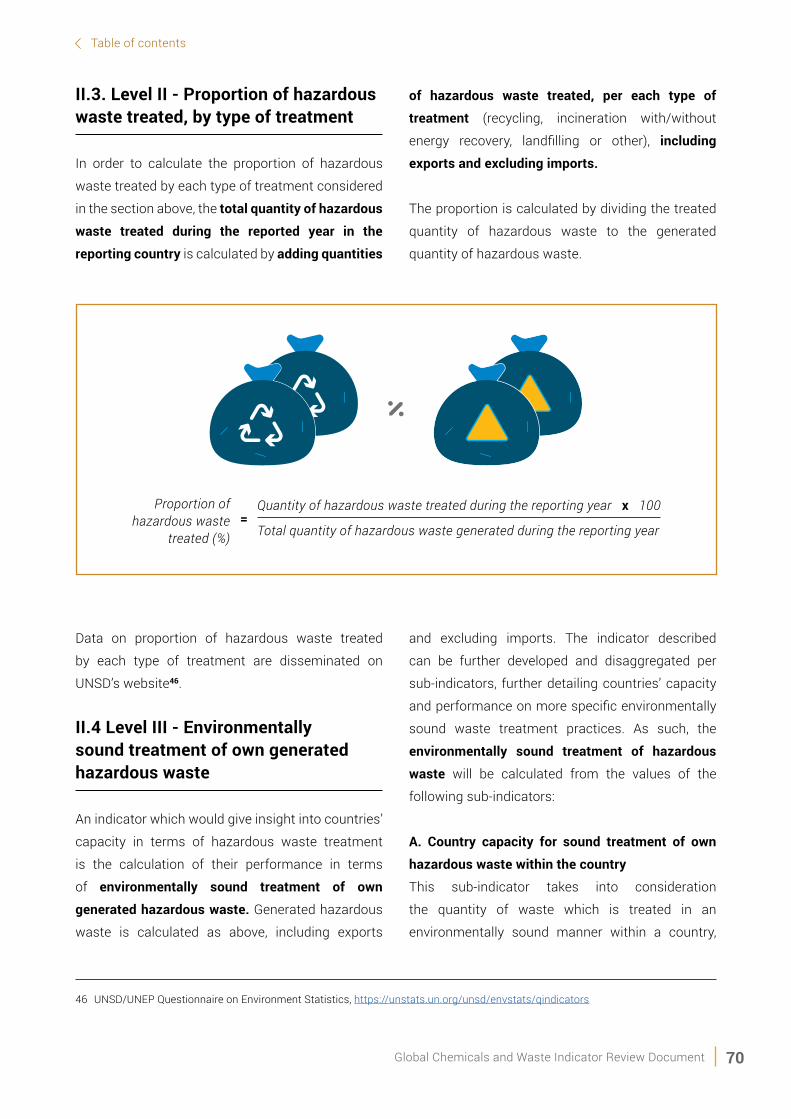
70Global Chemicals and Waste Indicator Review Document
Table of contents
II.3. Level II - Proportion of hazardous waste treated, by type of treatment
In order to calculate the proportion of hazardous
waste treated by each type of treatment considered
in the section above, the total quantity of hazardous
waste treated during the reported year in the
reporting country is calculated by adding quantities
of hazardous waste treated, per each type of
treatment (recycling, incineration with/without
energy recovery, landfilling or other), including
exports and excluding imports.
The proportion is calculated by dividing the treated
quantity of hazardous waste to the generated
quantity of hazardous waste.
Quantity of hazardous waste treated during the reporting year x 100
Total quantity of hazardous waste generated during the reporting year
Proportion of hazardous waste
treated (%)=
Data on proportion of hazardous waste treated
by each type of treatment are disseminated on
UNSD’s website46.
II.4 Level III - Environmentally sound treatment of own generated hazardous waste
An indicator which would give insight into countries’
capacity in terms of hazardous waste treatment
is the calculation of their performance in terms
of environmentally sound treatment of own
generated hazardous waste. Generated hazardous
waste is calculated as above, including exports
46 UNSD/UNEP Questionnaire on Environment Statistics, https://unstats.un.org/unsd/envstats/qindicators
and excluding imports. The indicator described
can be further developed and disaggregated per
sub-indicators, further detailing countries’ capacity
and performance on more specific environmentally
sound waste treatment practices. As such, the
environmentally sound treatment of hazardous
waste will be calculated from the values of the
following sub-indicators:
A. Country capacity for sound treatment of own
hazardous waste within the country
This sub-indicator takes into consideration
the quantity of waste which is treated in an
environmentally sound manner within a country,

71Global Chemicals and Waste Indicator Review Document
Table of contents
out of the total hazardous waste which is generated
within the country.
Granted that hazardous waste might be stored for a
period of time prior to being treated, this sub-indicator
will be increasingly useful over long periods of time,
to allow for waste which is generated during a year
but treated in the following year(s) to be reflected in
the data. It should be noted that treated quantities
should only be reported when actual treatment takes
place. In order to avoid double counting situations or
reductions in weight following treatment operations,
waste quantities should be counted when first
entering the waste treatment process/cycle.
This is consistent with the reporting process on the
UNSD/UNEP Questionnaire 2020 on Environment
Statistics (waste section), in which, after entering
the waste treatment process, waste is considered
as being generated by the waste management
sector (ISIC 38) and hence, as per Table R1 of the
questionnaire, should be excluded.
B. Country capacity for treatment of hazardous
waste from other countries
This sub-indicator aims at highlighting better
performance of countries that have developed their
capacity for treatment of hazardous waste and are
able to treat hazardous waste in an environmentally
sound manner for other countries, beside their
own waste.
This sub-indicator only considers imported waste.
For own waste treated in an environmentally sound
manner within the country, quantities would fall
under sub-indicator A.
47 Stefan Giljum, Monika Dittrich, Mirko Lieber and Stephan Lutter, Global Patterns of Material Flows and their Socio-Economic
and Environmental Implications: A MFA Study on All Countries World-Wide from 1980 to 2009, Resources 2014, 3, 319-339;
doi:10.3390/resources3010319
C. Hazardous waste exported in order to be treated
in an environmentally sound manner
The reason for calculating this sub-indicator is that
a high number of developing countries do not have
in-country capacity for treating hazardous waste.
However, they may make efforts to export this
waste for treatment in an environmentally sound
manner in another country. In some countries, such
as small island states, it might also be impractical
to have hazardous waste treatment facilities within
the country, as economies of scale might be difficult
to achieve.
It is our general assumption that all hazardous
waste exported for treatment is treated in an
environmentally sound manner, as transfer
of hazardous waste is governed by the Basel
Convention, which a considerable number of
countries are parties to.
Considering that the alternative is simple landfilling,
or possibly open dumping/burning, efforts
of countries which take these measures are,
as such, acknowledged.
II.5 Level III – Hazardous waste intensity of production
Information on hazardous waste generation can
be used for the characterization of countries’ clean
production practices, when linking it with the DMC,
as an increase in the generation of waste is one of
the environmental implications related to increased
material consumption47. The hazardous intensity of
production indicator would be calculated as follows:

72Global Chemicals and Waste Indicator Review Document
Table of contents
Thus, countries which have lower quantities of
hazardous waste generated but the same amount
of resources in consumption will have a lower
hazardous intensity of production and hence rank
higher according to this indicator. However, this
indicator has its limitations; as often there is a
significant gap in time between the use of materials
in production and the moment the materials
become waste.
III. Disaggregation
Indicators described above can be further
disaggregated depending on the country’s policy
information needs. For instance:
• Disaggregation at sector level, by ISIC codes.
Information on the generation and treatment
of hazardous waste could be collected from
industry or municipal level and treatment/
disposal facilities.
• Disaggregation by type of landfilling. As there
is significant difference between landfilling in
specialized, controlled and uncontrolled landfills,
further disaggregation on this type of treatment
could be analysed.
• Disaggregation by type of treatment per each
generating sector;
• Disaggregation by type of recycling operation
(R2 to R12 from Basel Convention Annex IV).
• Disaggregation by territorial division. Information
on the hazardous waste generated can
significantly vary throughout the territory of a
country as there might be hotspots of hazardous
waste generation, concentrated around industry
intensive areas.
Quantity of hazardous waste generated in the reporting year
DMC in the reporting yearHazardous waste
intensity of production =
DMC Includes solid, gaseous and liquid materials

73Global Chemicals and Waste Indicator Review Document
Table of contents
IV. Data Sources, availability and production
On a national level, data and information regarding
hazardous waste can be derived from hazardous
waste generators, hazardous waste collection
operators, as well as treatment facilities, local/
regional and national environmental protection
agencies. Depending on national obligations for
record keeping and reporting, the extent of the data
available might vary at country level as well as at
sector level.
Data on the generation of hazardous waste
should ultimately be reported by generators to
environmental authorities. The actual form and
frequency of which depends on legal requirements
and the maturity and/or complexity of the
environmental regulation system within the country,
which can differ significantly across the world.
At a minimum, information on possible generators of
hazardous waste can be derived from environmental
authorities based on the environmental permits
issued for industrial activities. Industrial activities
are likely to fall under environmental permitting
requirements, as they are likely to generate
hazardous waste. In case reporting on hazardous
waste generation is not a legal requirement, industry
specific hazardous waste generation rates could be
applied as a gap filler to production data, in order to
estimate the quantity of hazardous waste generated
by the specific industry.
Depending on the extent and quality of the waste
collection system, data on collected hazardous
waste may be used as a proxy for hazardous waste
generation, acknowledging also the invariable
existence of a fraction of unaccounted for hazardous
waste. Collection data may be available from
public and/or private waste collection operators
and subsequently cross-referenced with data from
hazardous waste treatment facilities, landfills, as well
as data on exported hazardous waste, for consistency.
Data collection on hazardous waste generation
and treatment is usually done by the competent
authorities designated under Basel Convention
(submission of annual reports in fulfilment of the
Convention’s obligations) or by national statistics
offices in terms of data aggregation, as an overarching
organism which links to national/regional authorities,
be it environmental agencies, environmental ministry,
commerce and trade authorities, etc.
Information on exported/imported hazardous waste
is generally available through the customs office.
As compelled by the Basel Convention, this type of
information is generated through the designated
authorities , as they are responsible for receiving
notifications of transboundary movements and
any related information and for responding to such
notifications (Article 2).

74Global Chemicals and Waste Indicator Review Document
Table of contents
V. Discussion: opportunities and limitations
48 Waste Framework Directive and European List of Waste, information available at
http://ec.europa.eu/environment/waste/framework/list.htm, accessed March 2018
49 Review of the European List of Waste, Final Report by Ökopol GmbH, November 2008, available at
http://ec.europa.eu/environment/waste/pdf/low_review_oekopol.pdf, accessed March 2018
A general challenge in hazardous waste statistics
is the sensitive public opinion on the hazardous
properties of chemicals and hazardous waste. These
concerns may disincentivize private operators from
disclosing data on their hazardous waste generation
unless compelled to do so by a robust environmental
regulator with proven legislative and institutional
backing, which in many countries is lacking.
Data on illegal waste collection, illegal trade, and illegal
dumping or deliberate leakage into the environment
are difficult to capture. An effective record mechanism
would require the integration of data from the
environmental regulator (e.g. for illegal dumpsites)
and from law enforcement (e.g. for illegal trade).
Meanwhile, the informal and semi-formal sectors,
including waste picking and recycling by the
informal private sector, all of which are especially
relevant to the situation in developing countries,
are difficult to measure because, in most countries,
they are unregulated and operate without oversight.
Hence, data collection disaggregated by sex and
age for the informal waste sector is particularly
difficult; however, essential in understanding gender-
related imbalances and burdens. Gender equal
employment practices in the waste management
sector are incremental to achieve the 2030 Agenda
(UNEP, 2019).
Another challenge is linking data on the use of
chemicals and generation of hazardous waste.
Efforts are underway at the EU to correlate the
classification and labelling of chemical substances
with hazardous waste codes, but it is an ongoing
process and the EU Waste Framework Directive has
not yet been revised to include this correlation48, 49 .
The Basel Convention gives the choice to link
hazardous waste either to the sector generating
the waste or based on waste constituents
(Annex I). By correlating specific waste to its
constituent chemicals, there can be a clear
connection made between the production data and
its resulting waste.
However, other challenges might also be considered,
such as the numerous transformations chemicals
may be subjected to through their use cycle, which
may change their classification to hazardous or
non-hazardous, time lag from chemical production
to it becoming waste, as well as mixing of several
chemicals in hazardous waste generated by a
single sector.

75Global Chemicals and Waste Indicator Review Document
Table of contents
The link between hazardous waste and chemicals is
not yet clearly established. Efforts are being made
within the EU to correlate classification of chemicals
with the classification of hazardous waste. Further
research is needed on potential methods to correlate
hazardous waste based composition of hazardous
chemicals and the production and/or consumption
of said chemicals. Further disaggregation on the
above could be carried out based on the hazardous
characteristics of chemicals (weather harmful to the
environment or to human health) and subsequent
hazardous waste. Limitations exist however
when it comes to understanding and factoring in
the above-mentioned correlation exercise of the
transformations which chemicals may be subjected
to throughout their use cycle and after disposal, the
time lag between chemical production/market entry
and it becoming waste, as well as treating mixtures
of chemicals in certain waste streams.
Considering the above, it is yet unclear if a direct
correlation between chemicals production/
consumption and hazardous waste can be made.
A solution might be first correlating hazardous
waste with economic sectors which generated
the waste. Depending on the availability of
disaggregated data, the use of chemicals in each
of the sectors generating hazardous waste can be
used to make correlations with hazardous waste
generated. Particularities of each industry however
need to be taken into consideration and factored
into such correlation attempts, as often there are
cases in which hazardous chemicals enter in the
composition of products which will further generate
waste classified as non-hazardous. An example is
the use of formaldehyde in the production of particle
board for furniture or solvent-based paint applied on
objects which, once discarded by the user, are not
considered hazardous.
BOX 3: Linking chemicals with hazardous waste – an example
The case of solvent-based paint is particularly relevant in illustrating the difficulties in correlating data on the production of chemicals with hazardous waste data.
Solvent based paints (or “oil based” paints, also enamels, varnishes, sealants, etc.) are considered hazardous substances/products. Unused/expired paints of this kind, and also the empty cans/aerosol containers resulting from their use are considered hazardous waste and evidently should be treated/disposed of as such.
However, once applied, they lose this classification. This means that the objects on which this type of paint is applied to, once out of use or at the end of their life cycle (such as discarded furniture which was painted with solvent-based paint) is, however, not considered hazardous.
Estimating the quantity of hazardous waste generated by this sector based on the production data is a difficult task. One could carry out surveys/studies to obtain data estimates on how much of the produced paints expire before they reach the end-users, together with how much of the purchased paint will remain unused, and as such determine a hazardous waste generation rate for this sector. Such data however would be prone to significant errors, due to a series of factors, such as: different time lags between production and expiration date which vary by product and producer, user stockpiling of products and waste products, and improper disposal of unused paint and empty packaging, such as mixing it with the municipal solid waste.
76Global Chemicals and Waste Indicator Review Document
Table of contents
V.1 Limitations
Data on hazardous waste generation and treatment
may be scarce in some countries, due to a series of
factors, such as: lack of, or insufficient, policies and
regulations on management and/or reporting; limited
human, financial and technical resources within
government agencies, lack of clear disclosure and
reporting rules and requirements, and unwillingness of
generators and public officials in certain countries to
disclose the quantities of hazardous waste generated.
Some countries may have the data and monitoring
systems needed to report, while for others there is a
need for training and capacity development to enhance
data collection, validation and reporting capacity.
Limitations in terms of usable data for calculating
the indicator(s) may arise due to misunderstanding
of the terminology used in the indicator or
discrepancies between these definitions and the
definitions included in national legislation. This
can lead to inconsistencies in reported values and
difficulties in cross-checking reported data. For
example, through national legislation, countries may
define additional types of waste to be considered as
hazardous beyond the waste streams defined in the
Basel Convention. By having inconsistent grouping
of types of waste, creating comparable data between
states becomes incredibly challenging.
As reporting data on the generation of hazardous
and other waste is becoming optional under Basel
Convention with the new reporting format adopted
by the COP in 2013 for the year 2016, having
accurate data on generated hazardous waste may
become a challenge.
While hazardous waste generation per capita might
be misleading when all sources of hazardous waste
are taken into consideration, for some sectors of
the economy it can be a suitable indicator of the
level of development of the country and its waste
management practices. This can be the case, for
example, for the hazardous fraction of municipal
solid waste, as well as for hazardous waste resulted
from healthcare facilities.
Hazardous waste which is unaccounted for as well
as hazardous waste which results from treatment
of waste considered otherwise non-hazardous
(for example hazardous waste resulting from the
treatment of municipal solid waste, or through
contamination of non-hazardous waste after
it enters the waste treatment cycle) is likely to
introduce inconsistencies in reported figures.
Inconsistencies in reporting figures may also arise
from the way data is reported and then aggregated. In
some cases, hazardous waste is reported by volume,
with no indication on density. As a result, estimations
and assumptions must be made to convert the units.
These estimations and assumptions must consider a
series of factors which can affect the actual weight of
waste, such as moisture content variation with season,
degree of pre-processing (crushing/compacting), etc.
Statistical data on imports and exports and production
statistics use different classification (for international
trade statistics Combined Nomenclature (CN) codes
are subject to annual changes, but the Harmonized
System (HS Nomenclature) is renewed every five
years). Statistical code systems for material flows (CN
codes, CPA) and for waste (EWC-Stat codes) are not
always comparable. For improved information on the
relationship between the inflow of materials and the
materials reaching waste management, the method
needs to be improved. When semi-manufactured
and finished products are to be aggregated into
material flow categories, a definition of the materials
incorporated has to be done. To what extent this
information can be taken from the CN codes is not
always clear.

77Global Chemicals and Waste Indicator Review Document
Table of contents
Methodology for Indicator 12.5.1
7

78Global Chemicals and Waste Indicator Review Document
Table of contents
7Methodology for Indicator 12.5.150
50 The methodology follows the published metadata for SDG indicator 12.5.1, obtained from:
https://unstats.un.org/sdgs/metadata/files/Metadata-12-05-01.pdf
SDG 12.5 aims to substantially reduce waste
generation through prevention, reduction, recycling
and reuse. The proposed approach relies on
3 levels indicators.
I.Proposed approach
LEVEL I INDICATORS
National recycling rate (Material recycled + material exported for recycling – material imported for recycling) / total waste generated (with gap filling for regional and global aggregates)
LEVEL II INDICATORS
Total Waste Generated (excluding construction, mining and agriculture) by type, including e-waste
This is the denominator for recycling and useful for understanding the target 12.5 on waste reduction.
National recycling rate by type of waste, including e-waste (other possible disaggregations include for metals and packaging waste)
Based on national data sources, including disaggregation of the recycling rate
LEVEL III INDICATORS
Waste intensity Waste generated divided by DMC (as an indicator of waste reduction)
Target 12.5: By 2030, substantially reduce waste generation through prevention, reduction, recycling and reuse
Indicator 12.5.1: National recycling rate, tons of material recycled

79Global Chemicals and Waste Indicator Review Document
Table of contents
II. Step-by-step guide
II.1 Level I - National Recycling Rate
For the purpose of this indicator, the National
Recycling Rate will be defined as the quantity of
material recycled in the country plus quantities
exported for recycling minus material imported
intended for recycling out of total waste generated
in the country. Note that recycling includes
codigestion/anaerobic digestion and composting/
aerobic process, but not controlled combustion
(incineration) or land application.
(Material recycled + Material exported intended for recycling - Material imported intended for recycling) x 100
Total waste generated
National Recycling Rate =
Gap fillers for waste generation are more commonly
used than for recycling rates, since end of the chain
recycling data is typically more readily available. For
the recycling rate, information on waste generation
will be used with regional gap fillers which are based on
existing data on the recycling rate. Note that gap fillers
are available in publications such as What a Waste by
the World Bank (2018)51 or the 2006 IPCC Guidelines52
for waste generation. The Global Waste Management
Outlook (2015) is also a source of worldwide waste
51 What a Waste 2.0, A Global Snapshot of Solid Waste Management to 2050, The World Bank,
http://datatopics.worldbank.org/what-a-waste/
52 IPCC Guidelines, https://www.ipcc-nggip.iges.or.jp/public/2006gl/pdf/5_Volume5/V5_2_Ch2_Waste_Data.pdf
data and more recent regional publications are
available for geographic areas and also for specific
landscapes (e.g. mountains) that may have an impact
on waste generation and composition. There is also
Waste Atlas with waste data available online which
is a common initiative of ISWA and the SWEEPnet,
but the data has not been updated in recent years.
What a Waste has the most comprehensive data-
set and will be used as the starting point for waste
generation estimation. A summary table with a rough

80Global Chemicals and Waste Indicator Review Document
Table of contents
breakdown is presented below and country level data
is also downloadable on the World Bank website53,
so if regional or income-based data does not seem
similar enough for the country for which gap filling is
done, then the more detailed database could be used
to choose a similar country.
53 What a Waste 2.0, A Global Snapshot of Solid Waste Management to 2050, The World Bank, http://datatopics.worldbank.org/what-a-waste/
54 What a Waste 2.0, Box 2.1., page 26
55 What a Waste2.0, Table 2.1., page 22
56 What a Waste, Figure 2.2, page 21, authors’ own calculation based on data from this figure and population reported in the publication’s national waste database
A. Municipal waste generation estimation
Most recent municipal waste generation data was
collected from countries and all data was extrapolated
to the year 2016 based on a methodology detailed in
the What a Waste publication.54
TABLE 11: Municipal waste generation rate per region55
Municipal waste generation per income level56
REGION 2016 AVERAGE [kg/capita/day]
Sub-Saharan Africa 0.46
East Asia and Pacific 0.56
South Asia 0.52
Middle East and North Africa 0.81
Latin America and Caribbean 0.99
Europe and Central Asia 1.18
North America 2.21
INCOME LEVEL 2016 AVERAGE [kg/capita/day]
Low income 0.40
Lower middle income 0.62
Upper middle income 0.71
High income 1.52

81Global Chemicals and Waste Indicator Review Document
Table of contents
Data is extrapolated and projected in the publication to
2030 and 2050 respectively. More accurate reporting
may be done by checking the extrapolated data in the
report or doing a projection based on combining GDP
growth rate and population growth rate forecasts.
57 What a waste, Table 2.2, page 36
B. Industrial waste generation rate estimation
Industrial waste quantities are significant and are
available as a proxy by income level breakdown.
TABLE 12: Industrial waste generation rate per income level57
INCOME LEVEL 2016 AVERAGE [kg/capita/day]
Low income No data
Lower middle income 0.32
Upper middle income 5.72
High income 42.62
Non-metallic minerals may be counted towards
industrial waste in some countries and therefore
these proxies are likely to have a bias towards
overestimation for the purposes of calculations
under this methodology. Recent country specific
data for industrial waste is available for selected
countries in the What a Waste database. Similarly,
as for the municipal waste generation rate, this
database may be consulted to choose a country
that has a more similar industrial profile or if there
are other reasons to use a country as a proxy rather
than the income-based generations rate.
C. Other waste stream generation rate estimation
The same publication contains data on special waste
streams that may be taken into consideration as
proxies. Special waste streams that are relevant for
the purposes of the computation and are available
in the publication are hazardous and medical waste.
Agricultural, construction and mining waste, though
listed below and marked in grey, are not accounted
towards total waste generation when computing
national recycling rate.
82Global Chemicals and Waste Indicator Review Document
Table of contents
TABLE 13: Generation rate of special waste streams
SPECIAL WASTE STREAM GLOBAL AVERAGE 2016 [kg/capita/day]
Agricultural waste 3.35
Construction waste 1.68
Hazardous waste 0.32
Medical waste 0.25
II.2 Level II - Total Waste Generated excluding construction, mining and agriculture
The sources of economic activities and households
that generate waste and are included in this indicator
are listed below. From the total waste generated,
non-metallic minerals (including construction and
mining waste from the municipal waste stream)
and agriculture waste is excluded. Waste generated
by ISIC 38, waste management activities, is also
excluded, as counting from these activities would
lead to double counting.
Waste from manufacturing (ISIC 10-33) + Waste from electricity, gas, steam and air conditioning supply (ISIC 35) + Waste from other economic activities (excluding
ISIC38) + Municipal waste (excluding construction and demolition)
Total waste generated
=
In reality, quantities of waste generated are available
from one of three data sources:
• by source of waste as reported by waste
generators or measured or estimated based on
surveys carried out at waste generators (level II);
• may be estimated based on data reported from
waste handling and waste management entities
due to unavailability of data (level I);
• by type of material for some because waste tends
to be treated by material, especially for high value
recyclables, such as non-ferrous metals, ferrous
metals, various packaging wastes (level II).
The methodologies described below should be
taken as a working document, countries should
make efforts to regularly check for updates in
international best practices, available benchmarks,
check waste generation patterns through surveys
and measurements, etc.
At the national level quantity of materials recycled
and materials exported for recycling is relatively easy
to collect from large facilities and customs offices.
Note that municipal waste is defined differently
in different countries, but it generally includes all
waste handled by the municipal waste management

83Global Chemicals and Waste Indicator Review Document
Table of contents
system and may include residential waste, waste
from commercial entities and institutions, but also
construction and demolition waste, some industrial
waste streams, parts of medical waste, agricultural
waste, etc. UN-Habitat is working to reduce
discrepancies through the work on SDG 11.6.1 on
municipal solid waste generation. A summary of
relevant characteristics and aspects is included
below.
TABLE 14: Waste types and their characteristics
WASTE TYPE CHARACTERISTICS ASPECTS TO CONSIDER
Municipal waste Aligned with SDG 11.6.1 on municipal solid waste generation
Most municipal waste streams including those from households, institutions and commercial entities are counted towards the amount of waste generated.
Municipal waste may or may not include E-waste, construction and demolition waste, waste from commercial and institutional entities and agricultural waste. When adding this stream to total waste generation, discount any construction and demolition waste and agriculture waste that may be included in the municipal stream as these are not considered in the calculations of this indicator.
Construction and
Demolition waste
This waste stream is often separately collected and therefore may not be counted towards municipal waste quantities
This waste stream is not counted towards waste generation in the context of this indicator.
Industrial waste Industrial waste stream is typically the largest waste stream in countries. The gap-fillers available in the breakdown per income category give an indication of the magnitude the waste stream may have. Data is likely to be available for high income countries. To make the estimation of these quantities more country-specific, expert judgement may be used, technical staff of landfill operators and collection companies are likely to be able to validate the estimated quantities and a composition and breakdown for Industrial waste.
Counted towards the waste generation rate
Mind for double counting in case waste amounts are already reported under the other relevant sources, such as municipal waste.

84Global Chemicals and Waste Indicator Review Document
Table of contents
WASTE TYPE CHARACTERISTICS ASPECTS TO CONSIDER
Agricultural waste This waste stream is often separately collected and therefore may not be counted towards municipal waste quantities
This waste stream is not counted towards waste generation.
Medical waste Especially in low and lower middle-income countries this waste type ends up in limited quantities in the municipal waste management system.
Medical waste is counted towards waste generation rate
Mind for double counting in case waste amounts are already reported under other economic activities or included in the municipal waste stream.
TABLE 14: Waste types and their characteristics (cont.)
II.3 Level II – National Recycling rate by type
A common way to improve waste data is to carry
out surveys or measurements for a sample of waste
generators belonging to a specific category. If enough,
resources to collect data for all waste generators is
typically not available, it is recommended to take a
sample of waste generators. This may be done for
the best disaggregation:
• By type of waste, including e-waste and
potentially metals and packaging waste.
• for economic activities by local unit (enterprise
or part thereof such as a workshop, factory,
warehouse, office, depot, etc.) situated in a
geographically identified place;
• for municipal waste first by source of generation,
household or non-household sources. Per capita
generation waste can be disaggregated by
income levels. UN-Habitat’s Waste Wise Cities
Tool – Step by Step Guide to Assess a City’s
MSMW Performance through SDG indicator
11.6.1 Monitoring provide more details on the
measurement methodology.
Several tools can be used to estimate the national
recycling rate. These also provide information on
estimating waste generation.
85Global Chemicals and Waste Indicator Review Document
Table of contents
TABLE 15: Existing or on-going methodologies, tools or developments
58 Eurostat: Manual on Waste Statistics, A handbook for data collection on waste generation and treatment, Available at
http://ec.europa.eu/eurostat/documents/3859598/5915865/KS-RA-10-011-EN.PDF/39cda22f-3449-4cf6-98a6-280193bf770c
Eurostat: Manual on Waste Statistics,
A handbook for data collection on
waste generation and treatment58
Chapter 3.1. on data collection on waste generation is relevant | The guidance includes use of surveys to collect information from units in the form of a questionnaire based on the business registry of the country. The guidance describes the steps for designing a representative sample for the surveys among economic units and households. Questionnaires and table formats for data collection are also suggested.
UNEP, Basel Convention,
Methodological Guide for
the Development of Inventories of
Hazardous Waste and Other Wastes
under the Basel Convention
Chapter 6 on methods for estimating waste generation is relevant. The methodology works with establishing waste generation factors for hazardous waste, but this can be done the same way for non-hazardous industrial waste.
Waste Wise Cities Tool – Step by
Step Guide to Assess a City’s MSMW
Performance through SDG indicator
11.6.1 Monitoring
UN-Habitat developed an evidence based MSW data collection methodology for monitoring SDG 11.6.1, developing concepts and definitions to unfold complex waste recovery market at the national level. The tool consists of 7 steps. Step 4 of the tool provides questionnaire for recyclers to compile data and calculate total amount of waste recycled. The tool also provides the waste composition survey methodology both at the generation and disposal point.
Waste Characterization
Methodologies
There are several methodologies available for sampling and characterizing municipal waste. A couple of sources are listed below: • ASTM D5231 - 92(2016) - Standard Test Method for Determination of
the Composition of Unprocessed Municipal Solid Waste - Available from - http://www.astm.org/cgi-bin/resolver.cgi?D5231
• Methodology for the Analysis of Solid Waste (SWA-Tool) User Version – Available from - https://www.wien.gv.at/meu/fdb/pdf/swa-tool-759-ma48.pdf

86Global Chemicals and Waste Indicator Review Document
Table of contents
II.4 Level III - Waste Intensity
Waste intensity of production = Total waste generated
DMC
By making total waste generated relative to DMC,
the indicator will be able to show how waste
generation is related to waste intensity of production.
Thus countries, which have the same quantities
of generated waste but use fewer resources in
production, will rank lower according to this indicator,
by having a higher waste intensity of production.
It is also recommended that this could be based on
material footprint; however, a globally agreed definition
of material footprint does not yet exist for this.
E-waste generation rate, which is a level I indicator, is
available but this waste type is likely to be collected
with municipal waste. Therefore, it might be already
reflected in the municipal waste generation rate,
predominantly in low income and lower middle-
income countries, but to some extent also in upper
middle income and high-income countries. UNU
maintains a detailed database on e-waste generation
with data available per country.
III. Disaggregation
Data for this indicator can be disaggregated at
various levels for this indicator in accordance with
the country’s policy information needs. For instance:
• In country recycling and materials exported/
imported destined for recycling will show how much
capacity the country has to recycle in country.
• By type of recyclable material: i.e. e-waste,
metals and packaging materials are given above.
These may be reported as quantities out of total
waste generated instead of materials put on
the market to get a disaggregation and keep a
common denominator.
• Disaggregation of Recycling Rate by material
flow for metal is possible by disaggregated data
for ferrous and non-ferrous recycled materials
and material flows.

87Global Chemicals and Waste Indicator Review Document
Table of contents
IV. Data sources, availability and production
Data sources within a country vary greatly, as
these depend on the regulatory and institutional
framework within the country. Some suggestions on
possible data sources are provided above, for each
level of reporting.
For quantity of waste recycled, data for output of
secondary materials from permitted end of recycling
chain entities should be used. Data should be
collected from processing units as close as possible
to the end of the recycling value chain or at the
production unit using the secondary raw material as
input to its processes.
Export and imports data on recyclables exported
with the destination of recycling can be sourced
from customs offices.
UNSD database on SDG indicators DMC and MF
may be used. DMC will be used as DMC by material,
specifically DMC of metal ore.
Collection processData collection on quantities of material recycled
is usually done by national statistical offices, as
an overarching organism which links to national/
regional authorities, be it environmental agencies,
environmental ministry, commerce and trade
authorities, etc.
Depending on the type of data needed and on the
regulatory system within the country, information for
national/regional authorities may come directly to
them, or through county/local offices (for example,
environmental permitting of large industry operators
may be done by national environmental authorities,
while environmental reporting on generated waste
may be directed towards local authorities).
Data availabilityFor the countries with centralised solid waste
data collection system, it is considered to be easy
to collect data required for the indicator. For the
countries without centralised solid waste collection
system, Level I methodology may be used.
V. Discussion: opportunities and limitations
Measuring prevention and reduction of waste is
a challenge, but one metric can be construed by
comparing waste generation rates to GDP and DMC.
These metrics will indicate how successful a country
is in decoupling waste generation from consumption
and economic activity. Reuse and repair are also
difficult to measure because often products are
reused and repaired before they are discarded and
avoid entering the waste stream, thus they are not
counted or measured in waste statistics. However,
increased reuse and repair activities should lead to
less waste generated (i.e. waste prevention). Given
these challenges, waste prevention via reduction,
reuse, and repair are not captured within this
indicator. There are several challenges in measuring
and tracing recycling.

88Global Chemicals and Waste Indicator Review Document
Table of contents
The recycling value chainThe recycling value chain regularly involves several
steps from the point a recyclable material is
extracted from the waste stream until it will be used
as secondary raw material.
Before a material is recycled, it may be source
segregated, separately collected, sorted in a
facility, washed, pressed and bailed, shredded and
transported. All these steps may be done at different
locations by specialized businesses or organizations.
BOX 4: The recycling value chain of hard plastics in Cairo Egypt59
59 GIZ, Recovering Resources, Creating Opportunities, https://www.giz.de/en/downloads/giz2011-en-recycling-partnerships-informal-sector-final-report.pdf (also referencing City Report by CID Egypt supplying information to the synthesis report, unpublished)
A labour intense, largely informal recycling value chain entails that there are many steps and actors involved in separation, collection, sorting and processing. The example showcases the value chain of hard plastics in Cairo, Egypt. It is clear from here, that while the
scope is always recycling, there are rejects in each step and deciding at which point of the chain the recycled quantity will be counted will make a vast difference between reported recycling rates.
PelletizingSold to Formal Industry
for Manufacturing
Granulating
Crushing
Washing
Sorted by color
Sorted by type/shapeIntermediary Traders
Source: CID Consulting | www.cid.com.eg
Formal & Informal Traders and Manufacturers
Intermediary Traders
Intermediary Traders
Intermediary Traders
Formal & Informal Traders and Manufacturers
HARD PLASTIC
89Global Chemicals and Waste Indicator Review Document
Table of contents
It is not clear at which step of the process the
recycled waste should be measured and if it should
be considered as input or output to a certain
process step.
At the same time, the national waste reporting
systems usually track waste amounts in each of
these process steps, reporting each time a waste
type and quantity is generated, transported or
handled by an authorized entity. In theory, this
would allow to check the mass balances along the
value chain of the recyclables. In practice, this is
not always possible and not common practice in
developing countries. Double counting is a concern,
as often when waste is processed or goes through
the recycling chain, the reject or output from the
treatment/ recycling facility is counted again as
“new” waste.
Furthermore, recyclables trading happens on a global
market, thus materials leaving the country destined to
be recycled are regularly allocated to recycling rates,
though verification to what happens to materials
exported for recycling does not always occur.
Changes to quantity and quality along the recycling chain In each process step described above, the material
may be physically altered, and rejects will be
produced. The rejects resulting from any step of
the process in the material recycling cycle are not
counted as generated waste, since this is considered
“secondary waste”.
The transformation in the process steps also means
that if recyclables are measured at the entry point
to the recycling value chain, rather than at the end
of the value chain, the recycling rate will be higher.
It is noted in the OECD metadata on Municipal Waste
that recycling is often reported as the quantities
sources segregated, entering or leaving sorting
stations (Spain, France).
Informal activitiesMeasuring recycling activities, by sex, is further
complicated by the informal sector activities in
the market. Informal sector activities in waste
management are almost universally present in
all countries, but more pronounced in emerging
economies, large cities and in low-income countries.
As noted in the Gender and waste nexus, women
are often waste pickers, or informal sector waste
workers, may collect recyclables from disposal sites
or streets, limited to lower-income tasks whereas
men may buy from generators and may be owners
of informal or semi-formal scrap-yards, trading
waste to bigger buyers or final users.
90Global Chemicals and Waste Indicator Review Document
Table of contents
Box 5: Significance of informal sector activities60
60 Ramusch, Roland, and Ulrike Lange. 2013. “Role and Size of Informal Sector in Waste Management – a Review.” Waste and Resource Management, May. https://doi.org/10.1680/warm.12.00012
Informal sector activities and their impact on recycling should not be underestimated. A comprehensive review of available case studies on informal sector activities, published in 2013 reveals that 288 working days per year, the daily amounts collected per person range from 7 to 700 kg with a median value of 43 kg (average value 111 kg). The study estimates that the contribution of informal sector activities to recycling can be quite high, up to 80% of
total recycling rate from municipal waste streams. The proportion of informal waste workers can be estimated at approximately 0.6% (0.5–2%) of the total population. These benchmarks can help estimate the total recyclables that are captured by informal sector workers in a municipality. Nevertheless, much of these materials eventually enter the formal recycling chain and are reported towards the end of the value chain.
Before the recyclables enter the formal economy,
they may go through several steps or informal
transactions and transformation.
Materials that are extracted from disposal sites
pose a double counting issue for waste, while those
that never enter the formal economy are the most
difficult to capture in statistical data.
The influence of market pricesPrices of recyclable materials are established on the
global markets, these influence recycling rates.
Where recycling is primarily an activity of the
private (informal and formal) value chains, higher
prices will influence extraction and diversion from
disposal, as a higher price will increase quantity
demanded and more materials will be bought.
Periods of lower prices may increase the materials
that are found in municipal recycling programs, as
there are fewer alternatives for households to sell
directly. Price fluctuations may incentivise traders to
stockpile materials in anticipation of higher prices.
This increases potential time-lags and should be
considered when deciding where in the recycling
chain data should be reported.
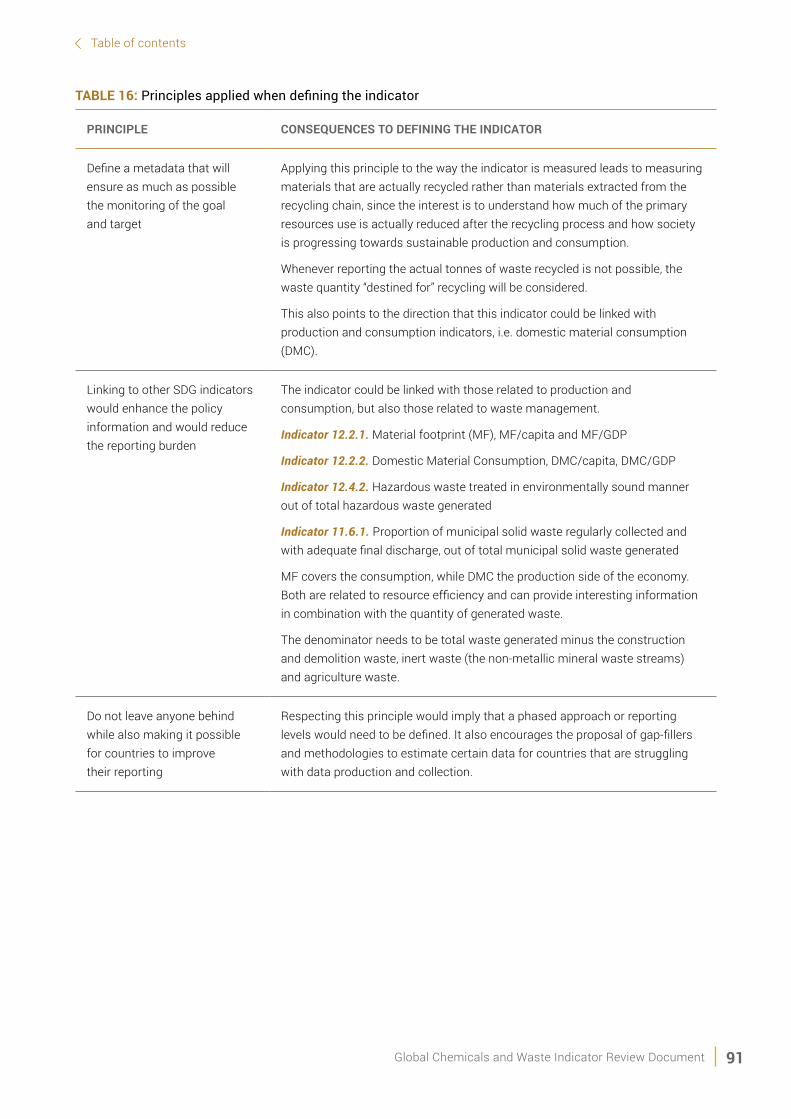
91Global Chemicals and Waste Indicator Review Document
Table of contents
TABLE 16: Principles applied when defining the indicator
PRINCIPLE CONSEQUENCES TO DEFINING THE INDICATOR
Define a metadata that will ensure as much as possible the monitoring of the goal and target
Applying this principle to the way the indicator is measured leads to measuring materials that are actually recycled rather than materials extracted from the recycling chain, since the interest is to understand how much of the primary resources use is actually reduced after the recycling process and how society is progressing towards sustainable production and consumption.
Whenever reporting the actual tonnes of waste recycled is not possible, the waste quantity “destined for” recycling will be considered.
This also points to the direction that this indicator could be linked with production and consumption indicators, i.e. domestic material consumption (DMC).
Linking to other SDG indicators would enhance the policy information and would reduce the reporting burden
The indicator could be linked with those related to production and consumption, but also those related to waste management.
Indicator 12.2.1. Material footprint (MF), MF/capita and MF/GDP
Indicator 12.2.2. Domestic Material Consumption, DMC/capita, DMC/GDP
Indicator 12.4.2. Hazardous waste treated in environmentally sound manner out of total hazardous waste generated
Indicator 11.6.1. Proportion of municipal solid waste regularly collected and with adequate final discharge, out of total municipal solid waste generated
MF covers the consumption, while DMC the production side of the economy. Both are related to resource efficiency and can provide interesting information in combination with the quantity of generated waste.
The denominator needs to be total waste generated minus the construction and demolition waste, inert waste (the non-metallic mineral waste streams) and agriculture waste.
Do not leave anyone behind while also making it possible for countries to improve their reporting
Respecting this principle would imply that a phased approach or reporting levels would need to be defined. It also encourages the proposal of gap-fillers and methodologies to estimate certain data for countries that are struggling with data production and collection.

92Global Chemicals and Waste Indicator Review Document
Table of contents
Considering the data that is already being collected,
the opportunities that current datasets provide,
the difficulties encountered and the principles to
be taken into account, it makes sense to have two
levels of precision and difficulties in reporting based
on the indicator:
• The first and easiest level will be accessible
to all countries based on data that is
already being reported and gap-fillers from
international benchmarks;
• The second level will be to gather country specific
data on all the input data needed to calculate the
indicator, as well as to disaggregate the indicator
(by sex and other socio-economic factors) and
calculate certain sub-indicators that inform
policy and decision-making better than the single
indicator does.
V.1 Limitations
The indicator is constructed in such a way as to
make it feasible for countries that have limited
data to make progress towards higher levels and
calculating more indicators as they improve their
collection capacity. Despite their limitations, data
on formal solid waste collection and management
may be available from municipal bodies and/or
private contractors. Additionally, data on informal
recycling activities may be available from NGOs and
community organizations. It is important that all data
sources are used for reporting must be validated and
cross-referenced, otherwise discrepancies are likely
to introduce inconsistencies in reported figures.
Most countries control large end-of-chain recycling
facilities and export of recyclable materials, so
data from these entities is feasible to collect. There
may be recycling carried out in the informal sector
that never enters the formal channels. In this case,
countries can estimate the size of the informal
recycling sector to properly account for all the
recycling with said country.
National recycling rate is part of measuring progress
towards sustainable consumption and production,
but it does not capture prevention, reduction, reuse
and repair. Calculating additional intensity indicators
against the DMC and the MF gives proxies and
helps connect this indicator to resource efficiency in
consumption and production. In addition, DMC and
MF cannot be disaggregated to economic sectors,
which limits the opportunity to link recycling rates to
both material flows and sectors.
Non-metallic minerals are very heavy material
streams that, if counted towards generation of
waste or recycling, may generate seriously flawed
results. Construction waste is excluded from both
generation and recycling amounts. However, non-
metallic mineral industrial waste is included in total
waste generated, data is collected based on ISIC
categories and not on type of waste.
Material Flow Accounts are part of the System
of Environmental-Economic Accounting. This
accounting system measures all the materials used in
an economy, including those extracted in the country
and those imported. There is a rather high level of
aggregation of the materials, typically reported in
the Eurostat categories of biomass, metal ores, non-
metallic minerals, fossil energy materials/carriers,
other products and waste for final treatment. At this
level of aggregation only metal ores are recyclables
as a material flow category. The limitation in this
case is related to the time lag between the time at
which the metal ores are used in production and the
time at which they enter the waste stream. Metal
ores may be used for production of flows that stay in
the economy for a short time (packaging materials)
or infrastructure that are flows that may stay up to 30
years in the economy (such as automobiles) or more.

93Global Chemicals and Waste Indicator Review Document
Table of contents
Imports and exports are linked to NACE/ISIC codes,
but for much of the recyclables, for example for
packaging a material, there is no reliable information
in the import/export statistics, as imports/exports
are recorded at customs at net weight excluding the
packaging materials.
For estimating the amount of packaging materials
put on the market, the methodology refers to the
Extended Producer Responsibility studies of the EU to
infer potentially useful statistical data and packaging
waste coefficients for trading of goods. The
information available for the latter two is scattered.
Alternative to total generated waste, waste generated
by material could have been used as denominator
for each material stream recycled. However, data on
waste generated by material is limited and is mostly
available for selected waste streams, mostly linked
to EU Directives that set the field for implementing
Extended Producer Responsibility schemes and
these are largely limited to countries in the EU. There
are reporting obligations for the generator and at all
transaction points in the recycling chain, however
data audits and surveillance reveal that these are
not systematically applied.
Additional research is needed to understand typical
losses (due to transformation of materials, loss of
humidity, percent of rejects) along the recycling chain
for various recyclable materials. The losses would
need to be known as percentages from the point of
entry in the recycling value chain (i.e. Collection of
source segregated material, or input to sorting facility)
to the point of exit (i.e. when the material leaves the
last recyclable processing unit to enter a facility as
secondary raw material). This would allow to connect
indicator 11.6.1. which will measure among other
things the municipal recycling rate, to the national
recycling rate. Municipal recycling rate is likely going
to be measured at the beginning of the chain, while
indicator 12.5.1 will likely be measured at the point
of exit from the chain. Such studies may be done
using the process flow and material mass balance
approach. Another approach could be to follow
transactions in the waste management process and
introducing so called “system of boundaries” defining
points of reporting of waste quantities.
Very little information exists on how waste escapes/
leaks from formal waste management system
(i.e. informal sector, littering, wind) and becomes
uncontrolled waste. In this regard, additional
research on pathways of leakage is necessary.

94Global Chemicals and Waste Indicator Review Document
Data assessment tool
8 Table of contents

95Global Chemicals and Waste Indicator Review Document
Table of contents
8Data assessment tool
The developed data assessment tool is an excel
model which is intended for filling in by each
reporting country (Annex III). It is designed to
include information on the overall country situation,
as well as specific data required for calculating the
indicators based on the methodology included in
the present Indicator Review Document. The aim of
this tool is to aid countries in collecting relevant data
from national/regional level authorities, identifying
data gaps and inconsistencies, sector priorities in
terms of both data production/collection as well
as waste management in general. Ultimately, the
data assessment tool is aimed to inform waste
management policy at national level. In addition, it
will facilitate national reporting on SDGs, filling in the
UNSD/UNEP Questionnaire 2020 on Environment
Statistics (waste section), aid in BRS and other
MEAs reporting.
The model includes six tabs, as follows:
• Introduction – stating the objectives of the
data assessment tool and collecting general
information on the reporting country
• Glossary of terms – providing definitions
and explanations aimed at ensuring better
understanding of the terms used in the model
and ultimately improving reported data quality
• Country information – collecting details on
national and international reporting requirements
the country needs to fulfil, it’s legislative, policy
and institutional framework, as well as the
definitions the country uses for terms such as
‘waste’ or ‘recycling’, among others.
• Gaps and challenges – aimed at capturing the
national priorities related to waste management,
as well as the existing gaps and challenges faced
by countries in terms of waste management data
generation, collection and reporting.
• Reporting status – includes a series of
information which is requested for each of
the bilateral, regional, multilateral or national
agreements/Conventions/standards or reporting
obligations the country has, as mentioned in the
‘Country information’ tab
• Data collection form – aimed at collecting actual
data to be used in calculating the waste-related
SDG indicators, with particular focus on data
needed for the calculation of indicators detailed
in the present Indicator Review Document.
Categories include waste generation, waste
collection, waste treatment and disposal, waste
recycling and waste movement data.
Countries can customize and add tabs and questions
to the tool depending on their specific needs for data
collection or policy information.

96Global Chemicals and Waste Indicator Review Document
Table of contents
References
1. UNEP. n.d. “Basel Convention on the Control of Transboundary Movements of Hazardous Wastes and Their Disposal, Texts and Annexes.” Accessed 17 December 2020. http://www.basel.int/TheConvention/Overview/TextoftheConvention/tabid/1275/Default.aspx.
2. UNEP. n.d. “Basel Convention, Glossary of Terms.” Accessed 17 December 2020. http://www.basel.int/Implementation/Publications/GuidanceManuals/tabid/2364/Default.aspx.
3. UNEP. n.d. “Basel Convention, Methodological Guide for the Development of Inventories of Hazardous Wastes and Other Wastes under the Basel Convention.” Accessed 17 December 2020. http://www.basel.int/Implementation/Publications/GuidanceManuals/tabid/2364/Default.aspx.
4. Statistical Office of the European Union. n.d. “Domestic Material Consumption by Material.” Accessed 17 December 2020. http://data.europa.eu/88u/dataset/cOwcsyDQeZZt5dKhiCmqrg.
5. Giljum, Stefan, Monika Dittrich, Mirko Lieber, and Stephan Lutter. 2014. “Global Patterns of Material Flows and Their Socio-Economic and Environmental Implications: A MFA Study on All Countries World-Wide from 1980 to 2009.” Resources 3 (1): 319–39. https://doi.org/10.3390/resources3010319.
6. Baldé, Kees, Harrie Meeuwissen, Federico Magalini, and Feng Wang. 2017. “Manual for the Use of the WEEE Calculation Tool,” no. June: 39.
7. OECD. n.d. “Municipal Waste, Countries’ Metadata.” Accessed 17 December 2020. https://stats.oecd.org/Index.aspx?DataSetCode=MUNW.
8. Statistical Office of the European Union (Eurostat). n.d. “Recycling Rates for Packaging Waste (Ten00063), Indicator Profile (ESMS).” Accessed 17 December 2020. https://ec.europa.eu/eurostat/databrowser/view/ten00063/default/table?lang=en.
9. United Nations Department of Economic and Social Affairs. n.d. “Statistics Division, SDG Indicator Metadata Repository, Different Indicator’s Metadata, 8.4.2. Domestic Material Consumption (DMC), DMC per Capita, DMC per GDP.” Accessed 15 January 2021. https://unstats.un.org/sdgs/metadata/.
10. United Nations Department of Economic and Social Affairs. 2019a. n.d. “Statistics Division, SDG Indicator Metadata Repository, Different Indicator’s Metadata, 12.3.1 (a) Food loss index and (b) food waste index.” Accessed 20 January 2021 https://unstats.un.org/sdgs/metadata/.
11. United Nations Department of Economic and Social Affairs. 2019b. n.d. “Statistics Division, SDG Indicator Metadata Repository, Different Indicator’s Metadata, Indicator 12.4.2: (a) Hazardous waste generated per capita; and (b) proportion of hazardous waste treated, by type of treatment.” Accessed 20 January 2021. https://unstats.un.org/sdgs/metadata/.
12. United Nations Department of Economic and Social Affairs. 2019c. n.d. “Statistics Division, SDG Indicator Metadata Repository, Different Indicator’s Metadata, 12.5.1: National recycling rate, tons of material recycled.” Accessed 20 January 2021. https://unstats.un.org/sdgs/metadata/.
13. United Nations Department of Economic and Social Affairs. 2020. n.d. “Statistics Division, SDG Indicator Metadata Repository, Different Indicator’s Metadata, Indicator 11.6.1: Proportion of municipal solid waste collected and managed in controlled facilities out of total municipal solid waste generated by cities.” Accessed 20 January 2021. https://unstats.un.org/sdgs/metadata/.
14. Basel Convention. n.d. “Technical Guidelines on the Sound Management of Hazardous Waste.” Accessed 17 December 2020. http://www.basel.int/Implementation/Publications/LatestTechnicalGuidelines/tabid/5875/Default.aspx#.
15. United Nations Statistics Division. n.d. “UNSD/UNEP Questionnaire on Environment Statistics (Waste and Water Sections).” Accessed 20 January 2021. https://unstats.un.org/unsd/envstats/questionnaire .

97Global Chemicals and Waste Indicator Review Document
Table of contents
16. “Waste Atlas Online Platform.” n.d. Accessed 17 December 2020. http://www.atlas.d-waste.com/ .
17. European Commission. n.d. “WEEE Calculation Tool, European Commission.” Accessed 5 August 2019. https://ec.europa.eu/environment/waste/weee/data_en.htm.
18. Kaza, Silpa, Lisa Yao, Perinaz Bhada-Tata, and Frank Van Woerden. 2018. What a Waste 2.0: A Global Snapshot of Solid Waste Management to 2050. The World Bank. https://doi.org/10.1596/978-1-4648-1329-0.
19. “Indicator 12.2.2. Domestic Material Consumption, DMC/Capita, DMS/GDP.” n.d. Accessed 20 January 2021. https://unstats.un.org/sdgs/metadata/files/Metadata-08-04-02.pdf.
20. Eurostat. 2001. “Economy-Wide Material Flow Accounts (EW-MFA) and Derived Indicators. A Methodological Guide.” 2001. https://seea.un.org/sites/seea.un.org/files/economy-wide-material-flow-accounts-methodological-guide-2001-edition.pdf .
21. European Commission, and DG Environment. 2014. “Development of Guidance on Extended Producer Responsibility (EPR), Final Report.” http://epr.eu-smr.eu/documents/BIO by Deloitte - Guidance on EPR - Final Report.pdf?attredirects=0&d=1%5Cnhttp://ec.europa.eu/environment/waste/pdf/target_review/Guidance on EPR - Final Report.pdf.
22. UNEP. 2021. Food Waste Index Report 2021. Nairobi.
23. UN-Habitat. 2010. Solid Waste Management in the World’s Cities: Water and Sanitation in the World’s Cities 2010. Solid Waste Management In the World’s Cities: Water and Sanitation in the World’s Cities. Nairobi: United Nations Human Settlements Programme.
24. EC, FAO, IMF, OECD, UN, and WB. 2012. “System of Environmental-Economic Accounting Central Framework.”
25. Ramusch, Roland, and Ulrike Lange. 2013. “Role and Size of Informal Sector in Waste Management – a Review.” Waste and Resource Management, May. https://doi.org/10.1680/warm.12.00012.
26. Commission, European. 2013. “Manual on Waste Statistics: A Handbook for Data Collection on Waste Generation and Treatment.” Eurostat Methodologies and Working Papers. https://doi.org/10.2785/51516.
27. Gentil, Emmanuel C, Leonidas Milios, and Christian Fischer. 2015. “Hazardous Waste Review in the EU-28 , Iceland , Norway , Switzerland and Turkey Generation and Treatment.” https://doi.org/10.13140/RG.2.1.1485.7363.
28. Balde, C.P., V. Forti, V. Gray, R. Kuehr, and P. Stegmann. 2017. The Global E-Waste Monitor 2017. United Nations University International Telecommunication Union International Solid Waste Association. https://doi.org/10.1016/j.proci.2014.05.148.
29. Federico, Magalini, Wang Feng, Huisman Jaco, Ruediger Kueher, Baldé Kees, van Straalen Vincent, Hestin Mathieu, Lecerf Luis, Sayman Unal, and Onur Akpulat. 2015. “Study on Collection Rates of Waste Electrical Equipment (WEEE).”
30. OECD. 2001. “Extended Producer Responsibility: A Guidance Manual for Governments.” http://www.voluntaryprinciples.org/for-governments/
31. Pipatti, Riitta, Chhemendra Sharma, Masato Yamada, Joao Wagner Silva Alves, Qingxian Gao, Sabin Guendehou, G, H, Koch Mattias, et al. 2006. “Waste Generation, Composition, and Management Data.” In 2006 IPCC Guidelines for National Greenhouse Gas Inventories, Volume 5 Waste, edited by Simon Eggleston, Leandro Buendia, Kyoko Miwa, Todd Ngara, and Tanaka Kiyoto. https://www.ipcc-nggip.iges.or.jp/public/2006gl/pdf/5_Volume5/V5_2_Ch2_Waste_Data.pdf
32. WHO. 2014. Safe Management of Wastes from Health Care Activities. 2nd ed. https://doi.org/10.1590/S0042-96862001000200013.
33. GIZ. 2011. “Recovering Resources, Creating Opportunities. Integrating the Informal Sector into Solid Waste Management.” Deutsche Gesellschaft Für …. http://scholar.google.com/scholar?hl=en&btnG=Search&q=intitle: Recovering+resources+Creating+opportunities. +Integrating+the+informal+sector+into+Solid +Waste+Ma nagment#0%5Cnhttp://scholar.google.com/ scholar?hl=en&btnG= Search&q=intitle:Recovering+Resources+Cre.

98Global Chemicals and Waste Indicator Review Document
Table of contents
34. UN-Habitat. 2021. Waste Wise Cities Tool - Step by
Step Guide to Assess a City’s MSWM Performance
through SDG indicator 11.6.1 Monitoring.
https://unhabitat.org/waste-wise-data
35. GIZ, University of Leeds, Eawag-Sandec, Wasteaware.
2020. User Manual: Waste Flow Diagram (WFD): A
rapid assessment tool for mapping waste flows and
quantifying plastic leakage. Version 1.0. Principal
Investigator: Velis C.A. Research team: Cottom J.,
Zabaleta I., Zurbruegg C., Stretz J. and Blume S.
Eschborn, Germany. http://plasticpollution.leeds.ac.uk
36. UNEP-IETC and GRID-Arendal (2019). Gender and
waste nexus: experiences from Bhutan, Mongolia
and Nepal

99Global Chemicals and Waste Indicator Review Document
Table of contents
A1Annex I: Linkages with Multilateral Environment agreements and existing reporting
A. Initiatives
I. Stockholm Convention on Persistent Organic Pollutants (POPs)
DATE OF ADOPTION: 22 MAY 2001 IN STOCKHOLM, SWEDEN
Date of entry into force: 17 May 2004
Number of signatories: 152
Number of parties: 182
Scope: POPs
The Stockholm Convention is a global treaty designed
to protect human health and the environment, leading
to gradual decrease of the presence of Persistent
Organic Pollutants (POPs) in the environment.
Each Party to this Convention is required to adopt
61 Stockholm Convention on POPs, as amended in 2009; also BRS Secretariat website:
http://chm.pops.int/TheConvention/Overview/tabid/3351/Default.aspx , accessed on January 17, 2018
and implement measures aimed at reducing or
eliminating the release of POPs into environment.61
One of the most important obligation is to develop a
plan for the implementation of a Party’s obligations
and reporting it under the Convention.

100Global Chemicals and Waste Indicator Review Document
Table of contents
The main provisions of the Stockholm Convention are:
• To prohibit and/or eliminate the production
and use; as well as the import and export
of the intentionally produced POPs listed in
Annex A62, in accordance with the provisions
of this Annex (i.e. restrictive conditions);
62 Annex A allows for the registration of specific exemptions for the production or use of listed POPs, in accordance with that Annex
and Article 4, bearing in mind that special rules apply to PCBs.
63 Basel Convention website (BRS Secretariat): http://www.basel.int/TheConvention/Overview/tabid/1271/Default.aspx, accessed on
January 18, 2018
• To restrict production and use, as well as the
import and export, of the intentionally produced
POPs listed in Annex B, in accordance with the
provisions of this Annex;
• To reduce or eliminate releases from unintentionally
produced POPs listed in Annex C,
• To ensure that stockpiles and waste consisting
of, containing or contaminated by POPs are
managed in an environmentally sound manner.
II. Basel Convention on the Control of Transboundary Movements of Hazardous Waste and their Disposal
The main objective of the Basel Convention is to
protect, by strict control, human health and the
environment against the adverse effects which
may result from the generation and management of
hazardous waste. The Basel Convention recognizes
the impacts of poor hazardous chemicals and waste
management, particularly on vulnerable groups
such as women and young children (UNEP, 2015).
Its scope of application covers a wide range of waste
defined as “hazardous waste” based on their origin
and/or composition and their characteristics, as
well as two types of waste defined as “other waste”
- household waste and incinerator ash.63
DATE OF ADOPTION: 22 MARCH 1989 IN BASEL, SWITZERLAND
Date of entry into force: 05 May 1992
Number of signatories: 53
Number of parties: 186
Scope: Hazardous waste and other waste

101Global Chemicals and Waste Indicator Review Document
Table of contents
The three pillars of the Basel Convention:
• Minimize the generation of hazardous waste in
terms of quantity and degree of hazard;
• Control/restrictions of transboundary
movements of hazardous waste and other
waste (conditions and the PIC procedure);
• Promote the environmentally sound management
of hazardous waste.
The definition of “hazardous waste” provided in the
Convention Article 1, paragraph 1:
• Waste that belongs to any category contained in
Annex I, unless they do not possess any of the
characteristics contained in Annex III.
Annex I is further elaborated in Annexes VIII and
IX that were adopted at COP-4. Waste listed in
Annex VIII are presumed to be hazardous, while
waste listed in Annex IX are presumed not to be
hazardous. Annex III contains the list of hazardous
characteristics, such as explosive, corrosive,
poisonous or flammable.
Furthermore, Parties have specific obligations
to transmit notifications of national definitions
of “hazardous wastes” that are additional to the
wastes listed in the Annexes of the Convention,
thereby expanding the scope of the Convention. The
definitions of hazardous and other wastes therefore
may differ from one country to another.
The Basel Convention does not provide a definition
of the term “treatment” but provides, in Annex IV
to the Convention, a list of operations for the final
disposal (coded D1-D15) and recovery (R1-R13) of
hazardous wastes.
Parties to the Basel Convention submit data on
transboundary movements of hazardous and
other wastes for the purpose of disposal and/or
recovery operations, listed in Annex IV, through their
national annual reports. They also provide data on
waste generation.
Under the Basel Convention, Parties are required to
submit annual national reports (by the end of the
year for the previous year), which include questions
about the generation of hazardous and other waste,
as well as imports and exports of hazardous and
other wastes destined for reuse, recycling or recovery
operations or final disposal. The Convention provides
guidance on how to calculate the generation of the
hazardous waste through the methodological guide
for the development of inventories of hazardous
waste and other waste under the Basel Convention
and other specific methodologies for developing
inventories on different types of hazardous waste.
In November 2013, the Secretariat launched the
Electronic Reporting System (ERS) of the Basel
Convention which is the tool to be used by Parties to
submit their annual national reports.
Data collected through national reports:
• Data on the yearly basis;
• Focal Point and Competent Authority
• Waste controlled for transboundary movements
• Restrictions on transboundary movements
• Control procedure
• Disposal facilities within national jurisdiction
• Recovery facilities within national jurisdiction

102Global Chemicals and Waste Indicator Review Document
Table of contents
III. Rotterdam Convention on the Prior Informed Consent Procedure for Certain Hazardous Chemicals and Pesticides in International Trade
DATE OF ADOPTION: 10 SEPTEMBER 1998 IN ROTTERDAM, NETHERLANDS
Date of entry into force: 24 February 2004
Number of signatories: 72
Number of parties: 160
Scope: Banned or severely restricted chemicals (Annex III)
The main objectives of the Convention are:
I. to promote shared responsibility and
cooperative efforts among Parties in the
international trade of certain hazardous
chemicals in order to protect human health and
the environment from potential harm;
II. to contribute to the environmentally sound use
of those hazardous chemicals, by facilitating
information exchange about their characteristics,
by providing for a national decision-making
process on their import and export and by
disseminating these decisions to Parties.
The Convention creates legally binding obligations
for the implementation of the Prior Informed Consent
(PIC) procedure.
64 BRS Secretariat (Rotterdam Convention) http://www.pic.int/TheConvention/Overview/tabid/1044/language/en-US/Default.aspx,
accessed on January 2017
Key aspects:
Annex II – Criteria for listing the banned or severely
restricted chemicals in Annex III (done by Chemical
Review Committee).
Annex III - List of Chemicals subject to the Prior
Informed Consent Procedure (PIC).
The chemicals listed in Annex III include pesticides
and industrial chemicals that have been banned
or severely restricted for health or environmental
reasons by two or more Parties and which the
Conference of the Parties has decided to subject to
the PIC procedure.
There are a total of 50 chemicals listed in Annex
III, 34 pesticides (including 3 severely hazardous
pesticide formulations), 15 industrial chemicals, and
1 chemical in both the pesticide and the industrial
chemical categories.64
103Global Chemicals and Waste Indicator Review Document
Table of contents
IV. Minamata Convention on Mercury
DATE OF ADOPTION: 10 OCTOBER 2013 IN KUMAMOTO, JAPAN
Date of entry into force: 16 August 2017
Number of signatories: 128
Number of parties: 88
Scope: Mercury
The Minamata Convention on Mercury is a global
treaty to protect human health and the environment
from the anthropogenic emissions and releases of
mercury and mercury compounds.
Major highlights of the Minamata Convention
include a ban on new mercury mines, the phase-
out of existing ones, the phase out and phase
down of mercury use in a number of products and
processes, control measures on emissions to air
and on releases to land and water, and the regulation
of the informal sector of artisanal and small-scale
gold mining. The Convention also addresses interim
storage of mercury and its disposal once it becomes
waste, sites contaminated by mercury as well as
health issues.65
65 Official website of Minamata Convention http://mercuryconvention.org/Convention/tabid/3426/language/en-US/Default.aspx,
accessed on January 2018
According to the Article 11 on Mercury Waste,
the relevant definitions of the Basel Convention
are applied to waste covered under the Minamata
Convention. Parties to this Convention that are
not Parties to the Basel Convention will use those
definitions as guidance as applied to waste covered
under this Convention.
The BRS Secretariat cooperates closely with the
Secretariat of Minamata in areas of common interest
to the Conventions, for instance, matters that are
related to mercury wastes and their environmentally
sound management, as set out in Article 11 of the
Minamata Convention.

104Global Chemicals and Waste Indicator Review Document
Table of contents
V. The Montreal Protocol on Substances that Deplete the Ozone Layer
DATE OF ADOPTION: 16 SEPTEMBER 1987 IN MONTREAL, CANADA
Date of entry into force: 01 January 1989
Number of signatories: 46
Parties that ratified: 197
Scope: Substances that deplete the ozone layer
The Montreal Protocol on Substances that Deplete
the Ozone Layer is a protocol to the Vienna
Convention for the Protection of the Ozone Layer
and was designed to reduce the production and
consumption of ozone depleting substances in
order to reduce their abundance in the atmosphere,
and thereby protect the earth’s fragile ozone layer.
The treaty is structured around several groups of
halogenated hydrocarbons that deplete stratospheric
ozone. All of the ozone depleting substances (ODSs)
controlled by the Protocol contain either chlorine or
bromine which harm the ozone layer. For each group, the
protocol foresees a timetable on which the production
of those substances must be eventually eliminated.
66 Ozone Secretariat website http://ozone.unep.org/en/handbook-montreal-protocol-substances-deplete-ozone-layer/7, accessed on
February 2018
For the purpose of this Protocol and a correct
understanding, a controlled substance means a
substance in Annex A, B, C, E or F to this Protocol,
whether existing alone or in a mixture. Production
means the amount of controlled substances
produced minus the amount destroyed by
technologies to be approved by the Parties and
minus the amount entirely used as feedstock in
the manufacture of other chemicals. The amount
recycled and reused is not to be considered as
"production". Consumption means production plus
imports minus exports of controlled substances.66
105Global Chemicals and Waste Indicator Review Document
Table of contents
VI. Strategic Approach to International Chemicals Management (SAICM)
DATE OF ADOPTION: 06 FEBRUARY 2006 IN DUBAI (ICCM 1)
Scope: 2020 goal for sound management of chemicals
The Strategic Approach to International Chemicals
Management (SAICM) is a policy framework to
promote chemical safety around the world. The
overall objective consists of achievement of the
sound management of chemicals throughout their
life cycle so that by the year 2020, chemicals are
produced and used in ways that minimize significant
adverse impacts on the environment and human
health (2020 goal agreed at the 2002 Johannesburg
World Summit on Sustainable Development).67
SAICM includes two important documents, which
are the Dubai Declaration on International Chemicals
Management, expressing high-level political
commitment to SAICM, and an Overarching Policy
Strategy which sets out its scope, needs, objectives,
financial considerations underlying principles
and approaches, and implementation and review
arrangements.
Objectives are grouped under five themes:
• Risk reduction;
• Knowledge and information;
• Governance;
• Capacity-building and technical cooperation;
• Illegal international traffic.
67 SAICM official website http://www.saicm.org/About/SAICMOverview/tabid/5522/language/en-US/Default.aspx, accessed in
February 2018
A Global Plan of Action has been developed based
on the Declaration and Strategy and inserted in
the whole SAICM document. This Plan serves as
a working tool and guidance document to support
implementation of SAICM and other relevant
international instruments and initiatives. Activities
in the plan are to be implemented, as appropriate, by
stakeholders, according to their applicability.
The Annex III of the Resolution of 2nd Session
of the International Conference on Chemicals
Management within SAICM document provides
modalities for reporting by stakeholders on progress
in implementation of the SAICM indicators. The
data is collected from stakeholders by using an
electronic data collection tool, developed by the
Secretariat. A single set of indicators is proposed for
all stakeholders: Governments, intergovernmental/
non-governmental organizations and are
structured in such a way that can take advantage
of existing reporting mechanisms and avoid
duplication with reporting to other multilateral
environmental agreements.
The table below provides the list of indicators
for reporting by stakeholders on progress in the
implementation of the SAICM. This data is collected
nationally and monitored at the regional and global

106Global Chemicals and Waste Indicator Review Document
Table of contents
levels. Each of the indicators has a clear guidance
on what is measured and what type of information
68 SAICM texts and resolutions of the International Conference on Chemicals Management, page 141 (Guidance for indicators)
69 Environmental indicator catalogue. Indicator Profiles. Eurostat metadata. http://ec.europa.eu/eurostat/web/environment/
environmental-indicator-catalogue, accessed in February 2018. The catalogue is organized according to environmental themes,
sub-themes and indicators under each sub-theme. For each indicator there are clickable links to its data and metadata.
is required. A preliminary guidance can be found in
the SAICM document.68
VII. EUROSTAT
Eurostat’s mission is to process and publish
statistical information and to provide high quality
data for Europe and to enable comparisons between
countries and regions.
Eurostat’s environmental statistics provides indicators
for each of the following topics: air emissions, waste,
water, biodiversity, hazardous substances.
In this regard, it has been developed an Environmental
Indicator Catalogue which was last updated on
May 24, 2017.69 Currently, the catalogue includes
indicators produced mainly by Eurostat and the
European Environment Agency (EEA), but also some
indicators from the Commission’s Joint Research
Centre (JRC) and other international sources.
The set of waste management indicators is based
on waste treatment data collected under Regulation
(EC) No 2150/2002 on waste statistics. The data are
adjusted for imports and exports using international
trade statistics (COMEXT data) or national data on
imports and exports of waste. The indicator set is
available for every second year starting with reference
year 2010 and covers the 28 EU Member States.
The table below provides information extracted
from Environmental Indicator Catalogue specifically
on waste and chemicals themes. Waste-related
indicators belong to the sets of Sustainable
Development Indicators (SDIs) and resource efficiency
indicators used to monitor the EU’s strategic targets
for smart, sustainable and inclusive growth.

107Global Chemicals and Waste Indicator Review Document
Table of contents
TABLE I.A.1: Waste and Chemicals themes, sub-themes and related indicators extracted from
the Environmental Indicator Catalogue
THEME SUB-THEME INDICATOR NAME (PRODUCER AND INDICATOR CODE)
Waste
e-WasteRecycling rate of e-waste (Eurostat_t2020_rt130)*
Waste electrical and electronic equipment (EEA_WST003)
Hazardous waste Generation of hazardous waste by economic activity* (Eurostat_tsdpc250)
Municipal waste
Municipal waste generation and treatment, by type of treatment method* (Eurostat_tsdpc240)*
Recycling rate of municipal waste* (Eurostat_t2020_rt120)
Packaging wasteRecovery rate of packaging waste (Eurostat_ten00062)
Recycling rate of packaging waste* (Eurostat_ten00063)
Waste excluding major mineral waste
Generation of waste excluding major mineral waste* (Eurostat_tsdpc210)
Landfill rate of waste excluding major mineral waste (Eurostat_t2020_rt110)
Waste generation and management
Waste generation (EEA_CSI041/WST004)
Generation of waste by economic activity (Eurostat_ten00106)
Generation of waste by waste category (Eurostat_ten00018)
Large combustion plants operating in Europe (EEA_INDP001)
Management of waste excluding major mineral waste, by waste operations - pilot project data (Eurostat_env_wasoper)
Waste recycling (EEA_CSI052/WST005)
ChemicalsEnvironmentally harmful or toxic substances
Production of toxic chemicals, by toxicity class (Eurostat_tsdph320)

108Global Chemicals and Waste Indicator Review Document
Table of contents
Short descriptions of the above-mentioned indicators marked with asterisk (*)70
• Recycling rate of e-waste (Eurostat_t2020_
rt130): It presents the “collection rate” multiplied
by the “reuse and recycling rate”. This indicator
considers the entire chain from put on the
market, collection and treatment.The “collection
rate” equals the volumes collected of E-WASTE
in the reference year divided by the average sum
of EEE (electrical and electronic equipment)
put on the market in the previous three years.
The “reuse and recycling rate” is calculated by
dividing the weight of the E-WASTE that enters
the recycling/preparing for re-use facility by the
weight of total treatment of E-WASTE.
• Generation of hazardous waste by economic
activity (Eurostat_tsdpc250): It presents the
amount of hazardous waste generated in the
EU-28 and per Member State, expressed in
kg per capita and year. The indicator covers
hazardous waste from all economic sectors (all
NACE activities) and from households, including
waste from waste treatment (secondary waste).
The indicator covers all waste that is classified
as hazardous according to the definition of the
Waste Framework Directive (Directive 2008/98/
EC) and, accordingly, excludes radioactive waste.
• Municipal waste generation and treatment, by
type of treatment method (Eurostat_tsdpc240)71:
Municipal waste consists to a large extent of
waste generated by households, but may also
include similar wastes generated by small
70 Descriptions from the Environmental Indicator Catalogue. Indicator Profiles. Eurostat metadata. Also,
http://ec.europa.eu/eurostat/web/waste/indicators, accessed in March 2018
71 For a detailed description of the methodology, refer to the Manual on waste statistics-A handbook for data collection on waste
generation and treatment – 2013 edition, http://ec.europa.eu/eurostat/web/products-manuals-and-guidelines/-/KS-RA-13-015
businesses and public institutions and collected
by the municipality; this part of municipal waste
may vary from municipality to municipality
and from country to country, depending on the
local waste management system. For areas not
covered by a municipal waste collection scheme
the amount of waste generated is estimated.
This indicator consists of a set of three indicators:
municipal waste generated, municipal
treatment and municipal waste treatment by
type of treatment method:
- Recycling (including composting);
- Incineration D10 (including energy recovery R1);
- Landfilling.
The amounts are expressed in kilograms per
capita. The annual amount of waste is divided by
the average population of the relevant year. The
amount of municipal waste generated consists
of waste collected by or on behalf of municipal
authorities and disposed of through the waste
management system. For areas not covered by a
municipal waste collection scheme the amount
of waste generated is estimated.
Coverage: The data do not include waste from
agriculture, from industries, from the municipal
sewage network and treatment, as well as
municipal construction and demolition waste.
The data on waste treatment usually report
the first treatment step, which possibly follows
pre-treatment activities (like sorting, drying).
These are not reported.

109Global Chemicals and Waste Indicator Review Document
Table of contents
Data on municipal waste are collected via the
Eurostat/OECD Joint Questionnaire.
• Recycling rate of municipal waste (Eurostat_t2020_
rt120): The recycling rate, expressed in percentage,
means the total quantity of recycled municipal
waste divided by the total quantity of generated
municipal waste. It includes material recycling,
composting and anaerobic digestion. The Member
states report each year the amount recycled and
the total municipal waste generated to Eurostat.
• Recycling rate of packaging waste (Eurostat_
ten00063): “Recycling rate” (in percentage) means
the total quantity of recycled packaging waste,
divided by the total quantity of generated packaging
waste per year. The packaging and packaging
waste data are broken down by material.
All packaging waste are covered, whether it is
used or released at industrial, commercial, office,
shop, service, household or any other level,
regardless of the material used.
The statistical units are households and all
economic activities in accordance to NACE Rev 2
that generate or treat waste.
Note: Packaging waste generated in another
Member State or outside the Community which
is sent for recycling to a Member State is not
counted as recycled in the Member State to which
this packaging waste was sent. Member States
are transmitting data and methodology report by
filling in web forms through eDAMIS platform.
• Generation of waste excluding major mineral
waste (Eurostat_tsdpc210): The indicator
presents the amount of waste, excluding major
mineral wastes, generated in the EU 28, expressed
in kg per inhabitant and year. The indicator allows
to monitor waste generation over time for the EU
as a whole and to compare the development of
waste generation across countries.
The indicator covers hazardous and non-
hazardous waste from all economic sectors and
from households, including waste from waste
treatment (secondary waste) but excluding most
mineral waste.
The indicator is based on data compiled
according to the waste categories listed in
Annex I to the Waste Statistics Regulation
(Regulation 2150/2002/EC). The indicator covers
all wastes except the following waste categories:
- Mineral wastes
- Soils
- Dredging spoils
VIII. Food Loss and Waste Accounting and Reporting Standard
The international Food Loss and Waste Accounting
and Reporting Standard (FLWS, ibid) was developed
in 2016 to provide consistency in reporting data
using a common set of requirements. It requires
describing the quantification method used and does
not require use of a specific quantification method. It
is broad enough to allow for reporting by individuals
or by countries.
The stepwise approach described above goes
beyond the intention of the FLWS by specifying types
of methods appropriate for each level of reporting

110Global Chemicals and Waste Indicator Review Document
Table of contents
at a national level and is broadly compatible with
the FLWS in other regards. The influence of the
FLWS can be seen in the terms and diagrams used
in this document.
The reporting framework requires five types
of information:
1. Level of quantification approach
2. Quantification method(s) type chosen
3. Scope of the data produced
4. Quantity of food waste in the appropriate unit
for the Level of approach
5. Metadata: Size of the survey sample and other
metadata on how data was collected
The information reported under the method used
and scope of the data produced will vary depending
on the Level used. A reporting template will be
developed to enable countries to submit the required
information to UNEP and will be compatible with the
requirements of the FLWS.
IX. UNSD
UNDS collects significant amounts of data related,
inter-alia, to the SDG indicators. Countries submit
national data through filling out a questionnaire.
The Questionnaire on Environment Statistics is
part of the biennial UNSD data collection from all
countries except those that are covered by the Joint
OECD/Eurostat Questionnaire.
The UNSD Questionnaire 2004 on Environment
Statistics contains tables under the headings Water,
Air, Waste and Land. The UNSD Questionnaire 2006
onwards contain tables under the headings Water
and Waste.
UNSD/UNEP Questionnaire 2020 on Environment
Statistics (waste section) contains 7 tables in which
countries are to fill in data for each year. The tables
refer to:
• Table R1 – Generation of Waste by Source. The
following categories of sources are included:
- Agriculture, forestry and fishing (ISIC 01-03)
- Mining and quarrying (ISIC 05-09)
- Manufacturing (ISIC 10-33)
- Electricity, gas, steam and air conditioning
supply (ISIC 35)
- Construction (ISIC 41-43)
- Other economic activities excluding ISIC 38
(ISIC 38 = waste collection, treatment and
disposal activities; materials recovery)
- Household
• Table R2 – Management of hazardous waste.
The following data are included in this table:
- a) Stock of hazardous waste at the beginning
of the year
- b) Hazardous waste generated during the year
- c) Hazardous waste imported during the year
- d) Hazardous waste exported during the year
- e) Hazardous waste treated or disposed of
during the year (include recycling, incineration
– total and incineration with energy recovery,
landfilling and other – to be specified by
reporting country)
- Stock of hazardous waste at the end of the
year = a) + b) + c) – d) – e)

111Global Chemicals and Waste Indicator Review Document
Table of contents
• Tables R3 to R5 focus on municipal solid waste:
- R3: Management of municipal waste (collected
from households and other origins, imported/
exported for treatment/disposal, amounts
going to recycling, composting, incineration
total and with energy recovery, landfilling
total and controlled landfilling, other (to be
specified), and population served by collection
services (total, urban and rural))
- R4: Composition of municipal waste in %:
paper, textiles, plastics, glass, metals, other
inorganic, organic total and food and garden
waste fraction of the organic
- R5: Management of municipal waste - city
data (population, % of population served by
collection services, amounts collected from
households/other origins, amounts going to
recycling, composting, incineration total and
with energy recovery, landfilling total and
controlled landfilling, other (to be specified))
• Table R6 focuses on electronic waste: The table
includes variables on the total e-waste generated
and the total e-waste collected. It also includes:
72 UNECE website, https://www.unece.org/env/europe/monitoring/waste_en.html, accessed January 2018.
- Amounts generated of: Large equipment;
Screens, monitors, and equipment containing
screens; Temperature exchange equipment
(cooling and freezing equipment); Small
E-waste; Small e-waste (of which: lamps);
Small e-waste (of which: small equipment);
Small e-waste (of which: small IT and
telecommunication equipment); and
- Amounts collected of: Large equipment;
Screens, monitors, and equipment containing
screens; Temperature exchange equipment
(cooling and freezing equipment); Small
E-waste; Small e-waste (of which: lamps);
Small e-waste (of which: small equipment);
Small e-waste (of which: small IT and
telecommunication equipment).
• Table R7: Supplementary information sheet:
- This sheet includes national definitions for
waste, hazardous waste, municipal waste or
other complementary information on waste
which could be of help in interpreting the data.
X. UNECE
UNECE acknowledges on their website72 that “data
on the generation, use, disposal and environmental
effects of wastes are unreliable in many countries of
Eastern Europe, the Caucasus and Central Asia and
do not meet priority demands.
Some important waste streams are not properly
monitored. Inventories are lacking in several
countries of waste of high potential hazard, which
were and continue to be dumped on landfill sites,
especially in rural areas. Data quality is often
uncertain; data collected is often incomplete; little
work has been done to analyse or synthesize data
for policy development and assessment through
appropriate indicators.”

112Global Chemicals and Waste Indicator Review Document
Table of contents
XI. United Nations University-Vie-SCYCLE
The United Nations University-Vice rectorate in Europe,
Team sustainable cycles (UNU-ViE-SCYCLE) has its
mission to promote sustainable societies, with a prime
focus on the development of sustainable production,
consumption and disposal patterns for electrical and
electronic equipment and other ubiquitous goods.
The UNU supported the European Union in the recast
of the WEEE-Directive, and the calculation of the
statistical targets and the development of statistical
tools for the EU Member States.
The SCYCLE team leads the taskforce on e-waste
statistics from the Partnership for Measuring
ICT for development. Under this Partnership,
global guidelines on e-waste statistics have been
developed, undergone public consultation, and were
published. In 2017, SCYCLE formed the e-waste
statistics Partnership together with International
Telecommunication Unit (ITU) and International
Solid Waste Association (ISWA). This Partnership
has published the Global E-waste Monitor 2017
to increase awareness and draw attention to the
growing issue of electronic waste and e-waste
statistics. The objectives of the Global E-waste
Statistics Partnership are to collect data, perform
capacity building, and communicate the e-waste
data to policy makers, researchers and the general
public. The Global E-waste Statistics Partnership
hosts the global database on e-waste, and which is
expected to go live in the end of 2018.
Data compiled in the UNU statistics
database includes:
• EEE Put on the market and E-waste
generated estimates
- Totals
• 177 countries in the world
• Time series: 1995-2016
- Disaggregated to 6 e-waste categories EU →
public. Rest of the world (internal dataset, but
can be disclosed in the future)
• 178 countries in the world
• Time series: 1995-2016
• E-waste collected and recycled
- 47 countries
• National E-waste legislation in countries
- 67 countries in the world
- Time series: 2014-2017
• Statistics on E-waste imports and exports are
currently being assess based on estimates
based on Basel Convention
The method that UNU developed to estimate e-waste
flows is programmed together with Statistics
Netherlands. It can be expanded to other materials
to estimate other waste flows based on domestic
production, import/export statistics and lifespans.
XII. OECD
Municipal waste is defined as waste collected and
treated by or for municipalities. It covers waste
from households, including bulky waste, similar
waste from commerce and trade, office buildings,
institutions and small businesses, as well as yard
and garden waste, street sweepings, the contents

113Global Chemicals and Waste Indicator Review Document
Table of contents
of litter containers, and market cleansing waste if
managed as household waste.
The definition excludes waste from municipal
sewage networks and treatment, as well as waste
from construction and demolition activities. This
indicator is measured in thousand tonnes and in
kilograms per capita.73
Generated Municipal Waste data has been collected
from 36 Countries, since 1975, with variations
across the number of countries reporting each year:
• Europe: Austria, Belgium, Czech Republic,
Denmark, Estonia, Finland, France, Germany,
Greece, Hungary, Iceland, Ireland, Italy, Latvia,
Luxembourg, Netherlands, Norway, Poland,
Portugal, Slovak Republic, Slovenia, Spain,
Sweden, Switzerland, Turkey, United Kingdom
• Asia, Australia& Oceania: Australia, Israel,
Japan, Korea, New Zealand, Russia,
• Americas: Chile, Colombia, Costa Rica, Mexico,
United States
Non-OECD economies reporting data on municipal
waste generated, up to 2012 included Brazil, China,
Indonesia and Russia.
Data compiled in the OECD statistics
database includes74:
• Generation of waste by sector
This dataset presents waste produced by the
various sectors of economic activity (agriculture,
mining and quarrying, manufacturing industry,
energy production, water purification and
distribution, construction, etc.). The disaggregation
73 OECD Data https://data.oecd.org/waste/municipal-waste.htm, accessed in February 2018
74 OECD Stat http://stats.oecd.org/Index.aspx?DataSetCode=AIR_GHG#, accessed in February 2018
of waste by sector follows the major divisions of
International Standard Industrial Classification
(ISIC) revision 4.
• Municipal waste generated
- By origin (from households/other);
- By type of waste (household and similar
waste; bulky waste; electric and electronic
equipment waste).
• Municipal waste treated
- Amount designated for recovery operations
(recycling, composting, incineration with
energy recovery, other recovery);
- Disposal operations (incineration without
energy recovery, landfill, other disposal);
- Total incineration.
• Municipal waste generated per capita
Total treatment (%)
- % material recovery = recycling + composting;
- % recycling;
- % incineration with and without energy
recovery respectively;
- % incineration;
- % landfill.
This dataset shows data provided by Member
countries’ authorities through the joint OECD/
Eurostat questionnaire on the state of
the environment.
The most consistent data is generally reported
by high income countries. Reports often include
incomplete data or breaks in reporting, estimated
values or national estimates. The data is usually
collected directly or indirectly from countries’ official

114Global Chemicals and Waste Indicator Review Document
Table of contents
statistics producers via questionnaires, web queries,
online platforms and/or via SDMX.
These activities are also often carried out in
association with other international organisations
(e.g. Eurostat, UNSD, etc.). Over the long term, the
75 System of Environmental-Economic Accounting Central Framework. Edited by the EC, FAO, IMF, OECD, UN, WB, 2012
76 Material flow accounting includes the recording of physical flows of products, air emissions, solid waste and other residual flows
OECD strategy is to collect data and metadata via
SDMX as the most efficient and effective solution
for countries, not only in their dealings with the
OECD but also for responding to demands of other
international organisations and exchanging data
with major users.
XIII. System of Environmental-Economic Accounts: Waste Flow Accounts and Material Flow Accounts
The System of Environmental-Economic Accounting
(SEEA) Central Framework75 was reviewed to
understand the point of potential connection to
indicator 12.5.1 National Recycling Rate. The use
of the SEEA framework allows robust indicators to
be established for the consumption of resources
relative to economic indicators such as output and
value added, since there is a parallel in the underlying
accounting principles.
Among the different subsystems developed within
the broad supply and use of Central Framework, two
key aspects were of interest related to the Physical
flow accounts, namely:
• Waste Flow Account (WFA)
• Material Flow Accounts (MFA)76
However, in all subsystems, the scope of physical
flow accounting includes flows from the environment
to the economy, flows within the economy and flows
back to the environment – three key flows: natural
inputs, products and residuals.
• Waste Flow Account
Waste Flow Account is an accounting based on
statistical data on generated, recycled, incinerated,
otherwise treated and disposed waste amounts based
on waste statistics. The types of solid waste are based
on the European Waste Catalogue – Statistical Version.
As these accounts are built based on already
collected waste statistics, using the same data
and presenting these in a different way, namely in
the Physical Supply and Use Tables that are a basic
approach in the SEEA, available database on waste
accounts is not of particular use for the National
Recycling Rate indicator 12.5.1.
Definitions are given in SEEA central framework for
solid waste and also hazardous waste and low-level
radioactive waste as a fractions of solid waste. The
following solid waste streams are acknowledged:
• Chemical and healthcare waste
• Radioactive waste
• Metallic waste
• Non-metallic recyclables
• Discarded equipment and vehicles
• Animal and vegetal wastes
115Global Chemicals and Waste Indicator Review Document
Table of contents
• Combustion wastes
• Other wastes
Example on waste accounting from Denmark77:
Waste accounts record how much waste is generated
in different parts of the economy, what kind of waste
it is and how it is treated. Imports and exports of
waste are also covered. Waste accounts measure
the amounts of generated waste distributed to 117
industry groups. The industry groups are the same
as in the Danish National Accounts. These are based
on the national version of NACE rev. 2, with a limited
number of deviations. Within the industry groups,
waste is distributed according to categories and
forms of treatment. Imports and exports of waste
are distributed according to form of treatment and
waste category.
The purpose of the Economy-Wide Material Flow
Accounts (EW-MFA)78 is to provide an aggregate
overview in tonnes, of the material inputs and
outputs of an economy including inputs from the
environment, outputs to the environment, and the
physical amounts of imports and exports.
This is the basis from which a variety of material
flow based indicators can be derived. Indicators that
are grouped into input, consumption and output.
The document refers to two main sources on more
detailed information on MFA in relevant Eurostat
and OECD publications.
Flows not statistically captured, according to the
EW-MFA, includes packaging waste. Some material
flows are not statistically observed. Indirect flows
associated to imports or exports are generally
not available from official sources and must be
77 Denmark Statistics, Documentation of statistics for Waste Accounts for 2013 to 2015.
78 Economy-wide material flow accounts (EW-MFA) and derived indicators. A methodological guide. Eurostat 2001
estimated. For imports and exports the packaging
materials are often not recorded by foreign trade
statistics. For domestic extraction, all materials
are counted as direct material inputs (DMI) that
have an economic use (including own use) but not
all of these materials are actually marketed and
appear in official statistics. The main categories
of flows usually not captured by data sources are
presented below.
Regarding the imports, recorded is the mass of
commodities that cross the economy’s border.
The basis of the accounting of imports and
exports is the official foreign trade statistics which
gives data in monetary as well as physical units.
Foreign trade statistics reports the net weight
of traded commodities, excluding the weight of
packaging materials.
In the European Council and Commission Regulations
on intra-EU trade statistics (Intrastat) the net weight
is defined as ‘the actual mass of the good in kilograms
excluding all packaging’. In practice, finished products
may be recorded as they are sold in the shop. In the
case of marmalade, for example, this would include
the weight of the glass jars. Possible sources of data
on packaging materials are the studies and analyses
undertaken in Member States to fulfil the reporting
obligations of the EU Packaging Directive.
Packaging coefficients for imports and exports is a
tool useful for accounting.
The classification of materials used in EW-MFA and
for which domestic material consumption (DMC)
is calculated is a Eurostat based system. EW-MFA
includes the material categories:
116Global Chemicals and Waste Indicator Review Document
Table of contents
• Biomass;
• Metal ores;
• Non-metallic minerals;
• Fossil energy materials/carriers;
• Other products;
• Waste for final treatment and disposal.
It is important to note that the term "consumption"
as used in DMC denotes apparent consumption
and not final consumption. DMC does not include
upstream hidden flows related to imports and
exports of raw materials and products.
XIV. World Bank - What A Waste
“What a Waste” (WaW) publication is a global review
of Solid Waste Management produced by the World
Bank’s Urban Development and Local Government
Unit of the Sustainable Development Network.
The first publication was released in 1999 and the
second WaW report was published in 2012 with
the objective to provide the status of today’s global
solid waste management practices: municipal solid
waste generation, composition, collection data and
disposal methods by city, by country and by region.
It compiles solid waste management data from
various sources and publications and examines the
data to provide meaningful trends and assessments
for policy makers and researches.
Both developing and developed countries were
included. Also, the 2012 report makes projections
on MSW generation and composition on a country
and regional level for 2025, based on expected
population and economic growth rates.
Although WaW reports are intended to present a
broad global review, it provides decision makers
with a sufficient foundation for waste management
policy decisions.
Both WaW publications (1999 and 2012) are primarily
focused on municipal solid waste, as defined, it
encompasses residential, industrial, commercial,
institutional, municipal and construction and
demolition (C&D) waste. The report provides the
types of generated solid waste according to sources,
including also the hazardous waste (e.g. paints,
aerosols, gas tanks, waste containing mercury,
motor oil, cleaning agents, sharps, instruments,
chemicals, pesticides).
• Regarding municipal waste generation data
The waste generation data are presented in
the report mostly as per capita (kg/capita/
day) and total (tonnes/day). MSW generation
data provided in the report were collected from
official government publications, reports by
international agencies, articles in peer-reviewed
journals (i.e. data for high-income countries
are from OECD publications; countries in Latin
America and the Caribbean from PAHO studies;
and some Middle Eastern countries from METAP
data; other important sources used: UNSD,
USAID, EEA, UNE, etc.).
In cases where only per capita waste generation
rates were available, the total urban population
for that year (World Bank, World Development
Indicators) was used to calculate the total urban
MSW generation.
• Regarding municipal waste disposal data
The waste disposal data sets, used in the report, are

117Global Chemicals and Waste Indicator Review Document
Table of contents
generally available as percentages of the various
waste disposal options, commonly divided into the
following categories: dumps, landfills, compost,
recycled, incineration, anaerobic digestion, other.
Each waste disposal category was calculated using
waste generation figures for the individual country.
In low- and middle-income countries, MSW is
often dumped in low-lying areas and land adjacent
to slums. Lack of enforced regulations enables
hazardous waste to be mixed with MSW, which
is harmful to human health and the environment.
79 https://openknowledge.worldbank.org/handle/10986/30317, accessed in October 2018
80 The Waste Atlas http://www.atlas.d-waste.com/, accessed in March 2018
The next WaW publication – A Global Snapshot
of Solid Waste Management to 2050 (published
on 20 September 2018)79 foresee the inclusion of
data regarding the total weight of hazardous waste
(tonnes per year) within special waste amounts
category, generated at country level. The publication
defines municipal solid waste as residential,
commercial and institutional waste. Industrial,
medical, hazardous, electronic, construction and
demolition waste are reported separately from total
national waste generation to the extent possible.
XV. Waste Atlas
The Waste Atlas80 was developed as a non-
commercial initiative involving D-Waste consultants,
the University of Leeds, the International Solid Waste
Association, GIZ/SWEEP-Net, the Waste to Energy
Research Council (WTERT) and the Solid Waste
Network of Asian and Pacific Islands.
The Atlas is a web access map that visualizes
municipal solid waste management data from all
over the world. It aims to provide free and easy
access to waste management data and relevant
documents for comparison and benchmarking
purposes between countries, cities and waste
management systems.
Waste Atlas already includes data for: 164 countries,
1799 cities, 1626 sanitary landfills, 93 dumpsites,
130 Mechanical Biological Treatment units (MBT), 78
Biological Treatment, 716 Waste-to-Energy plants.
The second heading “Visualizations” within the
platform provides options to choose one of the
indicators in order to visualize data on the map as
per selected country. The indicators are:
• Collection coverage (%) – the amount of MSW
collected as a proportion of total MSW generated;
• Environmental stress (ton of MSW/km2) - the
amount of the municipal solid waste generated
in a country divided by country's area, expressed
in tonnes/km2.
• Organic, paper, plastic (%) – the percentage in
the country’s waste composition;
• Recycling rate (%) – the amount of MSW recycled
as a proportion of total MSW generated;
• Unsound disposal (%) – the percentage of total
MSW generated that is disposed or burnt in
controlled and uncontrolled dumpsites;
• Waste generation per capita (kg/yr.) – the average
amount of MSW generated annually per person;
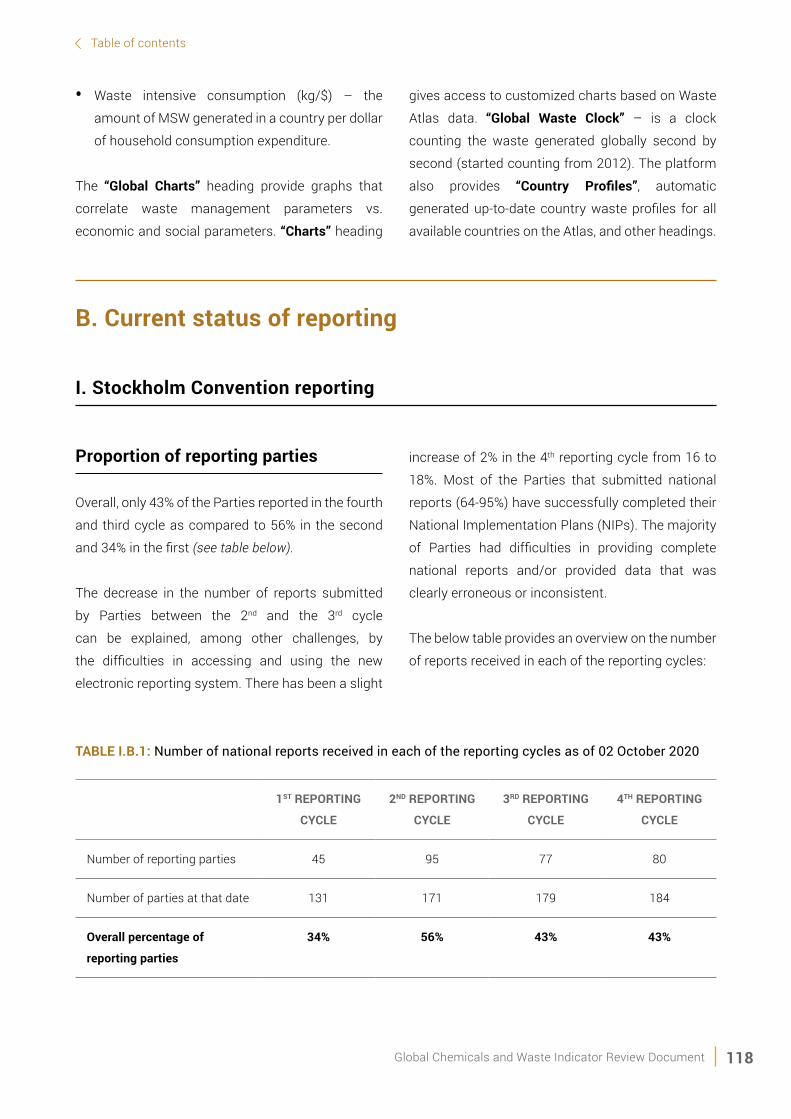
118Global Chemicals and Waste Indicator Review Document
Table of contents
• Waste intensive consumption (kg/$) – the
amount of MSW generated in a country per dollar
of household consumption expenditure.
The “Global Charts” heading provide graphs that
correlate waste management parameters vs.
economic and social parameters. “Charts” heading
gives access to customized charts based on Waste
Atlas data. “Global Waste Clock” – is a clock
counting the waste generated globally second by
second (started counting from 2012). The platform
also provides “Country Profiles”, automatic
generated up-to-date country waste profiles for all
available countries on the Atlas, and other headings.
B. Current status of reporting
I. Stockholm Convention reporting
Proportion of reporting parties
Overall, only 43% of the Parties reported in the fourth
and third cycle as compared to 56% in the second
and 34% in the first (see table below).
The decrease in the number of reports submitted
by Parties between the 2nd and the 3rd cycle
can be explained, among other challenges, by
the difficulties in accessing and using the new
electronic reporting system. There has been a slight
increase of 2% in the 4th reporting cycle from 16 to
18%. Most of the Parties that submitted national
reports (64-95%) have successfully completed their
National Implementation Plans (NIPs). The majority
of Parties had difficulties in providing complete
national reports and/or provided data that was
clearly erroneous or inconsistent.
The below table provides an overview on the number
of reports received in each of the reporting cycles:
TABLE I.B.1: Number of national reports received in each of the reporting cycles as of 02 October 2020
1ST REPORTING
CYCLE
2ND REPORTING
CYCLE
3RD REPORTING
CYCLE
4TH REPORTING
CYCLE
Number of reporting parties 45 95 77 80
Number of parties at that date 131 171 179 184
Overall percentage of
reporting parties
34% 56% 43% 43%

119Global Chemicals and Waste Indicator Review Document
Table of contents
The total number of parties who submitted NIPs
before the deadlines of the first, second and third
national reporting cycles were: 59, 136, and 159,
respectively. Those who submitted first, second
and third national reports, had submitted NIPs at a
high rate i.e. 64%, 92% and 95%, respectively. This
indicates that majority of the Parties that submitted
national reports have successfully completed
their NIPs. Further, of the 38 parties that have not
designated NFPs, 17 have never reported in any of
the reporting cycles.
81 UNEP/POPS/COP.8/INF/40 Report on the effectiveness evaluation of the Stockholm Convention 2016, page 140
82 Note | A Methodological guide for the development of inventories of hazardous waste under the Basel Convention has been
developed in order to provide guidance to the Competent Authorities and other stakeholders on the methods of developing national
inventories for the preparation of the annual national reports.
83 BRS Secretariat website (Basel Convention) http://www.basel.int/Countries/NationalReporting/NationalReports/BC2018Reports/
tabid/8202/Default.aspx , accessed on October 2020
Proportion of parties indicating that information
is not available for specific questions
The majority of parties have difficulties in providing
complete reports, either by stating that information
is not available to specific questions or not answering
at all to certain questions.
As highlighted in sections II.B.1, II.B.2 and II.B.3 above,
in addition to the completion of the report, the quality
of the data is as important (e.g. inconsistencies
among import and export data, gross errors that
lead to evident outliers, reported data clearly not
matching units). The lack of a validation step of
reported data seems a major shortcoming.81
II. Basel Convention reporting
The Conference of the Parties has noted that the
level of reporting appears to be declining and that
lower levels of reporting occur in relation to data on
the generation of hazardous and other wastes.
The problem of non-reporting, incomplete reporting
or late reporting, has been acknowledged by the
Conference of the Parties as being all the more
serious because of the close link between the core
obligations of the Convention and the obligation
to submit national reports in accordance with
paragraph 3 of Article 13 of the Convention. Among
the difficulties encountered by parties in submitting
information is the lack of availability of data and
information (e.g. lack of inventory).82
Data on the generation of hazardous waste has been
collected by the BRS Secretariat, however, the revised
reporting format to be used as of 2016 provides that
submission of data on waste generation is optional,
which may reduce the number of submissions for
this question.
The table below shows the ratio between the
number of Parties to the Basel Convention in each
of the UN geographical region and the number of
Parties which transmitted their national reports
within each of these regions.83 The European Union
is not considered in these numbers.
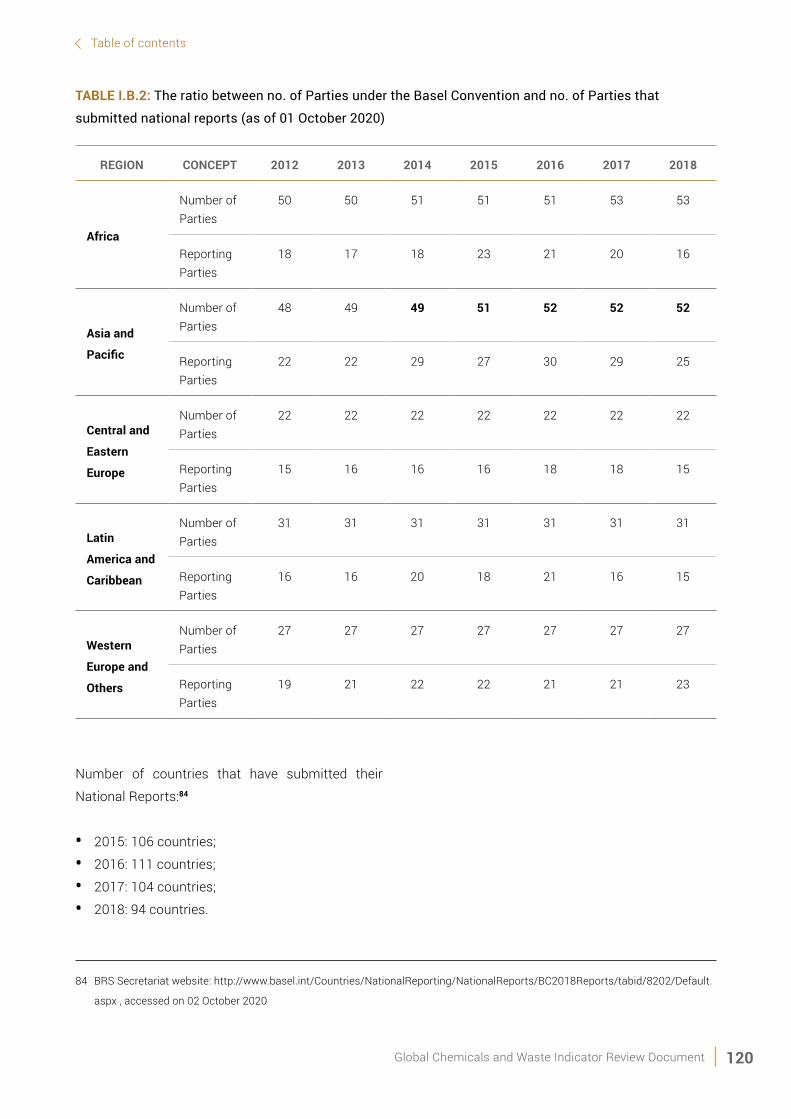
120Global Chemicals and Waste Indicator Review Document
Table of contents
TABLE I.B.2: The ratio between no. of Parties under the Basel Convention and no. of Parties that
submitted national reports (as of 01 October 2020)
REGION CONCEPT 2012 2013 2014 2015 2016 2017 2018
Africa
Number of Parties
50 50 51 51 51 53 53
Reporting Parties
18 17 18 23 21 20 16
Asia and
Pacific
Number of Parties
48 49 49 51 52 52 52
Reporting Parties
22 22 29 27 30 29 25
Central and
Eastern
Europe
Number of Parties
22 22 22 22 22 22 22
Reporting Parties
15 16 16 16 18 18 15
Latin
America and
Caribbean
Number of Parties
31 31 31 31 31 31 31
Reporting Parties
16 16 20 18 21 16 15
Western
Europe and
Others
Number of Parties
27 27 27 27 27 27 27
Reporting Parties
19 21 22 22 21 21 23
Number of countries that have submitted their
National Reports:84
• 2015: 106 countries;
• 2016: 111 countries;
• 2017: 104 countries;
• 2018: 94 countries.
84 BRS Secretariat website: http://www.basel.int/Countries/NationalReporting/NationalReports/BC2018Reports/tabid/8202/Default.
aspx , accessed on 02 October 2020

121Global Chemicals and Waste Indicator Review Document
2012 2014 20162013 2015 2017 2018
51% 58% 61%51% 58% 56% 51%
Table of contents
The below figure provides an overview on the
reporting rates under the Basel Convention for
2012-2018 period.85
85 BRS Secretariat (Juliette Voinov Kohler, Policy and Legal Advisor). Presentation on Basel Convention.
86 Results of the survey available online (version of 15 January 2018) http://www.pic.int/Implementation/
EnhancingtheeffectivenessofRC/Onlinesurvey/tabid/6215/language/en-US/Default.aspx, accessed on January 2018
III. Rotterdam Convention reporting
According to the BRS Secretariat, national reporting
under the Basel and Stockholm Conventions was
one of the areas recommended by the Joint Working
Group on enhancing cooperation and coordination
among the Conventions.
The Rotterdam Convention does not foresee the
obligation of national reporting. Nevertheless,
Parties are discussing efforts and proposals
to enhance the effectiveness of the Rotterdam
Convention, including the process for listing
chemicals in Annex III to the Convention.
If the effectiveness evaluation of the Basel and
Stockholm Conventions is primarily based on reports
submitted by each Party, in case of Rotterdam
Convention the basis of the effectiveness evaluation
or the attempt to improve the effectiveness, consists
of information provided by Parties on priority actions
to enhance the effectiveness and key information
gaps related to such actions.
For this purpose, an online survey was developed
and available (in 2017) to gather this information.
The results of the survey86 have been compiled by
Figure I.B.1: Reporting rates for 2012-2018

122Global Chemicals and Waste Indicator Review Document
Table of contents
the Secretariat. Therefore, the Secretariat prepared
a report87 analysing the legal and operational
implications of the priority actions received through
87 Report available online http://www.pic.int/Implementation/EnhancingtheeffectivenessoftheConvention/Reportonpriorityactions/
tabid/6234/language/en-US/Default.aspx, accessed on January 2018
88 SAICM official website http://www.saicm.org/Implementation/Reporting/tabid/5462/language/en-US/Default.aspx, accessed in
February 2018
the online survey. This report forms the basis of a set
of prioritized recommendations and further steps
for enhancing the effectiveness of the Convention.
IV. Minamata Convention reporting
According to the Article 22 of the Convention, the
effectiveness evaluation based on monitoring
reports, national reports submitted, etc. shall begin
no later than six years after the date of entry into
force of the Convention (16 August 2017).
In MC-1/8 on the Timing and format of reporting
by the Parties, the Conference of the Parties at its
first meeting (2017) agreed on the full format of
reporting and decided that each Party shall report
every four years using the full format and report
every two years on four questions marked by an
asterisk in the full format.
The Conference of the Parties further decided on the
following timing with regards to the short and full
reporting:
• Deadline for the first biennial short report:
31 December 2019
• Deadline for the first full report:
31 December 2021
V. SAICM reporting
The Policy Strategy within SAICM, in paragraph
24, foresees that the International Conference on
Chemicals Management (ICCM) will undertake
periodic reviews of SAICM. In this regard, it will
receive reports from all relevant stakeholders on
progress in SAICM implementation.
So far, the SAICM Secretariat developed a baseline
report 2006-2008 and 3 progress reports88: first
progress report (2009-2010), second progress report
(2011-2013) and third progress report (2014-2016).
All SAICM stakeholders were invited to complete
the online survey for the third progress report
(2014-2016 reporting period) by 31 March 2018.
The third meeting of the Open-ended Working
Group requested the secretariat to develop a simple
progress report for the period 2017–2019 and
invited all the stakeholder groups to submit their
progress reports to the International Conference
on Chemical Management at its fifth session by
28 February 2020.
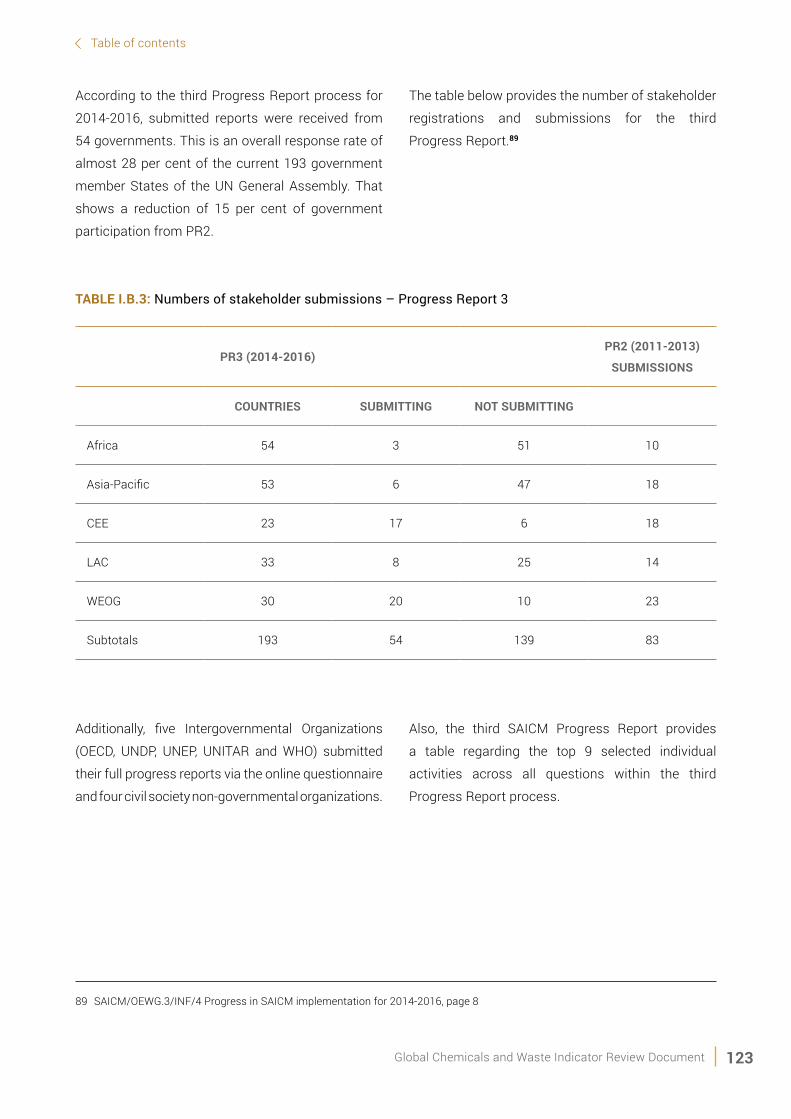
123Global Chemicals and Waste Indicator Review Document
Table of contents
According to the third Progress Report process for
2014-2016, submitted reports were received from
54 governments. This is an overall response rate of
almost 28 per cent of the current 193 government
member States of the UN General Assembly. That
shows a reduction of 15 per cent of government
participation from PR2.
89 SAICM/OEWG.3/INF/4 Progress in SAICM implementation for 2014-2016, page 8
The table below provides the number of stakeholder
registrations and submissions for the third
Progress Report.89
TABLE I.B.3: Numbers of stakeholder submissions – Progress Report 3
PR3 (2014-2016)PR2 (2011-2013)
SUBMISSIONS
COUNTRIES SUBMITTING NOT SUBMITTING
Africa 54 3 51 10
Asia-Pacific 53 6 47 18
CEE 23 17 6 18
LAC 33 8 25 14
WEOG 30 20 10 23
Subtotals 193 54 139 83
Additionally, five Intergovernmental Organizations
(OECD, UNDP, UNEP, UNITAR and WHO) submitted
their full progress reports via the online questionnaire
and four civil society non-governmental organizations.
Also, the third SAICM Progress Report provides
a table regarding the top 9 selected individual
activities across all questions within the third
Progress Report process.
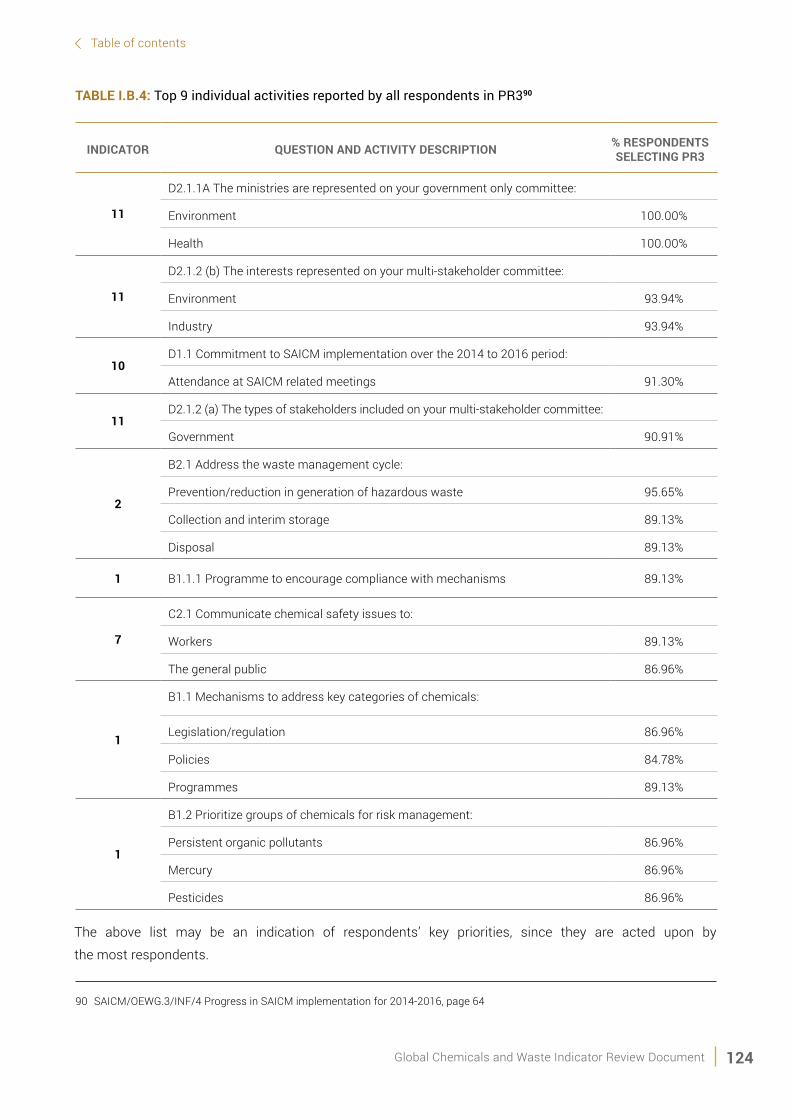
124Global Chemicals and Waste Indicator Review Document
Table of contents
TABLE I.B.4: Top 9 individual activities reported by all respondents in PR390
90 SAICM/OEWG.3/INF/4 Progress in SAICM implementation for 2014-2016, page 64
INDICATOR QUESTION AND ACTIVITY DESCRIPTION % RESPONDENTS SELECTING PR3
11
D2.1.1A The ministries are represented on your government only committee:
Environment 100.00%
Health 100.00%
11
D2.1.2 (b) The interests represented on your multi-stakeholder committee:
Environment 93.94%
Industry 93.94%
10D1.1 Commitment to SAICM implementation over the 2014 to 2016 period:
Attendance at SAICM related meetings 91.30%
11D2.1.2 (a) The types of stakeholders included on your multi-stakeholder committee:
Government 90.91%
2
B2.1 Address the waste management cycle:
Prevention/reduction in generation of hazardous waste 95.65%
Collection and interim storage 89.13%
Disposal 89.13%
1 B1.1.1 Programme to encourage compliance with mechanisms 89.13%
7
C2.1 Communicate chemical safety issues to:
Workers 89.13%
The general public 86.96%
1
B1.1 Mechanisms to address key categories of chemicals:
Legislation/regulation 86.96%
Policies 84.78%
Programmes 89.13%
1
B1.2 Prioritize groups of chemicals for risk management:
Persistent organic pollutants 86.96%
Mercury 86.96%
Pesticides 86.96%
The above list may be an indication of respondents’ key priorities, since they are acted upon by
the most respondents.

125Global Chemicals and Waste Indicator Review Document
Table of contents
VI. EUROSTAT reporting
91 Eurostat website on Quality: http://ec.europa.eu/eurostat/web/quality, accessed in March 2018
92 Eurostat waste database: https://ec.europa.eu/eurostat/web/waste/data/database
93 Report from the Commission to the European Parliament and the Council on statistics compiled pursuant to Regulation (EC) no.
2150/2002 on waste statistics and their quality_2016 Brussels
The Regulation (EC) no. 2150/2002 on Waste
Statistics sets out the data to be submitted by the
Member States and the quality required, while the
choice of the specific method for the elaboration
of waste statistics is left to the discretion of the
Member States.
Along with the data, Member States are required
to submit a quality report which refer to quality
elements commonly used in the European Statistical
System91. Data and quality reports are to be
submitted biennially to the Commission (Eurostat)
within 18 months of the end of the reference year.92
The implementation report from 2016 provides the
following data quality information:93
In total, 21 Member States and EEA/EFTA countries
delivered their 2012 data sets and quality reports on
time or within 1 month of the deadline. Both data
and quality reports arrived more than 3 months
after the deadline for 5 Member States (Denmark,
Ireland, Italy, Lithuania and Romania) and 1 EEA/
EFTA country (Iceland). Parts of data sets or quality
reports arrived more than 3 months after the
reporting deadline for 3 countries (Finland, Latvia
and the United Kingdom).
The number of missing values and the number of
countries reporting missing values fell considerably
between the reference years 2010 and 2012 for
the waste generation data set. In 2010, 8 countries
reported missing values but this dropped to 3 in the
reference year 2012. The total number of missing
values fell from 4.1% in the reference year 2010 to
1.5% in 2012.
The tendency is the same for the waste treatment
data, though less pronounced. The share of missing
values fell from 3.5% in the reference year 2010 to
3.1% in 2012 and the number of countries reporting
missing values decreased from 8 to 6.
More than half of the missing values in the waste
treatment data sets (55%) concern the treatment
category 'backfilling'. Backfilling data was collected
for the first time in 2010 after an amendment
of the Regulation.

126Global Chemicals and Waste Indicator Review Document
Table of contents
A2Annex II: Methods appropriate for each food chain stage
The following methods have been deemed appropriate for each relevant food chain stage.
Manufacturing/processing
WASTE STREAMAPPROPRIATE
MEASUREMENT METHODS
APPROPRIATE MEANS FOR NATIONAL
GOVERNMENT TO OBTAIN THE MEASUREMENTS
FROM COMPANIES
Food waste in a container (single stream – not mixed with other wastes)
Use of records specifying volume or weight e.g. from waste contractor
Volume assessment
Weighing, of whole containers or samples
Use of nationally held records e.g. regulatory returns
Audit (face-to-face survey) to take measurements
Self-completion or telephone survey – to request/require provision of measurement data
Data provision as part of a framework to tackle food waste (e.g., a voluntary agreement)
Food waste in a container (mixed with other wastes)
Weighing, via waste composition analysis or trial weighing
Volume assessment
Use of nationally held records e.g. regulatory returns
Audit (face-to-face survey) to take measurements
Self-completion or telephone survey – to request/require provision of measurement data
Data provision as part of a framework to tackle food waste (e.g., a voluntary agreement)
Uncontained food waste (not mixed with other wastes and not discharged to sewer)
Weighing, of samples or entire stream depending on feasibility
Volume assessment
Use of nationally held records e.g. regulatory returns
Audit (face-to-face survey) to take measurements
Self-completion or telephone survey – to request/require provision of measurement data
Data provision as part of a framework to tackle food waste (e.g., a voluntary agreement)
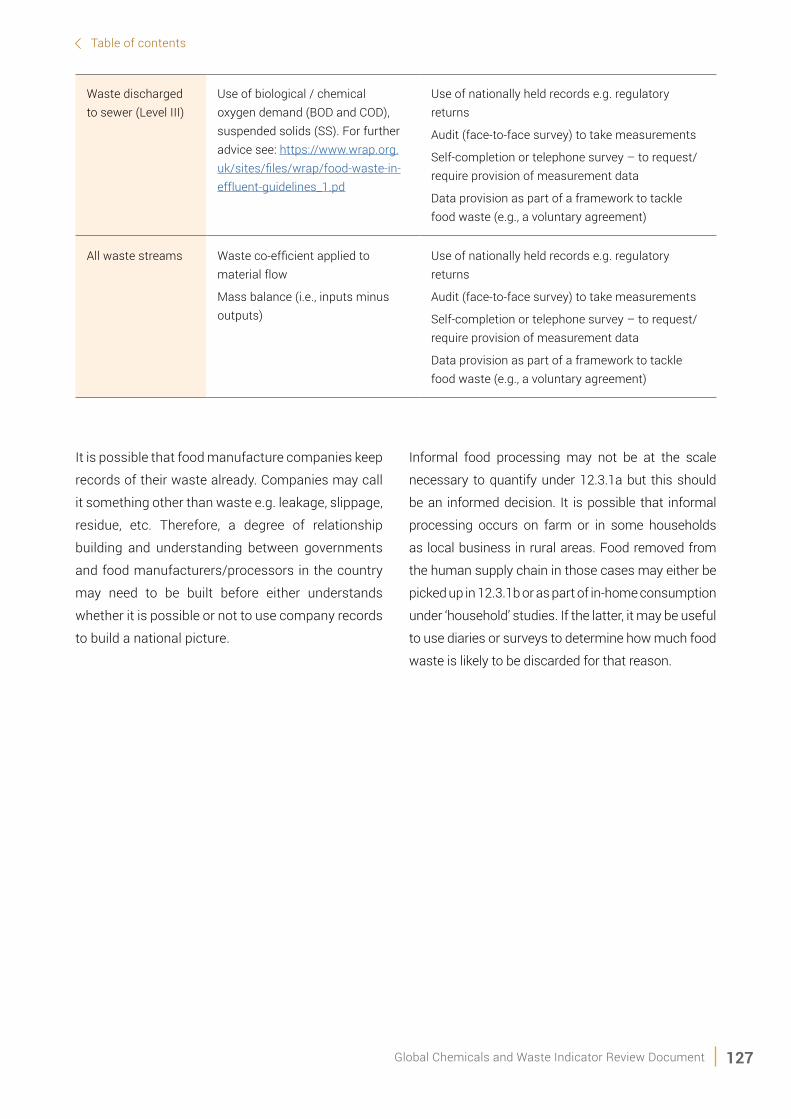
127Global Chemicals and Waste Indicator Review Document
Table of contents
Waste discharged to sewer (Level III)
Use of biological / chemical oxygen demand (BOD and COD), suspended solids (SS). For further advice see: https://www.wrap.org.uk/sites/files/wrap/food-waste-in-effluent-guidelines_1.pd
Use of nationally held records e.g. regulatory returns
Audit (face-to-face survey) to take measurements
Self-completion or telephone survey – to request/require provision of measurement data
Data provision as part of a framework to tackle food waste (e.g., a voluntary agreement)
All waste streams Waste co-efficient applied to material flow
Mass balance (i.e., inputs minus outputs)
Use of nationally held records e.g. regulatory returns
Audit (face-to-face survey) to take measurements
Self-completion or telephone survey – to request/require provision of measurement data
Data provision as part of a framework to tackle food waste (e.g., a voluntary agreement)
It is possible that food manufacture companies keep
records of their waste already. Companies may call
it something other than waste e.g. leakage, slippage,
residue, etc. Therefore, a degree of relationship
building and understanding between governments
and food manufacturers/processors in the country
may need to be built before either understands
whether it is possible or not to use company records
to build a national picture.
Informal food processing may not be at the scale
necessary to quantify under 12.3.1a but this should
be an informed decision. It is possible that informal
processing occurs on farm or in some households
as local business in rural areas. Food removed from
the human supply chain in those cases may either be
picked up in 12.3.1b or as part of in-home consumption
under ‘household’ studies. If the latter, it may be useful
to use diaries or surveys to determine how much food
waste is likely to be discarded for that reason.

128Global Chemicals and Waste Indicator Review Document
Table of contents
Retail (Formal and Informal)
WASTE STREAMAPPROPRIATE
MEASUREMENT METHODS
APPROPRIATE MEANS FOR NATIONAL
GOVERNMENT TO OBTAIN THE
MEASUREMENTS FROM COMPANIES
Food waste in a container (single stream – not mixed with other wastes)
Use of records specifying volume or weight e.g. from waste contractor (direct measurement)
Waste composition analysis
Scanning items as they are wasted
Volume assessment
Weighing, of whole containers or samples
Use of nationally held records e.g. regulatory returns
Audit (face-to-face survey) to take measurements
Self-completion or telephone survey – to request/require provision of measurement data
Data provision as part of a framework to tackle food waste (e.g., a voluntary agreement)
Food waste in a container (mixed with other wastes)
Use of records specifying volume or weight e.g. from waste contractor (direct measurement)
Waste composition analysis
Scanning items as they are wasted
Use of nationally held records e.g. regulatory returns
Audit (face-to-face survey) to take measurements
Self-completion or telephone survey – to request/require provision of measurement data
Data provision as part of a framework to tackle food waste (e.g., a voluntary agreement)
The methods appropriate for formal and informal
retail differ slightly. First, informal retail is unlikely to
keep records so weighing or volume assessments
are necessary. Secondly, the manner of scaling any
measurements for informal retail is likely to be difficult.
If informal retail is a large proportion of food retail in
a country, an effort will have to be made to quantify
the number and type of informal food retailers across
different geographic areas. This will help to determine
a sample frame for the measurement studies and
provide the basis for scaling. However, it is likely that
the study on number and type of informal retailers
will need to be repeated as a country’s retail market
changes between reporting periods.

129Global Chemicals and Waste Indicator Review Document
Table of contents
Food Service (hospitality and food service including plate waste and within hospitals, etc., formal
and informal)
WASTE STREAMAPPROPRIATE MEASUREMENT
METHODS
APPROPRIATE MEANS FOR NATIONAL
GOVERNMENT TO OBTAIN THE
MEASUREMENTS FROM COMPANIES
Food waste in a container (single stream – not mixed with other wastes)
Use of records specifying volume or weight e.g. from waste contractor
Scanning items as they are wasted
Volume assessment
Weighing, of whole containers or samples
Intercepting waste when shared with other businesses or households
Use of nationally held records e.g. regulatory returns
Audit (face-to-face survey) to take measurements
Self-completion or telephone survey – to request/require provision of measurement data
Data provision as part of a framework to tackle food waste (e.g., a voluntary agreement)
Food waste in a food waste-only container shared with other businesses or households
Food waste in a container (mixed with other wastes)
Weighing, via waste composition analysis or trial weighing
Volume assessment
Intercepting waste when shared with other businesses or households
Use of nationally held records e.g. regulatory returns
Audit (face-to-face survey) to take measurements
Self-completion or telephone survey – to request/require provision of measurement data
Data provision as part of a framework to tackle food waste (e.g., a voluntary agreement)
Food waste in a container mixed with other wastes and shared with other businesses or households
Uncontained food waste (not mixed with other wastes and not discharged to sewer)
Weighing, via waste composition analysis or trial weighing
Volume assessment
Use of nationally held records e.g. regulatory returns
Audit (face-to-face survey) to take measurements
Self-completion or telephone survey – to request/require provision of measurement data
Data provision as part of a framework to tackle food waste (e.g., a voluntary agreement)
The diversity of entity types within this food chain
stage is such that records are unlikely to cover them
all. Larger public establishments like hospitals or
schools may have records or can be more easily
regulated than private organisations. The restaurant
sector is likely to be diverse and made up of majority
small and medium enterprises, many of which
may be informal in certain countries. Appropriate
methods for measurement are therefore likely to be
volume assessments or weighing in a sample study
over a series of site visits. The same challenges for
scaling such measurement studies apply here as for

130Global Chemicals and Waste Indicator Review Document
Table of contents
informal retail; getting as accurate an understanding
of the quantity of waste producing entities as
possible is as important as the measurement study
and not likely to be easy. This is directly linked to
SDG 11.6.1 and could be measured as part of a
waste composition analysis.
Households
WASTE STREAMAPPROPRIATE MEASUREMENT
METHODS
APPROPRIATE MEANS FOR NATIONAL
GOVERNMENT TO OBTAIN THE
MEASUREMENTS FROM COMPANIES
Food waste in a container (single stream – not mixed with other wastes)
Use of records specifying volume or weight e.g. from waste contractor
Volume assessment
Weighing, of whole containers or samples
Food waste diaries
Commission organisation to conduct studies and scale up on behalf of governments
Directly commission studies and maintain oversight of estimates
Food waste in a container (mixed with other wastes)
Weighing, via waste composition analysis or trial weighing (linked with SDG 11.6.1)
Uncontained food waste (not mixed with other wastes and not discharged to sewer)
Weighing, via waste composition analysis or trial weighing (linked with SDG 11.6.1)
Diaries
Volume assessment
Waste discharged to sewer (for Level III) and food home composted, animal feed
Diaries
Diversion and weighing
Methods most appropriate for households food
waste vary by the destination of that waste. If
generation and collection are equivalent, then
a synthesis of waste composition analyses of
samples of collected waste from around the country
with the total waste collected figure can give a
relatively accurate picture of food waste generated
in the home without conducting a household study.
However, this will ignore the amount of waste
composted at home. These amounts, if likely to be
a smaller part of the waste stream, are likely best
quantified by a diary study and scaled via population
demographic statistics e.g. number of households.
If they are likely to be a larger part of the food waste
generated from households, a direct measurement
study may be more appropriate using in-home
observers or measurement devices. This is directly
linked to SDG 11.6.1 and could be measured as part
of a waste composition analysis.

131Global Chemicals and Waste Indicator Review Document
Table of contents
A3Annex III: Data Assessment Tool
"The current tool was developed as part of UN Environment's efforts to collect data and assess the status of
information available for drafting waste management related indicators, as part of the the 2030 Agenda for
Sustainable Development and the subsequent SDGs.
Objective: The purpose of this tool is to collect information on waste management practices, to serve the
following purposes:
1. Provide better understanding of waste management system characteristics and waste management
practices for each responding country
2. Inform policy makers on challenges countries face in terms of waste management data generation and
reporting
3. Provide insight on possible ways to facilitate the improvement of country reporting on waste
management data
Instructions for filling in the data assessment tool: Please fill in the spaces marked in grey. In case no
information is available, please leave space blank. Only fill in '0' where actual figures are zero. When quantities
are asked in tonnes, these reffer to metric tonnes. "

132Global Chemicals and Waste Indicator Review Document
Table of contents
Introduction
GENERAL INFORMATION
Name
Title
Affiliation
Contact information
Country
National Currency
Date of filling in form (mm/yyyy)
Relevant Waste Management Contacts in the country
<<Please provide names, positions, affiliations and contact details>>
Please provide name and contact details for enytity responsible on reporting on SDGs
<<Please provide names, positions, affiliations and contact details>>
Current Population of the country
Inhabitants
In which year was the population data collected?
Surface of the country Square kilometers

133Global Chemicals and Waste Indicator Review Document
Table of contents
Glossary of terms
This section includes explanations and guidance on the terms used in this tool, which will clarify and facilitate
the process of filling in the tables
Note | Please complete the list below with other terms you consider need defining
TERM DEFINITION/ EXPLANATION SOURCE
Waste "Materials, substances or objects for which the generator has no further use for his own purpose of production, transformation or consumption, and which he discards, or intends or is required to discard.
It excludes material directly recycled or reused at the place of generation (i.e., establishment) and waste materials that are directly discharged into ambient water or air as wastewater or air pollution."
UNSD-UNE Questionnaire 2016, adjusted
Management of waste
Collection, transport, treatment and disposal of waste, including after-care of disposal sites. Waste management includes activities of the informal waste sector, and/or illegal disposal, open burning.
UNSD-UNE Questionnaire 2016
Municipal solid waste
"Municipal solid waste, collected by or on behalf of municipalities (both urban and rural), by public or private enterprises, includes waste originating from: households, commerce and trade, small businesses, office buildings and institutions (schools, government buildings, etc.). It also includes bulky waste (e.g., white goods, old furniture, mattresses) and waste from selected municipal services, e.g., waste from park and garden maintenance, waste from street cleaning services (street sweepings, the content of litter containers, market cleansing waste), if managed as waste. The definition excludes waste from municipal sewage network and treatment, municipal construction and demolition waste. The definition includes waste that is self-collected and disposed by population, informally collected or captured by authorised collection or disposal entities by clean-up of unauthorised disposal to land or sea.
Ideally, special waste streams (such as WEEE, hazardous waste, medical waste, etc.) should be excluded. In case such streams are included, please provide an indication in comments/footnotes explaining what types of waste are included in the quantity of Municipal Solid Waste "
Adapted from UNSD-UNE Questionnaire 2016
Landfilling Final placement of waste into or onto the land in a controlled or uncontrolled way. The definition covers both landfilling in internal sites (i.e., where a generator of waste is carrying out its own waste disposal at the place of generation) and in external sites.

134Global Chemicals and Waste Indicator Review Document
Table of contents
TERM DEFINITION/ EXPLANATION SOURCE
Hazardous waste
"Hazardous waste definition will be considered based on the wastes covered by the Basel Convention. The Convention defines hazardous waste in Article 1, paragraph 1 (a) as the waste pertaining to any category listed in Annex I, unless they do not possess any of the characteristics contained in Annex III. Waste listed in Annex VIII are presumed to be hazardous, while waste listed in Annex IX are presumed not be hazardous.
For the purpose of the SDGs, due to comparability reasons, additional wastes considered hazardous as per national definitions are excluded. In case excluding is not possible, a note in comments/footnotes explaining what categories of hazardous waste are included, besides the ones covered by the Basel Convention should be inserted in the Data Collection Form."
Basel Convention, adjusted
Industrial waste Waste generated from industry or related processes, irrespective if hazardous or non-hazardous
Recycling Any reprocessing of waste material in a production process that diverts it from the waste stream, except reuse as fuel. Both reprocessing as the same type of product, and for different purposes should be included. Recycling within industrial plants i.e., at the place of generation should be excluded.
UNSD/OECD definition, adjusted
Recycling rate Proportion of material recycled in the country plus quantities exported for recycling out of total waste generated in the country.
Global Chemicals and Waste Indicator Review document and Guidance on 12.4.2 and 12.5.1 indicators document (not yet published)
Composting Biological process that submits biodegradable waste to anaerobic or aerobic decomposition, and that results in a product that is recovered and can be used to increase soil fertility.
UNSD-UNEP Questionnaire 2016
Anaerobic digestion
Managed decomposition of organic solid or liquid materials in the absence of air, often under pressure.
EPR Extended Producer Responsibility

135Global Chemicals and Waste Indicator Review Document
Table of contents
TERM DEFINITION/ EXPLANATION SOURCE
Multilateral Environmental Agreements (MEAs)
"MEAs are international conventions and treaties on environment and natural resources. These agreements between states may take the form of “soft-law”, setting out non legally-binding principles which parties are obligated to consider when taking actions to address a particular environmental issue, or “hard-law” which specify legally-binding actions to be undertaken toward an environmental objective.
Examples of MEAs: Basel Convention on hazardous waste; Stockholm Convention on Persisten Organic Pollutants; Minamata Concention on Mercury; UNFCCC Framework convention on Climate Change, etc."
WASTE TYPE
Construction and demolition
Construction and demolition waste includes numerous materials and debris such as wood, concrete, metals, bricks, gypsum, plastic, solvents, glass, asbestos and other building components, excavated soil as well.
Food/organic waste
Food waste, waste from kitchens, HORECA sector, etc.
E-waste Refers to all electrical and electronic equipment (EEE) and its parts that have been discarded by its owner as waste without the intent of re-use. The totals of e-waste are disaggregated into six main categories: (1) temperature exchange equipment; (2) screens and monitors (referred to as screens); (3) lamps; (4) large equipment; (5) small equipment; and (6) small IT and telecommunication equipment with an external dimension of less than 50 cm.
UNU
Batteries and accumulators
Spent or discarded batteries and accumulators, irrespective of the shape, type and source (zinc, alkaline, button alkaline, silver zinc, button zinc, lithium ion and all types of rechargable batteries and accumulators: Nickel-cadmium, NiMH (Nickel metal Hydride), Lithium, Lithium-Ion Polymer , Alkaline, chargeable Titanium, Lead SLI, Lead traction, Lead stationary, Nickel-iron, Nickel-zinc)
Eurostat
Medical and pharmaceutical waste
Medical waste is generated at healthcare facilities, and includes biomaterials, sharps, bandages, gloves and other medical instruments. Pharmaceutical waste includes expired medicine, discarded tablets, capsules, powders, etc., intended either for human or animal use.
Chemicals, solvents, paints
Discarded or expired chemicals, solvents and paints, coming from industry, laboratories, manufacturing companies, households cleaning or upkeep products, etc.
Non-hazardous industrial waste
Non-hazardous materials resulting from the industrial production of goods and products.

136Global Chemicals and Waste Indicator Review Document
Table of contents
1. Country information
NATIONAL AND INTERNATIONAL REPORTINGPROVIDE
INFORMATION SOURCE
Which Multilateral Environmental Agreements (MEAs) has the country adhered to?
<<Comments>>
On which of the above MEAs do you report data, and what data do you report on each?
<<Comments>>
Which Bilateral or Regional Agreements has your country adhered to, which also adress waste management in general, and/or management of particular waste streams? When has your country adhered to these agreements?
<<Comments>>
What waste-management data (in general and/or per particular waste stream or generating sector) do you report on the above-mentioned Bilateral or Regional Agreements, and with what frequency?
<<Comments>>
In which year has your country responded to UNSD/UN Environment Questionnaire, and/or OECD/Eurostat Questionnaire
<<Comments>>
"What data do you report based on national legislation? Who (which entity)reports this data to whom? "
<<Comments>>
Please provide sources of available statistics (studies, reports, database) compiled by your country.
<<Comments>>
"Is there an EPR system in your country and is related data available? What materials are covered by the EPR system?"
<<Comments>>

137Global Chemicals and Waste Indicator Review Document
Table of contents
NATIONAL AND INTERNATIONAL REPORTINGPROVIDE
INFORMATION SOURCE
"What data do you report on city/municipality level? Does this apply to all municipalities, or only to ones above certain size/area? Please provide details. What is the frequency of reporting?"
<<Comments>>
Is the reported data validated and if so what is the validation process?
<<Comments>>
Is there any other waste related data you report (based on sub-regional agreements or agreements between cities)? If yes, please provide details on the type of data, frequency of reporting , entities reporting and destination of data.
<<Comments>>
LEGISLATIVE AND POLICY FRAMEWORKPROVIDE
INFORMATION SOURCE
Is there a national law governing waste management in the country?
Yes | No <<Additional Comments>>
Are there any laws governing particular waste streams in the country? i.e. WEEE, packaging, hazardous waste, food waste, etc.
Yes | No <<Additional Comments>>
"What are the main national legal provisions in terms of waste management in general, and per waste type/stream/generating sector in particular?
For example: What national legal provisions are in place for managing:• municipal solid waste and similar
materials;• industrial, mining, hazardous and
medical waste;• packaging, electronic waste, food
waste; -etc.?"
<<Comments>>

138Global Chemicals and Waste Indicator Review Document
Table of contents
LEGISLATIVE AND POLICY FRAMEWORKPROVIDE
INFORMATION SOURCE
Does the country have a waste management strategy?
Yes | No <<Additional Comments>>
Does the country have waste strategies per specific waste streams/sectors? Example: Does the country have a food-waste/hazardous waste/packaging waste strategy?
Yes | No <<Additional Comments>>
Has the country adopted waste diversion or waste recycling rate targets, either general or per different waste streams?
Yes | No <<Additional Comments>>
Do municipalities/provinces/districts/etc. have their own waste management rules and regulations?
Yes | No <<Additional Comments>>
Do municipalities have the obligation to prepare a waste management plan?
Yes | No <<Additional Comments>>
What is the percentage of municipalities who have a recent waste management plan (no older than 5 years)?
<<Comments>>
Additional legislative and policy framework notes (Optional)
INSTITUTIONAL FRAMEWORKPROVIDE
INFORMATION SOURCE
"Does the national government have an agency mandated to enforce solid waste laws and regulations? Please fill in the comments which institutions play the role of environmental regulator (permitting and enforcement)?"
Yes | No <<Additional Comments>>

139Global Chemicals and Waste Indicator Review Document
Table of contents
INSTITUTIONAL FRAMEWORKPROVIDE
INFORMATION SOURCE
"What entity(s) is(are) responsible for the management of municipal solid waste? Please include reponsible entity for:• policy/planning/legislation• collection/treatment/disposal• enforcement/compliance• data reporting"
<<Comments>>
"What entity(s) is(are) responsible for the management of industrial waste?
Please include reponsible entity of:• policy/planning/legislation• collection/treatment/disposal• enforcement/compliance• data reporting"
<<Comments>>
"What entity(s) is(are) responsible for the management of hazardous waste?
Please include reponsible entitied for:• policy/planning/legislation• collection/treatment/disposal• enforcement/compliance• data reporting"
<<Comments>>
"What entity(s) is(are) responsible for the food waste? Please include reponsible entity for:• policy/planning/legislation• collection/treatment/disposal• enforcement/compliance• data reporting"
<<Comments>>
Do municipalities have have a department dedicated to waste management?
Yes | No <<Additional Comments>>
Do municipalities have waste management rules and by laws?
Yes | No <<Additional Comments>>
Do municipalities have a unit enforcing waste issues in the city such as littering or illegal dumping?
Yes | No <<Additional Comments>>

140Global Chemicals and Waste Indicator Review Document
Table of contents
INSTITUTIONAL FRAMEWORKPROVIDE
INFORMATION SOURCE
Do municipalities have separate budget lines for waste management? Is this budget established at national or municipality level? Please provide explanations also in case of various set-ups.
Yes | No <<Additional Comments>>
List of international partners and NGOs currently working with municipalities and briefly describe each project
<<Comments>>
DEFINITIONSPROVIDE
INFORMATION SOURCE
How is waste defined in your country? <<Comments>>
How is municipal waste defined in your country?
<<Comments>>
How is hazardous waste defined in your country?
<<Comments>>
How is food waste (or related terms, e.g. food loss) defined in your country?
<<Comments>>
What streams of waste are automatically classified as hazardous waste in your country? (e.g medical waste, WEEE, etc.)
<<Comments>>
How is recycling defined in your country? <<Comments>>
What materials are defined as "recyclables" in your country?
<<Comments>>
What operations/technologies does recycling include in your country?
<<Comments>>
"Is informal recycling captured in national recycling data? What are the estimates of informal recycling performance in your country?"
<<Comments>>

141Global Chemicals and Waste Indicator Review Document
Table of contents
2.Gaps and challenges
NATIONAL PRIORITIESPROVIDE INFORMATION
SOURCE
What do you consider to be the top priorities of your country in terms of waste management in general and per waste stream/source?
<<Comments>>
Are there any plans or strategies in place adressing these priorities?
Yes | No <<Additional Comments>>
Is the elaboration of the above mentioned plans or strategies derived from international conventions your country has adhered to?
Yes | No <<Additional Comments>>
GAPS AND CHALLENGESPROVIDE INFORMATION
SOURCE
What do you consider to be the most significant gaps/challenges in terms of waste management data generation in general and per specific waste types/streams/sources?
<<Comments>>
What do you consider to be the most significant gaps/challenges in terms of waste management data collection?
<<Comments>>
What do you consider to be the most significant gaps/challenges in terms of waste management data reporting?
<<Comments>>
What do you consider to be appropriate solutions in overcoming the above mentioned gaps or challenges?
<<Comments>>
142Global Chemicals and Waste Indicator Review Document
Table of contents
GAPS AND CHALLENGESPROVIDE INFORMATION
SOURCE
"Are there any projects with international participation currently under way, tackling the above mentioned gaps/challenges?
Please provide a brief description of these projects."
<<Comments>>
"What do integovernmental agencies provide: financial assistance or technical assistance?
What other entities provide financial assistance or technical assistance?"
<<Comments>>
What are the priorities for reporting and tracking of waste and recycling processes in your country? What are the most important gaps in the collection and management of information and statistics on municipal, hazardous, organic, industrial waste, ad recovery or recycling?
<<Comments>>

143Global Chemicals and Waste Indicator Review Document
Table of contents
3. Reporting status
For each of the Bilateral, Regional, Multilateral or National Agreement/Convention/Standard/Reporting
obligation mentioned in Section 1 - Country Information, please fill in the table below.
Please copy and paste the sample table below for as many times as necessary, in order to have one table for
each convention/standard.
Name of Agreement/Convention/Standard/ National reporting obligation
<<Comments>>
Type (provide comments on wether data reporting is obligatory or voluntary)
National Bilateral Regional
Multilateral
<<Comments>>
Year of adherence/coming into force/ first year of reporting required
<<Comments>>
Focal point/ Designated Competent Authority
<<Comments>>
Frequency of reporting <<Comments>>
Year reporting started <<Comments>>
Waste data reported <<Comments>>
Level of dissagregation (i.e. national/city level, by generating sector, by waste type, per volume, per quantity)
<<Comments>>
Responsible entity for collecting and reporting the data to national entities
<<Comments>>
National entity to which the data is reported <<Comments>>
Responsible entity for data verification and validation and validation methodology.
<<Comments>>
Responsible entity for data reporting to international entities
<<Comments>>
International entity to which the data is reported
<<Comments>>

144Global Chemicals and Waste Indicator Review Document
Table of contents
4. Data collection form
Please fill in the forms below with latest available yearly data, which is most complete as per your expert
judgement, however, not older than 2015.
Please provide all quantities in tonnes.
In case of unavailable data for certain table items, please leave space blank, and do not '0'. Only insert '0' for
actual null values. Tonnes refer to metric tonnes.
Please insert the reference year for the data below:
WASTE GENERATION DATAOUT OF WHICH,
HAZARDOUS WASTE
COMMENTSPROVIDE
INFORMATION SOURCE AND DATE
Out of the above quantity of total generated waste, please provide:

145Global Chemicals and Waste Indicator Review Document
Table of contents
WASTE GENERATION DATAOUT OF WHICH,
HAZARDOUS WASTECOMMENTS
PROVIDE INFORMATION
SOURCE AND DATE
Out of the above quantity of total generated waste, please provide quantities divided per ISIC sector :
Is waste from the below sectors
captured in the MSW stream?
Agriculture, forestry and fishing (ISIC 01-03)
<<Please insert quantity in tonnes>>
<<Please insert quantity in tonnes>>
<<Please provide comments or explanations, if the case>>
Yes | No
Mining and quarrying (ISIC 05-09)
<<Please insert quantity in tonnes>>
<<Please insert quantity in tonnes>>
<<Please provide comments or explanations, if the case>>
Yes | No
Manufacturing (ISIC 10-33) <<Please insert quantity in tonnes>>
<<Please insert quantity in tonnes>>
<<Please provide comments or explanations, if the case>>
Yes | No
Electricity, gas, steam and air conditioning supply (ISIC 35)
<<Please insert quantity in tonnes>>
<<Please insert quantity in tonnes>>
<<Please provide comments or explanations, if the case>>
Yes | No
Construction (ISIC 41-43)
<<Please insert quantity in tonnes>>
<<Please insert quantity in tonnes>>
<<Please provide comments or explanations, if the case>>
Yes | No
Wholesale and retail trade excluding motor vehicles (ISIC 46-47)
<<Please insert quantity in tonnes>>
<<Please insert quantity in tonnes>>
<<Please provide comments or explanations, if the case>>
Yes | No
Accomodation and foodservice activities (ISIC 55-56)
<<Please insert quantity in tonnes>>
<<Please insert quantity in tonnes>>
<<Please provide comments or explanations, if the case>>
Yes | No
Other economic activities excluding ISIC 38
<<Please insert quantity in tonnes>>
<<Please insert quantity in tonnes>>
<<Please provide comments or explanations, if the case>>
Yes | No
Households <<Please insert quantity in tonnes>>
<<Please insert quantity in tonnes>>
<<Please provide comments or explanations, if the case>>
Yes | No

146Global Chemicals and Waste Indicator Review Document
Table of contents
WASTE GENERATION DATAOUT OF WHICH,
HAZARDOUS WASTE
COMMENTSPROVIDE
INFORMATION SOURCE AND DATE
Quantity of municipal waste generated
<<Please insert quantity in tonnes>>
<<Please insert quantity in tonnes>>
<<Please provide comments or
explanations, if the case>>
Quantity of non-hazardous industrial waste generated
<<Please insert quantity in tonnes>>
<<Please provide comments or
explanations, if the case>>
Generated waste unaccounted for
Please estimate the quantity of generated waste which is unaccounted for
<<Please insert quantity in tonnes>>
<<Please insert quantity in tonnes>>
<<Please provide comments or
explanations, if the case>>

147Global Chemicals and Waste Indicator Review Document
Table of contents
WASTE COLLECTION COVERAGE
QUANTITY OF WASTE IN TONNES
WASTE STREAM
FORMALLY (BY APPOINTED
ENTITIES)
INFORMALLY (BY WASTE PICKERS)
UNCOLLECTED COMMENTS
PROVIDE INFORMATION SOURCE AND
DATE
Total <<Please provide comments>>
Municipal waste <<Please provide comments>>
Hazardous waste
<<Please provide comments>>
Non-hazardous industrial waste
<<Please provide comments>>
Other (please specify in comments section)
<<Please provide comments>>

148Global Chemicals and Waste Indicator Review Document
Table of contents
WASTE TREATMENT
AND DISPOSAL
DATA
QUANTITY OF WASTE TREATED OR DISPOSED OF IN THE COUNTRY, PER OPERATION TYPE IN TONNES
WASTE STREAM
RECYCLED INCINERATED INCINERATED WITH ENERGY
RECOVERY
LANDFILLED TOTAL
LANDFILLED IN SANITARY
LANDFILL
LANDFILLED IN UNCONTROLLED
LANDFILL
OTHER (PLEASE
SPECIFY IN COMMENTS)
COMMENTS
PROVIDE INFORMATION SOURCE AND
DATE
Municipal waste
<<Please provide
comments>>
Hazardous waste
<<Please provide
comments>>
Non-hazardous industrial waste
<<Please provide
comments>>
Other (please specify in comments section)
<<Please provide
comments>>

149Global Chemicals and Waste Indicator Review Document
Table of contents
WASTE RECYCLING
DATA
QUANTITY OF WASTE (TONNES) RECYCLED, PER TYPE OF WASTE AND RECYCLING OPERATION
WASTE TYPETOTAL
GENERATEDMATERIAL
RECYCLINGENERGY
RECOVERY
OTHER (PLEASE PROVIDE
INFORMATION IN COMMENTS)
COMMENTS
PROVIDE INFORMATION SOURCE AND
DATE
General recyclables
Metal <<Please provide
comments>>
Paper and cardboard
<<Please provide
comments>>
Plastic <<Please provide
comments>>
Glass <<Please provide
comments>>
Construction and Demolition
<<Please provide
comments>>
Textiles <<Please provide
comments>>
Organic waste fractions
Food / Organic waste
<<Please provide
comments>>
Yard / Garden / Green waste
<<Please provide
comments>>
Agricultural waste
<<Please provide
comments>>

150Global Chemicals and Waste Indicator Review Document
Table of contents
WASTE RECYCLING
DATA
QUANTITY OF WASTE (TONNES) RECYCLED, PER TYPE OF WASTE AND RECYCLING OPERATION
Hazardous waste
E-waste <<Please provide
comments>>
Batteries and accumulators
<<Please provide
comments>>
Medical and pharmaceutical waste
<<Please provide
comments>>
Chemicals, solvents, paints
<<Please provide
comments>>
Other hazardous waste (please provide information in comments)
<<Please provide
comments>>
Other
Wood <<Please provide
comments>>
Rubber / Leather
<<Please provide
comments>>
Non hazardous Industrial waste
<<Please provide
comments>>
Other (please provide information in comments)
<<Please provide
comments>>

151Global Chemicals and Waste Indicator Review Document
Table of contents
WASTE
MOVEMENT DATAQUANTITY OF WASTE (TONNES)
WASTE STREAM EXPORTED COMMENTS IMPORTED COMMENTSPROVIDE
INFORMATION SOURCE AND DATE
Municipal waste <<Please provide comments on
purpose of export,, i.e. incineration, landfill, etc.>>
<<Please provide comments on
purpose of import, i.e. incineration, landfill, etc.>>
Hazardous waste <<Please provide comments on
purpose of export,, i.e. incineration, landfill, etc.>>
<<Please provide comments on
purpose of import, i.e. incineration, landfill, etc.>>
Non-hazardous industrial waste
<<Please provide comments on
purpose of export,, i.e. incineration, landfill, etc.>>
<<Please provide comments on
purpose of import, i.e. incineration, landfill, etc.>>

152Global Chemicals and Waste Indicator Review Document
Table of contents
FOOD WASTE DATA
DESTINATIONS
SECTORAMOUNT (TONNES)
CO/ANAEROBIC DIGESTION
COMPOST / AEROBIC
CONTROLLED COMBUSTION
LAND APPLICATION
LANDFILLREFUSE / DISCARDS
SEWERPROVIDE
INFORMATION SOURCE AND DATE
Household
Out of home consumption
Agriculture, post-harvest losses and storage
Retail/ wholesale/ markets/ street vending
Manufacturing
HORECA (hotel, restaurant and café), and institutions
Food processing industry
Food processing artisanal

153Global Chemicals and Waste Indicator Review Document
Table of contents
WASTE TREATMENT
FACILITY
TYPES OF WASTE
TREATED
TREATMENT/OPERATION
TYPE
TREATMENT CAPACITY PER EACH TYPE OF
WASTE [TONNES/YEAR]
AVERAGE YEARLY QUANTITIES OF
WASTE PROCESSED, PER EACH TYPE OF
WASTE [TONNES/YEAR]
PROVIDE INFORMATION SOURCE AND
DATE
<<Please provide the name and
location of the facility >>
<<Please provide the name and
location of the facility >>
<<Please provide the name and
location of the facility >>
<<Please provide the name and
location of the facility >>
<<Please provide the name and
location of the facility >>

154Global Chemicals and Waste Indicator Review Document
Table of contents
WASTE DISPOSAL FACILITY
TYPE OF LANDFILL
TYPES OF WASTE
ACCEPTED
TOTAL LANDFILLED
CAPACITY
REMAINING LANDFILL CAPACITY
ARE RECORDS KEPT ON WASTE
DEPOSITEDCOMMENTS
PROVIDE INFORMATION SOURCE AND
DATE
<<Please provide the name and
location of the facility >>
Yes | No
<<Please provide comments on type of records kept, i.e. waste source, type,quantity,
volume, etc..>>
<<Please provide the name and
location of the facility >>
Yes | No
<<Please provide comments on type of records kept, i.e. waste source, type,quantity,
volume, etc..>>
<<Please provide the name and location of the
facility >>
Yes | No
<<Please provide comments on type of records kept, i.e. waste source, type,quantity,
volume, etc..>>
<<Please provide the name and location of the
facility >>
Yes | No
<<Please provide comments on type of records kept, i.e. waste source, type,quantity,
volume, etc..>>
<<Please provide the name and location of the
facility >>
Yes | No
<<Please provide comments on type of records kept, i.e. waste source, type,quantity,
volume, etc..>>

155Global Chemicals and Waste Indicator Review Document
Table of contents
OTHER ESTIMATE COMMENTSPROVIDE INFORMATION
SOURCE AND DATE
<<Please estimate the percentage of generated waste which is subjected
to open burning>>
<<Please provide comments on weather
this is done at household or municipality level, or
other>>

Glo
bal C
hem
ical
s an
d W
aste
Rev
iew
Doc
umen
t
| 2
021
|
2021
Global Chemicals and Waste Indicator Review Document
United Nations Environment Programme
P.O. Box 30552-00100, Nairobi, KENYA
E-mail: [email protected]
© D
rew
Sul
ock
| Shu
tters
tock
© D
rew
Sul
ock
| Shu
tters
tock