Embed Size (px)
Citation preview
© 2012 IBM Corporation
3rd Party Registration &Account Management3rd Party Registration &Account Management
1 1
SMT 2015 Approved AMWG Change Requests

© 2012 IBM Corporation
3rd Party Registration &Account Management3rd Party Registration &Account Management
2
2015 Approved AMWG Change Requests
CR # Description
SMT Portal Changes
AMWG CR 2013-015 Expand Daily Usage Graph to show 35 days of daily usage on the SMT GUI
AMWG CR 2014-018 Add Generation Data to the SMT Portal View
AMWG CR 2013-014 Allow SMT user to toggle between 15-Minute Reads and Daily Reads without having to reset the date range
In-Home Device (HAN) Reports
AMWG CR 2013-008 Reports for AMWG Data Monitoring – Average Time to Deliver HAN Messages
AMWG CR 2013-011 Average Time from HAN Provision Request to Meter Ready Status
Usage Data Monitoring Reports
AMWG CR 2013-001 Report for AMWG Data Monitoring – Data Completeness Measurements
AMWG CR 2013-003 Reports for AMWG Data Monitoring – Measurement of Percentage of Actual Meter Reads
AMWG CR 2013-004 Reports for AMWG Data Monitoring – Measurement of Estimates
AMWG CR 2013-010 Reports for AMWG Data Monitoring – Number of Reports Requested by GUI (Portal) and Number of FTPS Accesses

© 2012 IBM Corporation
3rd Party Registration &Account Management3rd Party Registration &Account Management
3 3
AMWG CR 2013-015Expanded Daily Usage Graph

© 2012 IBM Corporation
3rd Party Registration &Account Management3rd Party Registration &Account Management
AMWG CR 2013-015 – Expand Daily Usage Graph to show 35 days of Daily Usage
4
Address: 123 Demo Drive, ESI ID: 88888880000000001 Anytown, TX. Meter Multiplier: 1
Usage / Customer Meters Search (3rd Party) / Customer Meters – Usage Report
Customer Meters – Usage Report
Usage Notices HelpHome My Account
Welcome, ChrisLog Out
Report Request Status (3rd Party)
Customer Meters (ROR)
Customer Meters (3rd Party)
Report Request Status (ROR)
Existing Production Behavior
SMT currently allows only 30 days of daily usage to be displayed on the usage graph. A user must select “Next” to view the 31st days’ usage. Additionally, some meter read cycles are longer than 30 days, with 35 days being the longest billing cycle.
Illustration of Current Production Logic
Report Type: Daily Meter ReadsStart Date: 12/01/2014End Date: 01/04/2015
The requested date range has 35 days. The existing logic displays the requested Daily Meter Reads usage in two pages.
Clicking the “Next” button will display the data for the remaining 5 days.
The first 30 days, 12/01 to 12/30, will be displayed in the first page.

© 2012 IBM Corporation
3rd Party Registration &Account Management3rd Party Registration &Account Management
5
AMWG CR 2013-015 – Expand Daily Usage Graph to show 35 days of Daily Usage
Moreover, the Usage (kWh) for the first 30 days will be displayed in the table at the bottom of the first page.
Clicking the “Next” button will display the data for the remaining 5 days.
Illustration of Current Production Logic (Cont)

© 2012 IBM Corporation
3rd Party Registration &Account Management3rd Party Registration &Account Management
AMWG CR 2013-015 – Expand Daily Usage Graph to show 35 days of Daily Usage
6
Address: 123 Demo Drive, ESI ID: 88888880000000001 Anytown, TX. Meter Multiplier: 1
Usage / Customer Meters Search (3rd Party) / Customer Meters – Usage Report
Customer Meters – Usage Report
Usage Notices HelpHome My Account
Welcome, ChrisLog Out
Report Request Status (3rd Party)
Customer Meters (ROR)
Customer Meters (3rd Party)
Report Request Status (ROR)
This is the second page of the Daily Meter Reads report, which displays the remaining 5 days – from 12/31/2014 to 01/04/2015.
Illustration of Current Production Logic (Cont)

© 2012 IBM Corporation
3rd Party Registration &Account Management3rd Party Registration &Account Management
7
AMWG CR 2013-015 – Expand Daily Usage Graph to show 35 days of Daily Usage
This is the second page of the Daily Meter Reads report, which displays the remaining 5 days – from 12/31/2014 to 01/04/2015.
Illustration of Current Production Logic (Cont)

© 2012 IBM Corporation
3rd Party Registration &Account Management3rd Party Registration &Account Management
AMWG CR 2013-015 – Expand Daily Usage Graph to show 35 days of Daily Usage
8
Address: 123 Demo Drive, ESI ID: 88888880000000001 Anytown, TX. Meter Multiplier: 1
Usage / Customer Meters Search (3rd Party) / Customer Meters – Usage Report
Customer Meters – Usage Report
Usage Notices HelpHome My Account
Welcome, ChrisLog Out
Report Request Status (3rd Party)
Customer Meters (ROR)
Customer Meters (3rd Party)
Report Request Status (ROR)
All 35 days – 12/01/2014 to 01/04/2015 will be displayed in the Daily Meter Read usage graph.
Business Requirement:
Expand Daily Usage Graph to show 35 days of daily usage on the SMT GUI.
Illustration of Proposed Production Behavior
Report Type: Daily Meter ReadsStart Date: 12/01/2014End Date: 01/04/2015
The requested date range has 35 days. The requested Daily Meter Reads usage will be displayed in a single page.
The “Previous” and “Next” buttons are disabled.
The Usage Graph is expanded to display 5 additional days
© 2012 IBM Corporation
3rd Party Registration &Account Management3rd Party Registration &Account Management
9
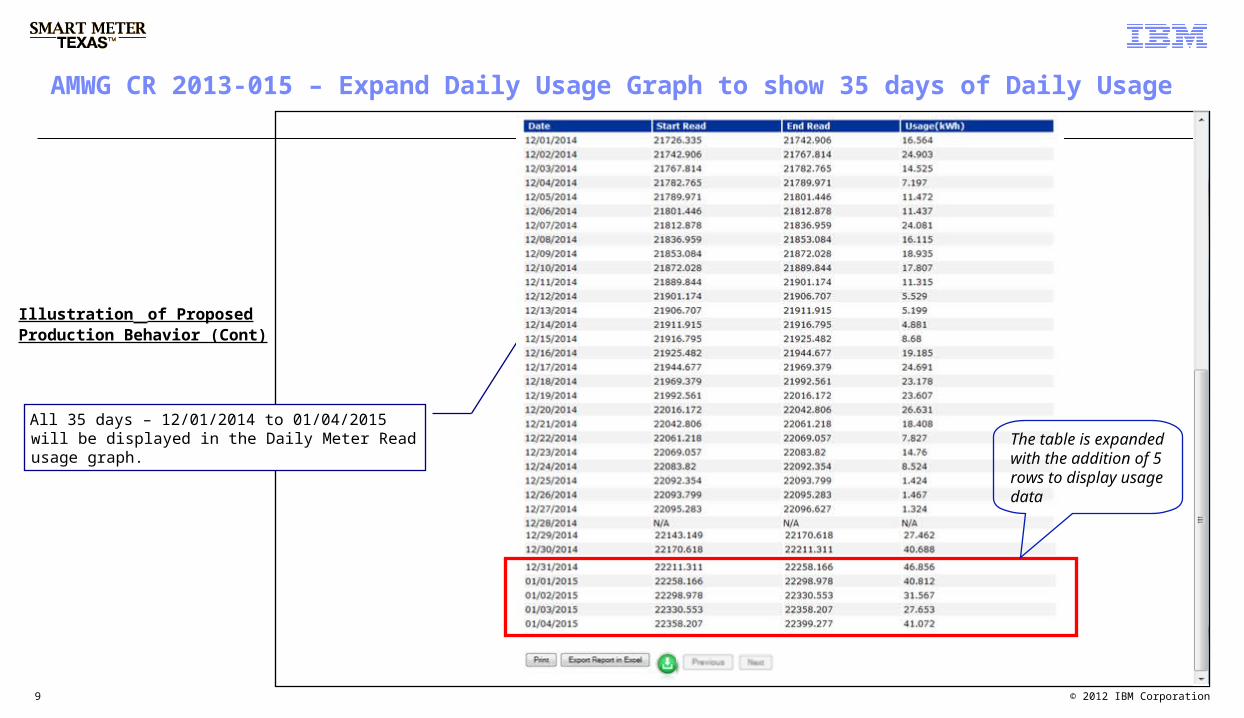
AMWG CR 2013-015 – Expand Daily Usage Graph to show 35 days of Daily Usage
All 35 days – 12/01/2014 to 01/04/2015 will be displayed in the Daily Meter Read usage graph. The table is
expanded with the addition of 5 rows to display usage data
Illustration of ProposedProduction Behavior (Cont)

© 2012 IBM Corporation
3rd Party Registration &Account Management3rd Party Registration &Account Management
10
AMWG CR 2013-015 – Expand Daily Usage Graph to show 35 days of Daily Usage
Functional Rules – Expanded Daily Usage Graph
•If the requested date range has more than 35 days of usage data, the first page will display the first 35 days, and the remaining days will be displayed on the succeeding pages. Only 35 days of data are displayed per page.
•The expanded 35 days of Usage Data is applicable to ALL SMT actors:• TDSP• REP• Third Party• Business Customers• Residential Customers.
Other changes to be considered:
•The “Export Report” button could follow the new requirement – for UI downloads, 35 days (or X days as displayed in the UI) will be included in the report.
•The “Green Button” XML report could follow the new requirement – UI downloads, 35 days (or X days as displayed in the UI) will be included in the report.
•The Report Versions could also have the expanded 35 days of usage data displayed in the UI.

© 2012 IBM Corporation
3rd Party Registration &Account Management3rd Party Registration &Account Management
11 11
AMWG CR 2014-018Add Generation Data to SMT Portal View

© 2012 IBM Corporation
3rd Party Registration &Account Management3rd Party Registration &Account Management
12
AMWG CR 2014-018 – Add Generation Data to the SMT Portal View
Option 1
•Toggle between Consumption and Generation Usage Data
• If Consumption Usage Data is selected, the Usage Graph and Usage Table will display Consumption usage data
• If Generation Usage Data is selected, the Usage Graph and Usage Table will display Generation usage data
Option 2
•Add Generation Data to Usage Graph and Usage Table
• Usage Graph will display both Consumption and Generation usage data at the same time. Different colors will be used to differentiate between the two usage data types
• Usage Table will have two additional columns – Usage (kWh) for Generation and Actual / Estimate for Generation

© 2012 IBM Corporation
3rd Party Registration &Account Management3rd Party Registration &Account Management
AMWG CR 2014-018 – Add Generation Data to the SMT Portal View
13
Address: 123 Demo Drive, ESI ID: 88888880000000001 Anytown, TX. Meter Multiplier: 1
Usage / Customer Meters Search (3rd Party) / Customer Meters – Usage Report
Customer Meters – Usage Report
Usage Notices HelpHome My Account
Welcome, ChrisLog Out
Report Request Status (3rd Party)
Customer Meters (ROR)
Customer Meters (3rd Party)
Report Request Status (ROR)
Business Requirement
Add Generation Data to the SMT Portal View
Consumption Generation
View Consumption / Generation Usage:
NEW radio button selection to toggle between Consumption and Generation Usage data
Option 1:
Toggle between Consumption and Generation Usage Data
By default, the 15-Minute Daily Usage graph will display the Consumption data.
Users will be provided an option to toggle between Consumption and Generation Usage data

© 2012 IBM Corporation
3rd Party Registration &Account Management3rd Party Registration &Account Management
14
AMWG CR 2014-018 – Add Generation Data to the SMT Portal View
Print Export Report in CSV < Previous Day Next Day >
Option 1
Radio Button logic
The radio button allows users to toggle between Consumption and Generation Usage Data.
If “Consumption” is selected in the radio button, the Usage Graph and the Usable Table will display the Consumption Usage Data.
If “Generation” is selected in the radio button, the Usage Graph and the Usabe Table will display the Generation Usage Data.

© 2012 IBM Corporation
3rd Party Registration &Account Management3rd Party Registration &Account Management
AMWG CR 2014-018 – Add Generation Data to the SMT Portal View
15
Address: 123 Demo Drive, ESI ID: 88888880000000001 Anytown, TX. Meter Multiplier: 1
Usage / Customer Meters Search (3rd Party) / Customer Meters – Usage Report
Customer Meters – Usage Report
Usage Notices HelpHome My Account
Welcome, ChrisLog Out
Report Request Status (3rd Party)
Customer Meters (ROR)
Customer Meters (3rd Party)
Report Request Status (ROR)
Business Requirement
Add Generation Data to the SMT Portal View
Option 2:
Usage Graph and Usage TableIncludes both Consumption andGeneration usage data
By default, the 15-Minute Daily Usage graph will display both Consumption and Generation Usage data.
– Consumption Usage Data is represented by blue graph
– Generation Usage Data is represented by orange graph

© 2012 IBM Corporation
3rd Party Registration &Account Management3rd Party Registration &Account Management
16
AMWG CR 2014-018 – Add Generation Data to the SMT Portal View
Print Export Report in CSV < Previous Day Next Day >
Option 2
Two additional columns – Usage (kWh) for Generation and Act / Est for Generation will be added in the Usage Table
Two new columns for Generation Usage Data

© 2012 IBM Corporation
3rd Party Registration &Account Management3rd Party Registration &Account Management
17
AMWG CR 2014-018 – Add Generation Data to the SMT Portal View
Functional Rules – Ad hoc Usage Report
•The addition of Generation usage data is applicable to ALL entity types – TDSP, REP, Third Party, Business and Residential Customers.
•The changes impact UI only
•Option 1 - The default Usage Data display is Consumption for the Usage Graph and the Usage Table (Usage kWh and Actual / Estimated columns)
•Option 2 - If Generation Usage radio button is selected, the Usage Graph and the Usage Table (Usage kWh and Actual/Estimated columns) will be displayed for Generation usage data.

© 2012 IBM Corporation
3rd Party Registration &Account Management3rd Party Registration &Account Management
18
AMWG CR 2014-018 – Add Generation Data to the SMT Portal View
Business Scenarios / Issues
•If ESIID does not have generation data, how should it be displayed in the Usage Graph?
•If ESIID does not have generation data, how should it be displayed in the Usage Table?
•Analyze whether Zero or N/A should be used to display no generation data.

© 2012 IBM Corporation
3rd Party Registration &Account Management3rd Party Registration &Account Management
19 19
AMWG CR 2013-014Allow SMT to Toggle between 15 Minute and Daily Meter Read Reports without having to
reset the Date Range

© 2012 IBM Corporation
3rd Party Registration &Account Management3rd Party Registration &Account Management
AMWG CR 2013-014 – Toggle Between 15 Minute and Daily Meter Read Report
20
Address: 123 Demo Drive, ESI ID: 88888880000000001 Anytown, TX. Meter Multiplier: 1
Usage / Customer Meters Search (3rd Party) / Customer Meters – Usage Report
Customer Meters – Usage Report
Usage Notices HelpHome My Account
Welcome, ChrisLog Out
Report Request Status (3rd Party)
Customer Meters (ROR)
Customer Meters (3rd Party)
Report Request Status (ROR)
Business Requirements
Allow SMT to toggle between 15 Minute and Daily Usage Reports without having to reset the Date Range
Illustration of Proposed Production Logic
Report Type: 15 Minute IntervalStart Date: 12/01/2014End Date: 01/04/2015
The corresponding Usage Graph for the first day in the date range will be displayed. This is existing logic and will not be changed.
The start date and end dates for Report Type 15 Minute Interval are set by the user.
The first day in the date range, 12/01/2014 will be displayed in the screen.

© 2012 IBM Corporation
3rd Party Registration &Account Management3rd Party Registration &Account Management
AMWG CR 2013-014 – Toggle Between 15 Minute and Daily Meter Read Report
21
Address: 123 Demo Drive, ESI ID: 88888880000000001 Anytown, TX. Meter Multiplier: 1
Usage / Customer Meters Search (3rd Party) / Customer Meters – Usage Report
Customer Meters – Usage Report
Usage Notices HelpHome My Account
Welcome, ChrisLog Out
Report Request Status (3rd Party)
Customer Meters (ROR)
Customer Meters (3rd Party)
Report Request Status (ROR)
The start date and end dates for Daily Meter Reads are not reset. They retain the original dates entered initially for Report Type 15 Minute Interval.
If the user changes the report type to Daily Meter Read, the original date range that was entered by the user will be retained. The Daily Meter Read will display the data from 12/01/2014 to 01/04/2015.
If the user switches back to 15 Minute Interval Report, the date range is retained.
The toggle capability is applicable to all entity types – TDSP, REP, Third Party, Business Customer and Residential Customer.

© 2012 IBM Corporation
3rd Party Registration &Account Management3rd Party Registration &Account Management
22 22
AMWG CR 2013-008Average Time to Deliver HAN Messages

© 2012 IBM Corporation
3rd Party Registration &Account Management3rd Party Registration &Account Management
AMWG CR 2013-008 –Reports for AMWG Data Monitoring – Average Time to Deliver HAN Messages
Smart Meter Texas - Data Monitoring Report SMT Average Time to Deliver HAN Messages by TDSP Monthly Report
Feb 2015 AEP (Central) AEP (North) CenterPoint Oncor TNMP
Simple Text Avg Time xxxx.xx xxxx.xx xxxx.xx xxxx.xx xxxx.xx # of Messages xxxx xxxx xxxx xxxx xxxx Cancel Simple Text Avg Time xxxx.xx xxxx.xx xxxx.xx xxxx.xx xxxx.xx # of Messages xxxx xxxx xxxx xxxx xxxx Load Control Event Avg Time xxxx.xx xxxx.xx xxxx.xx xxxx.xx xxxx.xx # of Messages xxxx xxxx xxxx xxxx xxxx Cancel Load Control Event Avg Time xxxx.xx xxxx.xx xxxx.xx xxxx.xx xxxx.xx # of Messages xxxx xxxx xxxx xxxx xxxx Cancel All Load Control Events Avg Time xxxx.xx xxxx.xx xxxx.xx xxxx.xx xxxx.xx # of Messages xxxx xxxx xxxx xxxx xxxx Price Signal Avg Time xxxx.xx xxxx.xx xxxx.xx xxxx.xx xxxx.xx # of Messages xxxx xxxx xxxx xxxx xxxx Utility Enrollment Group Avg Time xxxx.xx xxxx.xx xxxx.xx xxxx.xx xxxx.xx # of Messages xxxx xxxx xxxx xxxx xxxx
All TDSPs xxxx xxxx.xx xxxx.xx xxxx.xx xxxx.xx xxxx.xx
New Monthly Report to display the average time to deliver In-Home Device Messages i.e. when the request is submitted in SMT and the time when the TDSP acknowledges the request.
Total Number of In-Home Device Messages for the month
Average of all Messaging Delivery per TDSP
23

© 2012 IBM Corporation
3rd Party Registration &Account Management3rd Party Registration &Account Management
24
AMWG CR 2013-008 –Reports for AMWG Data Monitoring – Average Time to Deliver HAN Messages
Report Logic – Average Time to Deliver HAN Messages
•Frequency - Monthly
•Report Delivery – CSV (Alternate – HTML)
•Average Time is calculated by the following logic:• For each messaging type that was processed the previous month, calculate the delivery time for HAN message (TDSP Response Time –
SMT Submission Time). Add all delivery times divided by the total number of messages to get the Average Time.

© 2012 IBM Corporation
3rd Party Registration &Account Management3rd Party Registration &Account Management
25
AMWG CR 2013-011Average Time
from Provision Request to Meter Ready

© 2012 IBM Corporation
3rd Party Registration &Account Management3rd Party Registration &Account Management
AMWG CR 2013-011 –Reports for AMWG Data Monitoring – Average Time from HAN Provision Request to Meter Ready Status
Smart Meter Texas - Data Monitoring Report SMT Average Time from In-Home Device Provision Request to Meter Ready Monthly Report
Feb 2015 Number of AEP (Central) AEP (North) CenterPoint Oncor TNMP Requests Avg Time Avg Time Avg Time Avg Time Avg Time
In-Home Device Provision Successful xxxx.xx xxxx.xx xxxx.xx xxxx.xx xxxx.xx # of Successful Provision Requests xxxx xxxx.xx xxxx.xx xxxx.xx xxxx.xx xxxx.xx
In-Home Device Provision Unsuccessful xxxx (x.x%) xxxx (x.x%) xxxx (x.x%) xxxx (x.x%) xxxx (x.x%) xxxx (x.x%)
All TDSPs Total # of Requests xxxx.xx
New Monthly Report to display the average time that In-Home Devices successfully reached Meter Ready status.
Total Number of successful provisioning requests
Average Time for In-Home Device to change to Meter Ready status
Total Number of failed provisioning requests and percentage of failure
Number of failed provisioning requests and the corresponding percentage of failure
Sum of successful and unsuccessful provisioning requests
26

© 2012 IBM Corporation
3rd Party Registration &Account Management3rd Party Registration &Account Management
27
AMWG CR 2013-011 –Reports for AMWG Data Monitoring – Average Time from HAN Provision Request to Meter Ready Status
Report Logic – Average Time from In-Home Device Provision Request to Meter Ready Status
•Frequency - Monthly
•Report Delivery – CSV (Alternate – HTML)
•Average Time is calculated by the following logic:• For each provisioning request that was processed the previous month, calculate the Meter Ready time (Meter Ready time – Provision
Request Time). Add all Meter Ready time divided by the total number of provision requests to get the Average Time.
•Number of Unsuccessful Provisioning Requests = In-Home Device Status that never reached Meter Ready state
•If TDSP prefers to see only the data related to them, the report can be generated to display individual reports for each TDSP.
•The job that runs this report should be executed very early in the morning to minimize the number of provisioning requests initiated before report generation which have not had time to complete

© 2012 IBM Corporation
3rd Party Registration &Account Management3rd Party Registration &Account Management
28 28
AMWG CR 2013-001Data Completeness Measurement

© 2012 IBM Corporation
3rd Party Registration &Account Management3rd Party Registration &Account Management
AMWG CR 2013-001 - Report for AMWG Data Monitoring – Data Completeness Measurements
Smart Meter Texas - Data Monitoring Report SMT Data Monitoring – Data Completeness Measurements Monthly Report
Feb 2015 AEP (Central) ------------------------------------------------------------------------------------------------------------------------------------------ ESIIDs (Expected) ESIIDs (Received) % ESIID Data LSE Usage Register Read % LSE Data 2014-02-01 xxxxxxx xxxxxxx xx.xx% xxxxxxx xxxxxxx xx.xx% 2014-02-02 xxxxxxx xxxxxxx xx.xx% xxxxxxx xxxxxxx xx.xx% 2014-02-03 xxxxxxx xxxxxxx xx.xx% xxxxxxx xxxxxxx xx.xx% 2014-02-04 xxxxxxx xxxxxxx xx.xx% xxxxxxx xxxxxxx xx.xx% 2014-02-05 xxxxxxx xxxxxxx xx.xx% xxxxxxx xxxxxxx xx.xx% 2014-02-06 xxxxxxx xxxxxxx xx.xx% xxxxxxx xxxxxxx xx.xx% … 2014-02-26 xxxxxxx xxxxxxx xx.xx% xxxxxxx xxxxxxx xx.xx% 2014-02-27 xxxxxxx xxxxxxx xx.xx% xxxxxxx xxxxxxx xx.xx% 2014-02-28 xxxxxxx xxxxxxx xx.xx% xxxxxxx xxxxxxx xx.xx%
Monthly Average xxxxxxx xxxxxxx xx.xx% xxxxxxx xxxxxxx xx.xx%
New Monthly Report to measure data completeness for given consumption day
ESIID completion – expected vs actual
LSE consumption and Daily Register Reads completion
Based on numbers from Previous Day
Today
TodayBased on numbers from Previous Day29
Anomaly2014-02-01 Delay in receiving file from AEP 2014-02-08 SMT gateway outage
Reason for anomaly (upto 30)

© 2012 IBM Corporation
3rd Party Registration &Account Management3rd Party Registration &Account Management
30
AMWG CR 2013-001 - Report for AMWG Data Monitoring – Data Completeness Measurements
Report Logic – Data Completeness Measurements
•Frequency - Monthly
•Report Delivery – CSV (Alternate – HTML)
•The sample report format illustrates the layout for AEP (Central). 5 sets of report layout will be presented, one for each TDSP.
•Anomaly – Manually entered text
Data Completeness - ESIIDs
•ESIID Data Completeness is measured using the following:• Expected Number of ESIIDs = total count of unique, active ESIIDs in SMT for prior day’s consumption• Actual Number of ESIIDs = total count of unique, active ESIIDs in SMT for today’s consumption• ESIID Data Completeness Ratio = Expected Number of ESIIDs / Actual Number of ESIIDs Received
• Example – On Feb 14, there are 7 million unique, active ESIIDs in SMT. The next day, Feb 15, there are 6.9 million ESIIDs for which consumption usage data are received. The ESIID Data Completeness Ratio for Feb 15 is 98.57% (6.9M / 7M).
• Active ESIID is defined by ESIID that have an active REP-of-Record in SMT• Consumption Usage data received can be actual or estimate. There is no need to distinguish between the two for this report metric.

© 2012 IBM Corporation
3rd Party Registration &Account Management3rd Party Registration &Account Management
31
AMWG CR 2013-001 - Report for AMWG Data Monitoring – Data Completeness Measurements
Data Completeness – LSE / Register Reads
•LSE / Register Reads Data Completeness is measured using the following:• Expected Number of ESIIDs (LSE count) = total count of unique, active ESIIDs in SMT for prior day’s consumption• Actual Number of ESIIDs (Register Reads) = total count of unique, active ESIIDs in SMT for today’s consumption for which daily register
reads are received• LSE / Register Read Data Completeness Ratio = LSE Count / Register Reads
• Example would be End Reads received on 4/11 for 4/10 usage

© 2012 IBM Corporation
3rd Party Registration &Account Management3rd Party Registration &Account Management
32 32
AMWG CR 2013-003Measurement of Percentage of
Actual Meter Reads

© 2012 IBM Corporation
3rd Party Registration &Account Management3rd Party Registration &Account Management
33
AMWG CR 2013-003 - Reports for AMWG Data Monitoring – Measurement of Percentage of Actual Meter Reads
Smart Meter Texas - Data Monitoring Report SMT Data Monitoring – Percentage of Actual Meter Reads Monthly Report
Feb 2015 AEP (Central) ------------------------------------------------------------------------------------------------------------------------------------------ # Intervals # Actual Intervals % Actuals Received Received
2014-02-01 xxxxxxx xxxxxxx xx.xx% 2014-02-02 xxxxxxx xxxxxxx xx.xx% 2014-02-03 xxxxxxx xxxxxxx xx.xx% 2014-02-04 xxxxxxx xxxxxxx xx.xx% 2014-02-05 xxxxxxx xxxxxxx xx.xx% 2014-02-06 xxxxxxx xxxxxxx xx.xx% … … 2014-02-26 xxxxxxx xxxxxxx xx.xx% 2014-02-27 xxxxxxx xxxxxxx xx.xx% 2014-02-28 xxxxxxx xxxxxxx xx.xx%
Monthly Average xxxxxxx xxxxxxx xx.xx%
New Monthly Report to measure the percentage of Actual Intervals Received
Based on numbers from Previous Day
Based on numbers from Previous Day

© 2012 IBM Corporation
3rd Party Registration &Account Management3rd Party Registration &Account Management
34
AMWG CR 2013-003 - Reports for AMWG Data Monitoring – Measurement of Percentage of Actual Meter Reads
Report Logic – Data Completeness Measurements
•Frequency - Monthly
•Report Delivery – CSV (Alternate – HTML)
•The sample report format illustrates the layout for AEP (Central). 5 sets of report layout will be presented, one for each TDSP.
Measurement of Percentage of Actual Meter Reads
•Percentage of Actual Meter Reads is measured using the following:• Total Number of Intervals loaded = total number of intervals (actual and estimate) received the previous day• Total Number of Actual Intervals loaded = total number of actual intervals
• Percentage of Actual Meter Reads = # of Actuals / # Total Intervals
• To illustrate, on Feb 14, there are 20 million Intervals received for yesterday’s (Feb 13 consumption data) – 18 million Actuals and 2 million Estimates
• The percentage of actual meter reads displayed for Feb 14 (representing Feb 13 data) is 90% (18 million actuals / 20 million total intervals).

© 2012 IBM Corporation
3rd Party Registration &Account Management3rd Party Registration &Account Management
35 35
AMWG CR 2013-004Measurement of Percentage of
Estimated Meter Reads

© 2012 IBM Corporation
3rd Party Registration &Account Management3rd Party Registration &Account Management
36
AMWG CR 2013-004 - Reports for AMWG Data Monitoring – Measurement of Estimates
Smart Meter Texas - Data Monitoring Report SMT Data Monitoring – Percentage of Estimate Meter Reads Monthly Report
Feb 2015 AEP (Central) ------------------------------------------------------------------------------------------------------------------------------------------ # ESIIDs % # ESIIDs % # ESIIDs % # ESIIDs % 1-24 Est 1-24 Est 24-95 Est 24-95 Est All Est All Est Total Total
2014-02-01 xxxxxxx xx.xx% xxxxxxx xx.xx% xxxxxxx xx.xx% xxxxxxx xx.xx% 2014-02-02 xxxxxxx xx.xx% xxxxxxx xx.xx% xxxxxxx xx.xx% xxxxxxx xx.xx% 2014-02-03 xxxxxxx xx.xx% xxxxxxx xx.xx% xxxxxxx xx.xx% xxxxxxx xx.xx% 2014-02-04 xxxxxxx xx.xx% xxxxxxx xx.xx% xxxxxxx xx.xx% xxxxxxx xx.xx% 2014-02-05 xxxxxxx xx.xx% xxxxxxx xx.xx% xxxxxxx xx.xx% xxxxxxx xx.xx% 2014-02-06 xxxxxxx xx.xx% xxxxxxx xx.xx% xxxxxxx xx.xx% xxxxxxx xx.xx% … … 2014-02-26 xxxxxxx xx.xx% xxxxxxx xx.xx% xxxxxxx xx.xx% xxxxxxx xx.xx% 2014-02-27 xxxxxxx xx.xx% xxxxxxx xx.xx% xxxxxxx xx.xx% xxxxxxx xx.xx% 2014-02-28 xxxxxxx xx.xx% xxxxxxx xx.xx% xxxxxxx xx.xx% xxxxxxx xx.xx%
Monthly Average xxxxxxx xx.xx% xxxxxxx xx.xx% xxxxxxx xx.xx% xxxxxxx xx.xx%
New Monthly Report to measure the percentage of Estimate Reads
Based on numbers from Previous Day

© 2012 IBM Corporation
3rd Party Registration &Account Management3rd Party Registration &Account Management
37
AMWG CR 2013-004 - Reports for AMWG Data Monitoring – Measurement of Estimates
Report Logic – Data Completeness Measurements
•Frequency - Monthly
•Report Delivery – CSV (Alternate – HTML)
•The sample report format illustrates the layout for AEP (Central). 5 sets of report layout will be presented, one for each TDSP.
Measurement of Percentage of Actual Meter Reads
•Estimates (1-24) – Number of ESIIDs for which there was an estimated interval present for 1 to 24 intervals for a given day (not necessarily consecutive intervals)
•Estimates (24-95) – Number of ESIIDs for which there was more than 24 intervals for a given day (not necessarily consecutive intervals)
•Estimates (All) – Number of ESIIDs that had all intervals estimated for a given day
•Calculations would be done for intervals received today for consumptions received yesterday

© 2012 IBM Corporation
3rd Party Registration &Account Management3rd Party Registration &Account Management
38 38
AMWG CR 2013-010Number of Reports Requested via Portal and
Number of FTP Access

© 2012 IBM Corporation
3rd Party Registration &Account Management3rd Party Registration &Account Management
39
AMWG CR 2013-010 - Reports for AMWG Data Monitoring – Number of Reports Requested by GUI (Portal) and Number of FTPS Accesses
Smart Meter Texas - Data Monitoring Report SMT Data Monitoring – Portal Access Monthly Report
Feb 2015 TDSP REP Third Party Customer (Bus) Customer (Res)
Portal Logins xxxxxxx xxxxxxx xxxxxxx xxxxxxx xxxxxxx
Ad hoc Usage – 15 Min Interval xxxxxxx xxxxxxx xxxxxxx xxxxxxx xxxxxxx Ad hoc Usage – Daily Meter Reads xxxxxxx xxxxxxx xxxxxxx xxxxxxx xxxxxxx Ad hoc Usage – Monthly Billed Usage xxxxxxx xxxxxxx xxxxxxx xxxxxxx xxxxxxx Green Button xxxxxxx xxxxxxx xxxxxxx xxxxxxx xxxxxxx On-Demand Read xxxxxxx xxxxxxx xxxxxxx xxxxxxx xxxxxxx
Monthly Total xxxxxxx xxxxxxx xxxxxxx xxxxxxx xxxxxxx
New Monthly Report to display Portal Monthly access of usage and login metrics

© 2012 IBM Corporation
3rd Party Registration &Account Management3rd Party Registration &Account Management
40
AMWG CR 2013-010 - Reports for AMWG Data Monitoring – Number of Reports Requested by GUI (Portal) and Number of FTPS Accesses
Smart Meter Texas - Data Monitoring Report SMT Data Monitoring – FTP Access Monthly Report
Feb 2015 # DUNS Access # ESIID Access
2014-02-01 xxxxxxx xxxxxxx 2014-02-02 xxxxxxx xxxxxxx 2014-02-03 xxxxxxx xxxxxxx 2014-02-04 xxxxxxx xxxxxxx 2014-02-05 2014-02-06 xxxxxxx xxxxxxx … … 2014-02-26 xxxxxxx xxxxxxx 2014-02-27 xxxxxxx xxxxxxx 2014-02-28 xxxxxxx xxxxxxx
Monthly Total xxxxxxx
New Monthly Report to measure the percentage of Estimate Reads
Number of unique DUNS that access the FTP per day
Total Number of ESIIDs those DUNS are associated with

© 2012 IBM Corporation
3rd Party Registration &Account Management3rd Party Registration &Account Management
41
AMWG CR 2013-010 - Reports for AMWG Data Monitoring – Number of Reports Requested by GUI (Portal) and Number of FTPS Accesses
Portal Access
•Frequency - Monthly
•Report Delivery – CSV (Alternate – HTML)
•Number of usage downloads by user type
•Number of Green Button report downloads
•Number of On Demand Reads
•Number of Monthly logins by user type
FTP Access
•Frequency - Monthly
•Report Delivery – CSV (Alternate – HTML)
•Number of unique DUNS that access the FTP per day
•Total Number of ESIIDs those DUNS are associated with

© 2012 IBM Corporation
3rd Party Registration &Account Management3rd Party Registration &Account Management
Rough Order Of Magnitude (ROM) Effort Classification
• These are rough order of magnitudes and do not include project ramp-up and testing effort (SIT & UAT) and only assumes unit testing.
• Actual estimates could vary significantly depending on requirements.• Ramp-up and testing would be 20 to 40% of the overall effort • Overall project cost will vary based on efficiency gains from packaging like functionality
Change Type ROM
MINOR 0 – 20 K
SMALL 20 – 40 K
MEDUIM 40 – 60 K
HIGH 60 – 120 K
VERY HIGH Over 120 K

© 2012 IBM Corporation
3rd Party Registration &Account Management3rd Party Registration &Account Management
ROM for CRs
CR # Description Other Changes ROM
AMWG CR 2013-015 Usage Graph to show 35 days
UI & table Medium
include change in export & print High
include version reports High
AMWG CR 2014-018 Generation Data SMT Portal View
UI & table - option1 Medium
UI & table - option2 Medium
include daily report High
include daily & monthly report High
AMWG CR 2013-008 Average Time to Deliver HAN Messages Small
AMWG CR 2013-011 Average Time from HAN Provision Request Small
AMWG CR 2013-001 Data Completeness Measurements Small
AMWG CR 2013-003 Measurement of % of Actual Meter Reads Small
AMWG CR 2013-004 Measurement of Estimates Medium
AMWG CR 2013-010 No. requested by GUI, FTPS Medium